Embed Size (px)
Citation preview

University of Central Florida University of Central Florida
STARS STARS
Electronic Theses and Dissertations
2016
Ready or not, here comes college: A comparative correlation Ready or not, here comes college: A comparative correlation
study of college readiness in Black and Hispanic students who study of college readiness in Black and Hispanic students who
take advanced level classes. take advanced level classes.
Nigel Pillay University of Central Florida
Part of the Education Commons
Find similar works at: https://stars.library.ucf.edu/etd
University of Central Florida Libraries http://library.ucf.edu
This Doctoral Dissertation (Open Access) is brought to you for free and open access by STARS. It has been accepted
for inclusion in Electronic Theses and Dissertations by an authorized administrator of STARS. For more information,
please contact [email protected].
STARS Citation STARS Citation Pillay, Nigel, "Ready or not, here comes college: A comparative correlation study of college readiness in Black and Hispanic students who take advanced level classes." (2016). Electronic Theses and Dissertations. 5241. https://stars.library.ucf.edu/etd/5241

READY OR NOT, HERE COMES COLLEGE: A COMPARATIVE CORRELATION
STUDY OF COLLEGE READINESS IN BLACK AND HISPANIC STUDENTS
WHO TAKE ADVANCED LEVEL CLASSES.
by
NIGEL DAVID PILLAY
B.S. University of Central Florida, 2001
M.S. NOVA Southeastern University, 2005
A dissertation submitted in partial fulfillment of the requirements
for the degree of Doctor of Education
in the College of Education and Human Performance
at the University of Central Florida
Orlando, Florida
Fall Term
2016
Major Professor: Martha Lue-Stewart

ii
© 2016 Nigel D. Pillay

iii
ABSTRACT
The purpose of this study was to investigate how participation in advanced level courses
impacts college readiness in students of color, specifically Black and Hispanic students.
High school students have a variety of advanced level classes to choose from, including
but not limited to: Advanced Placement (AP), International Baccalaureate (IB), Dual
Enrollment (DE), Advanced International Certificate of Education (AICE) and
Advancement via Individual Determination (AVID) classes. These types of advanced
classes not only prepare students for college but also allow them to earn college credit
through participation in courses of college level rigor while still in high school. However,
the number of students of color enrolled in advanced level classes has historically been
substantially lower than that of their White counterparts (Kerr, 2014). Special incentives,
grants, and funding have been put in place both at the state and federal levels to increase
the number of students of color participating in these advanced classes. AVID is
specifically designed to help increase college readiness for the most underrepresented
student groups. In the past, the federal government, state policymakers, and companies
such as College Board have started programs geared toward increasing AP and IB
offerings for disadvantaged students and the number of students who take these courses
(Iatarola, Conger, & Long, 2011). As a result of this effort, there has been a rise in
participation in AP programs across the country with respect to Black and Hispanic
students. This study was conducted to investigate how these advanced level courses
impacted the level of college readiness among students of color in the fastest growing
school district in Northeast Florida. The researcher aimed to determine if there was a

iv
difference in college readiness between students of color who take advanced level classes
as opposed to those who do not. The principle purpose of this study was to examine the
relationship between Black and Hispanic high school student participation in advanced
academics and their college readiness.

v
The following research is dedicated to my family for all of the sacrifices and support that
you have knowingly and unknowingly given to me. As I have pursued my advanced
degree, I have been able to maintain my desire to see this through to completion because
of you.
To my children, Mariyah Celeste, Nyobi Devindra, Anakin Soopayah, Nigel
David Junior, and Chael Blaze, I love you with all my being; you all bring me so much
pride and joy in your own unique ways. Mariyah, I learned to be a man and a father with
you by my side. Nyobi, you allowed me to know that I could love more than one child
with the same amount of fervor. Anakin, you brought to me the pride of being the father
of a son; I will always remember the day. Nigel, well, I never knew what it was like to
see myself in action until I met you. Chael, you are my little prince and I am so glad to be
your father. In time, I hope you all grow to be as proud of me as I am of you. Please
know that as long as I have a breath I will always be here to support and guide you
through life. May you always be happy, go far in life, and be patient and accepting of all
those you encounter.
Ma and Dad, you are the truest example of what it means to be a parent. Your
unconditional love, self-sacrifice, patience, and unwavering belief in me have always
kept my spirits up. It is because of you that I maintained belief in myself. To my brothers,
Richard and Damien, even though I may be the tallest, I still to this day look up to the
both of you. Thanks for being the big brothers of such a crazy young man; I hope I make
you guys proud. To all of you, I love you, and thank you…

vi
ACKNOWLEDGMENTS
It is with the most sincere gratitude that I express my appreciation and
thankfulness to the following people. To my Chairperson, Dr. Martha Lue-Stewart, it has
been 8+ years since I first walked into one of your classes and met the most patient and
understanding educator I have and ever will meet. Thank you for never giving up on me.
To my committee members, Dr. Martha Lue-Stewart, Dr. Rosemarye Taylor, Dr. Cynthia
Hutchinson, and Dr. Mary Little, thank you for coming together, working with me and
providing me with the guidance and insight necessary to complete my advanced degree.
Thank you, Laura Wilcox-Curll and Leah Mitchell, for guiding me through this process,
you gave me advice and helped me even when it was not your place to do so, and for that
I am truly thankful. To my colleague, Anne-Marie Raynor, thank you for helping me get
my dissertation to a presentable condition.
Michele, aka Mich, you have silently supported me and allowed me to chase a
dream that so few catch, I now see that in the process you put your dreams on hold. I
cannot ever repay you for this but I hope in time that I can offer you support in chasing
your dreams. Thank you.
Alexandra, you have been a true guide and support for me. Truly, I can say that
without you this would not have happened. Thanks for pushing me and reigniting my
passion for education and my degree. There are many late nights that you shared with me
from a distance to proofread and make sure that I was on track. Thank you for being so
patient and understanding and for continuing to believe…

vii
TABLE OF CONTENTS
LIST OF FIGURES ........................................................................................................... ix
LIST OF TABLES .............................................................................................................. x
CHAPTER 1 INTRODUCTION ........................................................................................ 1
Background ............................................................................................................. 1 Statement of the Problem ........................................................................................ 3 Purpose of the Study ............................................................................................... 4 Theoretical Framework ........................................................................................... 5 Research Questions ................................................................................................. 6
Significance and Need for the Study ...................................................................... 6
Assumptions ............................................................................................................ 7 Limitations .............................................................................................................. 7
Definition of Key Terms ......................................................................................... 8 Organization of the Study ..................................................................................... 11
CHAPTER 2 REVIEW OF LITERATURE ..................................................................... 12
Introduction ........................................................................................................... 12 Background on Educational Opportunities ........................................................... 13
Culture and Education........................................................................................... 17 Culture and Expectations ...................................................................................... 18 Background on Advanced Academics in High School (AP, IB, DE, AICE, AVID)
............................................................................................................................... 19
Advanced Placement (AP) ........................................................................ 19 International Baccalaureate (IB) ............................................................... 22 Dual Enrollment (DE) ............................................................................... 24
Advanced International Certification of Education (AICE) ..................... 26 Advancement via Individual Determination (AVID) ............................... 28
Standardized Test Scores ...................................................................................... 29 Graduation and College Readiness ....................................................................... 34
Summary ............................................................................................................... 36
CHAPTER 3 METHODOLOGY ..................................................................................... 38 Purpose of the Study ............................................................................................. 38 Research Design.................................................................................................... 38 Research Questions ............................................................................................... 39
Research Hypotheses ............................................................................................ 39 Sample................................................................................................................... 40
District Demographics .............................................................................. 40 Procedures for Data Collection ............................................................................. 41
Academic Programs .................................................................................. 42 Standardized Tests .................................................................................... 42
Participants ............................................................................................................ 43 Data Analysis ........................................................................................................ 44

viii
Assumptions and Limitations ............................................................................... 45 Ethical Considerations .......................................................................................... 46
CHAPTER 4 RESEARCH FINDINGS ............................................................................ 47 Introduction ........................................................................................................... 47
Overview of Analysis of Data............................................................................... 48 Chi-square Test for Independence ............................................................ 48 Pearson Correlation ................................................................................... 49 Sample Profiles ......................................................................................... 50
Data Analysis ........................................................................................................ 54
ResearchQuestion 1 .................................................................................. 54
Research Question 2 ................................................................................. 58
Research Question 3 ................................................................................. 63 Additional Analyses .............................................................................................. 67
Additional Analysis: Hispanic Students ................................................... 68 Additional Analyses: White Students ...................................................... 71
Additional Analysis: All Subgroups ........................................................ 75 Summary ............................................................................................................... 78
CHAPTER 5 SUMMARY, DISCUSSION, AND CONCLUSIONS .............................. 79 Summary of the Study .......................................................................................... 79 Summary of Methodology .................................................................................... 80
Discussion of the Findings .................................................................................... 81 Research Question 1 ................................................................................. 81
Research Question 2 ................................................................................. 82 Research Question 3 ................................................................................. 82
Implications of the Study ...................................................................................... 83 Recommendations for Future Research ................................................................ 85
Conclusion ............................................................................................................ 86
APPENDIX INSTITUTIONAL REVIEW BOARD APPROVAL .................................. 88
REFERENCES ................................................................................................................. 90

ix
LIST OF FIGURES
Figure 1. Number of AP Examinations Taken by Year for Black Students ..................... 21
Figure 2. Subgroup College Ready Percentage by Program Level .................................. 77

x
LIST OF TABLES
Table 1 English College Readiness Among High School Students, by Race ..................... 2
Table 2 Math College Readiness Among High School Students, by Race ........................ 2
Table 3 Percentage of Grade 8 Students “On Target” on the ACT by race and subject .. 32
Table 4 Percentage of Grade 8 Students “Far Off Track” on the ACT by race and subject
........................................................................................................................................... 32
Table 5 Effect Size for Chi-square Test for Independence ............................................... 49
Table 6 Strength of Relationship for Pearson Correlation ................................................ 50
Table 7 Student Count by School ..................................................................................... 51
Table 8 Students by Race .................................................................................................. 52
Table 9 Total Number of Advanced Level Courses Taken by Student ............................ 53
Table 10 Advanced Programs by Type ............................................................................. 54
Table 11 Students of Color Total Count ........................................................................... 55
Table 12 Case Processing Summary (Chi-square Test for Independence) for Students of
Color ................................................................................................................................. 56
Table 13 Strength of Relationship for Pearson Correlation Advanced Courses: College
Ready Cross tabulation (Chi-square Test for Independence) for Students of Color ........ 56
Table 14 Chi-Square Tests for Students of Color ............................................................. 57
Table 15 Symmetric Measures (Chi-square Test for Independence) for Students of Color
........................................................................................................................................... 57
Table 16 Descriptive Statistics (Pearson Correlation) for Students of Color .................. 57
Table 17 Correlations for Students of Color ..................................................................... 58
Table 18 Black Student Total Count ................................................................................. 59
Table 19 Case Processing Summary (Chi-square Test for Independence) for Black
Students ............................................................................................................................. 59
Table 20 Advanced Courses College Ready Cross tabulation (Chi-square Test for
Independence) for Black Students .................................................................................... 60
Table 21 Chi-Square Tests for Black Students ................................................................. 61

xi
Table 22 Symmetric Measures (Chi-square Test for Independence) for Black Students 61
Table 23 Descriptive Statistics (Pearson Correlation) for Black Students ....................... 61
Table 24 Correlations for Black Students ......................................................................... 62
Table 25 Black Students Total Count ............................................................................... 64
Table 26 Case Processing Summary (Chi-square Test for Independence) for Black Male
Students ............................................................................................................................. 64
Table 27 Advanced Courses College Ready Cross tabulation (Chi-square Test for
Independence for Black/African-American Students ....................................................... 65
Table 28 Chi-square Tests for Black Students ................................................................. 66
Table 29 Symmetric Measures for Black Students ........................................................... 66
Table 30 Descriptive Statistics (Pearson Correlation) for Black Students ...................... 67
Table 31 Correlations for Black Students ......................................................................... 67
Table 32 Hispanic Students Total Count .......................................................................... 68
Table 33 Case Processing Summary (Chi-square Test for Independence) for Hispanic
Students ............................................................................................................................. 69
Table 34 Advanced Courses College Ready Cross tabulation (Chi-square Test for
Independence) for Hispanic Students ............................................................................... 69
Table 35 Chi-square Tests for Hispanic Students ............................................................. 70
Table 36 Symmetric Measures for Hispanic Students ...................................................... 70
Table 37 Descriptive Statistics (Pearson Correlation) for Hispanic Students ................. 71
Table 38 Correlations for Hispanic Students ................................................................... 71
Table 39 White Students Total Count ............................................................................... 72
Table 40 Case Processing Summary (Chi-square Test for Independence) for White
Students ............................................................................................................................. 72
Table 41 Advanced Courses* College Ready Cross tabulation (Chi-square Test for
Independence) for White Students .................................................................................... 73
Table 42 Chi-Square Tests for White Students................................................................. 74
Table 43 Symmetric Measures for White Students .......................................................... 74

xii
Table 44 Descriptive Statistics (Pearson Correlation) for White Students ...................... 75
Table 45 Correlations for White Students ........................................................................ 75
Table 46 Pearson Correlation Value by Subgroup .......................................................... 76
Table 47 Subgroup College Ready Percentage and Numbers by Program Level ............ 78

1
CHAPTER 1
INTRODUCTION
Background
In the last decade, the United States Department of Education (USDOE) increased
its focus on high school reform in an effort to create and align Kindergarten through 12th
grade (K-12) standards and college expectations (Roderick, Nagoaka, & Coca, 2009). In
2009, the ACT reported that more states were implementing standardized testing to
expand the number of students prepared for and with access to postsecondary education.
Moreover, in recent years, policymakers and educational leaders alike established
graduation requirements that ensured students would be ready for college or career
(Stetser & Stillwell, 2014).
In the state of Florida, the aforementioned has been referred to as college and
career readiness. For the 2014-2015 school year, the state of Florida had a graduation rate
of 77.8% (Florida Department of Education [FDOE], 2015a). According to the FDOE
(2015) website, 62.4% of those high school graduates were considered college and career
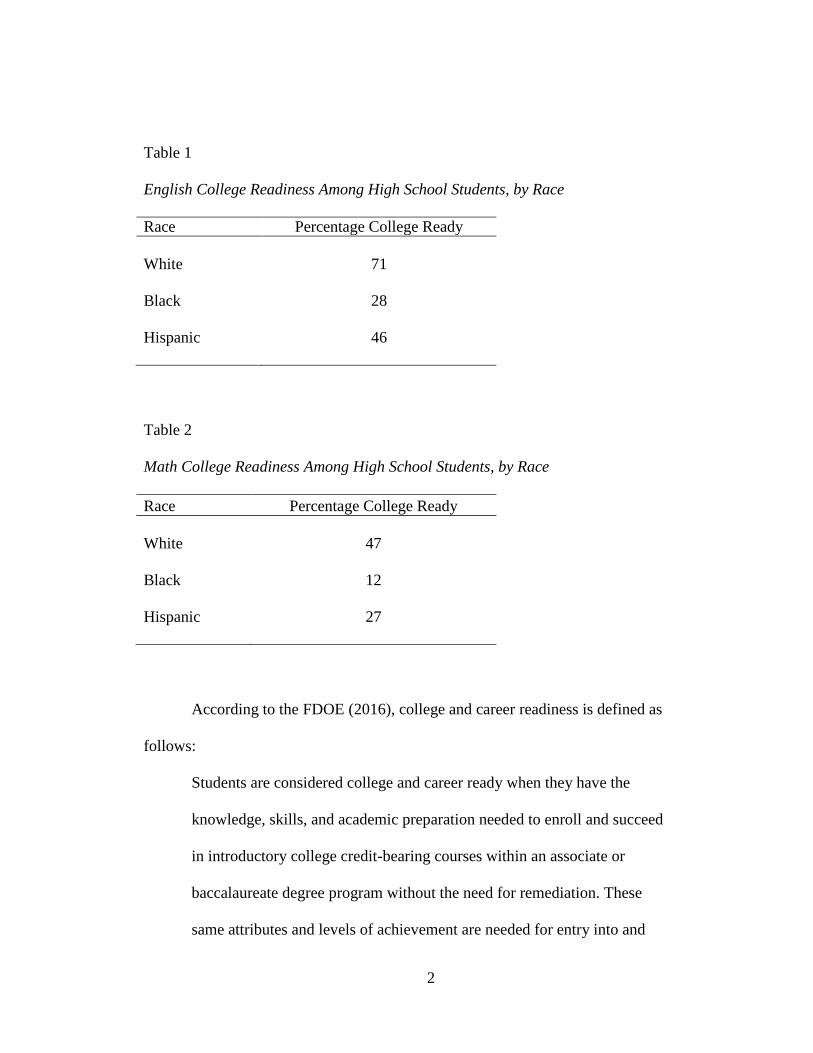
ready (2015). A 2014 report published by ACT found that in Florida, 71% of White
students were considered college ready in English, while 28% of Blacks and 46% of
Hispanics were considered college ready. The same report showed that 33% of all
students were college ready in mathematics, with 47% of White students, 12% of Blacks
and 27% of Hispanic students being college ready. These data are displayed in Tables 1
and 2
2
Table 1
English College Readiness Among High School Students, by Race
Race Percentage College Ready
White
71
Black 28
Hispanic 46
Table 2
Math College Readiness Among High School Students, by Race
Race Percentage College Ready
White
47
Black 12
Hispanic 27
According to the FDOE (2016), college and career readiness is defined as
follows:
Students are considered college and career ready when they have the
knowledge, skills, and academic preparation needed to enroll and succeed
in introductory college credit-bearing courses within an associate or
baccalaureate degree program without the need for remediation. These
same attributes and levels of achievement are needed for entry into and
3
success in postsecondary workforce education or directly into a job that
offers gainful employment and career advancement. To be considered
college and career ready, students must demonstrate mastery of the Florida
Postsecondary Readiness Competencies in English and Mathematics that
have been identified through a cross-sector collaborative effort by
Florida’s K12, college and university faculty. (para. 2)
The school district that was the primary focus of this study is located in Northeast
Florida. The school district consists of 36,593 students, of which approximately 11,270
were high school students at the time of the study (FDOE, 2016a). For the 2015 - 2016
school year, the school district’s high school graduation rate was 90.5%, and the state
average was 77.8%. Similarly, with 77.8% of students graduating college and career
ready, the district surpassed the state average of 62.4% (FDOE, 2016d).
Statement of the Problem
Every year the nation graduates 80% of its high school seniors. Further
examination of the data reveals that 86% of Whites, 69% of Blacks, and 73% of
Hispanics graduate (Stetser & Stillwell, 2014). The same report, published by NCES),
showed similar numbers across the state of Florida, with 75% of all students graduating,
of which 80% were White, 64% were Black, and 73% were Hispanic. The school district
in this study has been the top-rated school district in Florida for eight years, since the
2008-2009 school year (FDOE, 2016). Despite this, the achievement gap between many
of the subgroups has not closed; the subgroups that have been making progress have only

4
done so by a small percentage. White students have been graduating at a rate of 88% in
contrast to their Black counterparts’ rate of 69%.
As Roderick et al. (2009) noted,
Over the past several decades, high school students’ college aspirations have
increased markedly, and gaps in educational aspirations across race and ethnicity
and income have fallen dramatically. But significant, and in some cases widening,
gaps remain in college readiness, access, and success across these groups. (p. 185)
The aforementioned gap is due in part to the inequity of educational opportunity between
students of color and White students. In support of this, researchers who have tracked
students over time found that a major factor contributing to the underachievement of
Black students is underrepresentation in advanced level academics and
overrepresentation in remedial level courses (O’Connor, Mueller, L'Heureux Lewis,
Rivas-Drake, & Rosenberg, 2011). Without equal access to educational opportunity and
resources, students of color will continue to lag behind with respect to college readiness.
Contreras (2011) stated that limited access to curriculum represses the ability of students
who are already underserved, causing them to miss out on the chance to experience a
college-going atmosphere that can better prepare them for college. Measures must be put
in place so that all students can begin to have the same opportunity.
Purpose of the Study
The principle purpose of this study was to examine the relationship between high
school Black and Hispanic student participation in advanced academics and their college
readiness. The primary research question was: “What relationship, if any, exists between

5
students of color participating in advanced academic program (AP, IB, DE, AICE,
AVID) and their level of college readiness?” According to the ACT college readiness
standards that are based on high school performance and rigor of courses, Blacks,
Hispanics, and American Indians score much lower than their White peers, and this
suggests a lesser level of college preparation (Contreras, 2011). This study’s key purpose
was to build on the research that exists about the participation of students of color in
advanced programs and their college and career readiness by examining the course
history and standardized test results of high school students in a specific school district in
Northeast Florida.
Theoretical Framework
Access to and participation in advanced level academic programs, such as
Advanced Placement (AP), International Baccalaureate (IB), Dual Enrollment (DE),
Advanced International Certificate of Education (AICE) and Advancement via Individual
Determination (AVID) is one of the primary means to closing the achievement gap
between White students and students of color. As such, investigating the extent to which
participation in advanced level academics results in college readiness in students of color
is critical. Research exists detailing how advanced academics affect minority student
achievement, but more can be done with respect to how it affects minority student
preparedness as it relates to college readiness. Therefore, the researcher employed a
quantitative design to answer the research questions that follow.

6
Research Questions
The following quantitative research questions guided this study:
1. What relationship, if any, exists between the participation of students of color
in advanced academic programs (AP, IB, DE, AICE, AVID) and their college
readiness?
2. What relationship, if any, exists between Black students’ participation in
advanced academic programs (AP, IB, DE, AICE, AVID) and their college
readiness?
3. What relationship, if any, exists between Black male students’ participation in
advanced academic programs (AP, IB, DE, AICE, AVID) and their college
readiness?
Significance and Need for the Study
This study’s significance and need is built on the premise of adding additional
insight into the long-standing issue of achievement gap among students of different races
and ethnic backgrounds. More specifically, this study sought to determine to what extent
participation in advanced academic courses had an effect on the college and career
readiness of students of color. The review of the literature on educational opportunities,
the challenges of culture versus education, advanced academics in high school (AP, IB,
DE, AICE, AVID), standardized test scores, and graduation and college readiness are
discussed in Chapter 2. Outcomes and conclusions drawn from this study may further the
existing body of research in the areas of college and career readiness as it relates to
students of color. Additionally, findings may also provide awareness to the school district

7
studied in its efforts to better understand the effects of high school students of color who
participate in advanced academic courses, and how their participation correlates to
college and career readiness.
Assumptions
1. It was assumed that the college readiness criteria set forth by the state of
Florida was sufficient in that it prepares students for academic success at all
colleges and universities.
2. It was assumed that the overall quality of education with respect to school
facility, teacher quality, resources, and curriculum were the same or
adequately similar at all the schools.
3. It was assumed that by analyzing the data through a quantitative multiple
regression statistical test, the findings would show that students of color who
participated in at least two years of advanced academics in high school would
be college ready at a rate higher than students of color who did not participate.
Limitations
1. This study was limited to one school district located in northeast Florida.
2. This study was limited to the high schools located within the target school
district in Northeast Florida.
3. This study was limited to high school seniors who were categorized as Black
and Hispanic American students within the minority student population.

8
4. This study was limited in that the findings for the school district were not
generalizable because it did not provide a typical representation of diversity;
there was a low minority rate with more than 85% of students identified as
White and a poverty rate of less than 20%.
5. This study was limited to a convenience sample in that readily accessible data
were collected from one school district.
Definition of Key Terms
ACT: Formerly known as American College Testing, the company’s name was
shortened to ACT in 1996 to better represent its programs that go beyond a college
entrance test. ACT is a college readiness or college admissions and placement test taken
by high school students (ACT, 2016).
Advanced International Certificate of Education or AICE: AICE is an
international curriculum and examination program modeled on the British pre-college
curriculum (FDOE, 2011).
Advanced Level Academics: Students enrolled in Advanced Placement,
International Baccalaureate, Dual Enrollment, Advanced International Certificate of
Education, and/or Advancement via Individual Determination qualified for this study.
Advanced Placement or AP: The College Board’s Advanced Placement Program
is a program developed to enable willing and academically prepared students to pursue
college-level studies (College Board, 2016b).
Advancement Via Individual Determination or AVID: The AVID College
Readiness System works to ensure students are college ready by equipping them with the

9
skills, academic behaviors, and college knowledge necessary to succeed at every level
from elementary school to college (AVID, 2016). For this study, AVID was considered
as advanced level academics because a requirement of participating in AVID in the
district studied was to also enroll in an advanced level course in every core subject.
At-Risk: For the purposes of this study, the term at-risk refers to any students who
at the time they entered high school were not proficient in either FCAT 2.0 Reading or
FCAT 2.0 Mathematics.
College readiness: According to FDOE (2016a),
Students are considered college and career ready when they have the knowledge,
skills, and academic preparation needed to enroll and succeed in introductory
college credit-bearing courses within an associate or baccalaureate degree
program without the need for remediation. These same attributes and levels of
achievement are needed for entry into and success in postsecondary workforce
education or directly into a job that offers gainful employment and career
advancement. To be considered “college and career” ready, students must
demonstrate mastery of the Florida Postsecondary Readiness Competencies in
English and Mathematics that have been identified through a cross-sector
collaborative effort by Florida’s K12, college and university faculty. (para. 2)
Dual Enrollment or DE: A program in which students enroll part-time at a college
or university where they take classes that count toward high school graduation as well as
earn the student college credit at the same time (University of Central Florida, 2016).

10
Florida Comprehensive Assessment Test or FCAT 2.0: Measures student
achievement of the “Next Generation Sunshine State Standards” in reading, mathematics
and science (FDOE, 2016b).
Florida Standards Assessment or FSA: This assessment measures education gains
and progress of Florida students in English Language Arts (ELA), mathematics, and end-
of-course (EOC) subjects (Algebra 1, Algebra 2, and Geometry) (FDOE, 2016c).
International Baccalaureate or IB: The IB Diploma Program is a rigorous pre-
university course of study leading to internationally standardized tests. The program’s
comprehensive two-year curriculum allows its graduates to fulfill requirements of many
different nations’ education systems (FDOE, 2011).
Minority student: For the purposes of this study, a minority student will refer to
one who is either Black, a person having origins in any of the black racial groups in
Africa, or Hispanic American, a person of Spanish or Portuguese culture with origins in
Mexico, South or Central America, or the Caribbean Islands, regardless of race (Illinois
Student Assistance Commission, 2016).
Post-Secondary Education Readiness Test (PERT): Florida's customized common
placement test, with the purpose of determining accurate course placement based on a
student's skills and abilities. The PERT is administered to students in public high schools
and Florida College System institutions to determine readiness for college level courses
(FDOE, 2015b).

11
Scholastic Aptitude Test (SAT): The SAT is a globally accepted college
admission test created by The College Board that tests a student’s knowledge of reading,
writing, and math and how the knowledge is applied (College Board, 2016a).
Student of Color: To be determined a student of color, a student must be
designated as Black or Hispanic.
Organization of the Study
This chapter has provided a perspective for the study, presented the problem, and
outlined the research questions, significance, assumptions, limitations, and key terms of
the study. Chapter 2 synthesizes the existing literature as it relates to the problem within
the study. Chapter 3 details the methodology used to conduct the study, the population,
college readiness determination, data collection and analyses. Chapter 4 presents the
results and findings of the data analyses. Chapter 5 contains a discussion of the study,
conclusions, and further implications for research.

12
CHAPTER 2
REVIEW OF LITERATURE
Introduction
Chapter 2 is a review of the literature as it relates to this study. This literature
review offers a broad perspective of the existing research that focuses on minorities,
participation in advanced academics, college readiness, and their relation to one another.
The purpose of this causal comparative correlation study was to explore the
influence advanced level courses have on the college readiness of students of color. More
specifically, the researcher examined if enrollment in advanced level courses produced a
more college-ready student and if students of color who enrolled in advanced classes
were considered as college-ready as their White classmates.
The advanced level programs and courses that were considered in this study were
the Advanced Placement (AP), International Baccalaureate (IB), Dual Enrollment (DE),
Advanced International Certificate of Education (AICE) and Advancement via Individual
Determination (AVID) programs. Courses such as these are intended to provide students
with increased rigor, make the transition from high school to college smooth, and boost
college graduation rates (Estacion, Cotner, D’Souza, Smith, & Borman, 2012). This study
focused on the high school students in a fast-growing school district in Northeast Florida.
At the time of the study, the school district had seven high schools, all of which offered
students advanced level courses.
Most high school students in America express an interest in attending college.
However, there still exists a large gap in achievement by income and race (Pathways to
College Network, 2007). Historically, minorities have been underrepresented in advanced

13
level classes (Borland, 2004). Additionally, the transition for some students to college or
career can be challenging, particularly when they are not aware of what is required for
college level courses (FDOE, 2015a). Furthermore, students are at different levels of
readiness for college based on race and income status; the education system struggles to
prepare students of color and poor families for the next stage after high school (Presley &
Gong, 2005). The level of rigor that students receive in their high school classes has a
direct correlation to college success (Hallett & Venegas, 2011). Students who graduate
with better scores, grades, and advanced coursework have a greater probability of
entering and completing college than those who do not (Roderick et al., 2009).
This review of literature explores several themes in order to clearly demonstrate
the current performance of students of color in both advanced level courses and on
college readiness examinations, as well as to define what barriers may keep Black and
Hispanic students from enrolling in advanced level classes in the first place. Themes
include background on educational opportunities, culture versus education, culture versus
expectations, advanced academics in high school (AP, IB, DE, AICE, AVID),
standardized test scores, and graduation and college readiness.
Background on Educational Opportunities
From their first day of school, students of color fight for the opportunity to be
given the same academic possibilities as their White classmates. Black and Hispanic
students are consistently underrepresented in the top 10% of their classes, a trend that is
not only displayed in high school but is apparent as early as kindergarten (Olszewskie-
Kuilius & Clarenbach, 2012). This tendency can be related to the educational

14
opportunities provided to students of color versus those provided to their White
counterparts. Race can play a role in the amount of educational opportunities provided to
a student, as can parental education, family income, and school composition. According
to White & Tesfaye (2011),
Less than one-third of White and Asian public high school students attend a
school that [our] principals classify as ‘worse off’. Less than one-fourth of Black
and Hispanic high school students attend a school that [our] principals classify as
‘better off’. (p. 4)
Not only are students of color attending worse off schools, students of color are
also being assigned to lower quality teachers than their White classmates. Presley &
Gong (2005) reported that Black students are less likely to have access to high quality
teachers than their White counterparts in a study determining the Teacher Quality Index
(TQI) among Illinois high schools. The researchers found that 24% of Black students
statewide were attending schools that employed teachers that were in the lowest 10% of
the TQI in the state (Presley & Gong, 2005). There was also a relationship between
attendance rates of students of color and high poverty students and the ranking of a
school on the TQI: the higher the number of minority and high poverty students, the
lower the school was ranked. Furthermore, even the more affluent Black students were
more likely to attend a school ranked at the bottom of the TQI than their White
counterparts (Presley & Gong, 2005).
Not only have students of color been assigned to classes taught by lower quality
teachers, they have typically been offered fewer opportunities to participate in advanced

15
level academics. It begins with low expectations of students of color in comparison to the
expectations of their White fellow students. Students of color have often been pushed
toward more general education classes, but their White peers have been encouraged to
participate in advanced classes with a more rigorous curriculum (Pathways to College,
2007). If a student lives in a high poverty, low-income area, the chance of advanced level
classes being offered at their school decreases significantly. According to O’Connor et al.
(2011), there are a limited number of advanced classes offered at schools with high
minority populations and Blacks continue to be underrepresented in advanced and gifted
classes, even at schools that are predominantly White. This explains why as recently as
2003, Blacks only represented 8% and Latinos only 15% of all students enrolled in gifted
programs, but White students represented 74% (Contreras, 2011).
Although some may see that student attitude can be a limiting factor in types and
frequency of opportunities offered to a child, teacher attitude is also crucial in the amount
and type of educational opportunities offered to students. Kuman, Karabenick, &
Burgoon (2015) found that student characteristics, including race and socioeconomic
status, have an effect on a teacher’s attitude and expectations of students, and that it was
common for White teachers to stereotype students of color, especially Black students
from low-income families, believing that they are “lazy, loud and less intelligent” (p.
534) and are typically the source of classroom disruption. Teacher attitude also affects
how teachers assess and place their students. Glock, Krolak-Schwerdt, & Pit-ten Cate,
(2015), in a study of 64 teachers’ attitudes toward their students in relation to their
teaching practices regarding grading, tracking and placement, found that race and

16
ethnicity affected the decision these teachers made regarding their students of color.
Teachers were more likely to grade their students not based on the work they actually
completed, but based on how they expected the student to perform on the given
assignment. Furthermore, students of color were more likely to be incorrectly placed,
usually lower than where the students should have been. Students of color were more
likely to have their achievement tracked and analyzed than their White classmates (Glock
et al, 2015). By tracking students, teachers created a system where minorities continually
had their educational opportunities limited while also experiencing intensified racial and
social class differences between students of color and White students within the
classroom and school setting (Bernhardt, 2013).
Teacher attitude can also directly affect the learning environment and influence
the types of relationships and levels of respect between students of different race and
socio economic groups. Kuman et al. (2015) found that teachers who let racial beliefs
guide their instructional practice were less likely to create a healthy learning environment
for all students. This included downplaying the importance of mutual respect among
students. This not only negatively impacts the classroom environment but also limits the
relationships and trust the students of color build with both their teachers and their peers.
Not only does this type of classroom environment not foster personal development
between students, it also limits the cultural scope of curriculum. Kuman et al. (2015)
reported that this type of bias reduced the number of academic opportunities presented to
students, because teachers were less likely to make an effort to make the curriculum
enriching and relevant to students of all cultures.

17
Culture and Education
Researchers have studied the effects racial identity has had on Black students
(O’Connor et al., 2011). Sohn (2011) stated that the “fear of acting White” (p. 218),
prevents Black students from working hard in school and trying to be academically
successful. The author also contended that Black students who are academically
successful are often derided as “acting White.” Friends play a very big role with peers;
they are often used as a barometer for social acceptance (Cunningham, Corprew, &
Becker, 2009). As such, many Black students become unwilling to compromise their
identities, resulting in an opposition to school so as to not cross the cultural borders
accompanied by the pressure to “act Black” (O’Connor et al., 2011).
Black students often feel that academic success is in conflict with being Black and
that schooling is the White domain that forces Blacks to act White in order to be
academically successful (O’Connor, et al., 2011). This can especially be the case when
students of color are conflicted between behaviors attributed to their racial or ethnic
group and those believed to be necessary for achieving academic success (Chambers,
Huggins, Locke, & Fowler, 2014). The same authors also stated that historically, many
people have adopted the idea that Blacks, as a result of trying to be academically
successful, become estranged from their peers and lose the characteristics associated with
their race; rather, they speak properly, speak softly, are courteous, and never exhibit
spontaneous behaviors. This mindset can be challenging because it denies young
minorities a normal perspective of their own. In its place, they compare their experiences

18
of what should be normal to that which they observe in White children (Spencer, Noll,
Stoltzfus, & Harpalani, 2001).
Culture and Expectations
O’Connor et al. (2011) observed that Black students may not enter school with the
idea that being black conflicts with academic success; rather, they may be reacting to
how schools align race and achievement. Additionally, other factors such as teacher
expectations, types of courses, quality of teacher, and external pressures like work and
home-related issues may affect students’ performance (Presley & Gong, 2005).
Cunningham et al. (2009) added that children form and develop self-images and their
own expectations of themselves based not only on teachers but on parents and peers.
They also stated that past successes and challenges can be a factor in developing self-
image and personal expectations.
According to Gill and Reynolds (1999), teachers’ expectations can produce self-
fulfilling prophecies by evoking the level of achievement that is in line with what they
expect. Gill & Reynolds also claimed that there is evidence showing that teachers behave
differently with students depending on their expectations. For example, the teacher may
praise certain students less often and criticize them more; students may not be called on
as often to answer questions and may be given brief and less precise feedback. A
teacher’s failure to be aware of the differences in cultures and the many reasons why
students may not “get it” underscore the extensiveness of stereotypes (Spencer et al.,
2001).

19
The relationship between academic expectations and academic performance are
connected in that they both contribute to one another (Cunningham et al., 2009). As
children grow, they may develop notions about their own capabilities which may, in turn,
affect future school performance (Gill & Reynolds, 1999). Although a teacher’s
perception of a student may not be completely inaccurate, it may also not be a perfect
reflection of a student’s true effort (Wildhagen, 2012). Instilling values in students that
foster expectations of academic success and college may help students become more
engaged in their academics, especially when they are from urban areas (Cunningham et
al., 2009). Teachers, guidance counselors, parents, and stakeholders must believe that all
students can achieve academic success and that all must be college and career ready
(Pathways to College Network, 2007).
Background on Advanced Academics in High School (AP, IB, DE, AICE, AVID)
Advanced Placement (AP)
Advanced Placement (AP) classes were created by a group of prep school
teachers who recommended that high schools “recruit imaginative teachers and they
encourage seniors to engage in independent study and college-level work, and that
achievement exams be used to allow students to enter college with advanced standing”
(Byrd, 2007, p. 8). There is no prescribed curriculum or course material for AP classes
nor is there specific training for instructors. Instead, instructors develop their own
curriculum and syllabus and submit it to the College Board, the agency that oversees AP
courses, for approval (Barnard-Brak, McGaha-Garnett, & Burley, 2011). There are
currently 37 courses and examinations in which students may enroll. Students can take as

20
few or as many AP classes in high school as they wish. At the end of each course,
students take that course’s AP examination, which is scored on a scale of 1 – 5. A score
of 3 or higher will earn the student college credit (Barnard-Brak et al., 2011). As of 2013,
the number of students taking AP examinations had doubled to 28% of students at 12,705
high schools in the United States (McKillip, 2013). During the 1955-1956 school year,
1,229 seniors from 104 schools took 2,199 AP examinations with 130 college accepting
AP examinations for college credit. Although AP courses were originally intended for
high school seniors, the accessibility of AP courses to underclassmen increased, and this
increased enrollment in AP classes to 10-20% of the student body at high schools across
the United States. In 2006, 1.3 million students took 2.3 million AP examinations, which
was an increase of 105,066% from the 1950s (Kyburg, Hertzberg-Davis, & Callahan,
2007). Though it was previously thought the benefit of taking AP courses applied to only
those students who scored a 3 or higher on the AP examination, it has been found that
even students who score a 3 or less on AP examinations were twice as likely to graduate
from college in five years than students who had not taken AP courses (McKillip, 2013).
In response to the increase in enrollment in AP courses, the Federal Government
allocated $3 million in 1998 and $4 million in 1999 to increase minority participation in
AP courses and examinations (Kyburg et al., 2007). As a result, between 1999-2002,
minority student and low-income student participation increased by 77% and 100%
respectively, which was a greater increase than the 48% increase in total overall
participation for AP examinations during the same time period. Additionally, by 2006,
the number of AP examinations taken by African-Americans also increased 250%, from

21
34,514 examinations taken by Black students in 1997, to 120,674 examinations taken by
Black students in 2006 (Kyburg et al., 2007). These data are displayed in Figure 1.
Figure 1. Number of AP Examinations Taken by Year for Black Students
Advanced Placement classes have become a sign to students and parents of a
strong curriculum and course offerings that offer students the educational opportunity to
increase their knowledge and earn credit for college. However, students of color have
been the least likely students to enroll in these classes and those who do are the least
likely to take and pass the AP examination and earn college credit. Of the 133,047 Black
students who took an AP examination in 2008, only 25% earned a score of 3 or higher to
actually pass the examination (Contreras, 2011). Additionally, schools in low income and
high poverty areas have not offered as many AP courses as schools in high income, low

22
poverty areas, and this has limited the accessibility of these classes to students of color.
There has been a push to increase the number of AP courses offered in low income, high
poverty schools, in hopes that this will also improve the rate at which students of color
are accepted to higher ranked, more selective universities nationwide. However, the issue
that arises has been that the students enrolled in AP courses at low income, high poverty
schools have not been given the same caliber of course work as their counterparts which,
in turn, decreases their chances at scoring a passing grade on the AP examination and
earning college credit (Hallett & Venegas, 2011). An AP program of less rigor puts
students of color who do continue on to college at a continued disadvantage since they
also lack some of the knowledge that they are expected to have acquired during the
participation in the course (Hallett & Venegas, 2011). Thus, the issue has not only been
the limited number of students of color enrolled in AP courses but also the quality of the
program. According to Contreras (2011), though low income, high poverty schools have
begun to add AP classes and course offerings, it seems that this is just being done to
fulfill state and federal requirements and not so much to help students gain the knowledge
and college credits from enrollment in AP classes.
International Baccalaureate (IB)
The International Baccalaureate (IB) is a pre-university course of study in which
students may enroll during their last two years of high school (Hertzberg-Davis &
Callahan, 2007 Hill, 2012). The IB program’s mission statement states that the program

23
aims to develop inquiring, knowledgeable, and caring young people who create a
better and more peaceful world through intercultural understanding and respect.
To this end, the IB works with schools, governments, and international
organizations to develop challenging programs of international education and
rigorous assessment. These programs encourage students across the world to
become active, compassionate, and lifelong learners who understand that other
people, with their differences, can also be right (Hill, 2012, p. 343).
Developed in 1962, the IB program sought to achieve three main objectives:
(1) to provide an education that places emphasis on critical thinking skills,
(2) to promote intercultural understanding and provide students with an
international perspective, (3) to provide a diploma which would be
recognized for entry to high education around the world (Hill, 2012, p.
342).
The IB program requires students to study six subject areas: language,
individuals, & societies, mathematics and computer science, the arts, experimental
science, and a second language. It focuses less on reciting facts or stating opinions, and
instead on critical thinking required to support facts and opinions with sound supporting,
evidence-based arguments (Hill, 2012). Originally used in international schools as a way
for students to participate in a curriculum that would satisfy college entrance
requirements in their home countries, the IB program has shifted from being a program
solely offered at international schools to an international program for all schools (Hill,
2012). In 1999, there were 268 schools with IB programs in the United States. In 2009,
24
the United States had 1,090 schools with IB programs and of the 87,800 students enrolled
worldwide in IB programs, 49,100 were from the United States. Of all IB schools, 38%
are located in the United States; and Florida has the ninth largest block of IB schools
worldwide (Bunnell, 2011). Increased support by both state and the Federal Government
can be attributed to the growth in IB schools and programs in the United States. In 2003,
the U.S. Department of Education gave a $1.17 million grant to schools in Arizona,
Massachusetts, and New York to help increase the availability of IB program and schools
to low-income students. As of 2008, 92% of IB schools in the United States were public
schools (Bunnell, 2011).
Dual Enrollment (DE)
Dual Enrollment is a program where high school students can take college level
courses to earn college credit and satisfy high school and college graduation requirements
simultaneously (Wyatt, Patterson, DiGiacomo, 2015). Students are able to take classes at
their own high school, at a college campus, or online (Wyatt et al., 2015). Aside from
being able to earn college credit, dual enrollment programs also assist students in
successfully transitioning from high school to college by presenting what is expected of
them and what they will need to do to succeed in college while still in high school.
Additionally, dual enrollment programs have been shown to motivate students to
participate in more rigorous course work while in high school and have also been found
to increase college retention (Pretlow & Wathington, 2014).
During the 2002-2003 school year, 1.1 million high school students nationwide
were enrolled in dual enrollment programs. By the 2010-2011 school year, the number

25
doubled to two million high school students enrolled in dual enrollment programs (Ari,
2015). According to Pretlow and Wathington (2014), 46 states currently have dual
enrollment policies in place. Nationally, schools offer more dual enrollment programs
and courses than Advanced Placement (AP) or International Baccalaureate (IB) courses
(Bramucci, 2014). Students who enroll in dual enrollment courses do not affect
enrollment in AP or IB courses, as dual enrollment is a different type of program
(Bramucci, 2014). While AP and IB programs are those with universal courses offered
throughout the nation, dual enrollment does not have a nationwide model that is
implemented at all schools offering dual enrollment programs (Pretlow & Wathington,
2014). There are some dual enrollment programs in school districts that are targeted at
students who come from low-income families, are struggling academically, or are a
minority (Bramucci, 2014). For example, the Concurrent Course Initiative (CCI) is a
program that focuses on enrolling students from low-income backgrounds, students who
struggle academically, and students who belong to a demographic population that is
typically underrepresented in college. Of the students who participate in the CCI
program, 60% have been found to earn an A or B in their college course work and enroll
in four-year colleges and universities at a higher rate than their peers who did not
participate in CCI (Bramucci, 2014). Additionally, CCI students who do enroll in college
directly from high school earn 20% more credit after two years of college than their peers
(Bramucci, 2014).
Hoffman (2005) examined Dual Enrollment among minorities in the state of
Florida and reported that of Black students who enrolled in dual enrollment programs,

26
77% went on to attend college, whereas 45% of black students who did not participate in
dual enrollment programs attended college. Of Hispanic students, 69% who took Dual
Enrollment classes in high school attended college, whereas 54% of those who did not
take Dual Enrollment classes enrolled in college (Hoffman, 2005). However, Dual
Enrollment programs vary from state to state and even district to district, so there have
been very few studies that have provided evidence or even enrollment numbers for
minority students versus non-minority students (Pretlow & Wathington, 2014).
Advanced International Certification of Education (AICE)
Advanced International Certification of Education (AICE) programs are based on
Britain’s A & AS level examinations that are assessed by the University of Cambridge
(Blazer, 2011). The AICE curriculum emphasizes “higher level thinking, oral and writing
skills, problem solving, real world application, independent skills, teamwork and
international understanding” (Blazer, 2011, p. 9). AICE programs feature a four-year
high school curriculum which is comprised of prep level classes during 9th and 10th
grades, and participation in the AICE diploma program during the 11th and 12th grades
(Blazer, 2011).
In order for students to receive an AICE diploma, they must complete six full-
credit AICE courses and examinations. The student must enroll in one math and science,
one language and one arts and humanities course and may then choose three additional
courses from any of the other 46 content areas (Blazer, 2011). AICE also offers
flexibility in its course offerings that allow students to design curricula that also focus on
their individual interests (Sismey, Shaw, & Barnhill, 2012). There are three levels of

27
AICE diplomas: Distinction, Merit, and Pass. The level of diploma that students earn is
based on the amount of points they accumulate through course work and examinations.
Course work is expected to display “analysis, synthesis, evaluation, knowledge,
understanding and application” (Blazer, 2011, p. 9).
Examinations are scored on a scale of A through E, with A being the highest and
E being the equivalent of a C or a 3.0 on Advanced Placement examinations. E is the
lowest passing score accepted in order to receive an AICE diploma. Through AICE,
students have the opportunity to earn up to 45 hours of college credit in high school
(Blazer, 2011). International AS level examinations can earn one full credit, and
International A level examinations can earn double credit (Sismey et al., 2012).
The FDOE conducted a pilot study comparing the AICE program to the
International Baccalaureate (IB) program to determine the level of college readiness
AICE would offer to high school students (Sismey et al., 2012). The FDOE found that
AICE had the same degree of academic rigor as the IB program and that both programs
featured “high academic standards, real world applications and international
perspectives” (Sismey, et al., 2012, p. 5). Florida provides the same level of funding for
A and AS level AICE courses as it does for IB and AP programs (Sismey et al., 2012).
Students who take AICE courses have a significantly higher first-year college GPA than
those students who did not take any advanced level classes in high school (Sismey et al.,
2012).

28
Advancement via Individual Determination (AVID)
The Advancement Via Individual Determination (AVID) is a nationally
recognized in-school intervention program put in place to foster the academic talents and
aspirations of high achieving students of color so that they can continue on and be
successful in their post-secondary careers. AVID began in 1980 as a response to
voluntary desegregation in San Diego schools and was designed as a way to support
learning in student groups that have historically been unrepresented at four-year colleges
(Bernhardt, 2013; Huerta, Watt & Reyes, 2013). As of 2013, 4,800 schools in 48 states
had AVID programs. Programs such as AVID build relationships and peer networks that
help support a student in school, especially when that support is not given at home
(Contreras, 2011). AVID begins to identify students starting in the Grade 4 and continues
to work with these students for the remainder of their primary and secondary school
careers. What also makes AVID unique is that the intervention program targets students
who are considered average, but with the proper support, guidance, encouragement and
opportunity, will be able to meet the high expectations of the program to achieve
academic success both in school as well in their post-secondary careers (Contreras,
2011). Enrolling mostly low-income and students of color, AVID seeks to motivate,
support and increase opportunities for these students to perform well in elementary,
middle, and high school and continue their success in college (Bernhard, 2013). After
students’ teachers or parents recommend them for enrollment in AVID, they go through
an interview process to ensure not only that the student is interested in participating, but
that the student is a good fit and is committed to the program. The program is not strictly

29
academic. It also focuses on social growth, increased participation in extracurricular
activities, both at school and in the community, and family involvement in the students’
education. AVID requires parents to sign a contract to show support for their student’s
college aspirations. It also provides students and their families with information not only
about education, but also about college entrance requirements, costs and financial aid
(Bernhardt, 2013). In California, this level of support, education, and knowledge, both in
and out of school, has shown that AVID students enroll in college and complete college
level courses at a higher rate than students who were not enrolled in AVID (Huerta et al.,
2013).
Standardized Test Scores
In order for students to be admitted to college, they must take one of the two
college entrance examinations: the Scholastic Aptitude Test (SAT) or the ACT (formerly
known as American College Testing) examination. The College Entrance Examination
Board, now known as the College Board, was founded in 1900. The SAT was created and
first administered in 1926 as a way for students to display their intelligence. If students
did well, they would be eligible to go to college and further their education (Hoover,
2007). The SAT was modeled after the Army Alpha test which was used to measure the
IQ of army recruits during World War I. The goal of the SAT has been to measure
aptitude which is the ability to learn. This has been accomplished by examining a
student’s ability to think critically and use reasoning skills. Depending on when the SAT
was taken, the test was made up of either two sections, mathematics and critical reading,

30
or if taken more recently, three sections, with an added writing component (Anderson,
2010).
The first administration of the ACT took place in 1959. The test was created as a
competitor test to the SAT and aimed to measure student achievement in terms of level of
student understanding (Anderson, 2010). The original ACT was made up of four sections:
English, mathematics, natural science and social studies. In 1989, a reading section
replaced the social studies section and natural science was changed to science reasoning
and focused on a student’s ability to problem solve (Zwick, 2007). Nationally, up until
2011, more students had elected to take the SAT than the ACT, but this has changed in
recent years with the ACT being the more popular of the two (ACT, 2015).
Standardized testing made its national debut in 1914 when the National Education
Association (NEA) formally supported the use of achievement testing in schools.
Between 1918 and 1931, the number of standardized tests given in the United States
increased from 100 to 1,300 (Maranto, 2015). After the release of “A Nation at Risk” in
1983, standardized tests, especially in mathematics and science, have been used to
determine overall success and achievement of students in the United States. As Maranto
(2015) reported, every president since Ronald Reagan has included monitoring and
testing of American students’ achievement in mathematics and science in some way. The
introduction of No Child Left Behind (NCLB) in 2001, which stated that all children in
the United States would be proficient in reading and mathematics by the 2013-2014
school year, added the use of standardized testing in the United States. This law
mandated that states would monitor the progress and achievement of all students through

31
state-created annual assessment tests (USDOEa, 2015). NCLB not only put pressure on
students to perform but, because of federal funding tied to the results and annual progress
on these tests, also put pressure on teachers, schools, and school districts to perform
(Maranto, 2015). Title 1, which was introduced as part of the Elementary and Secondary
Education Act of 1965, was designed as a way to give schools in urban or low-income
areas additional funds to help level the academic playing field so that all students,
regardless of where they lived, would have the same academic opportunities (USDOEa,
2015). However, at the time of the study, Title 1 funds were being tied to NCLB and the
funding a Title 1 school received was based on the school’s performance on the state’s
annual achievement test which was measured in terms of Annual Yearly Progress or AYP
(Maranto, 2015). A school that fails to meet its pre-determined AYP target faces different
levels of consequences, with loss of funding being a main one (Maranto, 2015).
According to the ACT (2012), 27% of low income students met the ACT
benchmarks in reading, 16% in mathematics, and 11% in science on the 2010 ACT.
However, this trend of Black and Hispanic students failing to meet standardized
benchmark levels has emerged as early as middle school. The ACT conducted a test to
track student achievement beginning in Grade 8 in which the EXPLORE assessment test,
was used to compare students’ performance on the ACT as 12th graders. Findings were
that as 8th graders, just 24% of Black students and 26% of Hispanic students were
considered “on target” in reading, 15% of Black and 21% of Hispanics were on target in
mathematics and 4% of blacks and 7% of Hispanics were on target in science (ACT,
2012). Conversely, 43% of blacks and 42% of Hispanics were categorized as “far off

32
track” in reading; 50% of blacks and 41% of Hispanics were far off track in mathematics;
and 74% of blacks and 67% of Hispanics were far off track in science (ACT, 2012). It
also seems that students who were far off track in 8th grade had very little, if any, chance
of getting back on track and passing the ACT by the time they reached 12th grade. Of the
students who were deemed far off track on the EXPLORE assessment as 8th graders, only
10% were able to meet the ACT reading benchmarks, only 3% were able to meet the
ACT mathematics benchmarks and only 6% were able to meet the ACT science
benchmarks as 12th graders (ACT, 2012).
Table 3
Percentage of Grade 8 Students “On Target” on the ACT by race and subject
Reading Mathematics Science
Black 24 15 4
Hispanic 26 21 7
Table 4
Percentage of Grade 8 Students “Far Off Track” on the ACT by race and subject
Reading Mathematics Science
Black 43 50 74
Hispanic 42 41 67
The location of the school where students attend is also a factor: the higher
poverty, lower income area the school is in, the less of a chance do these students have to

33
pass the ACT. Schools where between 50-100% of all students were economically
disadvantaged, only 6% of students classified as “far off track” in Grade 8 met the ACT
reading benchmarks, 3% met the ACT mathematics benchmarks, and 3% met the ACT
science benchmark (ACT, 2012).
Minorities have scored lower than White students on the ACT, and this has also
been the trend in SAT scores. According to Harvey (2013), Blacks consistently scored
between 152.16 to 221.68 points lower on the SAT than their White counterparts during
the 10-year period from 2001-2002 to 2010-2011. Additionally, there was an average of
25.33 between the percentage of black students and the percentage of White students who
scored at or above the ACT/SAT criterion during the same 10-year period, providing
further evidence that the gap between the scores of Black and White students has not
decreased, but rather has increased (Harvey, 2013). From 1988 to 2005, the gap between
the average Black and average White student scores increased from 186 points to 204
points (Theodore Cross, 2005). Not only did the scoring gap increase, the average SAT
score for Black students barely changed during the same time period. In fact, the average
Black SAT score went from a combined score of 847 in 1988 to just 846 in 2005, an
increase of just 1.4% (Theodore Cross, 2005). In a study where the SAT scores of
students applying to five highly selective universities were compared, it was found that of
students who scored over 1,200 on their SAT, 75% of those students were White, and
only 20% of those students were Black (Jencks & Phillips, 1998). This demonstrates that
overall White students have had a history of scoring higher than Black students.

34
Graduation and College Readiness
College readiness is used to determine the level at which a high school student is
prepared to continue on to, and be successful at, a postsecondary institution without being
enrolled in any remedial classes (usually for mathematics and English). Students are able
to demonstrate their academic knowledge and skills on a number of college readiness
examinations. In Florida, this examination is the Postsecondary Education Readiness Test
(PERT) that students take during their high school career “to determine readiness for
Intermediate Algebra and Freshman Composition” (FDOE, 2016, para. 2). Based on the
scores, a student is deemed as college ready or could be advised to enroll in additional
preparatory classes that would be beneficial before enrolling in college (FDOE, 2015).
Based on a study from the Pathways to College Network (2007), the idea of going
to college is one that 83% of high school students hold as an expectation once they
complete high school. However, although 76% of White high school students do go on to
institutions of higher education, only 52% of Blacks, and 56% of Hispanics join them.
Only 47% of students from the lowest income quartile (up to $36,174 a year) attended
college, but 85% of students who came from homes where the annual household income
was at least $96,000 enrolled in college (Pathways to College, 2007). This 2007 study
gave rise to several issues related to students’ desire and ability to go on to college.
One issue is lack of information for students of color and their families. Students
living in urban communities have not historically had knowledge of the college
admittance process, what is required and what test scores are necessary to gain college
acceptance (Roderick et al., 2009). This leaves these students in the dark about what is

35
required, as well as what types of preparatory classes can be taken to help increase the
chances of performing well on both college readiness tests and college entrance
examinations.
Examining ACT college readiness benchmarks from 2009, the English
benchmarks were only met by 41% of students of color who took the test. Only 18% of
students of color met the mathematics benchmarks; only 27% met the reading
benchmarks; and only 9% of students of color met the science benchmarks. Only 7% of
students of color successfully met all (English, mathematics, reading and science) of the
benchmarks (ACT, 2010). Students of color were found to be two to four times less likely
to be deemed as college ready. In addition, students of color were also less likely to be
enrolled in core curriculum classes that would prepare them to be college ready: Only
64% of Black students and 67% of Hispanics were enrolled in this type of curriculum
(ACT, 2010).
Since 2001, lawmakers and legislatures have mandated the use of standardized
tests to monitor student progress, as well as meet graduation requirements. Schools are
required to have a certain percentage of students pass these examinations each year, and
students are expected to pass these examinations every year. If they do not, they run the
risk of not earning a high school diploma. Policymakers have often tended to hold
schools to unrealistic expectations, expect unrealistic performance and results from
students, offer unrealistic rewards, and impose detrimental consequences upon both
students and teachers at schools that fail and continue to fail to meet annual goals (ACT,
2012). It has also been determined that the pressure of state standardized tests used as a

36
graduation requirement has actually increased the dropout rate among minorities, Black
males in particular. For states that have annual achievement tests that students are
required to pass in order to graduate high school, Black males have been found to be 5.2
times more likely to drop out of school than their White counterparts. For states with
annual achievement tests that have been defined as rigorous, that rate jumps to 7.3 times
more likely to drop out of high school (Walden & Kristsonis, 2008). This could be one of
the reasons why the graduation rate, which had been steadily declining nationwide since
1984, has decreased since the passage of NCLB (Walden & Kristsonis, 2008).
Summary
The significant gap between White students and Black and Latino students is well
known in public education. Students of color do not fare as well as their White
counterparts in areas such as standardized testing, graduation, academics, and college
(Vega, Moore & Miranda, 2015). Modern day education has been permanently changed
by the era of accountability, which started with the passage of the No Child Left Behind
Act (NCLB). This act claimed its primary objective was to close the achievement gap,
which has been defined as the difference in test scores between White and Black and
Latino students (Chambers et al., 2014).
This literature review has provided an in-depth look into the current issues faced
by students of color in schools and how these issues directly affect students’ chances at
college entry and success. Each section of the literature review addressed literature
relevant to the problem statement, purpose of the study, research questions, and the

37
theoretical framework. The study was focused on the relationship that may exist between
students of color participating in advanced courses and college readiness.
An increase in access alone will not remove the inequity that exists for many
students in urban schools (Hallett & Venegas, 2011). This access has to be complemented
with quality instruction, curriculum resources, and tutoring to raise achievement
(Contreras, 2011). Research offers convincing evidence that shows when minority
children are exposed to more rigorous academics, accompanied with high expectations,
they achieve at higher levels (Pathways to College Network, 2007). As such, students
should receive a more culturally responsive curriculum for all subjects that is integrated
into the learning process, and more culturally diverse teachers must be recruited
(Olszewski-Kuilius & Clarenbach, 2012).
The problem, the purpose, and research questions for the study are restated in
Chapter 3 which contains a comprehensive explanation of the research methods and
design of the study. The collection of data, the analysis of the data, the population and
sample, assumptions and limitations, and ethical considerations are discussed in detail
along with the strategies used to determine the validity of the research findings as they
relate to the research questions.

38
CHAPTER 3
METHODOLOGY
Purpose of the Study
The purpose of this study was to explore what effect, if any, the participation of
students of color in advanced level academics in high school had on their college
readiness. The researcher compared students of color who participated in advanced level
courses to students of color who did not, as well as white students. The specific research
problem was that Black and Hispanic students were not graduating from high school
college ready at the same rate as their White peers.
Research Design
The study employed a comparative correlation design in order to first determine if
there is a relationship between students of color who participated in advanced academic
programs and students of color who were college ready. Similarly, the researcher also
sought to determine if there was a relationship between Black students and Black male
students who participated in advanced academic programs and college readiness.
For the purpose of this study, advanced classes were defined as enrollment in any
of the following program offerings: Advanced Placement (AP), International
Baccalaureate (IB), Dual Enrollment (DE), Advanced International Certificate of
Education (AICE) and Advancement via Individual Determination (AVID) classes.
College ready was defined as students who “have the knowledge, skills, and academic
preparation needed to enroll and succeed in introductory college credit-bearing courses
39
within an associate or baccalaureate degree program without the need for remediation”
(FDOE, 2015, para. 2).
Research Questions
The following research questions were addressed:
1. What relationship, if any, exists between the participation of students of color in
advanced academic programs (AP, IB, DE, AICE, AVID) and their college
readiness?
2. What relationship, if any, exists between Black students’ participation in
advanced academic programs (AP, IB, DE, AICE, AVID) and their college
readiness?
3. What relationship, if any, exists between Black male students’ participation in
advanced academic programs (AP, IB, DE, AICE, AVID) and their college
readiness?
Research Hypotheses
The following research hypotheses were created in accordance with the research
questions and in conjunction with the review of literature:
Hypothesis 1: There is no statistically significant relationship between students of
color who take advanced academic programs (AP, IB, DE, AICE, AVID) and their
college readiness

40
Hypothesis 2: There is no statistically significant relationship between Black
students who take advanced academic programs (AP, IB, DE, AICE, AVID) and their
college readiness
Hypothesis 3: There is no statistically significant relationship between Black male
students who take advanced academic programs (AP, IB, DE, AICE, AVID) and their
college readiness
Sample
The sample for this study included selected high school students from a school
district located in Northeast Florida. The original data set included 16,211 students from
31 different schools. However, to avoid extraneous variables over which the researcher
had no control, students who took advanced level courses before high school and students
who did not attend high school with their cohort for all four years in this school district
were eliminated. The remaining 12,541 students that made up the sample were seven
high schools, an alternative center, home school, virtual school, and a group of alternative
school settings which was listed as group K in the data. No Charter Schools were
included in the data set, as student data were not available to the researcher.
District Demographics
At the time of the study, the school district in which this study was conducted was
the fastest growing in the state of Florida. The school district was diverse, consisting of
students coming from homes in small farming communities, tourist areas, and million-
dollar beach front properties. The county’s population in which the school district resides,
41
consisted of approximately 217,919 residents, of which, 89.7% were White, 5.7% were
Black, 4.6% Asian and other minority, and 5.8% identifying as Hispanic or Latino
ethnicity. The school district was the largest employer in the county, employing some
4,388 people. There were 18 elementary schools (K – 5th grade), three K-8 schools, seven
middle schools (6th – 8th grade), seven high schools (9th – 12th grade), one alternative
center, six charter schools, and three juvenile justice facilities. The school district did not
differ much from the county in its demographics; of the roughly 36,005 students enrolled,
85.74% were White, 7.3% were Black, 3.79% were Asian; 8% identified as Hispanic,
2.74% as multiracial, and .43% as other minorities. Approximately 25% of the district’s
students qualified for free or reduced-price meals. In all, the students represented 112
different countries and 76 different languages.
Procedures for Data Collection
The data were collected with the permission of the University of Central Florida’s
Institutional Review Board and in conjunction with the school district through the
Planning, Accountability & Assessment Office. Student privacy was protected by the
removal of student names and identification numbers prior to the researcher’s receipt of
the raw data. Therefore, all data were deidentified at the time of receipt. The provided
data consisted of student demographic data including high school attended, gender, age,
race/ethnicity, and at-risk status. Graduation data consisted of diploma type, final GPA,
withdrawal codes, cohort entry date, cohort exit date, and if a student graduated with their
cohort or not. Additional data provided to the researcher included courses taken, the years
courses were taken, course description, course type (AP, IB, DE, AICE, AVID), the

42
number of each type of course taken, and the total number of advanced level courses
taken. Finally, assessment data were included for all students from the Florida
Comprehensive Assessment Test (FCAT), End of Course (EOC) examinations, and
concordant scores from other recognized standardized tests such as the Post-secondary
Education Readiness Test (PERT), Scholastic Aptitude Test (SAT), or ACT. Graduation
statistics over a five-year period, from the 2010 – 2011 to 2014 – 2015 school years, were
also included. Combined, all of the different data sets helped the researcher determine if a
student was college ready or not according to the definition and guidelines set forth in
this study. Additionally, the data assisted in defining, categorically, the racial/ethnic
group of each student.
Academic Programs
For this study, the advanced academic programs in consideration were Advanced
Placement (AP), International Baccalaureate (IB), Dual Enrollment (DE), Advanced
International Certificate of Education (AICE) and Advancement via Individual
Determination (AVID). Collectively, these programs serve to provide students with
rigorous courses of study that will better prepare students who wish to pursue college
after high school.
Standardized Tests
The Florida Comprehensive Assessment Test (FCAT) was first administered to
students in 1998 as a way to gauge students’ performance as it related to the Sunshine
State Standards. With the implementation of the No Child Left Behind Act of 2001, the

43
state began to retool the performance indicators to better align the FCAT with NCLB.
Prior to the 2003, the data for Adequate Yearly Progress (AYP) was not reported to
school districts. Beginning in 2003, AYP data by subgroups was provided to school
districts. In 2011, the FCAT transitioned to FCAT 2.0; and with the new version of this
test came changes to the scales used to determine if a student was proficient or non-
proficient. Also, End of Course (EOC) examinations for mathematics and science were
introduced into the high school system in 2011 and 2012 respectively, eliminating the
need for the mathematics and science sessions of the FCAT. The Post-Secondary
Education Readiness Test (PERT) is a customized placement test whose purpose is to
determine placement for students when entering college. The PERT, through legislation,
can be used to determine college readiness in mathematics for high school students who
achieve a concordant score. The SAT is a test created by College Board that is widely
used for college and university entrance. Similarly, the ACT is a test used for admissions
and placement in to colleges and universities. Much like the PERT, both the SAT and
ACT can be used to determine college readiness in reading for students through a
concordant score.
Participants
A total of 16,211 students’ data was collected and provided to the researcher for
use in the study. Many of the students were removed from the data set due to not meeting
the requirements set forth by the researcher. Students who did not attend high school in
the district for all four years, were removed. Some students were in the initial data set
because they took advanced academics in elementary or middle school; however, because

44
they did not attend high school in the studied district, they were removed. Additionally,
some students were removed who had incomplete data, making it impossible to
determine academic status or college readiness. As such, 12,541 students’ data remained
and were used in part for the analysis. A goal of this study was to have a confidence level
of 95%, with an alpha level of .05. While it is often considered sufficient to use a sample
size of 30 in order to be able to conclude statistical significance, it was determined that a
minimum of 50 students per subgroup would be required for the study to be valid. The
researcher collaborated with the school district office of accountability to collect and
disaggregate the necessary data for the study. Once collected, the data for both
participation in advanced academic programs and college readiness were classified as
nominal data and placed into an electronic spreadsheet. After the data were collected and
classified, statistical analyses were conducted to determine correlations between the
students of color and the variables. The statistical tests employed were the Chi Square
Test for Independence and Pearson Correlation in order to first determine if there was a
relationship, and second, to determine if there was a correlation between variables. This
was determined through interpreting the statistical tests results and looking at statistical
significance and effect size.
Data Analysis
For the purpose of the study, the independent variable was advanced classes and
the dependent variable was college readiness. The researcher analyzed these variables
with respect to the different race/ethnicities of the high school students. To determine if
there was a relationship between the two variables, students of color who take advanced

45
classes and students of color who are deemed college ready, the researcher ran a Chi
Square Test for Independence. To determine if there was a correlation, the researcher ran
a Pearson Correlation statistical test.
Students are deemed college ready when they have successfully met the
requirements set forth by the FDOE. This includes receipt of a standard high school
diploma, which can be attained by having at least a 2.0 GPA, passing the state required
standardized test in English/language arts (Grade 10), mathematics (Algebra 1), science
(Biology), or receiving a concordant score through PERT, ACT, or SAT. These data were
aggregated as part of the determination of college readiness. Additional requirements for
a student to be considered college ready are earning 24 credits: four in language arts, four
in mathematics, three in social studies, three in science, one in physical education, one in
fine arts, and eight electives, with at least one course being completed via online learning.
Assumptions and Limitations
As previously stated, the researcher assumed that the college readiness criteria set
forth by the state of Florida was sufficient in that it prepares students for academic
success at all colleges and universities. It was assumed that the overall quality of
education with respect to school facility, teacher quality, resources, and curriculum were
the same or adequately similar at all the schools. The researcher’s hypotheses assumed
that by analyzing the data through a quantitative multiple regression, the findings would
show that students of color who participated in advanced academics in high school would
be college ready at a rate higher than students of color who did not.

46
This study was limited to a school district in Northeast Florida. Student data
collected for the study were limited to the high schools within the northeast Florida
School District. Only high school seniors who were categorized as Black and Hispanic
were contained within the “students of color” student population. White students and
students of other ethnicities were also used in the data analysis, comparing them to
students of color to determine if a relationship existed.
The researcher made efforts to collect a sample that was of statistically significant
size. However, the sample only represented students from one county in one state. As
such, the results may not be generalizable to students from other districts in the state or in
other states.
Ethical Considerations
The data collected were conveyed in a collective format and coded so that
schools, students, and academic programs maintained anonymity. All policies and
procedures (criteria) of the University of Central Florida for research involving human
subjects were followed and honored in the collection, development, and reporting of the
research.

47
CHAPTER 4
RESEARCH FINDINGS
Introduction
This study examined what relationship, if any, exists between students of color,
Black students, Black male students, and their participation in advanced academic
programs (AP, IB, DE, AICE, AVID) and their college readiness. The study was directed
by the research questions:
1. What relationship, if any, exists between the participation of students of color
in advanced academic programs (AP, IB, DE, AICE, AVID) and their college
readiness?
2. What relationship, if any, exists between Black/African-American students’
participation in advanced academic programs (AP, IB, DE, AICE, AVID) and
their college readiness?
3. What relationship, if any, exists between Black/African-American male
students’ participation in advanced academic programs (AP, IB, DE, AICE,
AVID) and their college readiness?
Chapter 4 includes a report of the analysis of data and findings, including student
count by school, student count by race/ethnicity, total number of advanced courses
taken by student, total courses taken by program type, and the statistical analyses
used to describe the relationship and correlation with respect to the research
questions. Results of these analyses are presented using tabular displays supported by
accompanying narrative explanations.

48
Overview of Analysis of Data
SPSS (version 23) was utilized to gather and sort the data. Once organized and
coded, the data were used to run a Chi-square Test for Independence to determine if a
relationship exists between advanced academic programs and college readiness for
Students of color, Black students, and Black male students. According to Tabachnick and
Fidell (2007), the Chi-square Test for Independence is used by a researcher when looking
for a relationship between two categorical variables. Additionally, a Pearson Correlation
statistical test was run to determine the relationship between the two variables. Pallant
(2013) stated that the Pearson Correlation analysis describes the strength of the
relationship between two variables.
Chi-square Test for Independence
For the purpose of this study, the researcher used rules for interpretation for the
Chi-square Test for Independence from Pallant’s 2013 SPSS Survival Manual. To be
considered statistically significant, the asymptotic significance (2-sided) for the Chi-
square needs to be less than .05. The asymptotic significance (2-sided) for the Chi-square
can be found in the Chi-square Tests table of the analysis. Effect size is measured by the
phi coefficient; this correlational coefficient ranges from 0 to 1. Effect sizes are
categorized and can be seen in Table 5. The phi coefficient can be found in the
Symmetric Measures Table of the analysis

49
Table 5
Effect Size for Chi-square Test for Independence
Effect Phi Coefficient
Small .01
Medium .03
Large .05
Pearson Correlation
Pearson Correlation was interpreted using the SPSS Survival Manual (Pallant,
2013) as well. The first thing to look at is the N value in the Correlations Table to see if it
is the correct value and that no cases are missing. The second step is to determine the
direction of the relationship, which can be interpreted by looking to see what sign is in
front of the correlation coefficient in the Correlations Table. When the sign in front of the
correlation coefficient is negative, this suggests a negative correlation between the two
variables; if positive, the relationship between the two variables is positive. The third step
in interpreting a Pearson Correlation is to consider the strength of the relationship
between the two variables. This ranges from -1 to 1. A value of 0 would indicate no
relationship at all, 1 indicates a perfect positive correlation and similarly, -1 represents a
perfect negative correlation. The strength of the relationship is categorized and can be
seen in Table 6. Lastly, to determine the significance (Sig. 2 tailed) in the Correlations
Table, the value needs to be p<.01to be considered as significant.
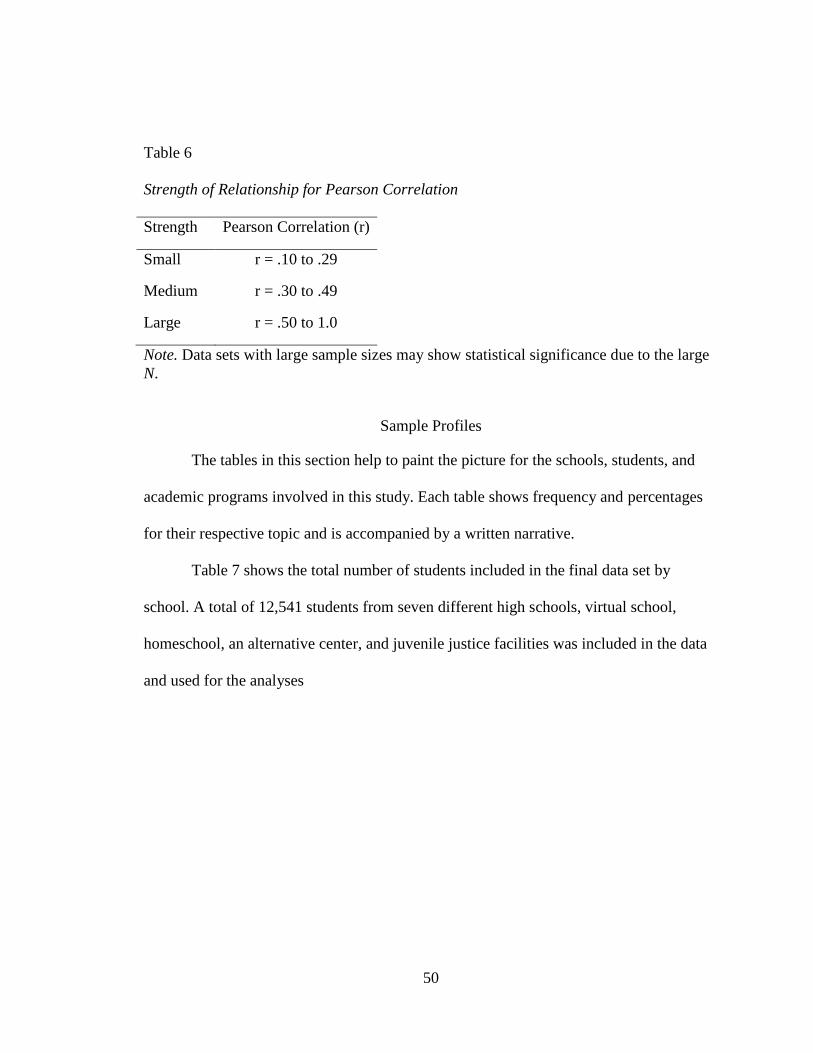
50
Table 6
Strength of Relationship for Pearson Correlation
Strength Pearson Correlation (r)
Small r = .10 to .29
Medium r = .30 to .49
Large r = .50 to 1.0
Note. Data sets with large sample sizes may show statistical significance due to the large
N.
Sample Profiles
The tables in this section help to paint the picture for the schools, students, and
academic programs involved in this study. Each table shows frequency and percentages
for their respective topic and is accompanied by a written narrative.
Table 7 shows the total number of students included in the final data set by
school. A total of 12,541 students from seven different high schools, virtual school,
homeschool, an alternative center, and juvenile justice facilities was included in the data
and used for the analyses

51
Table 7
Student Count by School
School
Code N % Valid % Cumulative %
A 2,128 17.0 17.0 17.0
B 1,922 15.3 15.3 32.3
C 1,619 12.9 12.9 45.2
D 2,059 16.4 16.4 61.6
E 1,990 15.9 15.9 77.5
F 1,764 14.1 14.1 91.6
G 262 2.1 2.1 93.6
H 155 1.2 1.2 94.9
I 6 .0 .0 94.9
J 246 2.0 2.0 96.9
K 390 3.1 3.1 100.0
Total 12,541 100.0 100.0
Note. K represents six combined schools of an alternative setting.
Table 8 represents the total student count by race/ethnicity for the students
included in the final data set. Of the 12,541 total students used in this study, 10,270
students were White (81.9%), 1,037 students were Black (8.3%), 865 students were
Hispanic (6.9%), and 369 students were identified as other races (2.9%).

52
Table 8
Students by Race
Race N % Valid % Cumulative %
White 10,270 81.9 81.9 81.9
Black 1,037 8.3 8.3 90.2
Hispanic 865 6.9 6.9 97.1
Other 369 2.9 2.9 100.0
Total 12,541 100.0 100.0
Table 9 is a representation of the total number of advanced level courses taken by
students. Of the 12,541 students included in the data set, over half of the sample
population, 6,765 students (53.9%), did not enroll in advanced level courses at all during
high school. In contrast, 5,776 students (45%) were enrolled in advanced level courses.
Of this number, 3,803 students took between one and nine advanced level courses
throughout their high school careers, 1,722 students took between 10 and 19, and 251
students took between 20 and 28 advanced level courses.

53
Table 9
Total Number of Advanced Level Courses Taken by Student
Advanced Level
Courses Taken N % Valid % Cumulative %
0 6,765 53.9 53.9 53.9
1 657 5.2 5.2 59.2
2 489 3.9 3.9 63.1
3 451 3.6 3.6 66.7
4 390 3.1 3.1 69.8
5 393 3.1 3.1 72.9
6 438 3.5 3.5 76.4
7 431 3.4 3.4 79.9
8 332 2.6 2.6 82.5
9 222 1.8 1.8 84.3
10 193 1.5 1.5 85.8
11 176 1.4 1.4 87.2
12 224 1.8 1.8 89.0
13 241 1.9 1.9 90.9
14 236 1.9 1.9 92.8
15 166 1.3 1.3 94.1
16 135 1.1 1.1 95.2
17 126 1.0 1.0 96.2
18 113 .9 .9 97.1
19 112 .9 .9 98.0
20 85 .7 .7 98.7
21 73 .6 .6 99.3
22 40 .3 .3 99.6
23 31 .2 .2 99.8
24 16 .1 .1 100.0
25 3 .0 .0 100.0
26 2 .0 .0 100.0
28 1 .0 .0 100.0
Total 12,541 100.0 100.0

54
As shown in Table 10, students in the sample were most widely enrolled in AVID
(Honors) courses, with 41.7% of students (5,235 students total) enrolled in AVID
(Honors) classes. AP courses had the second highest sample student enrollment, with
3,629 students (28.9%) taking at least one AP class during their high school careers. Dual
Enrollment was the third most enrolled-in type of advanced course, with 1,517 students
(12.1%) participating. Second to last was IB, with 557 students (4.4%) of the sample
students enrolled. AICE had the smallest student enrollment, with only 3.5% (442
students) enrolling in an AICE course during high school.
Table 10
Advanced Programs by Type
Program N %
AICE 442 3.5
AP 3,629 28.9
Dual Enrollment 1,517 12.1
AVID 5,235 41.7
IB 557 4.4
Total 11,380 90.6
Data Analysis
ResearchQuestion 1
What relationship, if any, exists between the participation of students of color in
advanced academic programs (AP, IB, DE, AICE, AVID) and their college readiness?
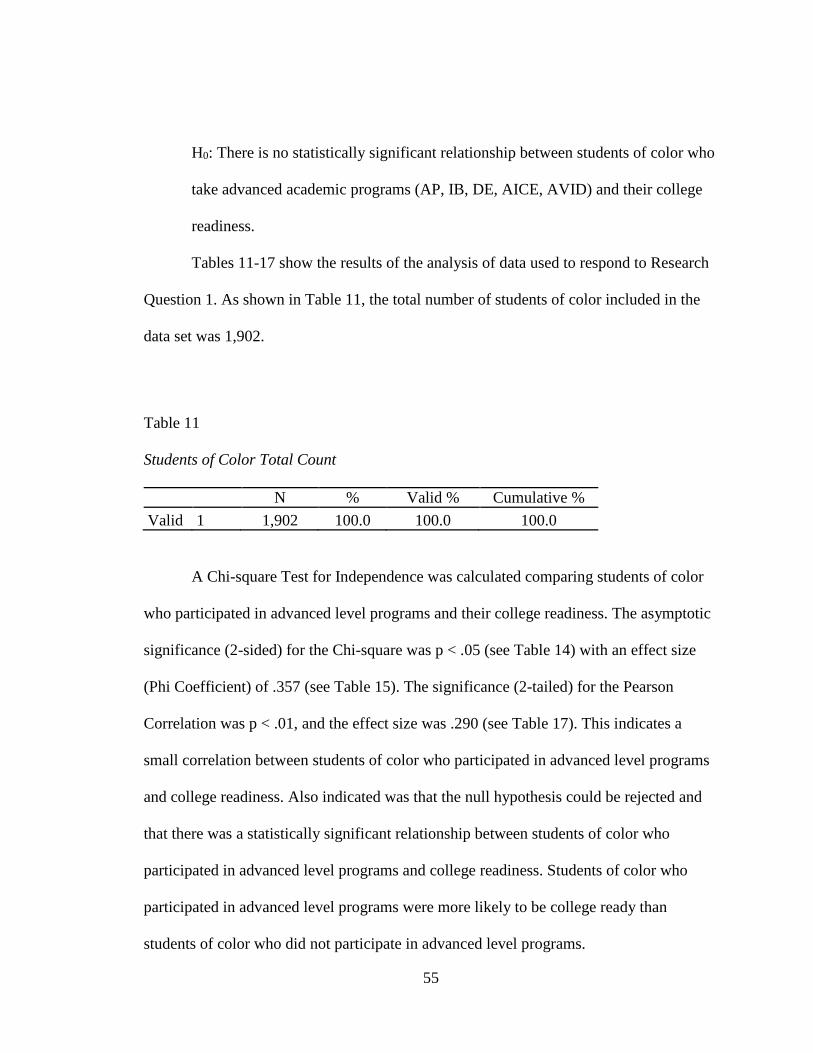
55
H0: There is no statistically significant relationship between students of color who
take advanced academic programs (AP, IB, DE, AICE, AVID) and their college
readiness.
Tables 11-17 show the results of the analysis of data used to respond to Research
Question 1. As shown in Table 11, the total number of students of color included in the
data set was 1,902.
Table 11
Students of Color Total Count
N % Valid % Cumulative %
Valid 1 1,902 100.0 100.0 100.0
A Chi-square Test for Independence was calculated comparing students of color
who participated in advanced level programs and their college readiness. The asymptotic
significance (2-sided) for the Chi-square was p < .05 (see Table 14) with an effect size
(Phi Coefficient) of .357 (see Table 15). The significance (2-tailed) for the Pearson
Correlation was p < .01, and the effect size was .290 (see Table 17). This indicates a
small correlation between students of color who participated in advanced level programs
and college readiness. Also indicated was that the null hypothesis could be rejected and
that there was a statistically significant relationship between students of color who
participated in advanced level programs and college readiness. Students of color who
participated in advanced level programs were more likely to be college ready than
students of color who did not participate in advanced level programs.

56
Table 12
Case Processing Summary (Chi-square Test for Independence) for Students of Color
Cases
Valid Missing Total
N % N % N %
Advanced Courses*
College Ready 1,902 100.0 0 0.0 1,902 100.0
Table 13
Strength of Relationship for Pearson Correlation Advanced Courses:
College Ready Cross tabulation (Chi-square Test for Independence)
for Students of Color
College Ready
Total 0 1
Advanced
Courses
0 Count 399 760 1,159
% within Advanced
Courses 34.4% 65.6% 100.0%
% within College
Ready 93.2% 51.6% 60.9%
% of Total 21.0% 40.0% 60.9%
1 Count 29 714 743
% within Advanced
Courses 3.9% 96.1% 100.0%
% within College
Ready 6.8% 48.4% 39.1%
% of Total 1.5% 37.5% 39.1%
Total Count 428 1,474 1,902
% within Advanced
Courses 22.5% 77.5% 100.0%
% within College
Ready 100.0% 100.0% 100.0%
% of Total 22.5% 77.5% 100.0%
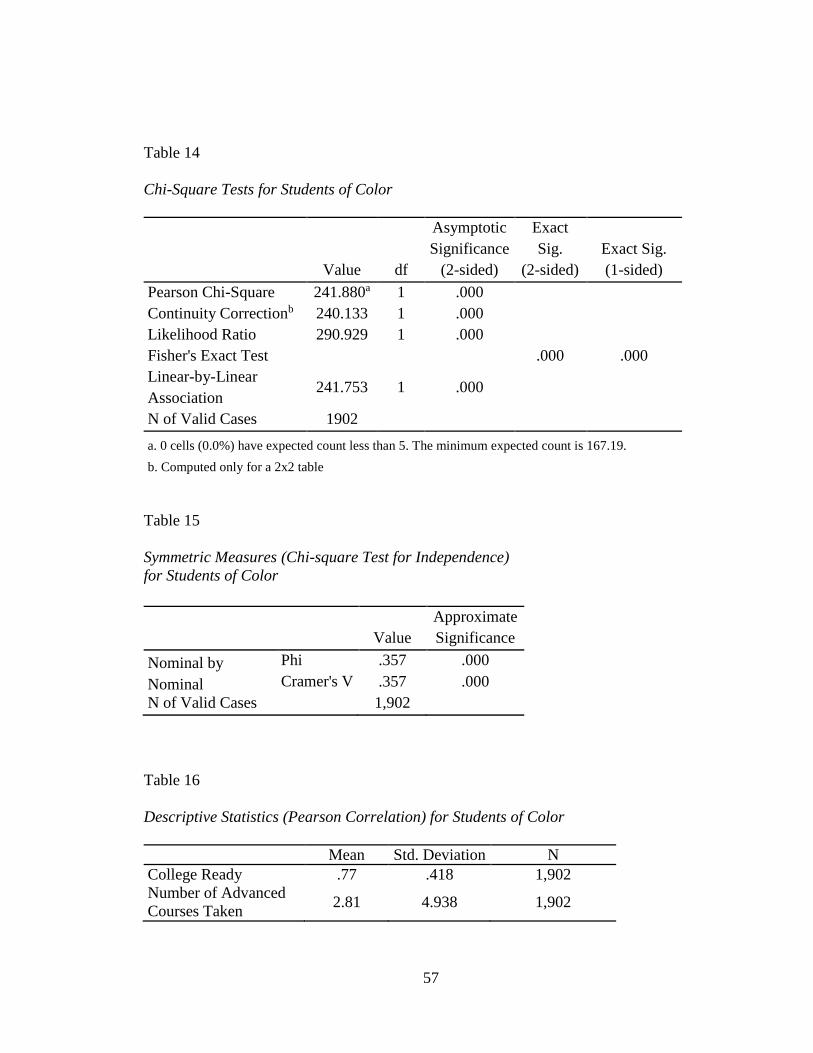
57
Table 14
Chi-Square Tests for Students of Color
Value df
Asymptotic
Significance
(2-sided)
Exact
Sig.
(2-sided)
Exact Sig.
(1-sided)
Pearson Chi-Square 241.880a 1 .000
Continuity Correctionb 240.133 1 .000
Likelihood Ratio 290.929 1 .000
Fisher's Exact Test .000 .000
Linear-by-Linear
Association 241.753 1 .000
N of Valid Cases 1902
a. 0 cells (0.0%) have expected count less than 5. The minimum expected count is 167.19.
b. Computed only for a 2x2 table
Table 15
Symmetric Measures (Chi-square Test for Independence)
for Students of Color
Value
Approximate
Significance
Nominal by
Nominal
Phi .357 .000
Cramer's V .357 .000
N of Valid Cases 1,902
Table 16
Descriptive Statistics (Pearson Correlation) for Students of Color
Mean Std. Deviation N
College Ready .77 .418 1,902
Number of Advanced
Courses Taken 2.81 4.938 1,902

58
Table 17
Correlations for Students of Color
College
Ready
Number of Advanced
Courses Taken
College
Ready
Pearson Correlation 1 .290**
Sig. (2-tailed) .000
N 1902 1902
Number of
Advanced
Courses
Taken
Pearson Correlation .290** 1
Sig. (2-tailed) .000
N 1902 1902
**. Correlation is significant at the 0.01 level (2-tailed).
Research Question 2
What relationship, if any, exists between Black students’ participation in
advanced academic programs (AP, IB, DE, AICE, AVID) and their college readiness?
H0: There is no statistically significant relationship between Black students who
take advanced academic programs (AP, IB, DE, AICE, AVID) and their college
readiness.
Tables 18-24 show the results of the analysis of data used to respond to Research
Question 2. As shown in Table 18, the total number of Black/African-American students
included in the data set was 1,037.
A Chi-square Test for Independence was calculated comparing Black students
who participated in advanced level programs and their college readiness. The asymptotic
significance (2-sided) for the Chi-square was p < .05 (see Table 21) with an effect size

59
(Phi Coefficient) of .356 (see Table 22). The Sig. (2-tailed) for the Pearson Correlation
was p < .01, and the effect size was .299 (see Table 24). This indicates a small correlation
between Black students who participated in advanced level programs and their college
readiness. The null hypothesis can be rejected, concluding that there was a statistically
significant relationship between Black students who participated in advanced level
programs and their college readiness. Black/African-American Students who participated
in advanced level programs were more likely to be college ready than Black students who
did not participate in advanced level programs.
Table 18
Black Student Total Count
Frequency % Valid % Cumulative %
Valid 1 1,037 100.0 100.0 100.0
Table 19
Case Processing Summary (Chi-square Test for Independence) for Black Students
Cases
Valid Missing Total
N % N % N %
Advanced Courses
College Ready 1037 100.0 0 0.0 1037 100.0

60
Table 20
Advanced Courses College Ready Cross tabulation (Chi-square Test
for Independence) for Black Students
College Ready
Total 0 1
Advanced
Courses
0 Count 306 426 732
% within Advanced
Courses 41.8% 58.2% 100.0%
% within College
Ready 94.7% 59.7% 70.6%
% of Total 29.5% 41.1% 70.6%
1 Count 17 288 305
% within Advanced
Courses 5.6% 94.4% 100.0%
% within College
Ready 5.3% 40.3% 29.4%
% of Total 1.6% 27.8% 29.4%
Total Count 323 714 1,037
% within Advanced
Courses 31.1% 68.9% 100.0%
% within College
Ready 100.0% 100.0% 100.0%
% of Total 31.1% 68.9% 100.0%
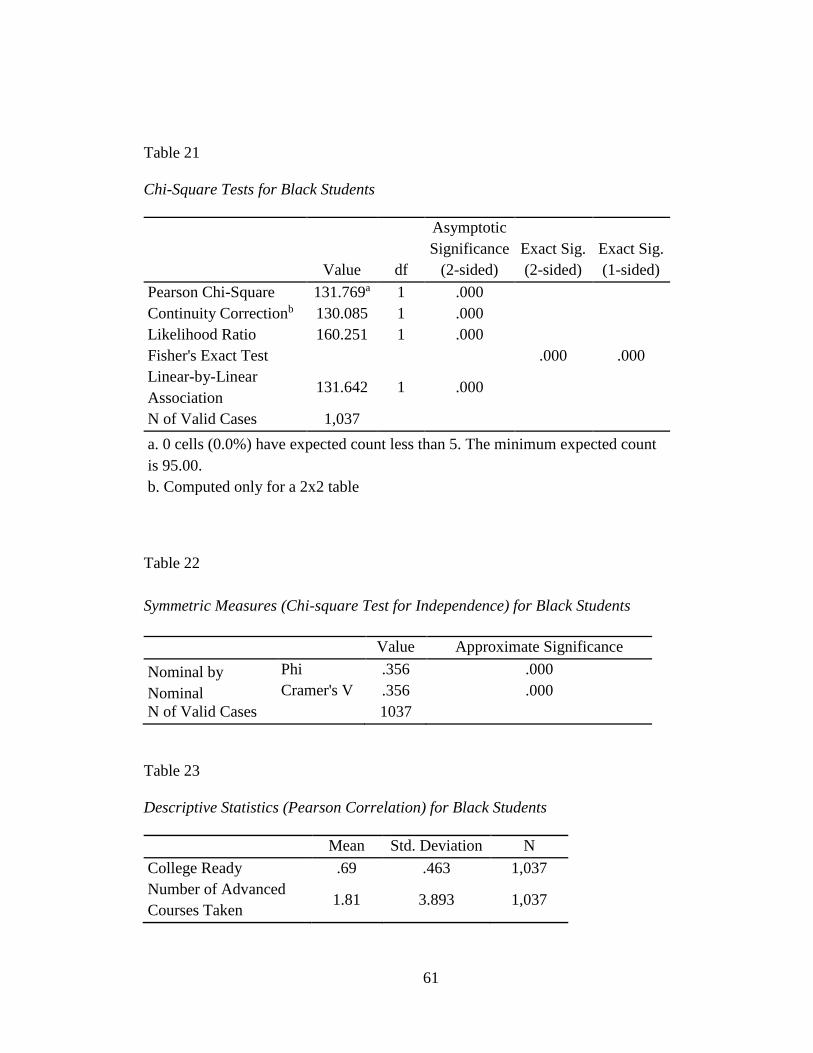
61
Table 21
Chi-Square Tests for Black Students
Value df
Asymptotic
Significance
(2-sided)
Exact Sig.
(2-sided)
Exact Sig.
(1-sided)
Pearson Chi-Square 131.769a 1 .000
Continuity Correctionb 130.085 1 .000
Likelihood Ratio 160.251 1 .000
Fisher's Exact Test .000 .000
Linear-by-Linear
Association 131.642 1 .000
N of Valid Cases 1,037
a. 0 cells (0.0%) have expected count less than 5. The minimum expected count
is 95.00.
b. Computed only for a 2x2 table
Table 22
Symmetric Measures (Chi-square Test for Independence) for Black Students
Value Approximate Significance
Nominal by
Nominal
Phi .356 .000
Cramer's V .356 .000
N of Valid Cases 1037
Table 23
Descriptive Statistics (Pearson Correlation) for Black Students
Mean Std. Deviation N
College Ready .69 .463 1,037
Number of Advanced
Courses Taken 1.81 3.893 1,037
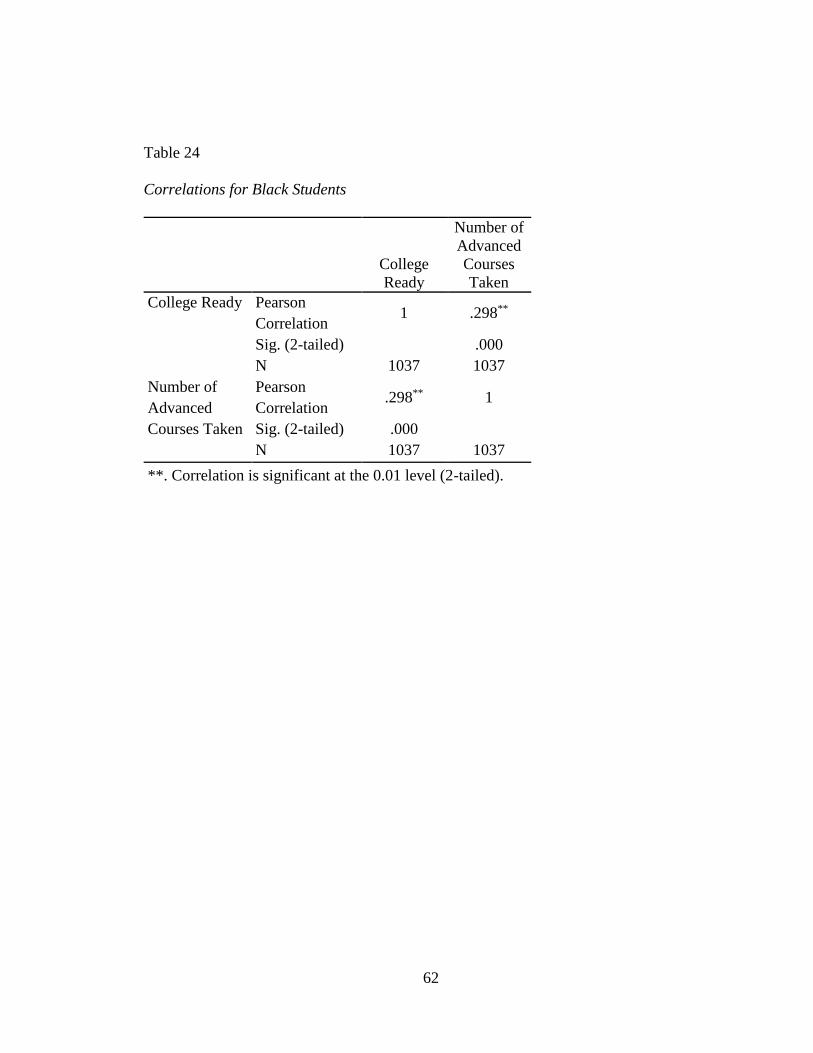
62
Table 24
Correlations for Black Students
College
Ready
Number of
Advanced
Courses
Taken
College Ready
Pearson
Correlation 1 .298**
Sig. (2-tailed) .000
N 1037 1037
Number of
Advanced
Courses Taken
Pearson
Correlation .298** 1
Sig. (2-tailed) .000
N 1037 1037
**. Correlation is significant at the 0.01 level (2-tailed).

63
Research Question 3
What relationship, if any, exists between Black male students’ participation in
advanced academic programs (AP, IB, DE, AICE, AVID) and their college readiness?
H0: There is no statistically significant relationship between Black/African-
American male students who take advanced academic programs (AP, IB, DE,
AICE, AVID) and their college readiness.
Tables 25-31 show the results of the analysis of data used to respond to Research
Question 3. As shown in Table 25, the total number of Black male students included in
the data set was 621.
A Chi-square Test for Independence was calculated comparing Black male
students who participated in advanced level programs and college readiness. The
asymptotic significance (2-sided) for the Chi-square was p < .05 (see Table 28) with an
effect size (Phi Coefficient) of .361 (see Table 29). The Sig. (2-tailed) for the Pearson
Correlation was p < .01, and the effect size was .296 (see Table 31). This indicates a
small correlation between Black male students who participated in advanced level
programs and college readiness. Therefore, the researcher was able to reject the null
hypothesis and conclude that there was a statistically significant relationship between
Black male students who participated in advanced level programs and their college
readiness. Black male students who participated in advanced level programs were more
likely to be college ready than black male students who did not participate in advanced
level programs.
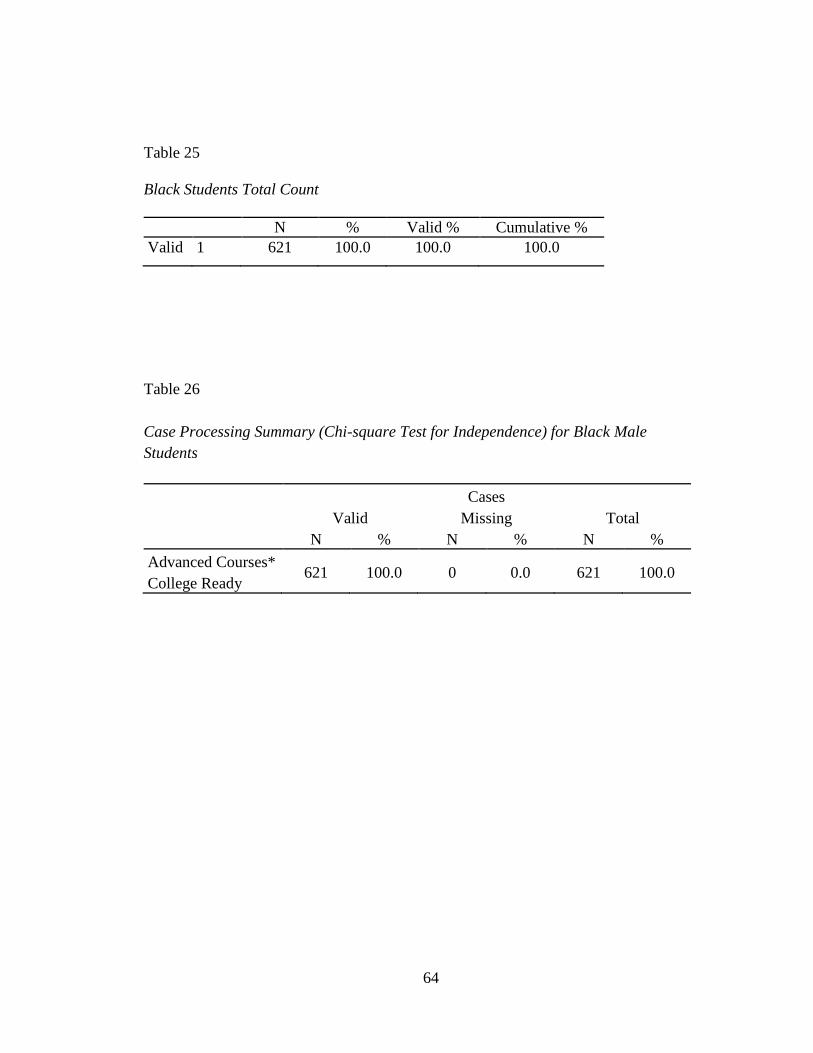
64
Table 25
Black Students Total Count
N % Valid % Cumulative %
Valid 1 621 100.0 100.0 100.0
Table 26
Case Processing Summary (Chi-square Test for Independence) for Black Male
Students
Cases
Valid Missing Total
N % N % N %
Advanced Courses*
College Ready 621 100.0 0 0.0 621 100.0

65
Table 27
Advanced Courses College Ready Cross tabulation (Chi-square Test for Independence
for Black/African-American Students
College Ready
Total 0 1
Advanced
Courses
0 Count 250 242 492
% within Advanced
Courses 50.8% 49.2% 100.0%
% within College
Ready 96.5% 66.9% 79.2%
% of Total 40.3% 39.0% 79.2%
1 Count 9 120 129
% within Advanced
Courses 7.0% 93.0% 100.0%
% within College
Ready 3.5% 33.1% 20.8%
% of Total 1.4% 19.3% 20.8%
Total Count 259 362 621
% within Advanced
Courses 41.7% 58.3% 100.0%
% within College
Ready 100.0% 100.0% 100.0%
% of Total 41.7% 58.3% 100.0%

66
Table 28
Chi-square Tests for Black Students
Value df
Asymptotic
Significance
(2-sided)
Exact Sig.
(2-sided)
Exact Sig.
(1-sided)
Pearson Chi-Square 80.780a 1 .000
Continuity Correctionb 78.987 1 .000
Likelihood Ratio 96.516 1 .000
Fisher's Exact Test .000 .000
Linear-by-Linear
Association 80.650 1 .000
N of Valid Cases 621
a. 0 cells (0.0%) have expected count less than 5. The minimum expected count
is 53.80.
b. Computed only for a 2x2 table
Table 29
Symmetric Measures for Black Students
Value
Approximate
Significance
Nominal by
Nominal
Phi .361 .000
Cramer's V .361 .000
N of Valid Cases 621

67
Table 30
Descriptive Statistics (Pearson Correlation) for Black Students
Mean
Std.
Deviation N
College
Ready .58 .493 621
Number of
Advanced
Courses
Taken
1.04 2.848 621
Table 31
Correlations for Black Students
College
Ready
Number of Advanced
Courses Taken
College
Ready
Pearson
Correlation 1 .296**
Sig. (2-tailed) .000
N 621 621
Number of
Advanced
Courses
Taken
Pearson
Correlation .296** 1
Sig. (2-tailed) .000
N 621 621
**. Correlation is significant at the 0.01 level (2-tailed).
Additional Analyses
To see if there may be a difference in effect size between White students and
Hispanic students as compared to students and students of color, the researcher
determined that it would be beneficial to run the same statistical analyses with the other

68
subgroups. The goal was to determine if students of color benefit more, in terms of
college readiness, from taking advanced level programs than White students and to what
extent Hispanic students alone may benefit.
Additional Analysis: Hispanic Students
The findings of the additional analysis for Hispanic students are displayed in
Tables 32-38. Table 32 shows the total number of Hispanic students included in the data
set was 865.
A Chi-square Test for Independence was calculated comparing Hispanic students
who participated in advanced level programs and college readiness. The asymptotic
significance (2-sided) for the Chi-square was p < .05 (see Table 35) with an effect size
(Phi Coefficient) of .291 (see Table 36). The significance (2-tailed) for the Pearson
Correlation was p < .01, and the effect size was .236 (see Table 38). This indicates a
small correlation between Hispanic students who participated in advanced level programs
and college readiness. Hispanic Students who participated in advanced level programs
were more likely to be college ready than Hispanic students who did not participate in
advanced level programs.
Table 32
Hispanic Students Total Count
N % Valid % Cumulative %
Valid 1 865 100.0 100.0 100.0

69
Table 33
Case Processing Summary (Chi-square Test for Independence) for Hispanic Students
Cases
Valid Missing Total
N Percent N Percent N Percent
Advanced Courses*
College Ready 865 100.0% 0 0.0% 865 100.0%
Table 34
Advanced Courses College Ready Cross tabulation (Chi-square Test
for Independence) for Hispanic Students
College Ready
Total 0 1
Advanced
Courses
0 Count 93 334 427
% within Advanced
Courses 21.8% 78.2% 100.0%
% within College
Ready 88.6% 43.9% 49.4%
% of Total 10.8% 38.6% 49.4%
1 Count 12 426 438
% within Advanced
Courses 2.7% 97.3% 100.0%
% within College
Ready 11.4% 56.1% 50.6%
% of Total 1.4% 49.2% 50.6%
Total Count 105 760 865
% within Advanced
Courses 12.1% 87.9% 100.0%
% within College
Ready 100.0% 100.0% 100.0%
% of Total 12.1% 87.9% 100.0%

70
Table 35
Chi-square Tests for Hispanic Students
Value df
Asymptotic
Significance
(2-sided)
Exact Sig.
(2-sided)
Exact Sig.
(1-sided)
Pearson Chi-Square 73.495a 1 .000
Continuity Correctionb 71.720 1 .000
Likelihood Ratio 81.955 1 .000
Fisher's Exact Test .000 .000
Linear-by-Linear
Association 73.410 1 .000
N of Valid Cases 865
a. 0 cells (0.0%) have expected count less than 5. The minimum expected count is
51.83.
b. Computed only for a 2x2 table
Table 36
Symmetric Measures for Hispanic Students
Value
Approximate
Significance
Nominal by
Nominal
Phi .291 .000
Cramer's V .291 .000
N of Valid Cases 865

71
Table 37
Descriptive Statistics (Pearson Correlation) for Hispanic Students
Mean Std. Deviation N
College Ready .88 .327 865
Number of Advanced
Courses Taken
4.01 5.729 865
Table 38
Correlations for Hispanic Students
College
Ready
Number of Advanced
Courses Taken
College
Ready
Pearson
Correlation 1 .236**
Sig. (2-tailed) .000
N 865 865
Number of
Advanced
Courses
Taken
Pearson
Correlation .236** 1
Sig. (2-tailed) .000
N 865 865
**. Correlation is significant at the 0.01 level (2-tailed).
Additional Analyses: White Students
The findings of the additional analysis for White students are displayed in Tables
39-45. Table 39 shows the total number of White students included in the data set was
10,270.

72
A Chi-square Test for Independence was calculated comparing White students
who participated in advanced level programs and their college readiness. The asymptotic
significance (2-sided) for the Chi-square was p < .05 (see Table 42) with an effect size
(Phi Coefficient) of .240 (see Table 43). The Sig. (2-tailed) for the Pearson Correlation
was p < .01, and the effect size was .210 (see Table 45). This indicates a small correlation
between White students who participated in advanced level programs and their college
readiness. White students who participate in advanced level programs were more likely to
be college ready than White students who did not participate in advanced level programs.
Table 39
White Students Total Count
Frequency Percent Valid% Cumulative%
Valid 1 10270 100.0 100.0 100.0
Table 40
Case Processing Summary (Chi-square Test for Independence) for White Students
Cases
Valid Missing Total
N % N % N %
Advanced Courses*
College Ready 10,270 100.0% 0 0.0% 10270 100.0%

73
Table 41
Advanced Courses* College Ready Cross tabulation (Chi-square Test for
Independence) for White Students
College Ready
Total 0 1
Advanced
Courses
0 Count 960 4497 5457
% within Advanced
Courses 17.6% 82.4% 100.0%
% within College Ready 87.8% 49.0% 53.1%
% of Total 9.3% 43.8% 53.1%
1 Count 134 4679 4813
% within Advanced
Courses 2.8% 97.2% 100.0%
% within College Ready 12.2% 51.0% 46.9%
% of Total 1.3% 45.6% 46.9%
Total Count 1094 9176 10270
% within Advanced
Courses 10.7% 89.3% 100.0%
% within College Ready 100.0% 100.0% 100.0%
% of Total 10.7% 89.3% 100.0%

74
Table 42
Chi-Square Tests for White Students
Value df
Asymptotic
Significance
(2-sided)
Exact Sig.
(2-sided)
Exact Sig.
(1-sided)
Pearson Chi-Square 589.196a 1 .000
Continuity Correctionb 587.641 1 .000
Likelihood Ratio 666.199 1 .000
Fisher's Exact Test .000 .000
Linear-by-Linear
Association 589.139 1 .000
N of Valid Cases 10270
a. 0 cells (0.0%) have expected count less than 5. The minimum expected count is
512.70.
b. Computed only for a 2x2 table
Table 43
Symmetric Measures for White Students
Value
Approximate
Significance
Nominal by
Nominal
Phi .240 .000
Cramer's V .240 .000
N of Valid Cases 10270

75
Table 44
Descriptive Statistics (Pearson Correlation) for White Students
Mean Std. Deviation N
College Ready .89 .309 10270
Number of Advanced
Courses Taken 3.75 5.598 10270
Table 45
Correlations for White Students
College
Ready
Number of Advanced
Courses Taken
College
Ready
Pearson
Correlation 1 .210**
Sig. (2-tailed) .000
N 10,270 10,270
Number of
Advanced
Courses
Taken
Pearson
Correlation .210** 1
Sig. (2-tailed) .000
N 10,270 10,270
**. Correlation is significant at the 0.01 level (2-tailed).
Additional Analysis: All Subgroups
Table 46 indicates that all subgroups show a correlation between students who
participated in advanced level programs and their college readiness; As indicated in Table
6, the effect sizes were “small” in all cases. Though not significant, Table 46 shows that
Black students benefited slightly more than the other groups.

76
Table 46
Pearson Correlation Value by Subgroup
Race/Ethnicity Pearson Correlation
Students of Color .290
Black/African-American .298
Black/African-American Male .296
Hispanic .236
White .210
Figure 2 represents the percentage of students by subgroups that were college
ready. CR Adv were students who were college ready and participated in advanced
academic programs. In contrast, CR N Adv were students who were college ready and
did not participate in advanced academic programs.

77
Figure 2. Subgroup College Ready Percentage by Program Level
Table 47 provides percentages and raw numbers for these same categories by
subgroups. In some cases, there were large differences in college readiness. For instance,
93% of Black males were college ready when participating in advanced academic
programs, but only 49.2% were college ready when not in advanced academic programs,
a 43.8% difference. This discrepancy is much smaller for White students who were
97.2% college ready when taking advanced courses and 82.4% college ready without
taking advanced courses, a difference of only 14.8%.

78
Table 47
Subgroup College Ready Percentage and Numbers by Program Level
Subgroup
%CR
Adv
%CR
N Adv
# CR
Adv
Total
# CR
Adv
#CR N
Adv
Total
#CR N
Adv
Students of Color 96.1 65.6 714 743 760 1159
Black/African-American 94.4 58.2 288 305 426 732
Black/African-American Males 93 49.2 120 129 242 492
Hispanic 97.3 78.2 426 438 334 427
White 97.2 82.4 4679 4813 4497 5457
Note. CR Adv = college ready and participated in advanced academic programs.
CR N Adv = college ready and did not participate in advanced academic programs.
Summary
This chapter discussed the purpose of the study which was to determine (a) if there was a
relationship and (b) a correlation between advanced academic programs and college
readiness among students in different subgroups. Although both the statistical tests run
(Chi-square Test for Independence and Pearson Correlation) determined statistical
significance and a correlation for students who participated in advanced level programs
and their college readiness, it could not be determined that any one subgroup of students
had a statistically significant benefit more than the others. The effect sizes for the Pearson
Correlation were all close and in the “small” range for correlation between variables.
However, when looking at the data in Table 47, it is clear that although there was a
positive correlation between participation in advanced academic programs and college
readiness for all subgroups, for some cases, namely Black students and specifically Black
males, the benefits can be far greater.

79
CHAPTER 5
SUMMARY, DISCUSSION, AND CONCLUSIONS
Summary of the Study
The purpose of this study was to explore if there was an effect for students of
color who participated in advanced level academic programs in high school as it relates to
college readiness. The researcher compared students of color who participated in
advanced level programs to students of color who did not, as well as White students who
did and did not participate in advanced academics. The specific research problem was
that Black and Hispanic students graduate from high school prepared for college at a
much lower rate than their White counterparts.
The outcome of this study has produced useful information that was relevant to
the school district that was the target of the study. The results of the study can also prove
to be important in the decision making process for other school districts in the state of
Florida as they relates to advanced level programs and opportunities for students of color.
The following research questions directed this study:
1. What relationship, if any, exists between the participation of students of color
in advanced academic programs (AP, IB, DE, AICE, AVID) and their college
readiness?
2. What relationship, if any, exists between Black/African-American students’
participation in advanced academic programs (AP, IB, DE, AICE, AVID) and
their college readiness?

80
3. What relationship, if any, exists between Black/African-American male
students’ participation in advanced academic programs (AP, IB, DE, AICE,
AVID) and their college readiness?
Summary of Methodology
Data collection was completed with the permission of the University of Central
Florida Institutional Review Board and the school district’s Planning, Accountability &
Assessment Office. In order to guarantee the privacy of all students, student names and
identification numbers were removed before the school district turned over the data to the
researcher, and all data were deidentified at the time of receipt. The provided information
consisted of student demographic data which included high school attended, gender, age,
race/ethnicity, and at-risk status. Graduation data consisted of diploma type, GPA, entry
and withdrawal dates and codes, and other data necessary for the researcher to determine
college readiness. Other data provided comprised what courses the student participated
in, the course type (AP, IB, DE, AICE, AVID), and the numbers of each type of course
along with the total number of advanced level courses taken by the student. Students’
testing data were also collected and included within the data set to further assist in
determining the college readiness of each student. Finally, graduation statistics spanning
a five-year period, from 2011 to 2015, were provided to the researcher. Collectively, all
the data permitted the researcher to determine if a student was college ready using the
definitions and guidelines provided in this study. By running a Chi-square Test for
Independence and Pearson Correlation, the researcher was able to categorically determine
by racial/ethnic group that there was a statistically significant relationship between

81
advanced academic programs and college readiness. Additionally, there was a statistically
significant correlation found between advanced academic programs and college readiness
for all subgroups tested in the study.
Discussion of the Findings
Research Question 1
What relationship, if any, exists between the participation of students of color in
advanced academic programs (AP, IB, DE, AICE, AVID) and their college readiness?
Based on the findings of the research, there was a statistically significant
relationship between students of color who participate in advanced academic programs
and college readiness. The results of the Chi-square Test for Independence calculated the
Asymptotic Significance (2-sided) for the Chi-square to be p < .05 with an effect size
(Phi Coefficient) of .357. In addition, the significance (2-tailed) for the Pearson
Correlation was found to be p < .01 with an effect size of .290. These results indicate
there was a statistically significant relationship between the enrollment of students of
color in advanced level courses and their college readiness. The effect size of .290 was
determined to be small for advanced level courses and college readiness for students of
color.
These findings were in line with those of the College Board (2014) noting there is
a distinct educational advantage in terms of college readiness for students who participate
in advanced level courses. Part of the reason why this relationship exists is because
advanced level courses are a way to align high school standards to those that students will
encounter once they enter college (Rice University, 2013).

82
Research Question 2
What relationship, if any, exists between Black students’ participation in
advanced academic programs (AP, IB, DE, AICE, AVID) and their college readiness?
The findings of the research determined that there was a statistically significant
relationship between Black students who participated in advanced academic programs
and college readiness. The results of the Chi-square Test for Independence calculated the
asymptotic significance (2-sided) for the Chi-square to be p < .05 with an effect size (Phi
Coefficient) of .356. Also, the significance (2-tailed) for the Pearson Correlation was
found to be p < .01, and the effect size was .299,indicating a small correlation between
Black students who participated in advanced level programs and college readiness.
In reporting their study, Theokas and Saaris (2013) stated that in 2012, the
College Board found that 72% of Black students nationwide who took the PSAT scored
at a level that would indicate the ability to participate in advanced level coursework.
Additionally, they found that enrolling in advanced level coursework, such as the AP and
IB program, influenced college readiness in the Black students who participated in those
programs. The aforementioned study is in agreement with the findings of this study.
Research Question 3
What relationship, if any, exists between Black male students’ participation in
advanced academic programs (AP, IB, DE, AICE, AVID) and their college readiness?
The findings of this study suggest that there was a statistically significant
relationship between Black male students who participated in advanced academic
programs and college readiness. The Chi-square Test for Independence revealed the
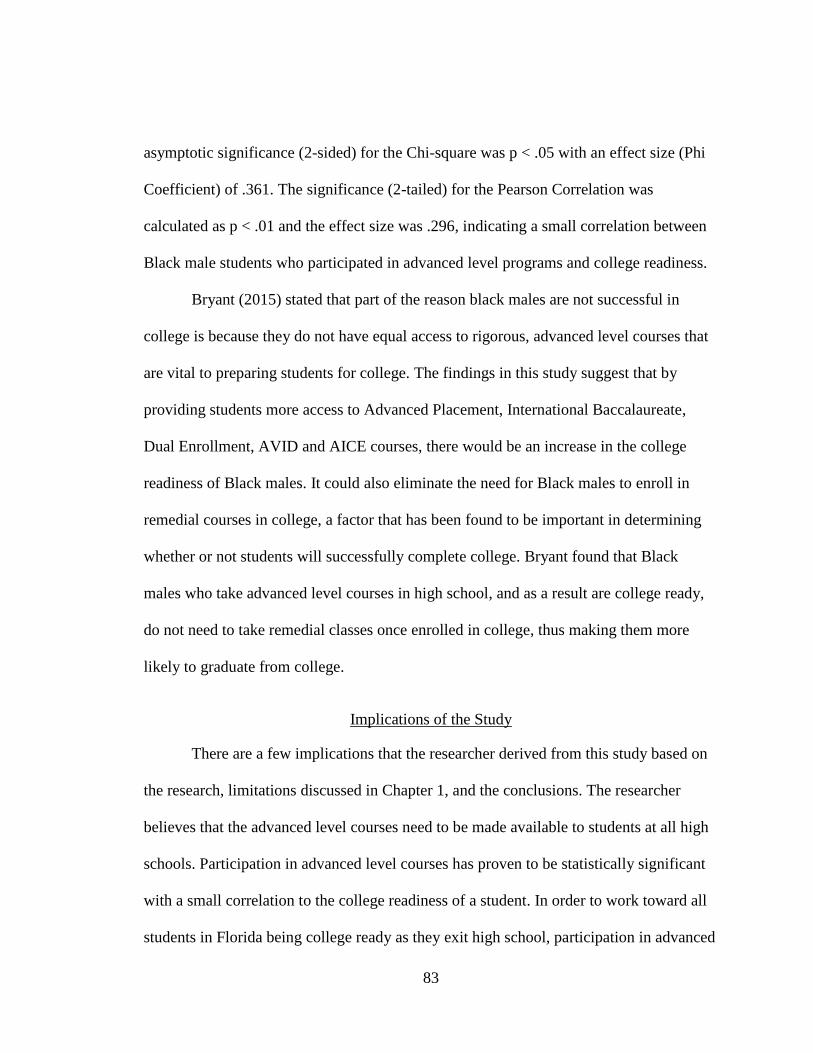
83
asymptotic significance (2-sided) for the Chi-square was p < .05 with an effect size (Phi
Coefficient) of .361. The significance (2-tailed) for the Pearson Correlation was
calculated as p < .01 and the effect size was .296, indicating a small correlation between
Black male students who participated in advanced level programs and college readiness.
Bryant (2015) stated that part of the reason black males are not successful in
college is because they do not have equal access to rigorous, advanced level courses that
are vital to preparing students for college. The findings in this study suggest that by
providing students more access to Advanced Placement, International Baccalaureate,
Dual Enrollment, AVID and AICE courses, there would be an increase in the college
readiness of Black males. It could also eliminate the need for Black males to enroll in
remedial courses in college, a factor that has been found to be important in determining
whether or not students will successfully complete college. Bryant found that Black
males who take advanced level courses in high school, and as a result are college ready,
do not need to take remedial classes once enrolled in college, thus making them more
likely to graduate from college.
Implications of the Study
There are a few implications that the researcher derived from this study based on
the research, limitations discussed in Chapter 1, and the conclusions. The researcher
believes that the advanced level courses need to be made available to students at all high
schools. Participation in advanced level courses has proven to be statistically significant
with a small correlation to the college readiness of a student. In order to work toward all
students in Florida being college ready as they exit high school, participation in advanced

84
level courses need to be offered and encouraged. A study conducted by Chajewski,
Mattern, and Shaw (2011) also strengthens what the researcher’s results showed: There is
a direct link between participation in AP courses and an increase in SAT scores. SAT
scores are an integral part of the college readiness calculation in the state of Florida.
In addition to making advanced level courses available in all high schools, school
districts should also look to use existing programs as advanced level courses. Although
AVID may not generally be seen as a program that offers students an opportunity at the
advanced level track while in school, the school district used in the study utilizes AVID
as an academically advanced level program. All students who participate in AVID must
also, as a requirement, take advanced level courses in all core subject areas. Other school
districts could follow the model of the sampled school district to increase the advanced
level courses available to students by using many of the existing programs that they may
already have in place.
Schools and their respective districts can place an emphasis on at-risk students
and students of poverty and offer them more opportunities to pursue advanced level
academic programs. In practice, teachers should hold the same expectations for students
of all races and income levels, as this will increase the overall number of students who
are college ready when exiting high school. It can be argued that early and frequent
exposure to advanced academics offers students a better chance at college readiness and
success. Therefore, schools should begin to expose students of color to advanced
academics as early as elementary school and provide them with the organization and
skills necessary to succeed.

85
Recommendations for Future Research
This study examined the relationship between participation in advanced level
courses and college readiness. Suggested recommendations for future research include:
1. Expanding the scope of this study to other school districts in the state of
Florida to see if the results in this school district of minority students who
participate in advanced academic programs are, in fact, similar across the state
of Florida.
2. Expanding this study to include students who take advanced level courses in
middle school as well as high school to see if such an expansion increases the
likelihood of students being college ready.
3. Conducting a national study to examine if participation in advanced level
coursework increases the probability of being considered college ready across
the United States.
4. Investigating participation in only one type of advanced level course (i.e. AP)
to determine if such participation leads to an increase in being considered
college ready as compared to students who only participated in another type of
advanced level courses (i.e. IB). This proposed study could also consider if
students who participated in more than one type of advanced academic
program were more often college ready than students who only participated in
one type of advanced academic program.
5. Examining if the number of advanced level courses a student takes impacts
college readiness. Are students who take between one and five advanced level

86
courses college ready at the same rate as those who take between six and ten
advanced level courses?
6. Giving consideration to the utilization of a qualitative approach which may
yield additional insights and lead to a more comprehensive understanding of
the relationships among the variables.
7. Investigating further how AP and other advanced level programs differ based
on school and location. There are no clear standards and expectations in all
cases for these programs. Depending on the teachers’ ideas of rigor and
expectations of students, the level of rigor can vary greatly.
Conclusion
This study was primarily conducted to determine if there was a relationship that
exists between students of color who participated in advanced academic programs and
college readiness. All students in this study were from a school district located in
Northeast Florida. Based on the analysis of the data collected and a review of the
associated literature, the researcher was able to ascertain the following conclusions:
1. It was found that there was a statistically significant relationship between
students of color who participated in advanced academic programs (AP, IB,
DE, AICE, AVID) and their college readiness.
2. It was found that there was a statistically significant relationship between
Black students who participated in advanced academic programs (AP, IB, DE,
AICE, AVID) and their college readiness.

87
3. It was found that there was a statistically significant relationship between
Black male students who participate in advanced academic programs (AP, IB,
DE, AICE, AVID) and their college readiness.
In summary, this study resulted in data that can be used by the target school
district as well as other school districts, gaining additional insight into the effect that
advanced academic programs have on students of color and their college readiness.
Adopting and maintaining advanced academic programs for all students should be a focus
of all school districts. School districts should be cognizant that their direct attention to
increasing the number of students of color participating in advanced academic programs
has the potential to have a substantial positive effect on their college readiness, as seen in
Figure 2. Students of color who took advanced courses were college ready at a rate of
96.1%, as opposed to students of color who did not and were college ready at a rate of
65.6%. This represents a difference of 30.5% between readiness of the two groups.
Results of existing research and those of the current study indicated that students of color
need more access to advanced academic programs. It can be argued that participation in
advanced academic programs has a substantial and profound effect on the number of
students of color who are college ready at the end of high school.

88
APPENDIX
INSTITUTIONAL REVIEW BOARD APPROVAL

89

90
REFERENCES
ACT (2010). Mind gaps: How college readiness narrows achievement gap in college
success. ACT.
ACT (2012). Catching up on career and college readiness. ACT, 1-12.
ACT. (2015). ACT 2015 Annual Report. Retrieved
from http://www.act.org/content/dam/act/unsecured/documents/AnnualReport201
5.pdf
ACT (2016). About us. Retrieved from: http://www.act.org/content/act/en/about-act.html
Anderson, J. (2010). Closing the achievement gap on ACT and SAT. Educational
Partnership.
Ari, B.P. (2015). The role of academic motivation and engagement on the relationship
between dual enrollment and academic performance. Journal of Higher,
Education, 86(1), 98-126.
AVID. (2016). FAQ – Frequently asked questions. Retrieved from http://www.avid.org/
Barnard-Brak, L., McGaha-Garnett, V., & Burley, H. (2011). Advanced Placement
course enrollment and school-level characteristics. NASSP Bulletin, 95(3), 165-
174.
Bernhardt, P.E. (2013). The Advanced via Individual Determination (AVID) program:
Providing cultural capital and college access to low income students. School
Community Journal, 23(1), 202-222.

91
Blazer, C. (2011). M-DCPS student performance in International Baccalaureate and
Cambridge Advanced International Certificate of Education programs. Miami-
Dade County Public Schools Research Brief, 1102(1).
Borland, J.H. (2004). Issues and practices in the identification and education of gifted
students from under-represented groups. Storrs, CT: The National Research
Center of the Gifted and Talented.
Bramucci, M. (2014). The Early college high school model as a means of reducing or
eliminating the achievement gap for students from traditionally underrepresented
populations. (Doctoral dissertation). Widener University, Wilmington, DE.
Bryant, R. (2014, October). College preparation for African-American students: Gaps in
the high school educational experience. Paper prepared for the Annual
International colloquium on Black Males in Education, Atlanta, GA.
Bunnell, T. (2011). The International Baccalaureate in the United States: From relative
inactivity to imbalance. The Educational Forum, 75(1), 66-79.
Byrd, S. (2007). Advanced Placement and International Baccalaureate: Do they deserve
gold start status? Washington, DC: Fordham Institute.
Chambers, T.V., Huggins, K.S., Locke, L.A., & Fowler, R.M. (2014). Between a “ROC”
and a school place: The role of “racial opportunity cost” in the educational
experiences of academically successful students of color. Educational Studies:
Journal of the American Educational Studies Association, 50(5), 464-497
Chajewski, M., Mattern, K.D., & Shaw, E.J. (2011) Examining the role of Advanced

92
Placement exam participation in 4-year college enrollment. Educational
Measurement: Issues and Practice, 30 (4), p. 16-27
College Board (2014). 10 years of Advanced Placement exam data show significant gains
in access and success; Areas for improvement. Retrieved from
https://www.collegeboard.org/releases/2014/class-2013-advanced-placement-
results-announced
College Board (2016a). Meet the new SAT. Retrieved from:
https://collegereadiness.collegeboard.org/sat
College Board (2016b). Resources for parents and families. Retrieved from
https://apstudent.collegeboard.org/exploreap/for-parents
Contreras, F. (2011). Strengthening the bridge to higher education for academically
promising underrepresented students. Journal of Advanced Academics, 22(3),
500-526.
Cunningham, M., Corprew, C.S. III, & Becker, J.E. (2009). Association of future
expectations, negative friends, and academic achievement in high-achieving
African American adolescents. Urban Education, 44(3), 280-296.
Deli-Amen, R., Tevis, T.L. (2010). The relevance of standardized college entrance exams
for low socio-economic high school students. The Review of Higher Education,
33(2), 141-175.
Estacion, A., Cotner, B.A., D’Souza, S., Smith, C.A., & Borman, K.M. (2012). Who
enrolls in dual enrollment and other accelerated programs in Florida high schools?
Issues & Answers, 119(1).

93
Florida Department of Education (2011). Florida’s guide to public school high school
graduation. Retrieved from:
http://www.fldoe.org/core/fileparse.php/3/urlt/1112hs-brochure.pdf
Florida Department of Education. (2015a). College and career readiness. Retrieved from:
http://www.fldoe.org/schools/higher-ed/fl-college-system/college-career-
readiness.stml
Florida Department of Education. (2015b). Common place testing. Retrieved from:
http://www.fldoe.org/schools/higher-ed/fl-college-system/common-placement-
testing.stml
Florida Department of Education. (2016a). Enrollment report. Retrieved from:
http://www.fldoe.org/accountability/data-sys/edu-info-accountability-services/pk-
12-public-school-data-pubs-reports/school/index.stml
Florida Department of Education. (2016b). FCAT 2.0 Historical. Retrieved from
http://www.fldoe.org/accountability/assessments/k-12-student-assessment/history-
of-fls-statewide-assessment/fcat-2-0/index.stml
Florida Department of Education. (2016c). Florida standards assessments. Retrieved
from: http://www.fldoe.org/accountability/assessments/k-12-student-
assessment/fsa.stml
Florida Department of Education. (2016d). School grades. Retrieved from
http://schoolgrades.fldoe.org/
Gill, S., & Reynolds, A.J. (1999). Educational expectations and school achievement of
urban African American children. Journal of School Psychology, 37(4), 403-424.

94
Glock, S., Krolack-Scherwdt, S., & Pit-ten Cate, I.M. (2015). Are school placement
recommendations accurate? The effects of students’ ethnicity on teachers’
judgement and recognition memory. European Journal of Psychology of
Education, 3(2), 159-188.
Hallet, R.E., & Venegas, K.M. (2011). Is increased access enough? Advanced Placement
courses, quality and success in low-income urban schools. Journal for the
Educational of the Gifted. 34(3), 468-487.
Harvey, D.W. (2013). Gaps in college readiness: ACT and SAT differences by ethnicity
across 10 school years (Unpublished doctoral dissertation). Sam Houston State
University, Huntsville, TX.
Hill, I. (2012). An international model of world-class education: The International
Baccalaureate. Prospects, 42(3), 341-359.
Hoover, N. (2007). Cultural disparity of SAT scores and the influence on high education
opportunities for African-American and Latino students (Master thesis). Retrieved
from ERIC (ED499158).
Huerta, J., Watt, K.M., & Reyes, P. (2013) An examination of AVID graduates’ college
preparation and post-secondary progress: Community college versus 4-year
university students. Journal of Hispanic Higher Education, 12(1), 86-101.
Iatarola, P., Conger, D., & Long, M. C. (2011). Determinants of high
schools’ advanced course offerings. Educational Evaluation and Policy Analysis,
33, 340–359. Retrieved from
http://epa.sagepub.com.ezproxy.net.ucf.edu/content/33/3/340.full.pdf
95
Illinois Student Assistance Commission. (2016). Definition of minority students.
Retrieved from: https://www.isac.org/students/during-college/types-of-financial-
aid/scholarships/minority-student-definition.html
Jenck, C., & Phillips, M. (1998). The black-white test score gap. Washington, DC:
Brookings Institution Press.
Kerr, R. (2014). “Advanced classes? They’re only for White kids”: How one Kansas
school is changing the face of honors and advanced placement courses. Action in
Teacher Education, 36, 480-489. doi:10.1080/01626620.2014.977748
Kuman, R., Karabecnick, S., & Burgoon, J. (2015). Teacher’s implicit attitude, beliefs
and the mediating role of respect and cultural responsibility on mastery and
performance-focused instructional practices. Journal of Educational Psychology,
107(2), 533-545.
Kyburg, R., Hertzberg-Davis, H., & Callahan, C. (2007). Advanced Placement and
International Baccalaureate programs: Optimal learning environment for talented
minorities? Journal of Advanced Academics, 18(2), 175-215.
Maranto, J.H. (2015). The effects of standardized testing on historical literacy and
educational reform in the United States (Doctoral dissertation). Retrieved from
ERIC (EJ1062724).
McKillip, P.E. (2013). A closer examination of the academic benefits of AP. The
Journal of Educational Research, 106(4), 305-318.

96
O’Connor, C., Mueller, J., Lewis, R.L., Rivas-rake, D., & Rosebnery, S. (2011). “Being”
black and strategizing for excellence in a racially stratified academic hierarchy.
American Educational Research Journal, 48(6), 1232-1257.
Olszewski-Kuilius, P., & Clarenbach, J. (2012). Unlocking emerging talent: Supporting
high achievement of low income, high-ability students. Washington, DC: National
Association for Gifted Children.
Pallant, J. (2013). SPSS survival manual (5th ed.). New York: McGraw-Hill.
Pathways to College Network. (2007). High expectations: A key to success for all.
Retrieved from: files.eric.ed.gov/fulltext/ED509544.pdf
Presley, J., & Gong, Y. (2005). The demographics and academics of college readiness in
Illinois. Edwardsville, IL: Illinois Education Research Council.
Pretlow, J., & Wathington, S. (2014) Expanding dual enrollment: Increasing post-
secondary access for all? Community College Review, 42(1).
Rice University (2016). AP and college readiness. Retrieved from
http://collegeready.rice.edu/ap-and-college-readiness
Roderick, M., Nagaoka, J., & Coca, V. (2009). College readiness for all: The challenge of
urban high schools. Future of Children, 19(1), 185-210.
Ross, T., Kena, G., Rathburn, A., KewalRamani, A., Zhang, J., Kristapovich, P., &
Manning, E., (2012). Higher education: Gaps in access and persistence study.
Washington, DC: National Center for Education Statistics.

97
Sismey, V., Shaw, S. & Barnhill, J. (2012). College readiness and Cambridge
international examinations: What can the research show us and what does it
really mean? Washington, DC: AACRO.
Sohn, K. (2011). Acting white: A critical review. The Urban Review, 43(2), 217-243.
Spencer, M.B., Noll, E., Stoltzfus, J., & Harpalani, V. (2001). Identity and school
adjustment: Revisiting the “acting white” assumption. Educational Psychologist,
36(1), 21-30.
Stetser, M.C., & Stillwell, R. (2014). Public high school four-year on-time graduation
rates and event dropout rates: School years 2010-11 and 2011-12. Washington, DC:
National Center for Education Statistics.
Tabachnick, B. G., & Fidell, L. S. (2007). Using multivariate statistics (5th ed.). Boston:
Pearson.
Theodore Cross Family Charitable Foundation. (2005). The widening racial scoring gap
on standardized tests for admission to graduate school. The Journal of Blacks in
High Education, 9(1), 88-93.
Theokas, C., & Saaris, R. (2013). Finding America’s missing AP and IB students. The
Educational Trust, June, 1-14.
University of Central Florida. (2016). Dual enrollment and early admission. Retrieved
from: https://admissions.ucf.edu/dual-enrollment-and-early-admission/
U.S. Department of Education [USDOE]. (2015a). No child left behind. Retrieved from
http://www2.ed.gov/nclb/landing.jhtml
98
U.S. Department of Education [USDOE]. (2015b). Title 1 – Improving the academic
achievement of the disadvantaged. Retrieved from
http://www2.ed.gov/policy/elsec/leg/esea02/pg1.html
Vega, D., Moore, J.L. III, & Miranda, A.H. (2015). Who really care? Urban youths’
perceptions of parental and programmatic support. School Community Journal
25(1), 53-72.
Walden, L.A., & Kristsonis, W.A. (2008) The impact of the correlation between the No
Child Left Behind Act’s high stakes testing and the high drop-out rate among
minority students. National Journal for Publishing and Mentoring Doctoral
Student Research, 5(1), 1-6.
White, S., & Tesfaye, C.L. (2011). Under-represented minorities in high school physics.
Focus On. Retrieved from
https://www.aip.org/sites/default/files/statistics/highschool/hs-underrepmin-
09.pdf
Wildhagen, T. (2012). How schools and teachers contribute to racial differences in the
realization of academic potential. Teachers College Record, 114(7), 1-27.
Wyatt, J.N, Patterson, B.F., & DiGiacomo, F.T. (2015) A comparison of the college
outcomes of advanced placement and dual enrollment students. New York:
College Board

99
Zwick, R. (2007) College admission testing. Arlington, VA: National Association for
College Admission Counseling. Retrieved from
http://www.nacacnet.org/research/research-
data/nacacresearch/documents/standardizedtesting.pdf