Embed Size (px)
Citation preview

Real Estate Assessments Division
Prince
William
County ,
Virginia

Finance Department
Real Estate Assessments Division
Prince William County, Virginia
BOARD OF COUNTY SUPERVISORS
Sean T. Connaughton Chairman at-large
L. Ben Thompson
Brentsville District
Mary K. Hill Coles District
Maureen S. Caddigan
Dumfries District
Edgar S. Wilbourn, III Gainesville District
Vice Chariman
John D. Jenkins Neabsco District
Ruth T. Griggs
Occoquan District
Hilda M. Barg Woodbridge District
COUNTY EXECUTIVE
Craig S. Gerhart
Finance Department Real Estate Assessments Division Organization Chart as of July 1, 2001
Director of Finance Christopher E. Martino, CPA
Real Estate Assessments Division Chief Vacant (Allison Lindner, Acting)
Secretary Diane Honeycutt
Assessments Coordinator Vacant
Assessment Support Supervisor Allison Lindner
Appraiser II Supervising
Kimberly A. Lorenz, RES
Appraiser II Supervising
John E. Malone, RES
Appraiser II Supervising
Kerem Oner, CAE
Appraiser II Supervising
Vacant
Account Clerk II Delories Goodman
GIS Analyst Debra Watson-Grady
Account Clerk III Pam Morehead
Title Clerk Elizabeth Rector
Account Clerk II Theresa Harris
Financial Systems Analyst I (OIT)
Janet Barrett
Data Entry Clerk Barbara Hill
Title Clerk LaPointe Crismond
Appraiser I Ken Baxter
Appraiser I Mildred Norris
Appraiser Trainee Lenny Kim
Appraiser I Wesley Riggins
Appraiser Trainee Alvaro Delgado
Appraiser Trainee Petra Svenhager
Appraiser Trainee Susan Spicer
Appraiser Trainee Victor Molina
Appraiser I Clayton Loushay
Appraiser I Charlie Tolbert
Appraiser Trainee Lisa Manning
Appraiser Trainee Michael Shannon
Appraiser Trainee Bridget Affeldt
Appraiser Trainee Mick Majdi
Appraiser Trainee Linda Morey
Assistant Director of Finance Steve Ferlotti
Real Estate Assessments Division 2001 Annual Report
i
TABLE OF CONTENTS INTRODUCTION ...........................................................................................................................................................1 FUNCTIONS OF THE REAL ESTATE ASSESSMENTS OFFICE .............................................................................2
MAINTAINING PROPERTY RECORDS ................................................................................................................................2 REASSESSING EXISTING PROPERTIES...............................................................................................................................3
Collection of Data ...................................................................................................................................................4 Analysis of Data ......................................................................................................................................................5 Application of Results..............................................................................................................................................5 Performance Measurement ......................................................................................................................................6
ASSESSING NEW CONSTRUCTION....................................................................................................................................7 FACILITATING ASSESSMENT NOTIFICATION AND APPEAL .................................................................................................8
Assessment Notification ...........................................................................................................................................8 Appeal Procedures ..................................................................................................................................................9 Appeal Adjustments .................................................................................................................................................9
ADMINISTERING REAL ESTATE TAX RELIEF PROGRAMS .................................................................................................10 Tax Relief for the Elderly and Disabled .................................................................................................................10 Tax Relief Based on Use Value Assessment............................................................................................................12 Partial Tax Exemption for Rehabilitated Real Estate .............................................................................................13
PROVIDING CUSTOMER SERVICE...................................................................................................................................14 Walk-in Customers.................................................................................................................................................14 Telephone Requests From Real Estate Professionals .............................................................................................14 Telephone Requests From Citizens and Public Agencies........................................................................................14 Internet Access ......................................................................................................................................................15
REAL ESTATE VALUES.............................................................................................................................................16 LANDBOOK VALUES: GROWTH AND APPRECIATION.......................................................................................................17 RESIDENTIAL ...............................................................................................................................................................18 APARTMENTS ..............................................................................................................................................................21 COMMERCIAL AND INDUSTRIAL ....................................................................................................................................22
Locally-Valued Properties .....................................................................................................................................22 State-Valued Public Service Properties..................................................................................................................22
UNDEVELOPED LAND ...................................................................................................................................................24 SUPPLEMENTAL ASSESSMENTS .....................................................................................................................................25 TAX-EXEMPT PROPERTIES............................................................................................................................................26
STATISTICAL APPENDIX........................................................................................................................................A-1 TABLE 1: HISTORY OF PROPERTY RECORD MAINTENANCE ACTIVITY ...........................................................................A-3 TABLE 2: HISTORY OF TAX RELIEF FOR THE ELDERLY AND DISABLED ..........................................................................A-3 TABLE 3: HISTORY OF APPEALS ACTIVITY ..................................................................................................................A-3 TABLE 4: HISTORY OF ADJUSTMENTS .........................................................................................................................A-3 TABLE 5: USE VALUE ASSESSMENT SUMMARY ............................................................................................................A-4 TABLE 6: AVERAGE ASSESSED VALUE HISTORY OF RESIDENTIAL PROPERTY ................................................................A-5 TABLE 7: ASSESSED VALUES AND ESTIMATED MARKET VALUES..................................................................................A-6 TABLE 8: HISTORY OF THE REAL ESTATE TAX BASE ....................................................................................................A-8 TABLE 9: PUBLIC SERVICE AND COMMERCIAL/INDUSTRIAL ASSESSMENTS....................................................................A-9 TABLE 10: ASSESSMENT PERFORMANCE STATISTICS .................................................................................................A-10 TABLE 11A: GROWTH AND APPRECIATION ...............................................................................................................A-11 TABLE 11B: HISTORY OF APPRECIATION RATES ........................................................................................................A-12 TABLE 11C: HISTORY OF GROWTH RATES ................................................................................................................A-12 TABLE 12: TOP FIFTY REAL ESTATE TAXPAYERS—FY2001 ......................................................................................A-13 TABLE 13: TAX RATES .............................................................................................................................................A-14
ADDENDA...................................................................................................................................................................B-1 ADDENDUM A: SAMPLE NOTICE OF REASSESSMENT ....................................................................................................B-3 ADDENDUM B: REHABILITATED REAL ESTATE PROGRAM ............................................................................................B-5 ADDENDUM C: TAX RELIEF PROGRAMS ......................................................................................................................B-7

Real Estate Assessments Division 2001 Annual Report
ii
ADDENDUM D: SAMPLE TAX BILL ..............................................................................................................................B-9
Real Estate Assessments Division 2001 Annual Report
1
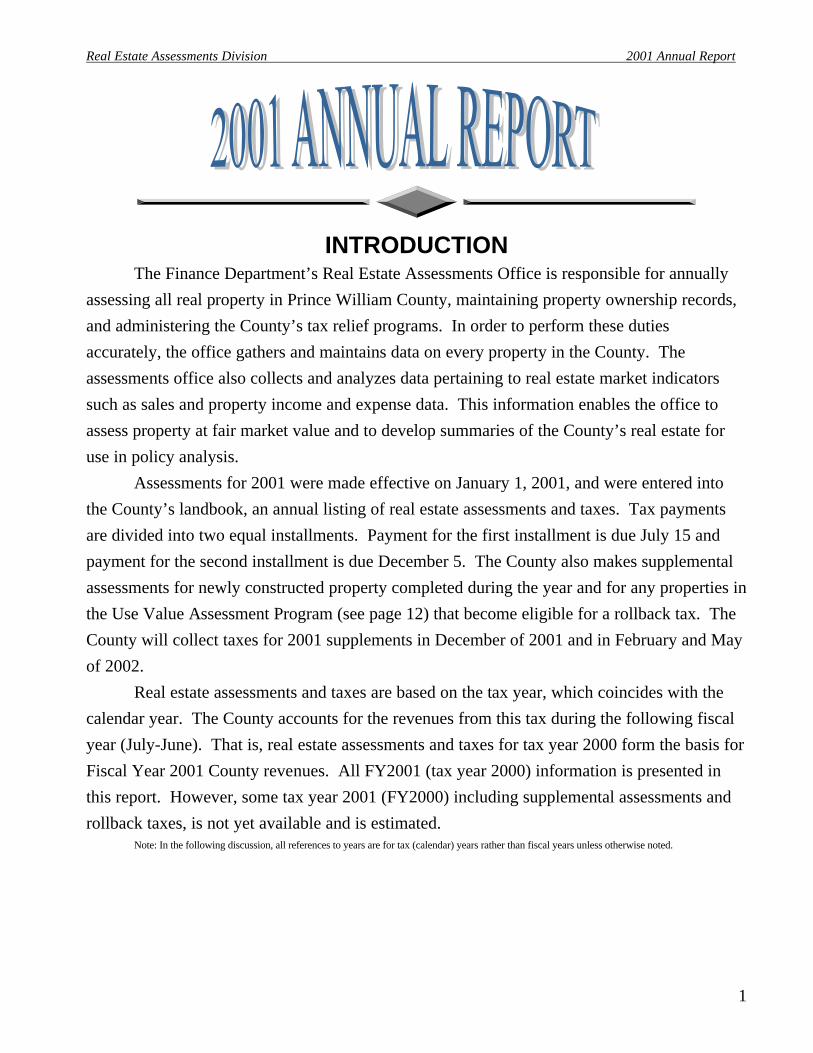
INTRODUCTION
The Finance Department’s Real Estate Assessments Office is responsible for annually assessing all real property in Prince William County, maintaining property ownership records, and administering the County’s tax relief programs. In order to perform these duties accurately, the office gathers and maintains data on every property in the County. The assessments office also collects and analyzes data pertaining to real estate market indicators such as sales and property income and expense data. This information enables the office to assess property at fair market value and to develop summaries of the County’s real estate for use in policy analysis.
Assessments for 2001 were made effective on January 1, 2001, and were entered into the County’s landbook, an annual listing of real estate assessments and taxes. Tax payments are divided into two equal installments. Payment for the first installment is due July 15 and payment for the second installment is due December 5. The County also makes supplemental assessments for newly constructed property completed during the year and for any properties in the Use Value Assessment Program (see page 12) that become eligible for a rollback tax. The County will collect taxes for 2001 supplements in December of 2001 and in February and May of 2002.
Real estate assessments and taxes are based on the tax year, which coincides with the calendar year. The County accounts for the revenues from this tax during the following fiscal year (July-June). That is, real estate assessments and taxes for tax year 2000 form the basis for Fiscal Year 2001 County revenues. All FY2001 (tax year 2000) information is presented in this report. However, some tax year 2001 (FY2000) including supplemental assessments and rollback taxes, is not yet available and is estimated.
Note: In the following discussion, all references to years are for tax (calendar) years rather than fiscal years unless otherwise noted.

Real Estate Assessments Division 2001 Annual Report
2
FUNCTIONS OF THE REAL ESTATE ASSESSMENTS OFFICE
The Real Estate Assessments Office performs the following key functions:
• Maintains property records • Reassesses existing properties • Assesses new construction • Facilitates assessment notification and appeal • Administers real estate tax relief programs • Provides customer service
Maintaining Property Records
The assessments office is responsible for determining taxable ownership of property. This requires interpreting all legal documents relating to real estate. The documents (deeds, plats, wills, court orders, etc.) are recorded by the Clerk of Circuit Court and contain information regarding transfers, consolidations, subdivisions, and other legal changes.
After reading each document, the assessments office determines whether it affects the taxable ownership, size, or configuration of the properties. If it does, the assessments office makes necessary changes to property records. In some cases, deeds conflict with County records. The assessments office coordinates with settlement attorneys and the Geographic Information Service section of the Office of Information Technology to clarify and correct the deeds. This process ensures up-to-date records with accurate legal descriptions.
There are four types of documents and transactions handled by the assessments office:
1. Wills – instruments recorded upon the death of an individual. They may or may not transfer real estate.
2. New Lots – parcels that are created from a subdivision of existing land. 3. Deeds – instruments recorded that may or may not transfer real estate. One deed
may transfer no parcels or several hundred parcels. 4. Transfers – legal changes in ownership of property.

Real Estate Assessments Division 2001 Annual Report
3
As the following table shows, property maintenance activity increased from FY2000 to FY2001. A more detailed history of property record maintenance activity is shown in the Statistical Appendix, Table 1, page A-3.
Property Record Maintenance Activity
Comparison of Property Record Maintenance Activity
Reassessing Existing Properties
State law requires all Virginia counties to reassess real estate at least every four years, with annual and biennial assessments authorized. Prince William County has performed annual assessments of property since l979, when computerization made this feasible. Tax policy publications recommend annual reassessment because assessments at longer intervals may result in large disparities and inequities between properties, especially during periods of rapid changes in the real estate market.
0
2,000
4,000
6,000
8,000
10,000
12,000
14,000
16,000
18,000
FY 1999 FY 2000 FY 2001
Nu
mb
er o
f O
ccu
ren
ces
Wills
New Lots
Deeds
Transfers
FY 1999 FY 2000 FY 2001
Wills 520 550 580 New Lots 2,130 3,189 3,867 Deeds 12,120 12,941 16,100 Transfers 14,243 14,831 16,652

Real Estate Assessments Division 2001 Annual Report
4
Regular reassessment helps maintain equity between properties as market conditions change. Maintaining equity is a primary goal in the assessment of real estate for tax purposes. The standard for all assessments in Virginia is established in the Virginia Constitution, which requires assessment at “fair market value” as of January 1 of each year. The only exception to this requirement is for certain agricultural, forestal, horticultural, and open space property in the Use Value Assessment Program (see page 12). To perform equitable assessments, the assessments office must gather accurate and consistent property information and perform proper analyses of sales and other market indicators.
Collection of Data
The assessments office collects information on property descriptions, sales, income, expenses, and other real estate market data. To ensure property descriptions are accurate, County assessors periodically inspect properties and verify current data. Property characteristics are relatively stable, and physical inspections of each property are not necessary every year. However, physical characteristics such as condition do change slowly over time, and properties are reviewed approximately every five years to ensure appraisals are based on accurate information.
Income and sales data are the primary data sources for establishing the value of real estate. However, only a fraction of the total properties in the County sell each year. These sales are used as the basis for valuing most properties in the County. As a result, errors in sale data can affect many properties. Because inaccurate sales information can lead to incorrect conclusions about property values, sales must be reviewed to verify the physical and financial circumstances that led to a particular sale price. This review may include a physical inspection of the property to confirm its physical and economic characteristics. The review may also include contact with the buyer, seller, or other persons involved in the transaction to verify the presence and amount of unusual financial terms that may have affected the sale price. To aid in valuing commercial and industrial property using the income approach, the assessments office collects income and expense information from commercial property owners.
Real Estate Assessments Division 2001 Annual Report
5
Analysis of Data
The assessments office analyzes the information about market activity (sales, income, etc.) and values property based on the real estate market. Properties are reassessed each year. Therefore, each year the most recent sales, income information, and other market factors are studied and values are re-assessed according to the current real estate market.
Application of Results
Appraisers use several approaches to value property for assessment purposes. These approaches are discussed below.
Cost Less Depreciation In the cost less depreciation approach, the value of the structure is estimated and added
to the value of the land. The structure value is determined by first estimating the cost to replace the building with a new one, and then subtracting depreciation, which makes the existing building worth less than the cost of a new one. Depreciation can be caused by physical deterioration, functional obsolescence (poor functional design), or by economic obsolescence (effects of factors outside the property such as high traffic).
Sales Comparison The sales comparison approach is based on comparing a property with similar properties
that have sold. In this approach, several similar properties with recent sales are selected. Each of the sale prices is adjusted for differences between the property that sold and the subject property. This gives an indication of what each of the buyers would likely have paid for their property had it been identical to the subject property.
Income Capitalization The income capitalization approach assumes that there is a relationship between the net
operating income of a property and its value. In this approach, the effective gross income of a property is estimated by considering market rents, vacancy rates, and collection losses. Estimated normal operating expenses are deducted to generate an estimate of net operating income. This income is capitalized into an estimate of value by application of an appropriate market capitalization rate.
Real Estate Assessments Division 2001 Annual Report
6
Statistical Estimation Statistical estimation methods are often considered part of the sales comparison
approach because they utilize sales of property. In this approach, sales of property are utilized in statistical processes such as multiple regression and adaptive estimation to generate models of the real estate market. These models are extremely sensitive to the quality, quantity, and accuracy of available data. The assessments office uses statistical estimation where adequate data is not available to support other approaches to value.
Performance Measurement
The tool used to measure the accuracy of assessments is the assessment-to-sale ratio, which is calculated by dividing the assessment by the selling price. For example, a single family home assessed for $152,000 that sells for $160,000 has an assessment-to-sale ratio of 95%. This ratio is calculated for all valid sales in the County and is used to monitor the level and equity of assessments. The median assessment-to-sale ratio is called the level of assessment. The median (midpoint of arrayed ratios) is used so that extreme ratios affect it only minimally. For tax year 2000 sales, the median level of assessment is estimated to be 88.97%.
The County’s 2000 level of assessment is calculated by comparing January 1, 2000 assessed values to sales that occurred during calendar year 2000. Sale prices increased during the year due to the rising real estate market and inflation. Assessments, however, do not change during the year. On January 1, 2000, the assessments were closer to the sale prices than the level of assessment indicates. The median level of assessment, however, is the only performance statistic published by the State and is therefore provided as an indication of the accuracy of assessments.
Equity of assessments is measured using average error. The average error is the average percentage each sale deviates from the level of assessment. A small average error indicates individual ratios are relatively close to the level of assessment. A large average error indicates ratios vary greatly. For tax year 2000 sales, the estimated average error is 7.48%.

Real Estate Assessments Division 2001 Annual Report
7
The following table shows the assessment level and error for 1999 and 2000. A more detailed summary is in the Statistical Appendix, Table 10, page A-10.
Assessment Performance
* Insufficient sales. Note: Performance data for 1999 is provided in the State Department of Taxation’s Sales Ratio Study. The 2000 report from the State will
be published in February of 2002. Performance data for 2000 are therefore estimated by the assessments office based on 2000 sales. For 2001, there is not enough information available to make an estimate.
Assessing New Construction
During the year, the Real Estate Assessments Office receives copies of building permits issued by the County for new structures, additions to buildings, and remodeling of buildings. The assessments office periodically checks the progress of activity indicated on the permits. New construction requires field inspections for accurate measurements and examination. The following tables show the number and estimated dollar amount of permits issued by the County in FY1999, FY2000, and FY2001.
Number of Permits Issued for Structures and Additions
Source: Department of Public Works Note: Only taxable properties are included in the counts above.
FY 1999 FY 2000 FY 2001
New Residential 3,207 3,404 4,049Residential Additions, etc. 3,789 4,241 4,718New Non-Residential 70 61 60Non-Residential Additions, etc. 464 400 485
Total 7,530 8,106 9,312
----------------------Level------------------------- ----------------------Error--------------------
1999 2000 1999 2000Residential 92.71% 88.98% 6.65% 7.22%Apartments * * * *Commercial and Industrial 92.17% 87.87% 24.59% 26.83%Undeveloped Land * * * *Overall 93.04% 88.97% 7.06% 7.48%

Real Estate Assessments Division 2001 Annual Report
8
Estimated Dollar Amount of Permits Issued for Structures and Additions
Source: Department of Public Works Note: Only taxable properties are included in the amounts above. * The large increase in the estimated dollar amount of New Non-Residential Construction Permits for FY2001 was due to significant
increases in office, industrial, and recreation space.
History of Estimated Dollar Amount of Permits Issued
Facilitating Assessment Notification and Appeal
Assessment Notification
Section 58.1-3330 of the Code of Virginia requires the County to notify property owners whenever reassessment results in an increase in assessed value. The County has chosen to notify all property owners of reassessment, even if there was a reduction or no change in the value. This notification takes place around March 1 of each year and advises the
FY 1999 FY 2000 FY 2001New Residential 323,384,751$ 381,428,291$ 469,328,572$
Residential Additions, etc. 22,724,777 28,931,585 33,698,391
New Non-Residential* 146,303,734 51,459,076 134,661,716 Non-Residential Additions, etc. 18,062,103 22,292,023 34,394,686
Total 510,475,365$ 484,110,975$ 672,083,365$
$-
$50,000,000
$100,000,000$150,000,000
$200,000,000
$250,000,000
$300,000,000
$350,000,000$400,000,000
$450,000,000
$500,000,000
FY 1999 FY 2000 FY 2001
Es
tim
ate
d D
oll
ar
Am
ou
nt
of
Pe
rmit
s Is
su
ed
New Residential
Residential Additions, etc.
New Non-Residential
Non-Residential Additions, etc.

Real Estate Assessments Division 2001 Annual Report
9
taxpayer of the previous year’s assessment and the current assessment. (See Addendum A, page B-3 for a sample notice of reassessment.)
Appeal Procedures
Taxpayers who are uncertain about the accuracy of their assessment on the basis of value or equity with other properties can request a review of their property value. The County appraiser considers market information relative to the property and information provided by the taxpayer. If this information shows the assessed value should be changed, the appraiser makes the necessary adjustment. If the evidence does not support a change, the appraiser explains the reasons for sustaining the assessment.
Taxpayers may also appeal to the Board of Equalization (BOE) or Circuit Court. Taxpayers are not required to appeal to the assessments office before appealing to the BOE or Circuit Court. The BOE is comprised of eight County taxpayers and is established by the Board of County Supervisors to render an independent third party opinion in cases of disagreement between the taxpayer and the assessing official. Although the BOE is a quasi-judicial board, there is no fee and an attorney is not required.
Appeal Adjustments
As a result of an appeal to the Real Estate Assessments Office, the BOE, or Circuit Court, an assessment may be revised. Developers may appeal many residential lots at the same time and each lot appealed is counted separately. Upon review, the assessments office may change any or all of the lot values. Since each lot is counted separately, the number of appeals and the number changed by the assessor may be large and may fluctuate substantially from year to year. Some properties are appealed to both the assessments office and to the BOE. In tax year 2000, one new case was appealed in Circuit Court. There was one lawsuit resolved as a result of a negotiated settlement outside of court. As of June 30, 2001, there are eleven court cases pending.

Real Estate Assessments Division 2001 Annual Report
10
The table below shows appeal activity for tax year 1998 to tax year 2000. A history of appeals and the resulting adjustments can be found in Table 3 of the Statistical Appendix, page A-3.
Summary of Appeal Activity
* May have been decreased or increased.
Administering Real Estate Tax Relief Programs
Prince William County provides relief from real estate taxes for those who are elderly or disabled and meet specified income and net worth requirements. Certain land uses may also qualify for tax relief to encourage preservation of agriculture, forestry, and open space. Lastly, older properties which undergo substantial renovations can receive relief of all or part of the increase in taxes caused by the renovation.
Tax Relief for the Elderly and Disabled
Elderly or disabled persons are eligible for relief from real estate taxes on their home and a home site of up to one acre if they meet the following criteria:
• Are over 65 years of age on or before December 31, or are totally and permanently disabled.
• Have less than $195,000 in total assets (residence and up to one acre excluded).
• Do not exceed the maximum combined income requirements set forth in local ordinances.
TY 1998 TY 1999 TY 2000Appeals to Assessor 376 736 624Changed by Assessor 292 373 517% Changed* 78% 51% 83%
Appeals to BOE 334 126 141Changed by BOE 42 50 18% Changed* 13% 40% 13%
Appeals to Court 2 2 1
Total Appeals 712 864 766Appeals as % of Total Parcels 0.74% 0.89% 0.76%
Real Estate Assessments Division 2001 Annual Report
11
The assessments office provides information to taxpayers about the tax relief program in the following ways:
• The notice of reassessment is sent to all property owners in March and contains the criteria for tax relief and the deadline for filing (see Addendum A, page B-3).
• A tax relief brochure containing specific information regarding eligibility and application is available in the assessments office and various other County agencies (see Addendum C, page B-7), including Finance Department counters and senior citizens' centers.
• Tax relief information is available on the internet at www.pwcgov.org/tax.
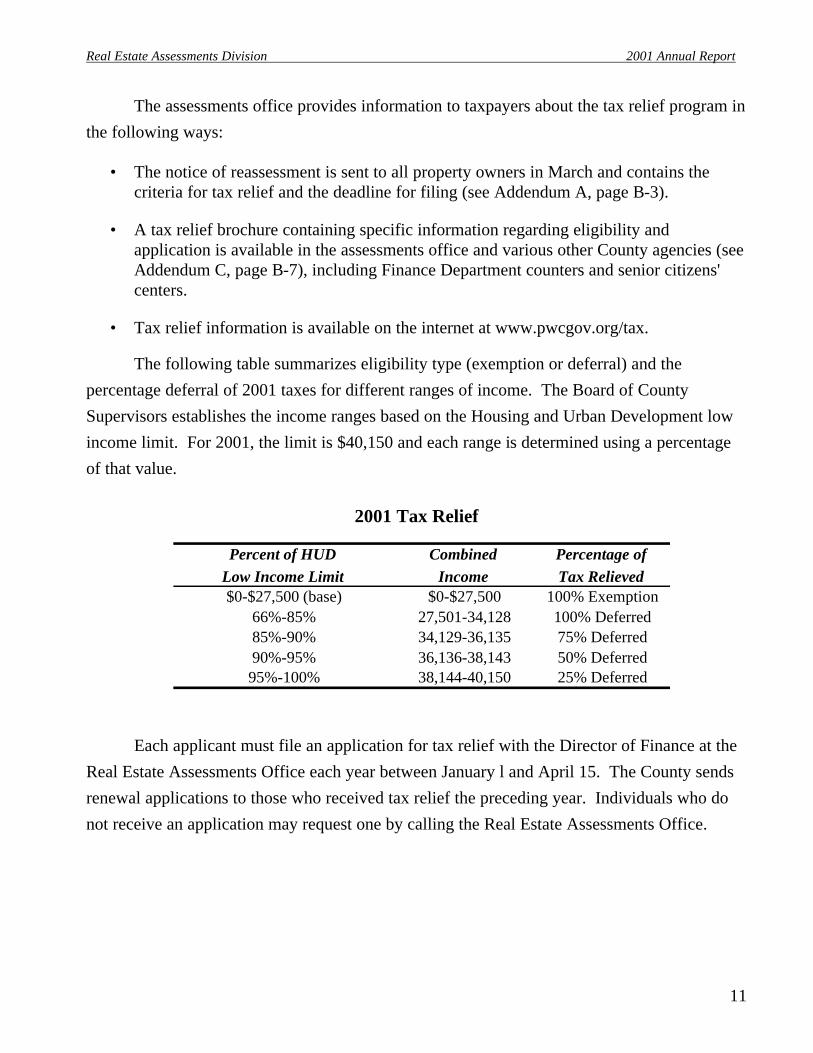
The following table summarizes eligibility type (exemption or deferral) and the percentage deferral of 2001 taxes for different ranges of income. The Board of County Supervisors establishes the income ranges based on the Housing and Urban Development low income limit. For 2001, the limit is $40,150 and each range is determined using a percentage of that value.
2001 Tax Relief
Each applicant must file an application for tax relief with the Director of Finance at the Real Estate Assessments Office each year between January l and April 15. The County sends renewal applications to those who received tax relief the preceding year. Individuals who do not receive an application may request one by calling the Real Estate Assessments Office.
Percent of HUD Combined Percentage ofLow Income Limit Income Tax Relieved$0-$27,500 (base) $0-$27,500 100% Exemption
66%-85% 27,501-34,128 100% Deferred85%-90% 34,129-36,135 75% Deferred90%-95% 36,136-38,143 50% Deferred95%-100% 38,144-40,150 25% Deferred
Real Estate Assessments Division 2001 Annual Report
12
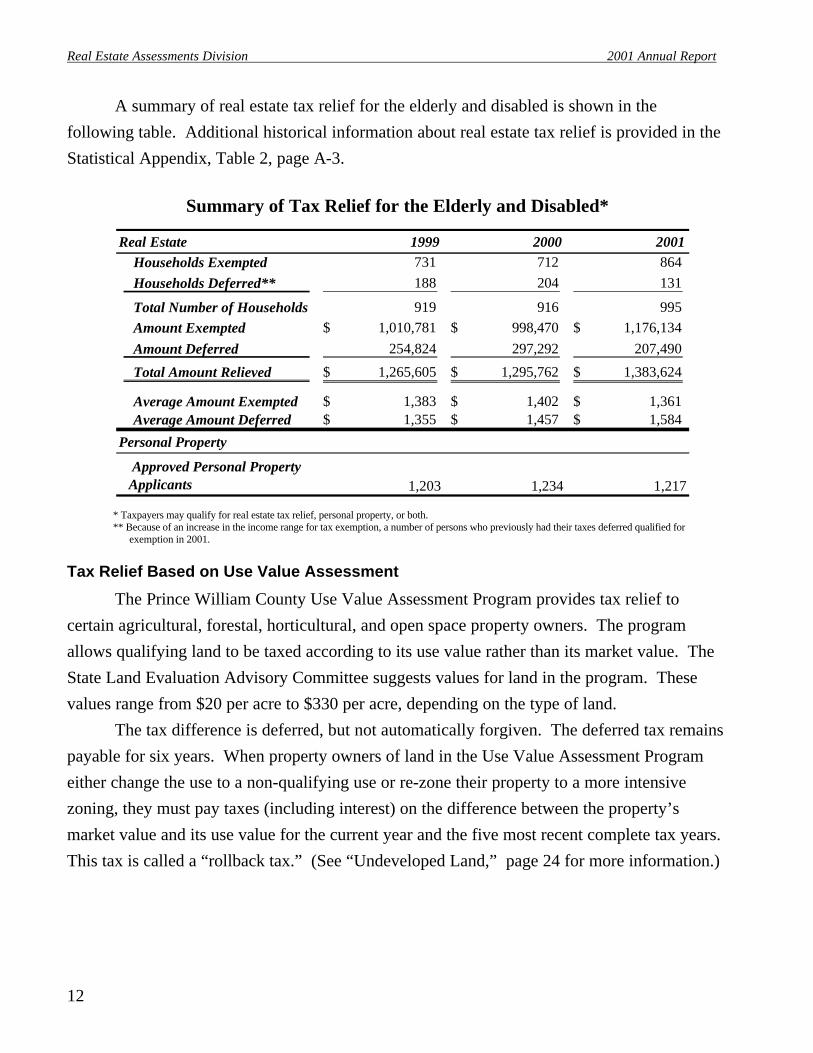
A summary of real estate tax relief for the elderly and disabled is shown in the following table. Additional historical information about real estate tax relief is provided in the Statistical Appendix, Table 2, page A-3.
Summary of Tax Relief for the Elderly and Disabled*
* Taxpayers may qualify for real estate tax relief, personal property, or both. ** Because of an increase in the income range for tax exemption, a number of persons who previously had their taxes deferred qualified for
exemption in 2001.
Tax Relief Based on Use Value Assessment
The Prince William County Use Value Assessment Program provides tax relief to certain agricultural, forestal, horticultural, and open space property owners. The program allows qualifying land to be taxed according to its use value rather than its market value. The State Land Evaluation Advisory Committee suggests values for land in the program. These values range from $20 per acre to $330 per acre, depending on the type of land.
The tax difference is deferred, but not automatically forgiven. The deferred tax remains payable for six years. When property owners of land in the Use Value Assessment Program either change the use to a non-qualifying use or re-zone their property to a more intensive zoning, they must pay taxes (including interest) on the difference between the property’s market value and its use value for the current year and the five most recent complete tax years. This tax is called a “rollback tax.” (See “Undeveloped Land,” page 24 for more information.)
Real Estate 1999 2000 2001Households Exempted 731 712 864 Households Deferred** 188 204 131
Total Number of Households 919 916 995 Amount Exempted 1,010,781$ 998,470$ 1,176,134$ Amount Deferred 254,824 297,292 207,490
Total Amount Relieved 1,265,605$ 1,295,762$ 1,383,624$
Average Amount Exempted 1,383$ 1,402$ 1,361$ Average Amount Deferred 1,355$ 1,457$ 1,584$
Personal Property
Approved Personal Property Applicants 1,203 1,234 1,217

Real Estate Assessments Division 2001 Annual Report
13
Partial Tax Exemption for Rehabilitated Real Estate
An ordinance enacting a partial tax exemption for real estate that is substantially repaired, rehabilitated, or replaced became effective on January 1, 1998. The program is intended to encourage property owners to improve the condition and appearance of their properties. All improved property types are eligible for the exemption. The rehabilitation or replacement structure must increase the value of the original structure at least 25% to qualify for the exemption. Minimum age and maximum size increase requirements depending on property type must also be met.
The tax exemption for properties in the rehabilitation program is applied over a fifteen-year period. Taxes are based on the assessed value of the property in its original condition for the first ten years it is in the program. For the next five years, the assessed value is increased in percentage increments until the property is assessed at its full renovated value.
The following table provides information about properties currently receiving partial tax exemption.
Summary of Tax Exemption for Rehabilitated Real Estate
Property TypeDate Exemption
BeganTax Savings for
2001Residential 1999 $2,988Commercial 2000 3,546Multifamily 2000 59,990Commercial 2000 4,086Commercial 2000 334Residential 2001 2,647Residential 2001 385Residential 2001 458Commercial 2001 1910
Total Tax Savings for 2001 $76,344

Real Estate Assessments Division 2001 Annual Report
14
Providing Customer Service
The Real Estate Assessments Office provides services to all taxpayers in the form of accurate, equitable assessments. In addition, each year the assessments office provides direct assistance to thousands of citizens on an individual basis. One of the most direct forms of customer service is responding to appeals by taxpayers who are not certain their assessment is correct. Taxpayer appeals are explained in the “Appeal Procedures” section, page 9. Several other direct customer services provided by the assessments office are explained below.
Walk-in Customers
The assessments office has two main types of walk-in customers: taxpayers and real estate professionals. When taxpayers come to the Real Estate Assessments Office for assistance with understanding and applying for tax relief programs, the office staff works directly with them. The assessments office also has a brochure about tax relief for rehabilitated properties (see Addendum B, page B-5) and tax relief for the elderly and disabled (see Addendum C, page B-7). Most appraisers and real estate agents use the assessment office’s sales lists, microfiche copies of tax records, and on-line access to the assessment database for research purposes.
Telephone Requests From Real Estate Professionals
While assessment information is available at the Real Estate Assessments Office to any citizen free of charge, many real estate professionals including brokers, agents, attorneys, appraisers, and settlement companies prefer to have the assessments office do research for them. The assessments office handles these business services on a fee-for-service plan through a 900 telephone number at a charge of $2.00 per minute. Effective July 2001, the Real Estate Assessments Office eliminated the 900 telephone number. Those calls are now answered free-of-charge by the Real Estate Assessments Office and the Taxpayer Services Office.
Telephone Requests From Citizens and Public Agencies
Citizens and public agencies are not charged for their inquiries. Many citizens call for information about the method of assessment used in valuing their property or about tax due
Real Estate Assessments Division 2001 Annual Report
15
dates and other general facts. These, along with assessment appeals and calls from other public agencies, are handled as administrative calls.
Internet Access
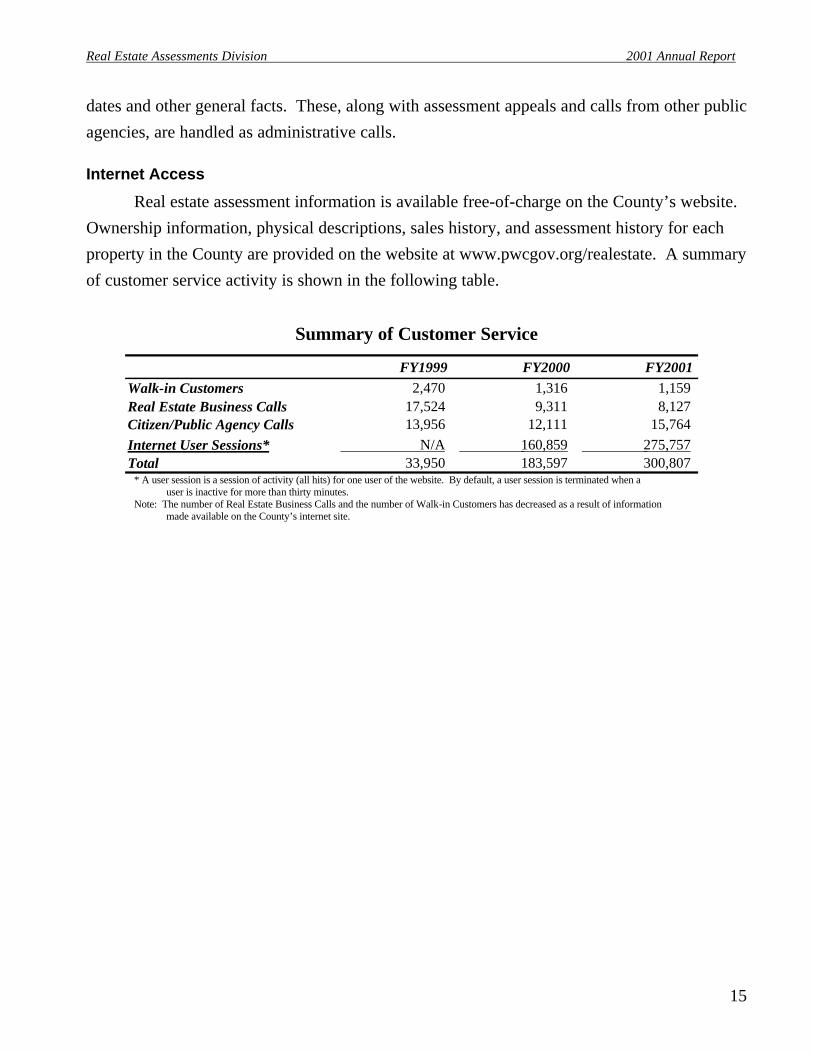
Real estate assessment information is available free-of-charge on the County’s website. Ownership information, physical descriptions, sales history, and assessment history for each property in the County are provided on the website at www.pwcgov.org/realestate. A summary of customer service activity is shown in the following table.
Summary of Customer Service
* A user session is a session of activity (all hits) for one user of the website. By default, a user session is terminated when a user is inactive for more than thirty minutes.
Note: The number of Real Estate Business Calls and the number of Walk-in Customers has decreased as a result of information made available on the County’s internet site.
FY1999 FY2000 FY2001Walk-in Customers 2,470 1,316 1,159 Real Estate Business Calls 17,524 9,311 8,127 Citizen/Public Agency Calls 13,956 12,111 15,764 Internet User Sessions* N/A 160,859 275,757 Total 33,950 183,597 300,807
Real Estate Assessments Division 2001 Annual Report
16
REAL ESTATE VALUES
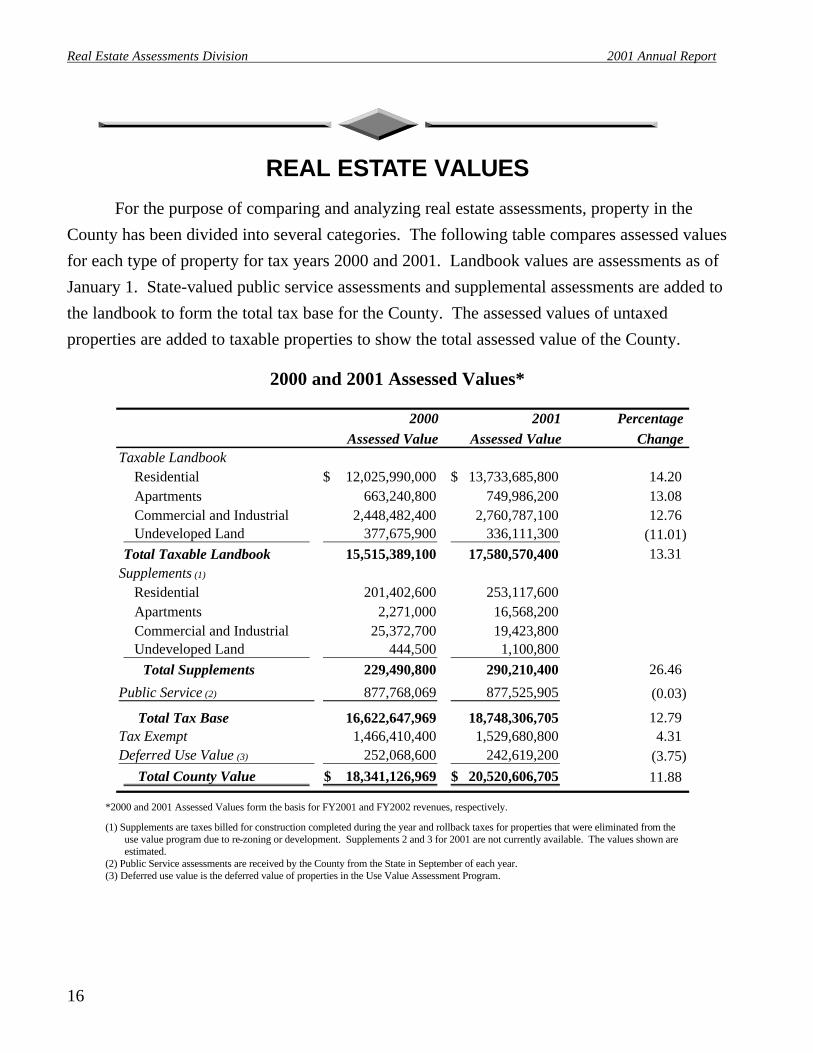
For the purpose of comparing and analyzing real estate assessments, property in the County has been divided into several categories. The following table compares assessed values for each type of property for tax years 2000 and 2001. Landbook values are assessments as of January 1. State-valued public service assessments and supplemental assessments are added to the landbook to form the total tax base for the County. The assessed values of untaxed properties are added to taxable properties to show the total assessed value of the County.
2000 and 2001 Assessed Values*
*2000 and 2001 Assessed Values form the basis for FY2001 and FY2002 revenues, respectively.
(1) Supplements are taxes billed for construction completed during the year and rollback taxes for properties that were eliminated from the use value program due to re-zoning or development. Supplements 2 and 3 for 2001 are not currently available. The values shown are estimated.
(2) Public Service assessments are received by the County from the State in September of each year. (3) Deferred use value is the deferred value of properties in the Use Value Assessment Program.
2000 2001 PercentageAssessed Value Assessed Value Change
Taxable Landbook Residential 12,025,990,000$ 13,733,685,800$ 14.20 Apartments 663,240,800 749,986,200 13.08 Commercial and Industrial 2,448,482,400 2,760,787,100 12.76 Undeveloped Land 377,675,900 336,111,300 (11.01)Total Taxable Landbook 15,515,389,100 17,580,570,400 13.31
Supplements (1)
Residential 201,402,600 253,117,600 Apartments 2,271,000 16,568,200 Commercial and Industrial 25,372,700 19,423,800 Undeveloped Land 444,500 1,100,800
Total Supplements 229,490,800 290,210,400 26.46
Public Service (2) 877,768,069 877,525,905 (0.03)
Total Tax Base 16,622,647,969 18,748,306,705 12.79Tax Exempt 1,466,410,400 1,529,680,800 4.31Deferred Use Value (3) 252,068,600 242,619,200 (3.75) Total County Value 18,341,126,969$ 20,520,606,705$ 11.88
Real Estate Assessments Division 2001 Annual Report
17
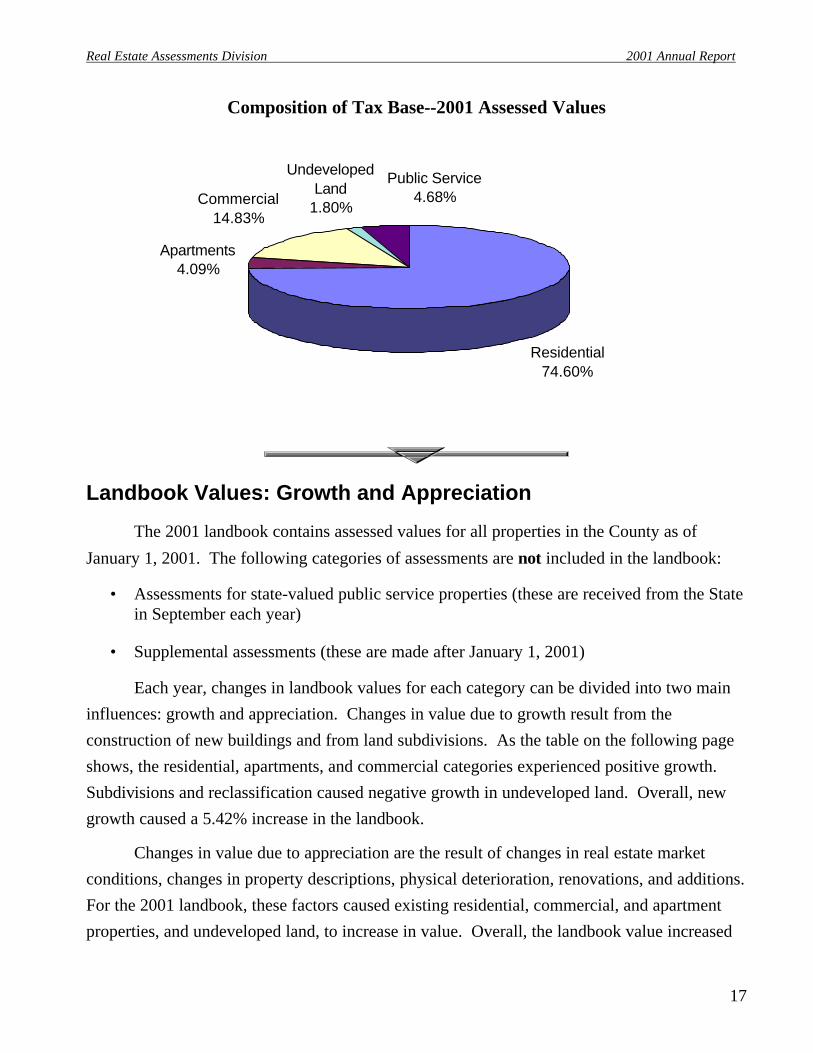
Composition of Tax Base--2001 Assessed Values
Landbook Values: Growth and Appreciation
The 2001 landbook contains assessed values for all properties in the County as of
January 1, 2001. The following categories of assessments are not included in the landbook:
• Assessments for state-valued public service properties (these are received from the State in September each year)
• Supplemental assessments (these are made after January 1, 2001)
Each year, changes in landbook values for each category can be divided into two main influences: growth and appreciation. Changes in value due to growth result from the construction of new buildings and from land subdivisions. As the table on the following page shows, the residential, apartments, and commercial categories experienced positive growth. Subdivisions and reclassification caused negative growth in undeveloped land. Overall, new growth caused a 5.42% increase in the landbook.
Changes in value due to appreciation are the result of changes in real estate market conditions, changes in property descriptions, physical deterioration, renovations, and additions. For the 2001 landbook, these factors caused existing residential, commercial, and apartment properties, and undeveloped land, to increase in value. Overall, the landbook value increased
Residential74.60%
Apartments4.09%
Commercial14.83%
Undeveloped Land
1.80%
Public Service4.68%

Real Estate Assessments Division 2001 Annual Report
18
5.42% for growth and 7.89% for appreciation, resulting in a total increase of 13.31% in the 2001 landbook value.
The table below shows the 2000 to 2001 landbook changes attributable to growth and appreciation. Detailed and historical data are in the Statistical Appendix page A-11.
Changes in Landbook Values—2000 to 2001
Residential
The residential category includes improved and unimproved parcels zoned for residential use except multifamily rental apartment communities. The improved parcels in this category are mostly single family homes, townhouses, and condominiums. Total landbook value for residential properties increased 14.20% between 2000 and 2001. Growth caused a 6.60% increase in the residential assessed value. There were 3,419 new residential units with an average value of $232,557 added to the tax base for 2001. Appreciation caused the remaining 7.60% increase in the residential landbook. The table below shows the landbook value of residential property for the last three years and the following page shows the composition of the residential category, the composition of new construction, and the average assessed values of residential properties.
Residential Landbook Assessments (Tax Years)
1999 2000 2001Landbook Values $10,930,281,700 $12,025,990,000 $13,733,685,800
Percent Percent TotalGrowth Appreciation Percent Change
Residential 6.60 7.60 14.20 Apartments 4.03 9.05 13.08 Commercial/Industrial 2.88 9.87 12.76 Undeveloped Land (13.31) 2.30 (11.01) Total Landbook 5.42 7.89 13.31

Real Estate Assessments Division 2001 Annual Report
19
Types of Residential Property--2001 Landbook
Notes: This table is not a count of dwelling units in the County. Some parcels in the Single Family category may have more than one dwelling unit. New homes that were partially built as of January 1, 2001 are counted as if they were complete, although their value is discounted depending on the level of completion. Tax-exempt properties and apartment units are not included in this table.
Types of Residential Property as Percentages of 2001 Residential Landbook Value
Of the 3,419 new homes built in the County during 2000, over half were single-family homes and townhouses assessed at over $200,000 for tax year 2001. The average assessment of all residential new construction was $232,557. The following table shows the breakdown of new homes by type and value.
2001 2001 Percent of TotalParcel Count Landbook Value Residential
Single Family 53,624 $ 10,142,977,800 73.85 Townhouses 24,451 2,760,050,900 20.10 Condominiums 5,091 400,523,400 2.92 Vacant Land 12,921 414,200,200 3.02 Other 1,731 15,933,500 0.12
Total Resid. Landbook 97,818 13,733,685,800$ 100.00
Single Family 73.85%
Townhouses20.10%
Condominiums2.92%
Vacant Land3.02%
Other0.12%

Real Estate Assessments Division 2001 Annual Report
20
Residential New Construction by Type
Note: This table includes residential homes completed during 2000. Homes partially built as of January 1, 2001 have been excluded.
In 2001, all types of residential properties experienced increases in average assessed value. Listed below are the average assessments of residential dwelling types for the last three years.
Average Residential Assessments by Type
Note: These averages do not include tax-exempt properties, vacant lots, residences on commercial or agricultural land, parcels with more than one residence, or houses that were partially complete as of January 1, 2001.
Comparison of Average Residential Assessments by Type
1999 2000 2001Single Family Detached $160,347 $170,719 $189,567Townhouses $99,785 $103,867 $112,962Condominiums $73,264 $74,778 $78,672All Types $136,841 $144,979 $160,116
$0$20,000$40,000$60,000$80,000
$100,000$120,000$140,000$160,000$180,000$200,000
Single FamilyDetached
Townhouses Condominiums All Types
1999
2000
2001
Count Average Assessment
Count Average Assessment
Count Average Assessment
Single Family 2,019$ 281,554$ 296$ 179,745$ 2,315$ 268,536$ Townhouses 72 224,844 1,014 152,750 1,086 157,529 Condominiums N/A N/A 18 131,916 18 131,916 Total Residential 2,091 279,601 1,328 158,485 3,419 232,557
Average Residential Real Estate Tax for New Homes (Tax Rate = $1.30 per $100) 3,023$
New Units Over $200,000 New Units Under $200,000 All New Units
Real Estate Assessments Division 2001 Annual Report
21
New houses can influence the average assessed value positively or negatively, depending on the size, quality, and type of new construction. In general, new houses are more expensive than an average house in the County and therefore cause an increase in average assessed value. As a result, even if market factors or physical deterioration cause a decline in the value of existing properties, construction of new units may cause the overall average value to increase. In recent years, there has been a general upward trend of average values in residential properties in the County. A ten year history of average values is included in the Statistical Appendix, Table 6, page A-5.
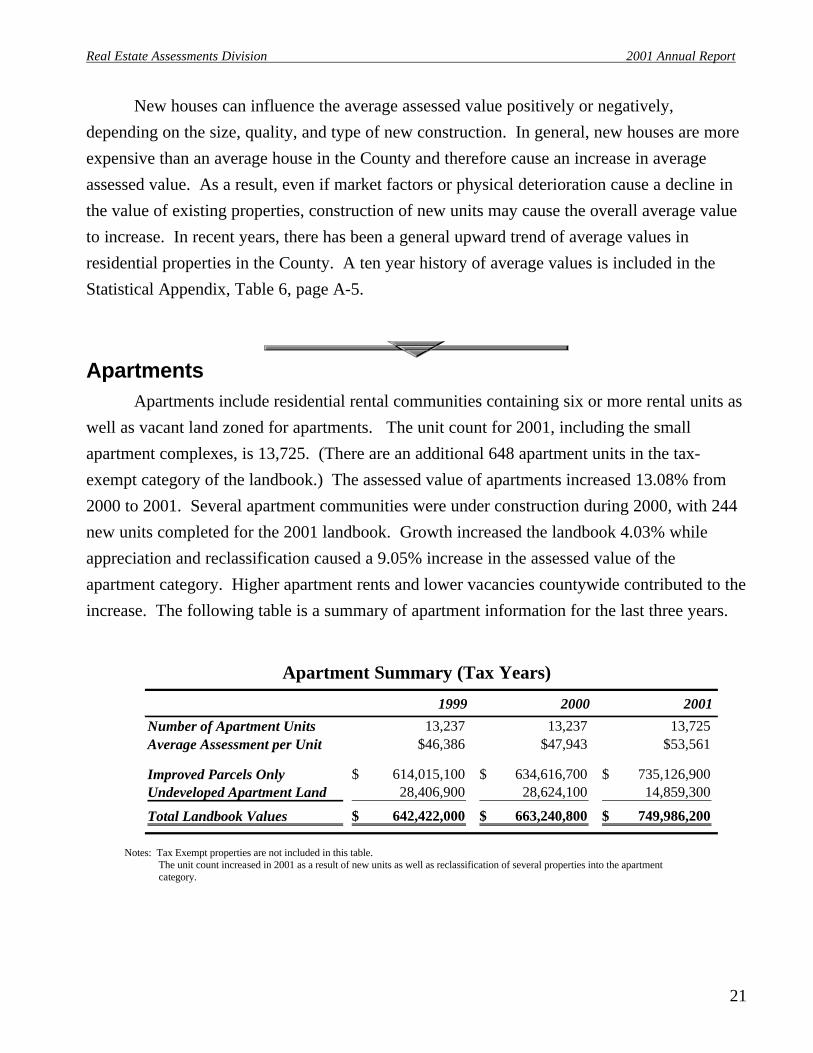
Apartments Apartments include residential rental communities containing six or more rental units as
well as vacant land zoned for apartments. The unit count for 2001, including the small apartment complexes, is 13,725. (There are an additional 648 apartment units in the tax-exempt category of the landbook.) The assessed value of apartments increased 13.08% from 2000 to 2001. Several apartment communities were under construction during 2000, with 244 new units completed for the 2001 landbook. Growth increased the landbook 4.03% while appreciation and reclassification caused a 9.05% increase in the assessed value of the apartment category. Higher apartment rents and lower vacancies countywide contributed to the increase. The following table is a summary of apartment information for the last three years.
Apartment Summary (Tax Years)
Notes: Tax Exempt properties are not included in this table. The unit count increased in 2001 as a result of new units as well as reclassification of several properties into the apartment
category.
1999 2000 2001
Number of Apartment Units 13,237 13,237 13,725 Average Assessment per Unit $46,386 $47,943 $53,561
Improved Parcels Only 614,015,100$ 634,616,700$ 735,126,900$ Undeveloped Apartment Land 28,406,900 28,624,100 14,859,300
Total Landbook Values 642,422,000$ 663,240,800$ 749,986,200$
Real Estate Assessments Division 2001 Annual Report
22
Commercial and Industrial
Locally-Valued Properties
Locally-valued commercial and industrial properties consist of all non-residential uses such as retail, office, hotel, industrial, warehouse, and vacant parcels with commercial or industrial zoning. Properties owned by public service companies such as utility companies and railroads are not locally-assessed.
Locally assessed commercial and industrial properties increased 12.76% from 2000 to 2001. New construction caused a 2.88% increase in the commercial tax base. There were 897,223 square feet of commercial space added to the tax base for tax year 2001. The largest amount of growth occurred within the office and industrial categories, which together account for over 60% of new commercial space.
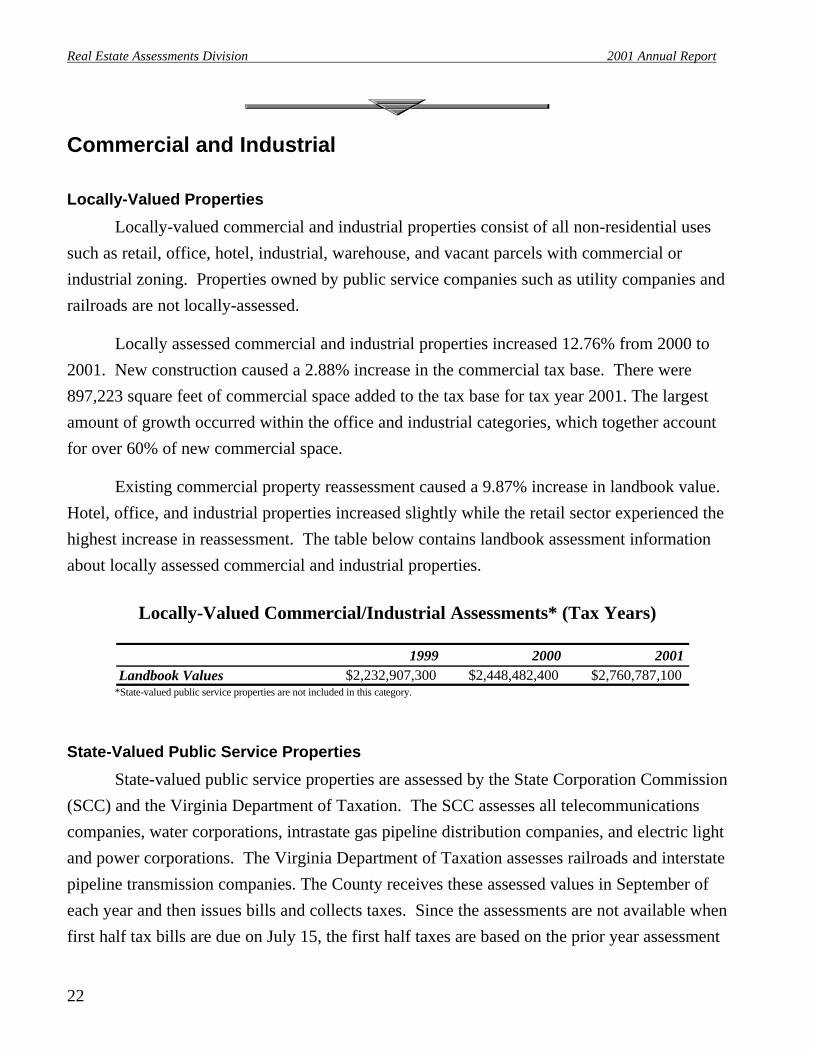
Existing commercial property reassessment caused a 9.87% increase in landbook value. Hotel, office, and industrial properties increased slightly while the retail sector experienced the highest increase in reassessment. The table below contains landbook assessment information about locally assessed commercial and industrial properties.
Locally-Valued Commercial/Industrial Assessments* (Tax Years)
*State-valued public service properties are not included in this category.
State-Valued Public Service Properties
State-valued public service properties are assessed by the State Corporation Commission (SCC) and the Virginia Department of Taxation. The SCC assesses all telecommunications companies, water corporations, intrastate gas pipeline distribution companies, and electric light and power corporations. The Virginia Department of Taxation assesses railroads and interstate pipeline transmission companies. The County receives these assessed values in September of each year and then issues bills and collects taxes. Since the assessments are not available when first half tax bills are due on July 15, the first half taxes are based on the prior year assessment
1999 2000 2001Landbook Values $2,232,907,300 $2,448,482,400 $2,760,787,100

Real Estate Assessments Division 2001 Annual Report
23
and adjusted on the second half tax bill. The table below shows the total assessed values for Public Service properties.
State-Valued Public Service Assessments (Tax Years)
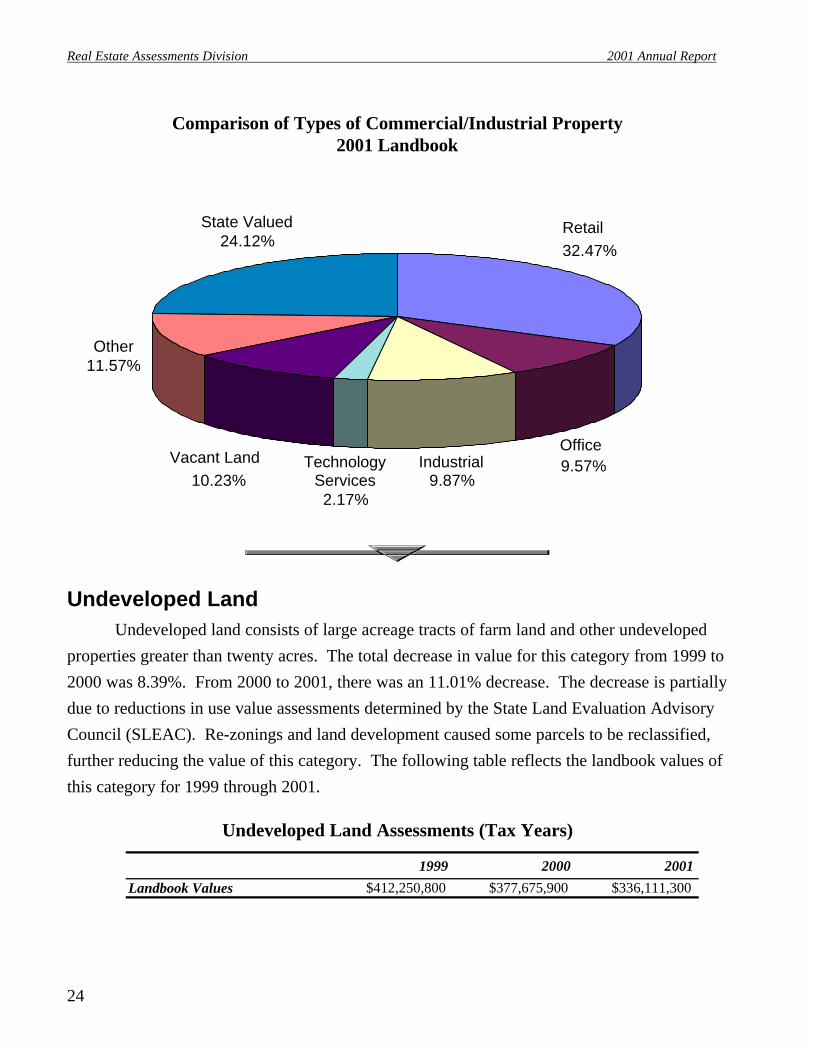
The following table and chart compare 2001 landbook values of different types of locally and state-valued properties.
Types of Commercial/Industrial Property 2001 Landbook
Note: Changes in parcel counts since 2000 are due to new construction and re-classification.
1999 2000 2001Assessed Value $871,897,315 $877,768,069 $877,525,905
Number of 2001 Percent of TotalParcels Landbook Commercial/Ind.
Locally Assessed Retail 884 1,181,383,200 32.47 Offices 784 348,191,700 9.57 Industrial 387 359,233,300 9.87 Technology Services 2 78,889,000 2.17 Other 739 421,065,300 11.57 Vacant Land 1,220 372,024,600 10.23 Total Locally Assessed 4,016 2,760,787,100 75.88 Total State Valued 877,525,905 24.12
Total Commercial/Industrial 3,638,313,005 100.00
Real Estate Assessments Division 2001 Annual Report
24
Comparison of Types of Commercial/Industrial Property 2001 Landbook
Undeveloped Land Undeveloped land consists of large acreage tracts of farm land and other undeveloped
properties greater than twenty acres. The total decrease in value for this category from 1999 to 2000 was 8.39%. From 2000 to 2001, there was an 11.01% decrease. The decrease is partially due to reductions in use value assessments determined by the State Land Evaluation Advisory Council (SLEAC). Re-zonings and land development caused some parcels to be reclassified, further reducing the value of this category. The following table reflects the landbook values of this category for 1999 through 2001.
Undeveloped Land Assessments (Tax Years)
Retail32.47%
Industrial9.87%
TechnologyServices2.17%
Vacant Land10.23%
Other11.57%
State Valued24.12%
Offices9.57%
1999 2000 2001
Landbook Values $412,250,800 $377,675,900 $336,111,300
Real Estate Assessments Division 2001 Annual Report
25
Some of these undeveloped parcels qualify for the Use Value Assessment Program and are not taxed at market value. The State Land Evaluation Advisory Council recommends the use value assessments used by the County for property in the program. These values typically range from $20 to $330 per acre (see “Tax Relief Based on Use Value Assessment,” page 12 for more information).
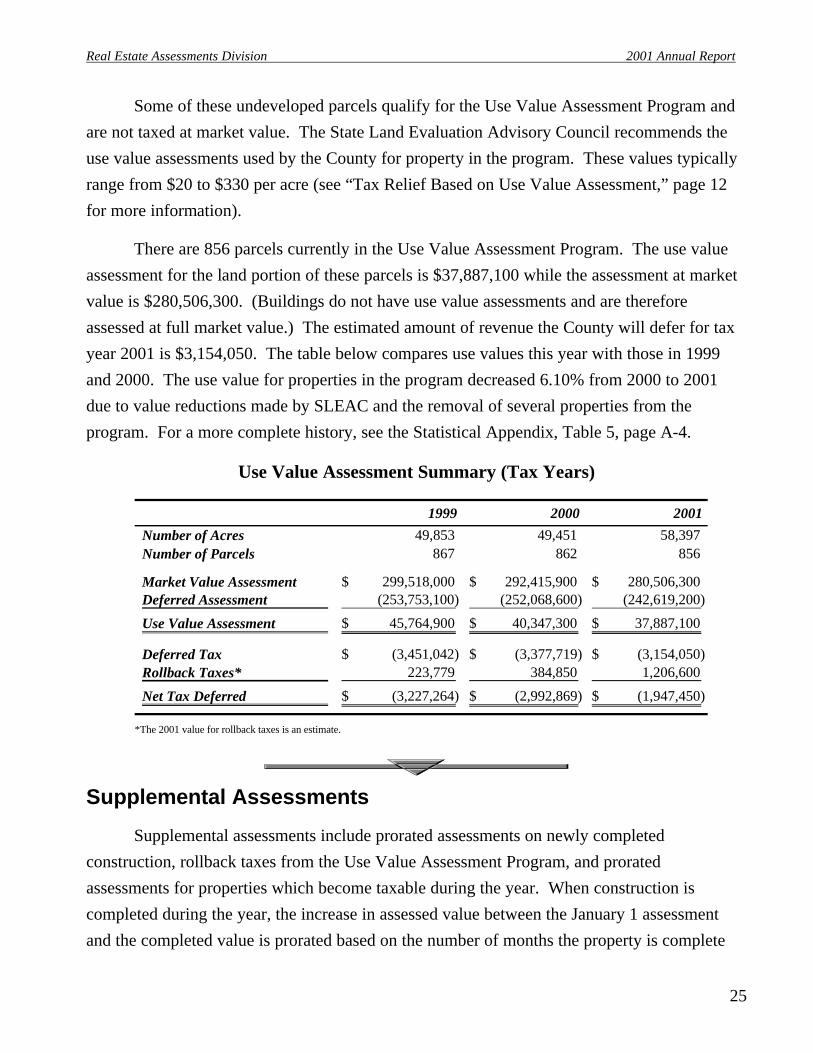
There are 856 parcels currently in the Use Value Assessment Program. The use value assessment for the land portion of these parcels is $37,887,100 while the assessment at market value is $280,506,300. (Buildings do not have use value assessments and are therefore assessed at full market value.) The estimated amount of revenue the County will defer for tax year 2001 is $3,154,050. The table below compares use values this year with those in 1999 and 2000. The use value for properties in the program decreased 6.10% from 2000 to 2001 due to value reductions made by SLEAC and the removal of several properties from the program. For a more complete history, see the Statistical Appendix, Table 5, page A-4.
Use Value Assessment Summary (Tax Years)
*The 2001 value for rollback taxes is an estimate.
Supplemental Assessments
Supplemental assessments include prorated assessments on newly completed construction, rollback taxes from the Use Value Assessment Program, and prorated assessments for properties which become taxable during the year. When construction is completed during the year, the increase in assessed value between the January 1 assessment and the completed value is prorated based on the number of months the property is complete
1999 2000 2001
Number of Acres 49,853 49,451 58,397 Number of Parcels 867 862 856
Market Value Assessment 299,518,000$ 292,415,900$ 280,506,300$ Deferred Assessment (253,753,100) (252,068,600) (242,619,200)
Use Value Assessment 45,764,900$ 40,347,300$ 37,887,100$
Deferred Tax (3,451,042)$ (3,377,719)$ (3,154,050)$ Rollback Taxes* 223,779 384,850 1,206,600
Net Tax Deferred (3,227,264)$ (2,992,869)$ (1,947,450)$
Real Estate Assessments Division 2001 Annual Report
26
and fit for occupancy. The owner of the property receives a tax bill for the prorated increased value.
Supplemental Assessments (Tax Years)
*Supplement 1 assessments for 2001 are actuals; however, Supplement 2 and 3 assessments for 2001 are estimated.
Tax-Exempt Properties
Section 58.1-3200 of the Code of Virginia requires the County to place an assessment on all property except road rights-of-way and public service properties, which are valued by the State. Therefore, the County is required to assess all tax-exempt properties. For 2001, there were 1,749 tax-exempt parcels consisting of federal, state, and county-owned properties, as well as properties owned by churches, schools, and other tax-exempt organizations.
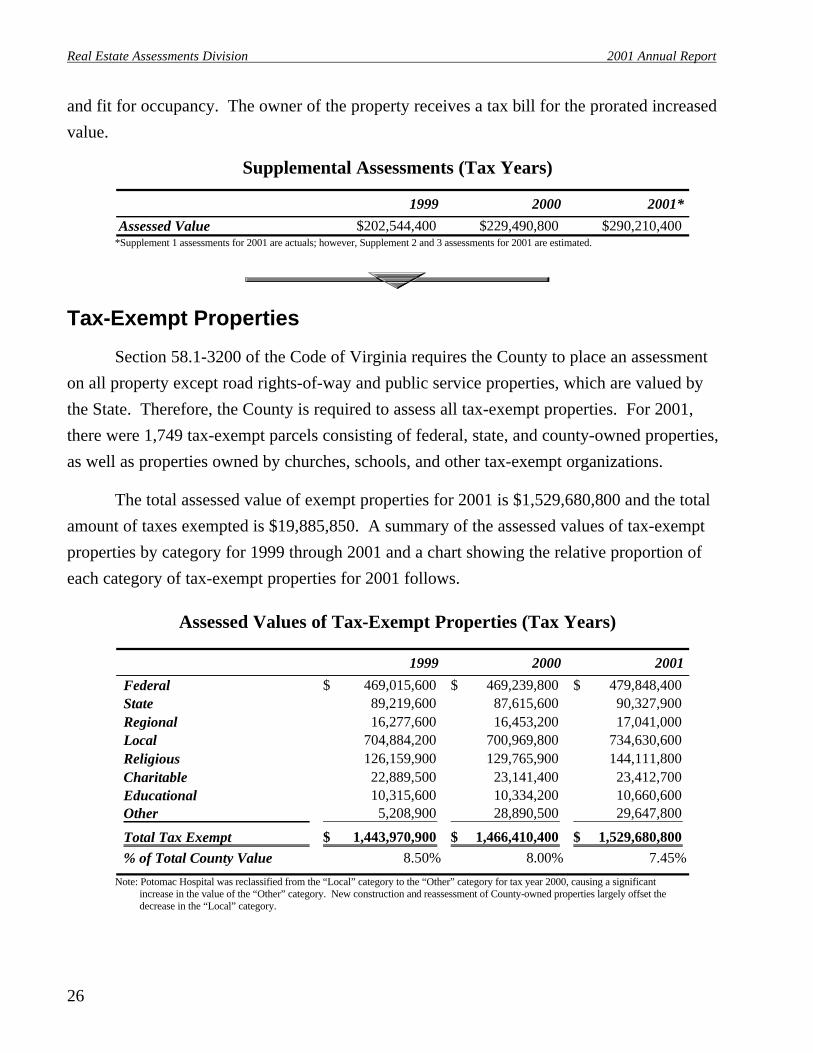
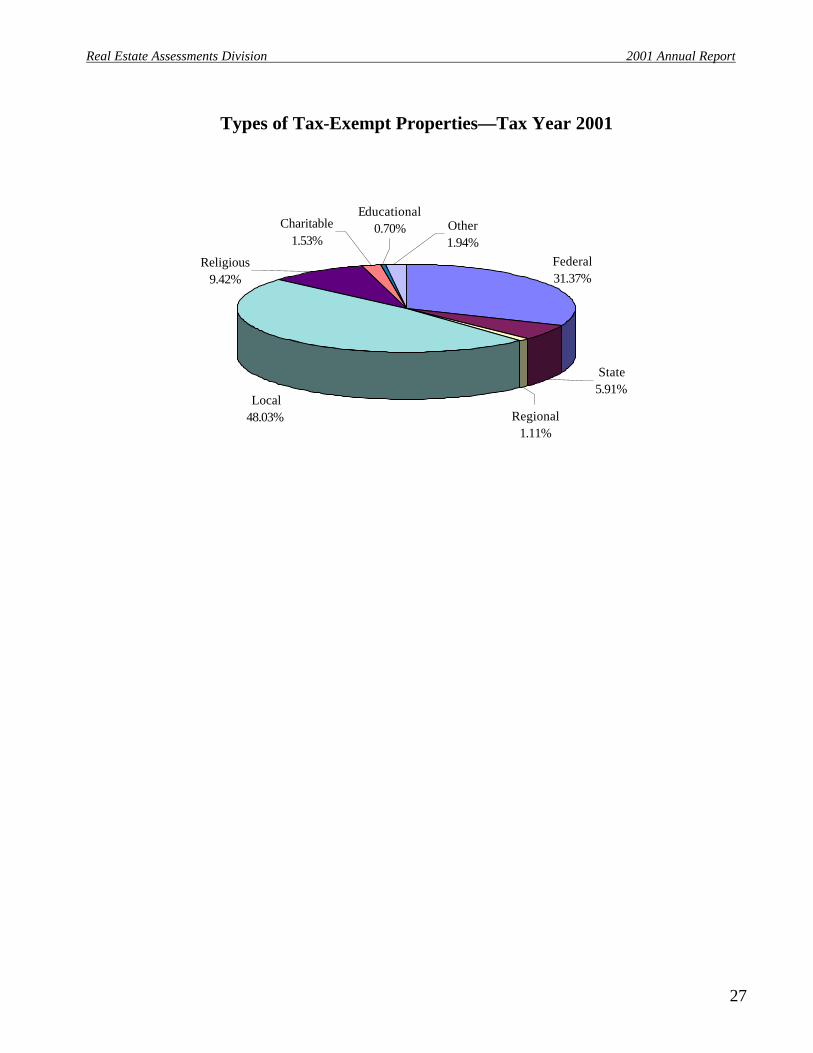
The total assessed value of exempt properties for 2001 is $1,529,680,800 and the total amount of taxes exempted is $19,885,850. A summary of the assessed values of tax-exempt properties by category for 1999 through 2001 and a chart showing the relative proportion of each category of tax-exempt properties for 2001 follows.
Assessed Values of Tax-Exempt Properties (Tax Years)
Note: Potomac Hospital was reclassified from the “Local” category to the “Other” category for tax year 2000, causing a significant increase in the value of the “Other” category. New construction and reassessment of County-owned properties largely offset the decrease in the “Local” category.
1999 2000 2001*Assessed Value $202,544,400 $229,490,800 $290,210,400
1999 2000 2001
Federal 469,015,600$ 469,239,800$ 479,848,400$ State 89,219,600 87,615,600 90,327,900 Regional 16,277,600 16,453,200 17,041,000 Local 704,884,200 700,969,800 734,630,600 Religious 126,159,900 129,765,900 144,111,800 Charitable 22,889,500 23,141,400 23,412,700 Educational 10,315,600 10,334,200 10,660,600 Other 5,208,900 28,890,500 29,647,800
Total Tax Exempt 1,443,970,900$ 1,466,410,400$ 1,529,680,800$ % of Total County Value 8.50% 8.00% 7.45%
Real Estate Assessments Division 2001 Annual Report
27
Types of Tax-Exempt Properties—Tax Year 2001
Charitable1.53%
Other1.94%
Educational0.70%
Religious9.42%
Local48.03% Regional
1.11%
State 5.91%
Federal31.37%
A-1
Statistical Appendix

Real Estate Assessments Division 2001 Annual Report
A-2
This page intentionally left blank.
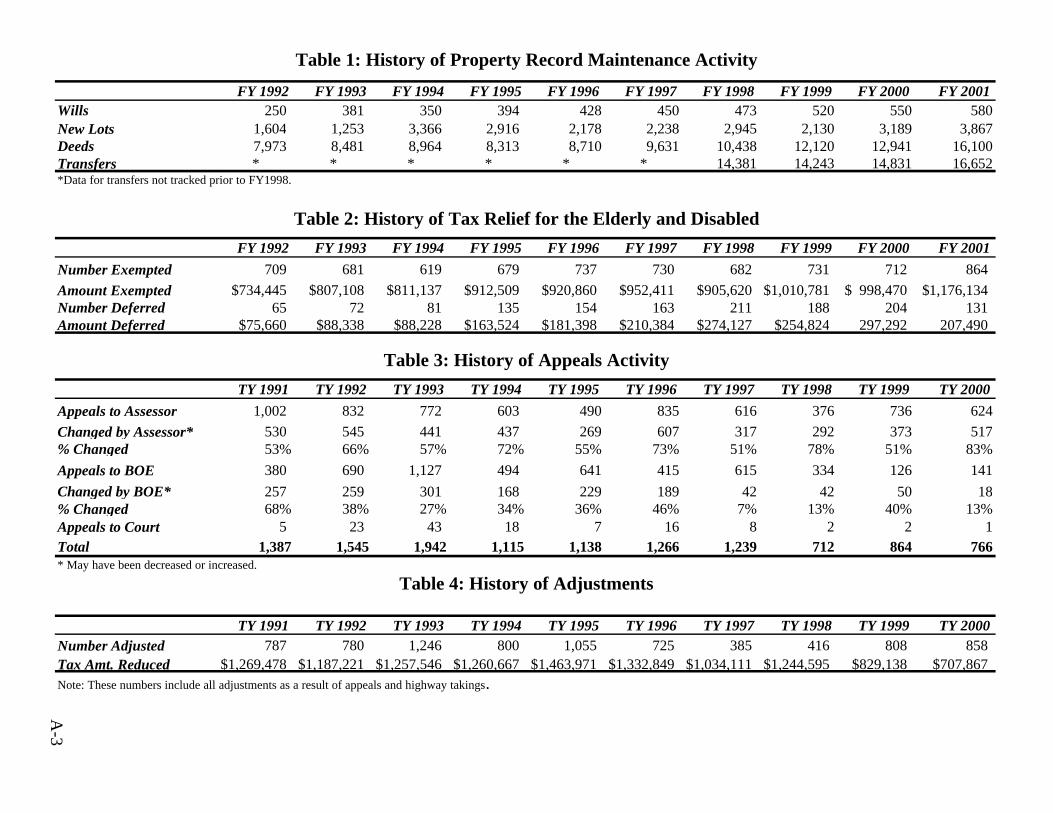
Table 1: History of Property Record Maintenance Activity
*Data for transfers not tracked prior to FY1998.
Table 2: History of Tax Relief for the Elderly and Disabled
Table 3: History of Appeals Activity
* May have been decreased or increased.
Table 4: History of Adjustments
Note: These numbers include all adjustments as a result of appeals and highway takings.
FY 1992 FY 1993 FY 1994 FY 1995 FY 1996 FY 1997 FY 1998 FY 1999 FY 2000 FY 2001Number Exempted 709 681 619 679 737 730 682 731 712 864Amount Exempted $734,445 $807,108 $811,137 $912,509 $920,860 $952,411 $905,620 $1,010,781 998,470$ 1,176,134$ Number Deferred 65 72 81 135 154 163 211 188 204 131Amount Deferred $75,660 $88,338 $88,228 $163,524 $181,398 $210,384 $274,127 $254,824 297,292 207,490
TY 1991 TY 1992 TY 1993 TY 1994 TY 1995 TY 1996 TY 1997 TY 1998 TY 1999 TY 2000Number Adjusted 787 780 1,246 800 1,055 725 385 416 808 858Tax Amt. Reduced $1,269,478 $1,187,221 $1,257,546 $1,260,667 $1,463,971 $1,332,849 $1,034,111 $1,244,595 $829,138 $707,867
TY 1991 TY 1992 TY 1993 TY 1994 TY 1995 TY 1996 TY 1997 TY 1998 TY 1999 TY 2000Appeals to Assessor 1,002 832 772 603 490 835 616 376 736 624Changed by Assessor* 530 545 441 437 269 607 317 292 373 517% Changed 53% 66% 57% 72% 55% 73% 51% 78% 51% 83%Appeals to BOE 380 690 1,127 494 641 415 615 334 126 141Changed by BOE* 257 259 301 168 229 189 42 42 50 18% Changed 68% 38% 27% 34% 36% 46% 7% 13% 40% 13%Appeals to Court 5 23 43 18 7 16 8 2 2 1Total 1,387 1,545 1,942 1,115 1,138 1,266 1,239 712 864 766
A-3
FY 1992 FY 1993 FY 1994 FY 1995 FY 1996 FY 1997 FY 1998 FY 1999 FY 2000 FY 2001Wills 250 381 350 394 428 450 473 520 550 580New Lots 1,604 1,253 3,366 2,916 2,178 2,238 2,945 2,130 3,189 3,867Deeds 7,973 8,481 8,964 8,313 8,710 9,631 10,438 12,120 12,941 16,100Transfers * * * * * * 14,381 14,243 14,831 16,652
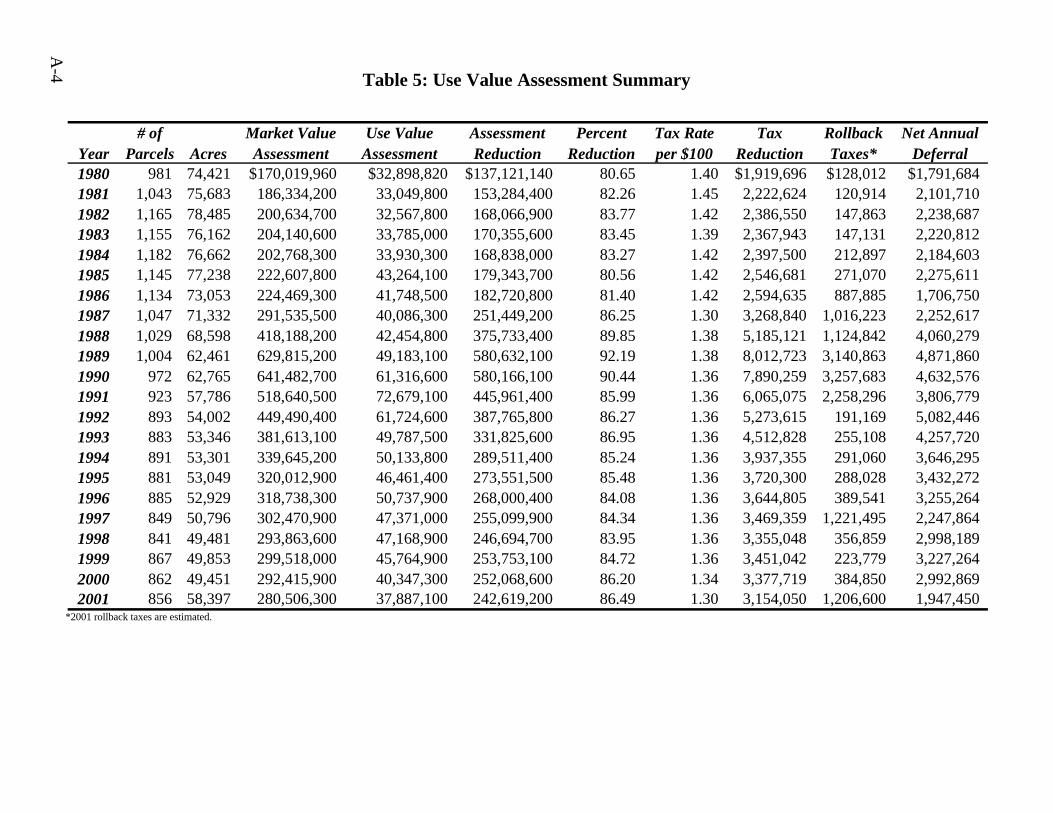
Table 5: Use Value Assessment Summary
*2001 rollback taxes are estimated.
A-4
# of Market Value Use Value Assessment Percent Tax Rate Tax Rollback Net AnnualYear Parcels Acres Assessment Assessment Reduction Reduction per $100 Reduction Taxes* Deferral1980 981 74,421 $170,019,960 $32,898,820 $137,121,140 80.65 1.40 $1,919,696 $128,012 $1,791,6841981 1,043 75,683 186,334,200 33,049,800 153,284,400 82.26 1.45 2,222,624 120,914 2,101,7101982 1,165 78,485 200,634,700 32,567,800 168,066,900 83.77 1.42 2,386,550 147,863 2,238,6871983 1,155 76,162 204,140,600 33,785,000 170,355,600 83.45 1.39 2,367,943 147,131 2,220,8121984 1,182 76,662 202,768,300 33,930,300 168,838,000 83.27 1.42 2,397,500 212,897 2,184,6031985 1,145 77,238 222,607,800 43,264,100 179,343,700 80.56 1.42 2,546,681 271,070 2,275,6111986 1,134 73,053 224,469,300 41,748,500 182,720,800 81.40 1.42 2,594,635 887,885 1,706,7501987 1,047 71,332 291,535,500 40,086,300 251,449,200 86.25 1.30 3,268,840 1,016,223 2,252,6171988 1,029 68,598 418,188,200 42,454,800 375,733,400 89.85 1.38 5,185,121 1,124,842 4,060,2791989 1,004 62,461 629,815,200 49,183,100 580,632,100 92.19 1.38 8,012,723 3,140,863 4,871,8601990 972 62,765 641,482,700 61,316,600 580,166,100 90.44 1.36 7,890,259 3,257,683 4,632,5761991 923 57,786 518,640,500 72,679,100 445,961,400 85.99 1.36 6,065,075 2,258,296 3,806,7791992 893 54,002 449,490,400 61,724,600 387,765,800 86.27 1.36 5,273,615 191,169 5,082,4461993 883 53,346 381,613,100 49,787,500 331,825,600 86.95 1.36 4,512,828 255,108 4,257,7201994 891 53,301 339,645,200 50,133,800 289,511,400 85.24 1.36 3,937,355 291,060 3,646,2951995 881 53,049 320,012,900 46,461,400 273,551,500 85.48 1.36 3,720,300 288,028 3,432,2721996 885 52,929 318,738,300 50,737,900 268,000,400 84.08 1.36 3,644,805 389,541 3,255,2641997 849 50,796 302,470,900 47,371,000 255,099,900 84.34 1.36 3,469,359 1,221,495 2,247,8641998 841 49,481 293,863,600 47,168,900 246,694,700 83.95 1.36 3,355,048 356,859 2,998,1891999 867 49,853 299,518,000 45,764,900 253,753,100 84.72 1.36 3,451,042 223,779 3,227,2642000 862 49,451 292,415,900 40,347,300 252,068,600 86.20 1.34 3,377,719 384,850 2,992,8692001 856 58,397 280,506,300 37,887,100 242,619,200 86.49 1.30 3,154,050 1,206,600 1,947,450

Table 6: Average Assessed Value History of Residential Property
** The units included in this table are all residential properties in the Single Family Detached, Duplex, Townhouse and Condominium categories. Houses on commercially zoned or agricultural parcels and houses that were partially complete as of January 1, 2001 are not included. Tax exempt properties and parcels owned by homeowners associations are also not included.
The difference between the unit counts in successive years does not always equal the number of new houses added. During reassessment, properties are often reclassified, causing the unit counts to be slightly inconsistent.
Average Assessed Value—All Residential 1992-2001
A-5
Single Family All Percent Total NumberYear and Duplexes Townhouses Condominiums Residential Change of Units**2001 $189,567 $112,962 $78,672 $160,116 10.44% 82,2732000 170,719 103,867 74,778 144,979 5.95% 79,0971999 160,347 99,785 73,264 136,841 3.33% 76,0091998 153,564 98,953 73,416 132,435 2.01% 73,6411997 149,867 97,802 72,319 129,831 0.88% 71,3791996 147,836 97,399 72,307 128,700 0.49% 69,3921995 146,752 96,179 66,148 128,073 0.49% 69,5151994 144,979 97,400 73,261 127,447 1.23% 67,7291993 141,319 98,995 74,996 125,901 -1.52% 65,9551992 141,579 101,781 75,328 127,840 -1.45% 64,446
120,000
125,000
130,000
135,000
140,000
145,000
150,000
155,000
160,000
165,000
Ave
rag
e A
sses
smen
t
1992 1993 1994 1995 1996 1997 1998 1999 2000 2001

Table 7: Assessed Values and Estimated Market Values
(1) Assessed values include landbook values plus all supplements. (2) Ratios are from the Department of Taxation Sales Ratio Study. Since the ratios for the two most current years are not available, they are estimated based on the assessment office’s internal sale ratio report. Where no ratio is calculated because of insufficient sales, the county average is used.
A-6
--------------Residential-------------- --------------Apartments-------------- -------------Commercial------------- Estimated Estimated Estimated
Assessed Market Assessed Market Assessed Market
Year Value (1) Ratio (2) Value Value Ratio Value Value Ratio Value1980 $2,131,797,770 82.81% $2,574,365,693 $126,407,900 81.90% $154,344,200 $227,463,236 80.80% $281,513,906
1981 2,496,165,634 83.32% 2,995,959,673 145,525,400 86.40% 168,432,176 254,782,907 94.00% 271,045,646
1982 2,897,995,000 89.54% 3,236,546,146 154,967,400 89.50% 173,147,933 271,271,700 92.10% 294,540,391
1983 3,106,709,600 90.19% 3,444,667,501 149,938,000 88.20% 169,997,732 286,997,800 77.80% 368,891,774
1984 3,343,656,900 91.47% 3,655,269,910 152,684,200 79.40% 192,297,481 339,914,050 85.50% 397,560,292
1985 3,676,671,955 92.97% 3,954,640,133 167,598,800 95.50% 175,496,126 389,988,900 74.60% 522,773,324
1986 4,286,555,505 88.98% 4,817,572,426 152,779,407 86.10% 177,444,143 609,967,591 84.80% 719,301,404
1987 4,915,038,157 86.26% 5,697,619,932 201,431,800 86.60% 232,600,231 868,264,514 87.10% 996,859,373
1988 6,073,000,000 86.86% 6,991,343,815 364,937,703 87.10% 418,987,030 1,206,843,134 92.30% 1,307,522,355
1989 7,375,061,119 89.57% 8,234,119,848 434,846,310 89.50% 485,861,799 1,581,679,077 90.40% 1,749,644,996
1990 8,621,293,511 93.72% 9,198,674,438 497,596,200 93.70% 531,052,508 1,984,167,101 93.10% 2,131,221,376
1991 8,603,397,761 95.40% 9,018,236,647 510,557,025 95.30% 535,736,647 2,110,896,331 92.00% 2,294,452,534
1992 8,602,192,270 95.43% 9,014,458,397 509,531,300 95.50% 533,540,628 2,286,505,527 90.60% 2,523,736,785
1993 8,606,600,138 93.04% 9,250,118,987 445,593,600 93.00% 479,132,903 2,103,214,900 68.50% 3,070,386,715
1994 8,803,946,984 93.17% 9,449,674,759 500,795,500 93.20% 537,334,227 1,951,947,452 93.80% 2,080,967,433
1995 9,188,858,123 93.66% 9,810,444,737 508,437,600 93.70% 542,622,839 1,895,893,800 85.10% 2,227,842,303
1996 9,485,586,185 93.75% 10,118,012,026 529,799,000 93.80% 564,817,697 1,953,576,715 89.23% 2,189,372,089
1997 9,860,168,457 94.62% 10,421,211,481 549,714,725 94.88% 579,378,926 2,012,226,900 91.06% 2,209,781,353
1998 10,369,909,600 94.20% 11,007,854,687 617,458,900 94.44% 653,810,779 2,160,783,700 90.01% 2,400,604,044
1999 11,098,693,500 92.71% 11,971,432,711 643,008,800 93.04% 691,110,060 2,257,215,900 92.17% 2,448,970,272
2000 12,227,392,600 88.98% 13,741,731,400 665,511,800 88.97% 748,018,208 2,473,855,100 87.87% 2,815,358,029
2001 13,986,803,400 88.98% 15,719,041,807 766,554,400 88.97% 861,587,501 2,780,210,900 87.87% 3,164,004,666
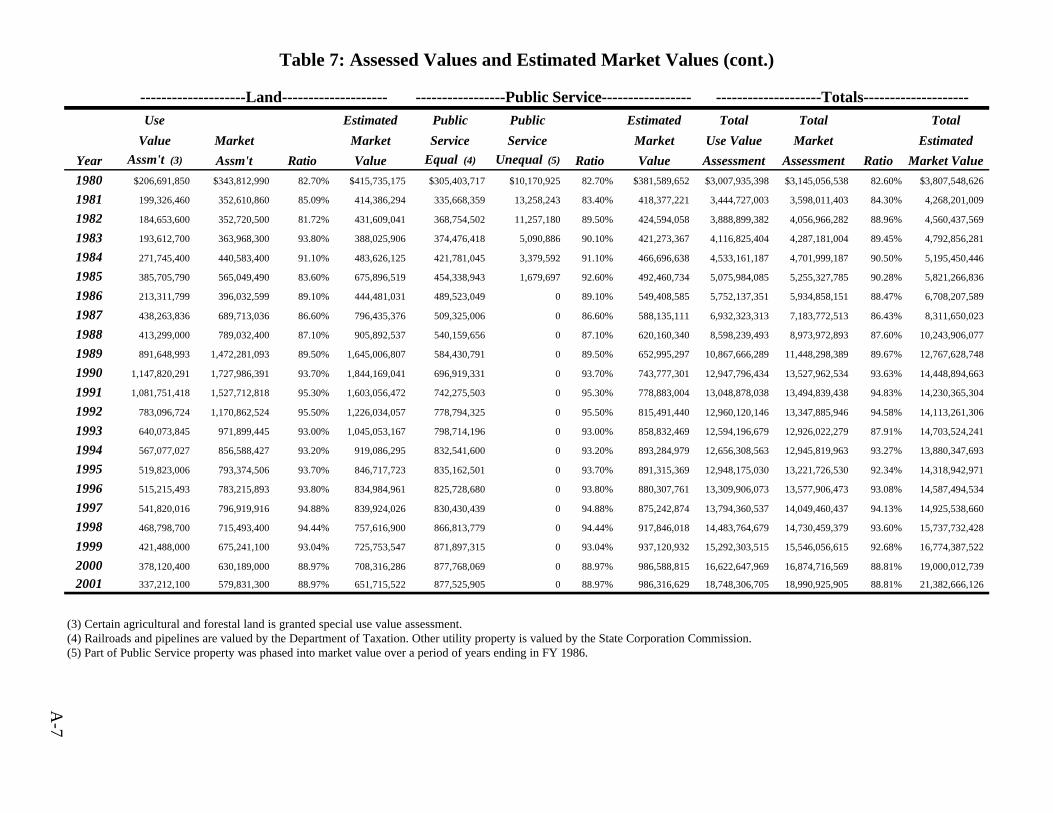
Table 7: Assessed Values and Estimated Market Values (cont.)
(3) Certain agricultural and forestal land is granted special use value assessment. (4) Railroads and pipelines are valued by the Department of Taxation. Other utility property is valued by the State Corporation Commission. (5) Part of Public Service property was phased into market value over a period of years ending in FY 1986.
A-7
--------------------Land-------------------- -----------------Public Service----------------- --------------------Totals--------------------Use Estimated Public Public Estimated Total Total Total
Value Market Market Service Service Market Use Value Market Estimated
Year Assm't (3) Assm't Ratio Value Equal (4) Unequal (5) Ratio Value Assessment Assessment Ratio Market Value1980 $206,691,850 $343,812,990 82.70% $415,735,175 $305,403,717 $10,170,925 82.70% $381,589,652 $3,007,935,398 $3,145,056,538 82.60% $3,807,548,626
1981 199,326,460 352,610,860 85.09% 414,386,294 335,668,359 13,258,243 83.40% 418,377,221 3,444,727,003 3,598,011,403 84.30% 4,268,201,009
1982 184,653,600 352,720,500 81.72% 431,609,041 368,754,502 11,257,180 89.50% 424,594,058 3,888,899,382 4,056,966,282 88.96% 4,560,437,569
1983 193,612,700 363,968,300 93.80% 388,025,906 374,476,418 5,090,886 90.10% 421,273,367 4,116,825,404 4,287,181,004 89.45% 4,792,856,281
1984 271,745,400 440,583,400 91.10% 483,626,125 421,781,045 3,379,592 91.10% 466,696,638 4,533,161,187 4,701,999,187 90.50% 5,195,450,446
1985 385,705,790 565,049,490 83.60% 675,896,519 454,338,943 1,679,697 92.60% 492,460,734 5,075,984,085 5,255,327,785 90.28% 5,821,266,836
1986 213,311,799 396,032,599 89.10% 444,481,031 489,523,049 0 89.10% 549,408,585 5,752,137,351 5,934,858,151 88.47% 6,708,207,589
1987 438,263,836 689,713,036 86.60% 796,435,376 509,325,006 0 86.60% 588,135,111 6,932,323,313 7,183,772,513 86.43% 8,311,650,023
1988 413,299,000 789,032,400 87.10% 905,892,537 540,159,656 0 87.10% 620,160,340 8,598,239,493 8,973,972,893 87.60% 10,243,906,077
1989 891,648,993 1,472,281,093 89.50% 1,645,006,807 584,430,791 0 89.50% 652,995,297 10,867,666,289 11,448,298,389 89.67% 12,767,628,748
1990 1,147,820,291 1,727,986,391 93.70% 1,844,169,041 696,919,331 0 93.70% 743,777,301 12,947,796,434 13,527,962,534 93.63% 14,448,894,663
1991 1,081,751,418 1,527,712,818 95.30% 1,603,056,472 742,275,503 0 95.30% 778,883,004 13,048,878,038 13,494,839,438 94.83% 14,230,365,304
1992 783,096,724 1,170,862,524 95.50% 1,226,034,057 778,794,325 0 95.50% 815,491,440 12,960,120,146 13,347,885,946 94.58% 14,113,261,306
1993 640,073,845 971,899,445 93.00% 1,045,053,167 798,714,196 0 93.00% 858,832,469 12,594,196,679 12,926,022,279 87.91% 14,703,524,241
1994 567,077,027 856,588,427 93.20% 919,086,295 832,541,600 0 93.20% 893,284,979 12,656,308,563 12,945,819,963 93.27% 13,880,347,693
1995 519,823,006 793,374,506 93.70% 846,717,723 835,162,501 0 93.70% 891,315,369 12,948,175,030 13,221,726,530 92.34% 14,318,942,971
1996 515,215,493 783,215,893 93.80% 834,984,961 825,728,680 0 93.80% 880,307,761 13,309,906,073 13,577,906,473 93.08% 14,587,494,534
1997 541,820,016 796,919,916 94.88% 839,924,026 830,430,439 0 94.88% 875,242,874 13,794,360,537 14,049,460,437 94.13% 14,925,538,660
1998 468,798,700 715,493,400 94.44% 757,616,900 866,813,779 0 94.44% 917,846,018 14,483,764,679 14,730,459,379 93.60% 15,737,732,428
1999 421,488,000 675,241,100 93.04% 725,753,547 871,897,315 0 93.04% 937,120,932 15,292,303,515 15,546,056,615 92.68% 16,774,387,522
2000 378,120,400 630,189,000 88.97% 708,316,286 877,768,069 0 88.97% 986,588,815 16,622,647,969 16,874,716,569 88.81% 19,000,012,739
2001 337,212,100 579,831,300 88.97% 651,715,522 877,525,905 0 88.97% 986,316,629 18,748,306,705 18,990,925,905 88.81% 21,382,666,126
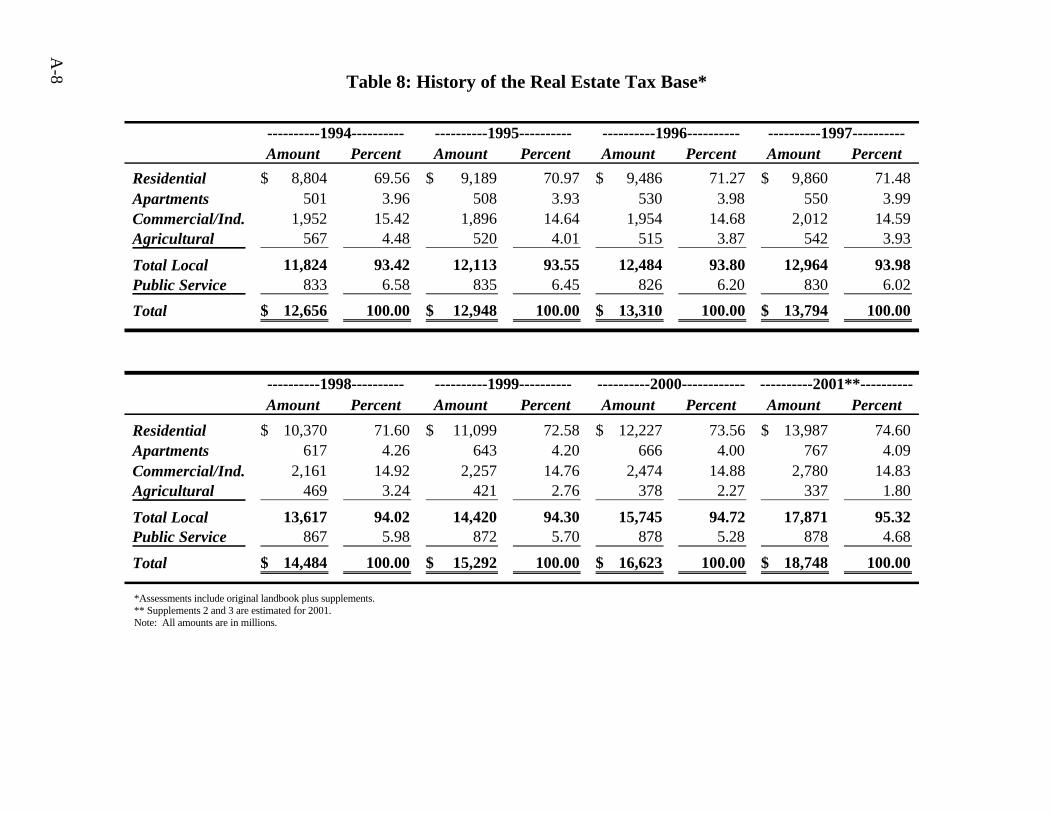
Table 8: History of the Real Estate Tax Base*
*Assessments include original landbook plus supplements. ** Supplements 2 and 3 are estimated for 2001. Note: All amounts are in millions.
A-8
----------1994---------- ----------1995---------- ----------1996---------- ----------1997----------Amount Percent Amount Percent Amount Percent Amount Percent
Residential 8,804$ 69.56 9,189$ 70.97 9,486$ 71.27 9,860$ 71.48 Apartments 501 3.96 508 3.93 530 3.98 550 3.99 Commercial/Ind. 1,952 15.42 1,896 14.64 1,954 14.68 2,012 14.59 Agricultural 567 4.48 520 4.01 515 3.87 542 3.93
Total Local 11,824 93.42 12,113 93.55 12,484 93.80 12,964 93.98 Public Service 833 6.58 835 6.45 826 6.20 830 6.02
Total 12,656$ 100.00 12,948$ 100.00 13,310$ 100.00 13,794$ 100.00
----------1998---------- ----------1999---------- ----------2000------------ ----------2001**----------Amount Percent Amount Percent Amount Percent Amount Percent
Residential 10,370$ 71.60 11,099$ 72.58 12,227$ 73.56 13,987$ 74.60 Apartments 617 4.26 643 4.20 666 4.00 767 4.09 Commercial/Ind. 2,161 14.92 2,257 14.76 2,474 14.88 2,780 14.83 Agricultural 469 3.24 421 2.76 378 2.27 337 1.80
Total Local 13,617 94.02 14,420 94.30 15,745 94.72 17,871 95.32 Public Service 867 5.98 872 5.70 878 5.28 878 4.68
Total 14,484$ 100.00 15,292$ 100.00 16,623$ 100.00 18,748$ 100.00

Table 9: Public Service and Commercial/Industrial Assessments
Note: Supplement 2 and 3 assessments for 2001 are estimated.
Comparison of Public Service and Commercial/Industrial Assessments
A-9
1990 1991 1992 1993 1994 1995 1996 1997 1998 1999 2000 2001Public Service 5.38% 5.69% 6.01% 6.34% 6.58% 6.45% 6.20% 6.02% 5.98% 5.70% 5.28% 4.68%
Commercial/Ind. 15.32% 16.18% 17.64% 16.70% 15.42% 14.64% 14.68% 14.59% 14.92% 14.76% 14.88% 14.83%
Total 20.71% 21.87% 23.65% 23.04% 22.00% 21.09% 20.88% 20.61% 20.90% 20.46% 20.16% 19.51%
0%
5%
10%
15%
20%
25%
1990 1991 1992 1993 1994 1995 1996 1997 1998 1999 2000 2001
Per
cent
age
of T
ax B
ase
Public Service
Commercial/Ind.

Table 10: Assessment Performance Statistics
* Insufficient sales. ** 2000 ratios are estimated by the assessments office based on 2000 sales. There is not enough information to make an estimate for 2001. (1) "Level of Assessment" refers to the median ratio of assessment to selling price as reported by the Department of Taxation. (2) "Equity of Assessments" is the average percentage sales deviate from the median ratio. (3) Standards are provided by the International Association of Assessing Officers.
A-10
Level of Assessment(1)
1991 1992 1993 1994 1995 1996 1997 1998 1999 2000** Standard (3)
Residential Urban 95.40% 95.80% 94.00% 94.10% 93.90% 94.06% 95.28% 95.20% 93.43% 89.33% 100.00%Residential Suburban 95.40% 93.60% 87.80% 91.00% 92.50% 92.14% 91.78% 89.90% 88.77% 85.21% 100.00% Weighted Average (Residential) 95.40% 95.43% 93.04% 93.17% 93.66% 93.75% 94.62% 94.20% 92.71% 88.98% 100.00%Apartment * * * * * * * * * * 100.00%Commercial/Industrial 92.00% 90.60% 68.50% 93.80% 85.10% 89.23% 91.06% 90.01% 92.17% 87.87% 100.00%Agricultural * * * * * * * * * * 100.00%Overall Median 95.30% 95.50% 93.00% 93.20% 93.70% 93.80% 94.88% 94.44% 93.04% 88.97% 100.00%
Equity of Assessments(2)
1991 1992 1993 1994 1995 1996 1997 1998 1999 2000** Standard (3)
Residential Urban 3.10% 3.42% 4.23% 4.66% 7.04% 6.75% 5.50% 5.98% 5.91% 6.48% 10.00%Residential Suburban 4.10% 4.58% 9.10% 7.07% 9.69% 9.03% 10.37% 10.41% 10.71% 11.49% 10.00% Weighted Average (Residential) 3.23% 3.62% 4.98% 5.39% 7.49% 7.12% 6.42% 6.81% 6.65% 7.22% 10.00%Apartment * * * * * * * * * * 15.00%Commercial/Industrial 6.00% 12.42% 24.66% 12.53% 18.85% 31.07% 17.86% 28.13% 24.59% 26.83% 15.00%Agricultural * * * * * * * * * * 20.00%Overall Equity 3.20% 3.61% 6.84% 6.07% 7.77% 7.48% 6.87% 7.50% 7.06% 7.48% 10.00%

Table 11A: Growth and Appreciation
*All changes in Public Service are attributed to growth.
Note: These tables do not include supplements.
A-11
1999 to 20001999 --------Appreciation-------- ------------Growth------------ 2000 Total
Landbook Value Amount % Amount % Landbook Value ChangeResidential 10,930,281,700$ 471,095,100$ 4.31 624,613,200$ 5.71 12,025,990,000$ 10.02 Apartments 642,422,000 20,818,800 3.24 0 - 663,240,800 3.24 Commercial/Industrial 2,232,907,300 39,323,200 1.76 176,251,900 7.89 2,448,482,400 9.65 Agricultural 412,250,800 (5,052,700) (1.23) (29,522,200) (7.16) 377,675,900 (8.39)
Total Landbook 14,217,861,800 526,184,400 3.70 771,342,900 5.43 15,515,389,100 9.13 Public Service* 871,897,315 - - 5,870,754 0.67 877,768,069 0.67
Total 15,089,759,115$ 526,184,400$ 3.49 777,213,654$ 5.15 16,393,157,169$ 8.64
2000 to 20012000 --------Appreciation-------- ------------Growth------------ 2001 Total
Landbook Value Amount % Amount % Landbook Value ChangeResidential 12,025,990,000$ 914,392,600$ 7.60 793,303,200$ 6.60 13,733,685,800$ 14.20 Apartments 663,240,800 60,036,500 9.05 26,708,900 4.03 749,986,200 13.08 Commercial/Industrial 2,448,482,400 241,721,400 9.87 70,583,300 2.88 2,760,787,100 12.76 Agricultural 377,675,900 8,686,500 2.30 (50,251,100) (13.31) 336,111,300 (11.01)
Total Landbook 15,515,389,100 1,224,837,000 7.89 840,344,300 5.42 17,580,570,400 13.31 Public Service* 877,768,069 - - (242,164) (0.03) 877,525,905 (0.03)
Total 16,393,157,169$ 1,224,837,000$ 7.47 840,102,136$ 5.12 18,458,096,305$ 12.60
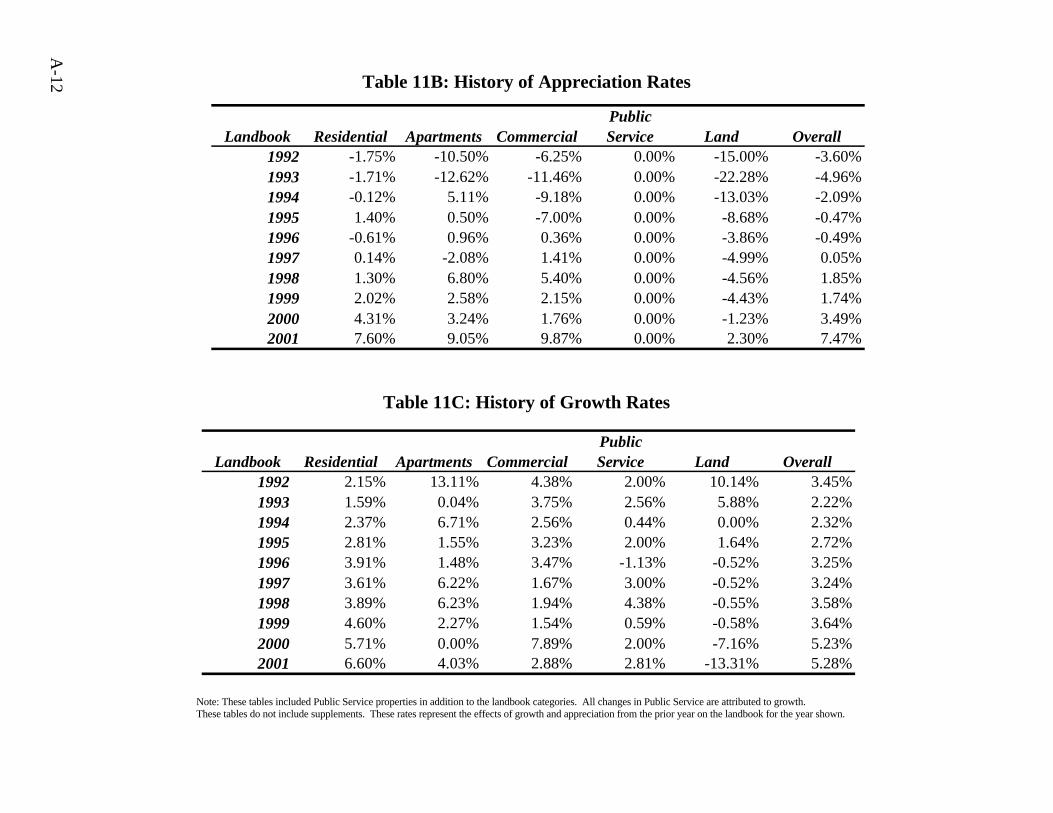
Table 11B: History of Appreciation Rates
Table 11C: History of Growth Rates
Note: These tables included Public Service properties in addition to the landbook categories. All changes in Public Service are attributed to growth. These tables do not include supplements. These rates represent the effects of growth and appreciation from the prior year on the landbook for the year shown.
A-12
PublicLandbook Residential Apartments Commercial Service Land Overall
1992 2.15% 13.11% 4.38% 2.00% 10.14% 3.45%1993 1.59% 0.04% 3.75% 2.56% 5.88% 2.22%1994 2.37% 6.71% 2.56% 0.44% 0.00% 2.32%1995 2.81% 1.55% 3.23% 2.00% 1.64% 2.72%1996 3.91% 1.48% 3.47% -1.13% -0.52% 3.25%1997 3.61% 6.22% 1.67% 3.00% -0.52% 3.24%1998 3.89% 6.23% 1.94% 4.38% -0.55% 3.58%1999 4.60% 2.27% 1.54% 0.59% -0.58% 3.64%2000 5.71% 0.00% 7.89% 2.00% -7.16% 5.23%2001 6.60% 4.03% 2.88% 2.81% -13.31% 5.28%
PublicLandbook Residential Apartments Commercial Service Land Overall
1992 -1.75% -10.50% -6.25% 0.00% -15.00% -3.60%1993 -1.71% -12.62% -11.46% 0.00% -22.28% -4.96%1994 -0.12% 5.11% -9.18% 0.00% -13.03% -2.09%1995 1.40% 0.50% -7.00% 0.00% -8.68% -0.47%1996 -0.61% 0.96% 0.36% 0.00% -3.86% -0.49%1997 0.14% -2.08% 1.41% 0.00% -4.99% 0.05%1998 1.30% 6.80% 5.40% 0.00% -4.56% 1.85%1999 2.02% 2.58% 2.15% 0.00% -4.43% 1.74%2000 4.31% 3.24% 1.76% 0.00% -1.23% 3.49%2001 7.60% 9.05% 9.87% 0.00% 2.30% 7.47%

Table 12: Top Fifty Real Estate Taxpayers—FY2001
Tax Base = $16,393,157,169 (Total 2000 Landbook Plus Public Service Assessments)
A-13
Rank Owner Name 2000 Assessment % of Tax Base
Rank Owner Name 2000 Assessment % of Tax Base
1 VIRGINIA ELECTRIC & POWER COMPANY $410,718,818 2.505% 26 JJJ AMPHITHEATER LIMITED PTNSHP $23,433,300 0.143%2 WASHINGTON OUTLET MALL LTD $192,584,100 1.175% 27 COSCAN WASHINGTON INC $23,278,300 0.142%3 NORTHERN VIRGINIA ELECTRIC CO-OP $157,946,999 0.963% 28 HOUSING & URBAN DEV SEC $21,805,900 0.133%4 GTE SOUTH $136,738,422 0.834% 29 DOMINION COUNTRY CLUB LP $21,264,800 0.130%5 AMERICA ONLINE INC $71,065,200 0.434% 30 SRK MISTY RIDGE ASSOCS LTD PTNSHP $21,059,200 0.128%6 WNH LIMITED PARTNERSHIP $62,889,000 0.384% 31 POWELLS CREEK TOWNE SQUARE LTD $18,747,600 0.114%7 MANASSAS MALL LLC $61,473,900 0.375% 32 VETERANS AFFAIRS SEC $18,299,800 0.112%8 WASHINGTON GAS LIGHT COMPANY $59,461,659 0.363% 33 WINDSOR POTOMAC VISTA LTD PTNSHP $18,296,200 0.112%9 HYLTON IRENE TRUST $57,915,400 0.353% 34 SUMMERLAND HEIGHTS LP $18,295,900 0.112%
10 POTOMAC MILLS PHASE III LTD PTNSHP $54,784,100 0.334% 35 RIDGEDALE INC $17,926,900 0.109%11 HYLTON $53,352,600 0.325% 36 WAL MART STORES INC $17,376,100 0.106%12 KIR SMOKETOWN STATION LP $45,830,700 0.280% 37 K HOVNANIAN AT PRINCE WILLIAM LLC $17,353,500 0.106%13 LBK LP $41,065,300 0.251% 38 COMBINED PROPERTIES LMTD PARTNSHP $16,840,800 0.103%14 U S HOME CORPORATION $39,809,000 0.243% 39 PIEDMONT LC $16,546,900 0.101%15 WESTMINSTER PRESBYTERIAN RETIREMENT$36,275,800 0.221% 40 RTJ LIMITED LIABILITY COMPANY $15,787,700 0.096%16 IBV-IMMOBILIENFONDS INT'L 2 USA LP $35,933,500 0.219% 41 LAKESIDE II LP A/K/A MARKET AT OPITZ CROSSING$15,767,900 0.096%17 ACQUIPORT MIDATLANTIC RETAIL INC $34,057,300 0.208% 42 POTOMAC FESTIVAL LTD $15,569,900 0.095%18 PRINCE WILLIAM SQUARE ASSOCIATES $32,520,400 0.198% 43 VMS ANDEN SOUTHBRIDGE VENTURE $15,460,600 0.094%19 UNITED DOMINION REALTY TRUST INC $29,135,100 0.178% 44 BEAZER HOMES CORP $15,270,000 0.093%20 METROPOLITAN LIFE INSURANCE COMPANY$27,583,200 0.168% 45 BIRCHWOOD MANASSAS ASSOCIATES LLC $15,107,400 0.092%21 PARADISE RIDGE ASSOCS LTD PTNSHP $27,523,700 0.168% 46 ORCHARD GLEN EAST INC $14,998,900 0.091%22 WESTGATE APARTMENTS LMTD PARTNRSHP$26,820,100 0.164% 47 PARADISE SUDLEY NORTH LTD PTNSHP $14,977,600 0.091%23 LOCKHEED MARTIN FEDERAL SYSTEMS $26,531,900 0.162% 48 BELMONT BAY L C $14,417,800 0.088%24 TC CARLYLE STATION CO $25,780,100 0.157% 49 VIRGINIA AMERICAN WATER COMPANY $14,394,393 0.088%25 E&A SOUTHEAST LTD PTNSHP $24,908,300 0.152% 50 COLUMBIA GAS SERVICE OF VA $14,377,185 0.088%
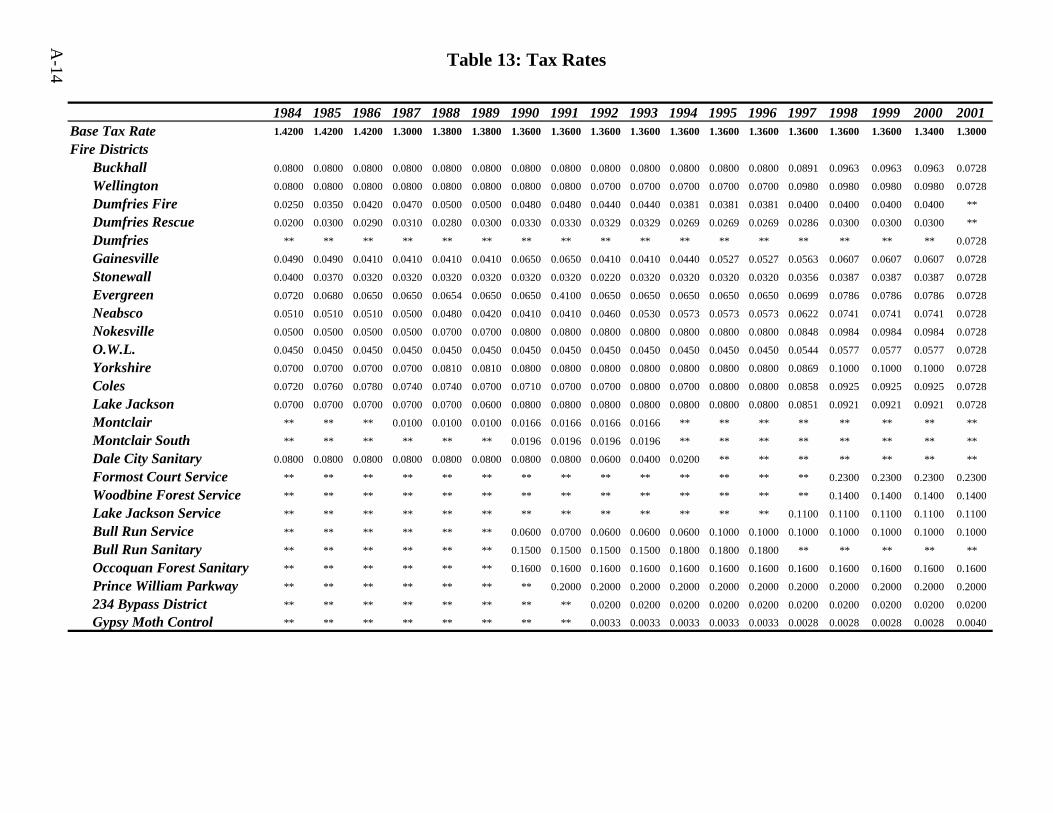
Table 13: Tax Rates
A-14
1984 1985 1986 1987 1988 1989 1990 1991 1992 1993 1994 1995 1996 1997 1998 1999 2000 2001Base Tax Rate 1.4200 1.4200 1.4200 1.3000 1.3800 1.3800 1.3600 1.3600 1.3600 1.3600 1.3600 1.3600 1.3600 1.3600 1.3600 1.3600 1.3400 1.3000
Fire DistrictsBuckhall 0.0800 0.0800 0.0800 0.0800 0.0800 0.0800 0.0800 0.0800 0.0800 0.0800 0.0800 0.0800 0.0800 0.0891 0.0963 0.0963 0.0963 0.0728
Wellington 0.0800 0.0800 0.0800 0.0800 0.0800 0.0800 0.0800 0.0800 0.0700 0.0700 0.0700 0.0700 0.0700 0.0980 0.0980 0.0980 0.0980 0.0728
Dumfries Fire 0.0250 0.0350 0.0420 0.0470 0.0500 0.0500 0.0480 0.0480 0.0440 0.0440 0.0381 0.0381 0.0381 0.0400 0.0400 0.0400 0.0400 **
Dumfries Rescue 0.0200 0.0300 0.0290 0.0310 0.0280 0.0300 0.0330 0.0330 0.0329 0.0329 0.0269 0.0269 0.0269 0.0286 0.0300 0.0300 0.0300 **
Dumfries ** ** ** ** ** ** ** ** ** ** ** ** ** ** ** ** ** 0.0728
Gainesville 0.0490 0.0490 0.0410 0.0410 0.0410 0.0410 0.0650 0.0650 0.0410 0.0410 0.0440 0.0527 0.0527 0.0563 0.0607 0.0607 0.0607 0.0728
Stonewall 0.0400 0.0370 0.0320 0.0320 0.0320 0.0320 0.0320 0.0320 0.0220 0.0320 0.0320 0.0320 0.0320 0.0356 0.0387 0.0387 0.0387 0.0728
Evergreen 0.0720 0.0680 0.0650 0.0650 0.0654 0.0650 0.0650 0.4100 0.0650 0.0650 0.0650 0.0650 0.0650 0.0699 0.0786 0.0786 0.0786 0.0728
Neabsco 0.0510 0.0510 0.0510 0.0500 0.0480 0.0420 0.0410 0.0410 0.0460 0.0530 0.0573 0.0573 0.0573 0.0622 0.0741 0.0741 0.0741 0.0728
Nokesville 0.0500 0.0500 0.0500 0.0500 0.0700 0.0700 0.0800 0.0800 0.0800 0.0800 0.0800 0.0800 0.0800 0.0848 0.0984 0.0984 0.0984 0.0728
O.W.L. 0.0450 0.0450 0.0450 0.0450 0.0450 0.0450 0.0450 0.0450 0.0450 0.0450 0.0450 0.0450 0.0450 0.0544 0.0577 0.0577 0.0577 0.0728
Yorkshire 0.0700 0.0700 0.0700 0.0700 0.0810 0.0810 0.0800 0.0800 0.0800 0.0800 0.0800 0.0800 0.0800 0.0869 0.1000 0.1000 0.1000 0.0728
Coles 0.0720 0.0760 0.0780 0.0740 0.0740 0.0700 0.0710 0.0700 0.0700 0.0800 0.0700 0.0800 0.0800 0.0858 0.0925 0.0925 0.0925 0.0728
Lake Jackson 0.0700 0.0700 0.0700 0.0700 0.0700 0.0600 0.0800 0.0800 0.0800 0.0800 0.0800 0.0800 0.0800 0.0851 0.0921 0.0921 0.0921 0.0728
Montclair ** ** ** 0.0100 0.0100 0.0100 0.0166 0.0166 0.0166 0.0166 ** ** ** ** ** ** ** **
Montclair South ** ** ** ** ** ** 0.0196 0.0196 0.0196 0.0196 ** ** ** ** ** ** ** **
Dale City Sanitary 0.0800 0.0800 0.0800 0.0800 0.0800 0.0800 0.0800 0.0800 0.0600 0.0400 0.0200 ** ** ** ** ** ** **
Formost Court Service ** ** ** ** ** ** ** ** ** ** ** ** ** ** 0.2300 0.2300 0.2300 0.2300
Woodbine Forest Service ** ** ** ** ** ** ** ** ** ** ** ** ** ** 0.1400 0.1400 0.1400 0.1400
Lake Jackson Service ** ** ** ** ** ** ** ** ** ** ** ** ** 0.1100 0.1100 0.1100 0.1100 0.1100
Bull Run Service ** ** ** ** ** ** 0.0600 0.0700 0.0600 0.0600 0.0600 0.1000 0.1000 0.1000 0.1000 0.1000 0.1000 0.1000
Bull Run Sanitary ** ** ** ** ** ** 0.1500 0.1500 0.1500 0.1500 0.1800 0.1800 0.1800 ** ** ** ** **
Occoquan Forest Sanitary ** ** ** ** ** ** 0.1600 0.1600 0.1600 0.1600 0.1600 0.1600 0.1600 0.1600 0.1600 0.1600 0.1600 0.1600
Prince William Parkway ** ** ** ** ** ** ** 0.2000 0.2000 0.2000 0.2000 0.2000 0.2000 0.2000 0.2000 0.2000 0.2000 0.2000
234 Bypass District ** ** ** ** ** ** ** ** 0.0200 0.0200 0.0200 0.0200 0.0200 0.0200 0.0200 0.0200 0.0200 0.0200
Gypsy Moth Control ** ** ** ** ** ** ** ** 0.0033 0.0033 0.0033 0.0033 0.0033 0.0028 0.0028 0.0028 0.0028 0.0040

B-1
Addenda

B-2
This page intentionally left blank.
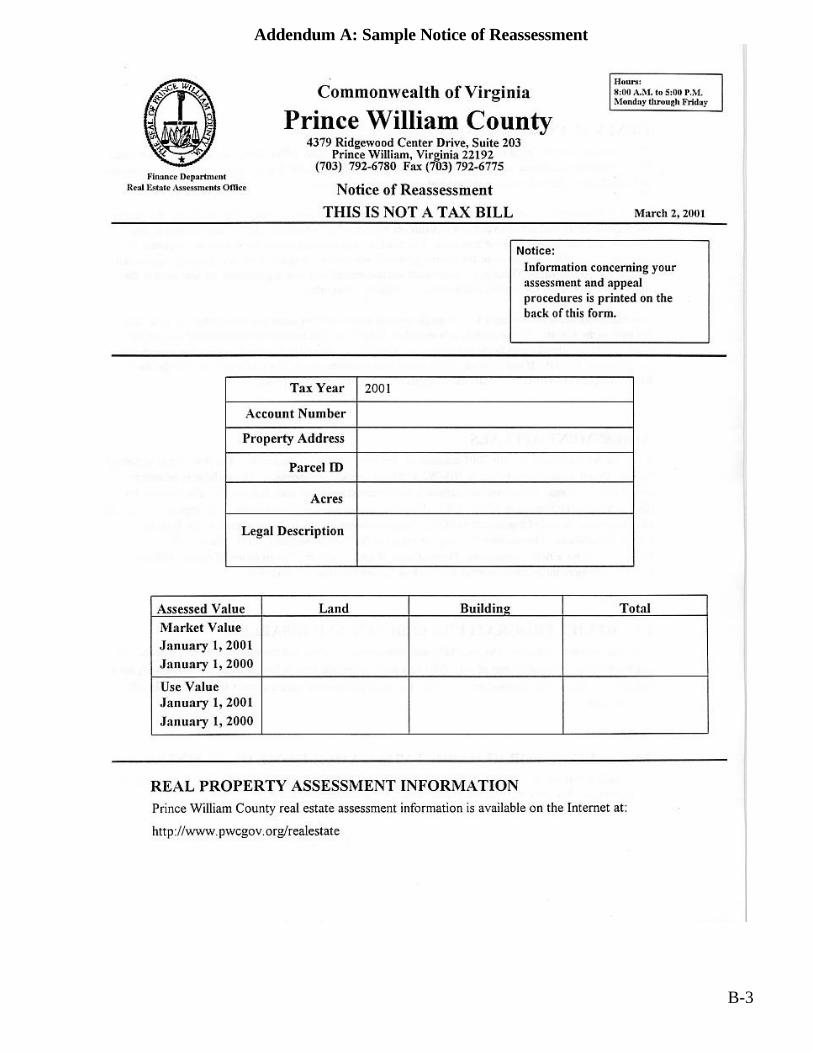
B-3
Addendum A: Sample Notice of Reassessment
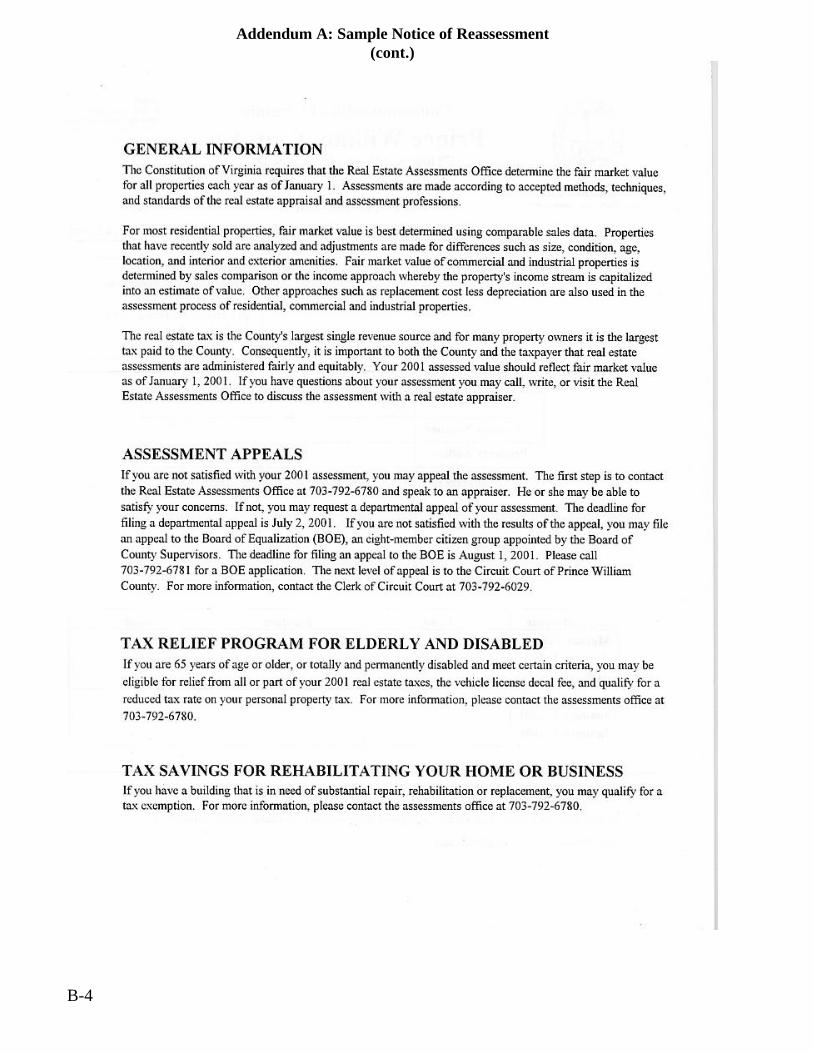
B-4
Addendum A: Sample Notice of Reassessment (cont.)

B-5
Addendum B: Rehabilitated Real Estate Program
Tax Exemption for Rehabilitated Real Estate Program
Tax Savings for Rehabilitating Your Home or Business What is the program? The Prince William Board of County Supervisors has approved an ordinance enacting a partial tax exemption for real estate that is substantially repaired, rehabilitated, or replaced. The tax exemption program encourages renovation and revitalization of aging structures located in the County. By improving the condition and appearance of existing properties, Prince William County will become a more appealing place for homeowners and businesses to invest. The amount of exemption is based on the increase in building value caused by rehabilitation. The minimum increase in value of the building is 25%. Exemptions are allowed for all property types: residential, commercial or industrial, and hotel or motel. Minimum age and size increase requirements apply. The tax exemption is applied over a 15 year period. The total tax savings is equal to 100% of the exemption each year for the first 10 years. Over the next 5 years the tax savings is reduced and the exemption is phased out as follows: 80% in year 11, 60% in year 12, 40% in year 13, 20% in year 14, and 0% in year 15. The tax exemption is transferable to a new property owner during the program period.
What are the requirements? Participation in the program is subject to the following requirements.
• The increase in building value due to rehabilitation, renovation, or replacement must be 25% or more of the building value before any work is done.
• Residential structures must be at least 15 years old and increase in size no more than 30%.
• Commercial or industrial structures must be at least 20 years old and increase in size no more than 100%.
• Hotel or motel structures must be at least 35 years old and increase in size no more than 100%.
• You must complete the rehabilitation by December 31 of the third calendar year after your application was submitted.
• You must submit the application and $50 non-refundable application fee after you obtain appropriate building permits, but before any work is started.
• Taxes must be kept current to qualify and remain in the program.
• All work must conform to existing building and zoning regulations.
• Applications must be filed after January 1, 1998, but before December 31, 2002.
• The maximum length of time for tax exemption is 15 years.

B-6
Other Information The base value of the structure will be the assessed value before commencement of any work. The Real Estate Assessments Division will make a final appraisal of the structure after work is complete, or after three years, to determine the increase in value due to rehabilitation. All work must conform to building and zoning regulations. Increase in assessed value due to rehabilitation is not equal to rehabilitation costs. Tax exemption is for the base real estate tax rate only and does not apply to fire and rescue levy, gypsy moth levy, stormwater management fee, or any other special taxing districts. The tax exemption does not apply to land value. 5 Steps to Exemption To begin your real estate tax savings, follow these 5 steps toward exemption.
1. Building Permits Obtain all necessary building permits before applying for tax exemption. Contact the Construction Permits and Records Office at (703) 792-7125 or 792-6930. The building permit office is located in the McCoart Building at 1 County Complex Court, Prince William, VA 22192.
2. Complete Application Complete an application form for the Tax Exemption for Rehabilitated Real Estate Program. Include with the application copies of all necessary building permits and a $50 non-refundable application fee. Submit the application to the Real Estate Assessments Division located at 4379 Ridgewood Center Drive, Suite 203, Prince William, VA 22192.
3. Determine Base Value Upon application approval, the Real Estate Assessments Division will inspect the property to determine the base value. The base value will be the assessed value before the commencement of any work.
4. Request Final Inspection When rehabilitation is complete, submit a written request for inspection to Real Estate Assessments Division. Include a copy of the certificate of occupancy with the inspection request. Requests should be received prior to November 1 of the year in which the rehabilitation is complete.
5. Begin Exemption If the property qualifies for the tax exemption program, exemption will begin on January 1 of the next calendar year.
How do I learn more?
For more information about the exemption program, or to make an appointment to discuss the program, contact the Real Estate Assessments Division at (703) 792-6780. Offices are located at 4379 Ridgewood Center Drive, Suite 203, Prince William, VA 22192. Applications can be obtained by calling the Real Estate Assessments Division. Information booklets and applications are also available at the building permit office located in the McCoart Building at 1 County Complex Court, Prince William, VA 22192.

B-7
Addendum C: Tax Relief Programs
A Citizen's Guide
to
Tax Relief Programs for
Elderly and Disabled Persons
Department of Finance
Real Estate Division
Prince William County Virginia
___________________________
Tax Relief Programs for Elderly and Disabled Persons
_________________________________________ Senior citizens and disabled persons who meet certain criteria (see eligibility criteria below) may be granted relief from all or part of real estate taxes, the vehicle license decal fee, and qualify for a reduced tax rate on their personal property tax. Qualifying limits may change from year to year. The limits in this brochure are current for the tax year beginning January 1, 2001, only. Tax relief is granted on an annual basis and a new application must be filed each year. Applications may be filed anytime after January 1st, but before April 15, 2001. _________________________________________
Eligibility Criteria _________________________________________ Senior Citizens: To qualify, an applicant must: - be 65 years of age or older as of December 31, 2000 - have a gross household income from all sources of not more than $40,150. In determining income, the first $6,500 of income earned by any relative living in the household other than the owner(s) or spouse is excluded. - have a combined financial net worth for the applicant and spouse residing in the household of not more than $195,000, excluding the residence for which the exemption is sought and up to one acre of land which it occupies.

B-8
Disabled Persons: To qualify, an applicant must: -present a certification from the Social Security Administration, Department of Veterans Affairs or Railroad Retirement Board stating that the applicant is permanently and totally disabled, or if not eligible for certification by any of these agencies, the applicant must present a sworn affidavit from two medical doctors, who are either licensed to practice medicine in Virginia or are military doctors on active duty, to the effect that the applicant is permanently and totally disabled. The affidavit of at least one of these doctors must be based on an actual physical examination. -meet the same gross household income and net worth qualifications as those for senior citizens, except the first $7,500 of any income received by the applicant as permanent disability compensation will be excluded as gross household income. ________________________________
Relief ___________________________________ Real Estate To qualify for real estate exemption or deferral, the residence must be owned and occupied by the applicant as of January 1, 2001, Total exemption of the tax on a home and up to one acre of land it occupies is granted to qualified applicants whose gross household income does not exceed $27,500 annually. Total or partial deferral of the tax on a home and up to one acre of land it occupies is granted to qualified applicants whose gross household income is greater than $22,000, but does not exceed $40,150. Tax deferral
means that the taxpayer can defer payment of some or all of the real estate taxes until the property is sold or bequeathed. The taxes accumulate with interest, but are not delinquent and no collection action is taken until the property is sold or bequeathed. The amount deferred depends upon income and is limited as follows: Combined Percent of Percent of Income Tax Relieved Tax You Pay $0 - $27,500 100% Exemption 0% $27,501 - $34,128 100% Deferred 0% $34,129 - $36,135 75% Deferred 25% $36,136 - $38,143 50% Deferred 50% $38,144 - $40,150 25% Deferred 75% Deferred real estate taxes are due and payable with interest within 60 days after the sale or transfer of the property, or within one year after the death of the last owner thereof who qualified for tax deferral. Deferred taxes, together with interest shall not exceed 33% of the assessed value of the property. Please call the Real Estate Assessments Office for more information.
Personal Property and Decal Those applicants who meet the net worth criteria above and whose combined income does not exceed $40,150 may qualify for a reduced tax rate on their vehicle and relief from the vehicle license decal fee on one auto per household. Applicants need not own real estate or apply for real estate tax relief to be eligible. The applicant must be a resident of Prince William County as of January 1, 2001. The vehicle must be registered in Prince William County as of January 1, 2001. Relief from the vehicle license decal fee is an exemption and is not deferred. Residents of towns must apply to the town government for relief from the vehicle license decal fee. Mobile Homes
For the purposes of this program, mobile homes are eligible for tax relief as real estate, and the same qualifications apply. _________________________________________
Application _________________________________________ Application forms for this program are available beginning January 1st at the Real Estate Assessments Office or by mail. You may request an application form by calling 792-6780 during regular business hours. Current tax relief recipients will receive an application form in the mail. The deadline for filing an application for tax relief is April 15, 2001. This deadline may be extended by the Finance Director, but only if the applicant is applying for the first time or for cases of hardship and where failure to apply by the deadline was due to reasons beyond the applicant's control. Please attach a letter to your completed application stating these reasons. NOTE: All information pertaining to gross household income and net worth is confidential and not open for public inspection. The application form must be signed in the presence of a notary. This service is available free of charge to applicants at the following location: Real Estate Assessments Office 4379 Ridgewood Center Drive, Suite 203 Prince William, Virginia 22192-5308 Telephone: (703) 792-6780 The office is open Monday through Friday from 8:00 a.m. to 5:00 p.m.

Addendum D: Sample Tax Bill County of Prince William, Virginia Tax Year 2001 FINANCE DEPARTMENT REAL ESTATE TAX BILL Tax Administration Division Due July 16, 2001 How to Contact Us Property Information When calling, please provide this RPC No: Location- 703-792-6710 -Taxpayer Services 703-792-6293 -TTY GPIN- 703-631-1703 ext. 6710 -Metro Number You may also fax questions to (703) 792-4673 or send by Legal Description- e-mail to [email protected] See reverse side for office locations and hours of operations
Assessment, Tax Rate, and Annual Tax Amount to Pay Land Value $ 54,200 First-Half Real Estate Tax $1,168.90 Building or Improvement Value $115,600 Past Due Balance 0.00 Total Assessed Value $169,800 Tax & Special Levy Rates (per $100 Assessed Value) BASE TAX RATE 1.30 GYPSY MOTH 0.0040 Total Due by JULY 16, 2001 $1,168.90 FIRE & RESCUE LEVY 0.0728 Total Tax Rate 1.3768 Total Annual Real Estate Tax
RETAIN THIS PORTION FOR YOUR RECORDS. THIS ALONG WITH YOUR CANCELLED CHECK IS YOUR RECEIPT
DETACH AND RETURN THIS PORTION WITH PAYMENT IN THE ENCLOSED ENVELOPE PRINCE WILLIAM COUNTY REAL ESTATE TAX
MAKE CHECK PAYABLE TO: PRINCE WILLIAM COUNTY
MAKE PAYMENTS TO:
PRINCE WILLIAM COUNTY P.O.BOX 85685
RICHMOND, VA 23285-5685