Embed Size (px)
Citation preview

Real Estate RoundtableSustainability Policy Advisory Committee
Tenant Energy Performance in Commercial Office Buildings
NRDC Center for Market InnovationHigh Performance Tenant Demonstration Project
January 31, 2013Washington, D.C.
Funding Partners:
Technical Advisors:

U.S. COMMERCIAL OFFICE REAL ESTATE IMPACT
12 billion square feet = $20 billion in annual energy costs
2

TENANT OPPORTUNITY
Over 50% of a building’s energy use comes from tenant spaces in commercial office buildings
Optimize energy performance, quality of spaces and building services through owner/ tenant collaboration
Base building energy efficiency goals and ratings are enhanced through better tenant energy performance
3

VALUE PROPOSITION
4
TENANTS:↓ energy consumption↓ operating & maintenance costs↑ workplace comfort↑ employee attraction/retention↑ occupant satisfaction↑ corporate responsibility &
investor recognition
REAL ESTATE OWNERS:↓ energy consumption↓ operations & maintenance cost↓ capital plan & infrastructure
upgrade cost↑ occupancy & tenant quality↑ tenant satisfaction↑ renewal probability↑ asset class, value & recognition

TENANT ENGAGEMENT
Challenges: 1) Data proving payback of energy
investments2) Project process/ execution expertise3) First cost funding solutions
5
Optimizing energy performance at time of build‐out, renovation or capital work maximizes ROI and minimizes incremental cost and disruption

ENERGY SAVINGS OPPORTUNITIES
6
Direct Digital Controls
Retrofit Chiller Plant
Daylight / Plugs
VAV AHUs
Windows
Energy Mgmt.Radiative Barrier
DCV
0
10
20
30
40
50
60
Base Building Measures Tenant Space Measures
Annu
al Ene
rgy Savings (million kB
tu)
Case Study: Empire State Building

QUANTIFIABLE RESULTS
7
Baseline energy use can be reduced by 30‐50%, optimizing energy performance with a payback of 3‐5 years, while providing a more comfortable and better performing building

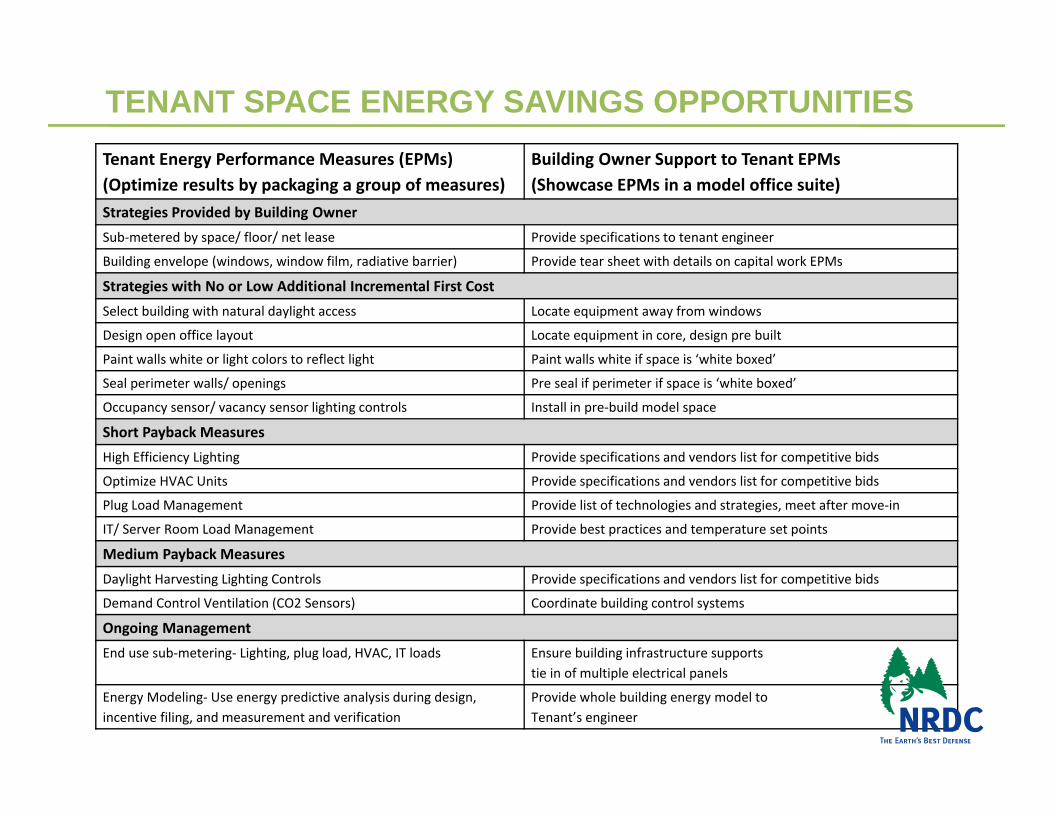
TENANT SPACE ENERGY SAVINGS OPPORTUNITIES
8
Optimize energy performance by
addressing all end uses:
1) Reducing loads2) Installing efficient
equipment3) Managing behavior

LEASE CYCLE ENERGY OPTIMIZATION PROCESS
TENANT SPACE ENERGY SAVINGS OPPORTUNITIES
10
Tenant Energy Performance Measures (EPMs)(Optimize results by packaging a group of measures)
Building Owner Support to Tenant EPMs(Showcase EPMs in a model office suite)
Strategies Provided by Building OwnerSub‐metered by space/ floor/ net lease Provide specifications to tenant engineer
Building envelope (windows, window film, radiative barrier) Provide tear sheet with details on capital work EPMs
Strategies with No or Low Additional Incremental First Cost Select building with natural daylight access Locate equipment away from windows
Design open office layout Locate equipment in core, design pre built
Paint walls white or light colors to reflect light Paint walls white if space is ‘white boxed’
Seal perimeter walls/ openings Pre seal if perimeter if space is ‘white boxed’
Occupancy sensor/ vacancy sensor lighting controls Install in pre‐build model space
Short Payback MeasuresHigh Efficiency Lighting Provide specifications and vendors list for competitive bids
Optimize HVAC Units Provide specifications and vendors list for competitive bids
Plug Load Management Provide list of technologies and strategies, meet after move‐in
IT/ Server Room Load Management Provide best practices and temperature set points
Medium Payback MeasuresDaylight Harvesting Lighting Controls Provide specifications and vendors list for competitive bids
Demand Control Ventilation (CO2 Sensors) Coordinate building control systems
Ongoing Management End use sub‐metering‐ Lighting, plug load, HVAC, IT loads Ensure building infrastructure supports
tie in of multiple electrical panels
Energy Modeling‐ Use energy predictive analysis during design, incentive filing, and measurement and verification
Provide whole building energy model to Tenant’s engineer

TENANT CASE STUDY: LF USA
11

TENANT CASE STUDY: LF USA
12

TENANT CASE STUDY: LF USA
13
Phase 1 (3 Floors)
Energy Performance Measures
Annual Electricity Reduction (kWh/yr)
Percentage of Electricity Use Reduction
from Baseline
Annual Electricity Cost Savings
Incremental First Cost
Simple Payback
Daylight Harvesting Controls 30,968 3.9% $5,359 ($41,850) 7.8 yrs
High Efficiency Lighting 55,746 7.1% $9,646 ($30,000) 3.1 yrsRight Sized HVAC Units { 0 0% $0 $0 N/A }Demand Control Ventilation (CO2Sensors)
21,147 2.7% $3,659 ($47,520) 13.0 yrs
Plug Load Management 103,713 13.2% $17,946 ($45,000) 2.5 yrsCombined EPM Package (Withoutincentives or energy modeling costs)
218,252 27.7% $37,766 ($164,370) 4.4 yrs
Net NYSERDA Incentives ‐‐ ‐‐ ‐‐ $36,940Energy Modeling Soft Costs ‐‐ ‐‐ ‐‐ ($6,600)Combined EPM Package (WithIncentives and energy modeling costs)
218,252 27.7% $37,776 ($134,030) 3.5 yrs

TENANT CASE STUDY: LF USA
14
Phase 1 Build‐Out (3 Floors)
Leased Premises 137,400 sq. ft. Modeled Energy Reduction 28%Total Electricity Savings over Lease Term 3,273,780 kWhIncremental Implementation Cost (w/o incentives) $164,370 State Incentives (net of review and filing costs) $36,940 Energy Modeling Soft Cost $6,600 Adjusted Incremental Implementation Cost $134,030 ($0.98/ft2)Total Electricity Cost Savings over Lease Term $566,495 Present Value of Electricity Cost Savings over Lease Term $392,002 Net Present Value of Project Investment $257,972 Return on Investment (ROI) over Lease Term 192%Annual Rate of Return 27%Payback Period 3.5 years

TENANT CASE STUDY: LF USA
15
Total Build‐Out (9 Floors)
Square Footage 412,200 sq. ft. Modeled Energy Reduction 31%Total Electricity Savings over Lease Term 10,519,320 kWh Incremental Implementation Cost (w/o incentives) $511,110 State Incentives (net of review and filing costs) $124,876 Energy Modeling Soft Cost $19,800 Adjusted Incremental Implementation Cost $406,034 ($0.99/ft2)Total Electricity Cost Savings over Lease Term $1,813,733 Present Value of Electricity Cost Savings over Lease Term $1,255,062 Net Present Value of Project Investment $849,028 Return on Investment (ROI) over Lease Term 209%Annual Rate of Return 29%Payback Period 3.4 years

LESSONS LEARNED
16
Make it easier to get to “yes”: Start early Involve top leadership/ decision makers Incorporate an integrated process Facilitate knowledge sharing Design tiers of performance solutions Provide economic frameworks Time and iterate the value analysis Document and measure results

LESSONS LEARNED
17
Motivators: Recognition/ marketing Better workplace quality Energy cost savings

TENANT DEMONSTRATION PROJECTS
18
1) LF USA: Empire State Building/ Malkin Holdings2) Coty: Empire State Building/ Malkin Holdings3) Bloomberg LP: 120 Park Avenue/ Global Holdings4) Reed Smith: 3 Logan/ Brandywine Realty Trust5) INTEC: 3 Flint Hill/ First Potomac Realty Trust6) Relay GSE: 40 W. 20th/ NRDC

TENANT RESOURCES
19
Process guides: Energy Performance Opportunities in Commercial Buildings(10‐step Lease Cycle Energy Optimization Process)Energy Performance Optimization (Project Development and Value Analysis Process)
Tools:Energy Modeling RFP TemplateEnergy Modeling Report TemplateIncremental Costing TemplateValue Analysis Calculator
Case Studies:SKANSKANRDC DCLi & Fung USA

TENANT ENGAGEMENT SOLUTIONS
Challenges: 1) Data proving payback of energy investments2) Project process/ execution expertise3) First cost funding solutions
a) Tiered Tenant Improvement Allowanceb) 3rd Party Energy Service Agreement Modelc) NYCEEC Pilot
20

FOR MORE INFORMATION:
http://www.nrdc.org/business/CGI/
Wendy FokProject Director, High Performance Tenant Demonstration ProjectCenter for Market [email protected]
Greg HaleDirector of Efficiency FinanceCenter for Market [email protected]
21