Embed Size (px)
Citation preview

Real Time Data Acquisition and Prediction Model Comparison using Maxi Directional Drills
by
Kyle Verwey
A thesis presented to the University of Waterloo
in fulfillment of the thesis requirement for the degree of
Master of Applied Science in
Civil Engineering
Waterloo, Ontario, Canada, 2013
© Kyle Verwey 2013

ii
Author’s Declaration I hereby declare that I am the sole author of this thesis. This is a true copy of the thesis, including any required final revisions, as accepted by my examiners.
I understand that my thesis may be made electronically available to the public.
Kyle Verwey

iii
Abstract
Horizontal Directional Drilling (HDD) is used around the world when traditional open cut methods are not
practical or impossible for installing pipelines. Maxi-sized drill rigs are the largest and most powerful
directional drills and are more common in the field than ever before with over 5,000 rigs in operation
world wide. The complexity of installations and the design associated with them continues to increase.
This research has two main objectives.
1. Develop a real time data acquisition system for monitoring pullback forces on the product
pipe; and,
2. Compare data gathered using maxi-sized drill rigs with current modelling methods using
BoreAid.
The first portion of the research, as listed above, required attaching multiple pressure transducers to the
drilling display panel in an American Auger DD-1100 drill rig and recording, in real time, the carriage,
rotation, and mud pressure as seen by the operator. This research also describes the various challenges
and issues associated with developing real time in-the-bore data acquisition processes. Finally, future
recommendations for further development of the in-the-bore data acquisition are discussed.
The second portion of this research describes how the gathered data was processed into a workable data
set. The field data was then compared to theoretical models by using the drill assistant tool BoreAid. The
results of this comparison show that these models are appropriate for all size drill rigs, although some
limitations are present.

iv
Acknowledgements
First and foremost I would like to thank my supervisor, Dr. Mark Knight, for his experience, insight, and
guidance throughout this long process. Without his industry connections and expert knowledge of this
subject, none of this would be possible.
I would also like to thank the staff at the Center for Advancement of Trenchless Technology (CATT), Alice
Seviora and Dr. Rizwan Younis for their support and assistance throughout the project. In addition, I would
like to acknowledge Earth Boring Co. for allowing me to install my system on to their drill rig and letting
me ride alongside them for each of the pull backs. Specifically John Currey for putting up with my constant
stream of e-mails and related inquiries.
I would also like to extend my sincerest appreciation to the following individuals for their assistance in
this research:
3. Paul Thorpe for training me on how to use the SoMat eDaq system.
4. Ken Bowman, Terry Ridgway and Richard Morrison for their assistance in testing and
calibrating my pressure transducers.
I would also like to thank faculty and staff for their help and support throughout my terms as a graduate
student. Finally, the support from my family and friends was needed throughout my study. A special thank
you to Olena, who supported me, believed in me, and kept me focused and on track even when I did not
want to be.

v
Table of Contents Author’s Declaration ............................................................................................................................... ii
Abstract ................................................................................................................................................. iii
Acknowledgements ................................................................................................................................ iv
List of Figures ........................................................................................................................................ vii
List of Tables .........................................................................................................................................viii
Chapter 1 - Introduction .......................................................................................................................... 1
1.1 General .................................................................................................................................... 1
1.2 Research Goals and Objectives....................................................................................................... 2
1.3 Thesis Outline ................................................................................................................................ 2
Chapter 2 – Horizontal Directional Drilling Overview ............................................................................... 3
2.1 Horizontal Directional Drilling Process............................................................................................ 3
2.2 Drill Rig Types ................................................................................................................................ 5
2.3 Drilling Fluids ................................................................................................................................. 6
2.4 Data Logging System ...................................................................................................................... 7
Chapter 3 - Designing On-line Data Acquisition System .......................................................................... 10
3.1 Developing an Ideal Data Framework ........................................................................................... 10
3.2 Phase 1: Real time surface data ................................................................................................... 10
3.3 Phase 2: Real time In-the-hole Data ............................................................................................. 11
Chapter 4 - Data Results ........................................................................................................................ 13
4.1 June 22, 2011 Pullback ................................................................................................................. 13
4.2 August 24, 2011 Pullback ............................................................................................................. 17
4.3 December 15, 2011 Pullback ........................................................................................................ 19
4.4 February 8th, 2012 Pullback .......................................................................................................... 21
Chapter 5 - Challenges of In-the-hole Data Logging ................................................................................ 24
5.1 Explored Data Transfer Methods .................................................................................................. 24
5.2 Future Recommendations for Development................................................................................. 25
Chapter 6 - Result Analysis and Model Comparison ............................................................................... 27
6.1 BoreAid ........................................................................................................................................ 27
6.2 ASTM F1962 and Friction Drag Equations ..................................................................................... 28
6.3 Model Comparisons ..................................................................................................................... 30
6.4 Discussion .................................................................................................................................... 33

vi
Chapter 7 – Conclusions and Recommendations .................................................................................... 34
References ............................................................................................................................................ 35

vii
List of Figures Figure 1: Profile of a typical HDD installation (NASTT Good Practices, 2001) ........................................... 3 Figure 2: Pipe Pull back set up (Jiang et al. 2012) ..................................................................................... 4 Figure 3: Pullback process for a HDD Installation (NASTT Good Practices, 2001) ...................................... 4 Figure 4: Examples of Maxi, Midi and Mini HDD rigs ................................................................................ 5 Figure 5: American Auger DD-1100 Set up in the field .............................................................................. 9 Figure 6: Carriage Gauge conversion Pressure to Force .......................................................................... 14 Figure 7: June 22, 2011 Pull Force vs Distance ....................................................................................... 15 Figure 8: June 22, 2011 Rod 34 Pull Force vs Distance ............................................................................ 16 Figure 9: June 22, 2011 Low Resolution Pull Force vs Distance ............................................................... 16 Figure 10: Rotation Gauge conversion Pressure to Force ....................................................................... 17 Figure 11: August 24, 2011 Pull Force vs Distance .................................................................................. 18 Figure 12: August 24, 2011 Low Resolution Pull Force ........................................................................... 19 Figure 13: August 24, 2011 Low Resolution Rotation Force .................................................................... 19 Figure 14: December 15, 2011 Pull Force vs Distance............................................................................. 20 Figure 15: December 15, 2011 Low Resolution Pull Force vs Distance .................................................... 21 Figure 16: December 15, 2011 Rotation Force vs Distance ..................................................................... 21 Figure 17: February 8, 2012 Pull Force vs Distance ................................................................................. 22 Figure 18: February 8, 2012 Low Resolution Pull Force vs Distance ........................................................ 23 Figure 19: February 8, 2012 Low Resolution Rotational Force vs Distance .............................................. 23 Figure 20: Explored data transfer options .............................................................................................. 25 Figure 21: ASTM F1962 Equation Model ................................................................................................ 29 Figure 22: June 22 Low Resolution Data with Comparison Methods from BoreAid ................................. 30 Figure 23: August 24 Low Resolution Data with Comparison Methods from BoreAid ............................. 31 Figure 24: December 15 Low Resolution Data with Comparison Methods from BoreAid ........................ 31 Figure 25: February 8 Low Resolution Data with Comparison Methods from BoreAid ............................ 32

viii
List of Tables Table 1: Recommended Relationship between Product PIpe Size and Reamed Diameter of a bore .......... 4 Table 2: NASTT Good Practices vs TT Magazine HDD Rig Size Rating ........................................................ 5 Table 3: Comparison of data logging equipment ...................................................................................... 8 Table 4: Parameters for BoreAid Inputs ................................................................................................. 28 Table 5: Installation Load Comparison Prediction vs Actual .................................................................... 33

1
Chapter 1 - Introduction
1.1 General Horizontal Directional Drilling (HDD) has been used as an alternative in new pipeline installation since the
1970s (Allouche et al. 2000). Originally, the relatively complicated and inaccurate steering system did not
build confidence in the technology, resulting in only 36 HDD installations to be completed from 1971 to
1979 (Allouche et al. 2000). The early 80s was a time of vast advancements in the technology, including
smaller more powerful rigs and new navigation tools for steering. The number of directional drilling rigs
increased from 12 rigs in 1984 to over 6,000 worldwide (Allouche et al. 2000). As HDD continues to
become a more common approach to pipeline installations, certain quality assurance and quality control
methods must be followed. American Society for Testing and Materials (ASTM) standard F1962-11 is the
most recent standard for HDD installations.
The rate and force applied to the product pipe is of particular importance, since improper installation
loads can severely damage the product pipe. If pull forces are too high, stretching and weakening of the
pipe walls can occur. If pull rates are too high, stretching, necking and general wall thinning can appear in
visible pipe sections. Currently, this pull force is controlled by the drill operator through the rate at which
the drill rods are pulled back. The only reading visible to the operator is from a pressure gauge located on
the main console. This reading can change drastically as the pipe is pulled through the ground. If the
product pipe catches on a rock or the drill path suffers a collapse, the pressure can spike and cause damage
to the pipe.
Since more than 95% of the pipe is below ground it is very difficult to survey the status of the pipe after
installation. If, after months or years of use, the pipe fails before its design life is up, the installation
methods or material quality is questioned. The most significant impact on the product pipe would have
been the installation pressures or, in the case of High Density Polyethylene (HDPE), the fusion procedure
as per ASTM 2620. To ensure the pipe was installed within manufacture recommended specifications,
installation data collection is critical.
2
1.2 Research Goals and Objectives The main goals of the research are to:
1) Develop a system to monitor, in real time, the forces felt by the product pipe during HDD
installation.
2) Better understand and compare theoretical design models to actual installation data.
To realize these goals, the following tasks were carried out:
1. Develop an ‘ideal’ framework for real time data acquisition of HDD pipe installations.
2. Build, install, and gather data using above ground data logging equipment.
3. Develop and troubleshoot underground real time data logging equipment.
4. Compare current mathematical models to gathered installation data.
To develop the necessary underground data acquisition systems required for the pressure readings, a
number of wireless and wired data transfer options were explored.
1.3 Thesis Outline Chapter 2 of this thesis provides an overview of Horizontal Directional Drilling (HDD), the various types of
drill rigs, drilling fluids, and pipe materials in use, and current QA/QC systems available. Chapter 3 provides
details about the design assistant program BoreAid and the various methods that it uses to develop
theoretical installation designs. Chapter 4 presents the framework for real time data acquisition with all
the various attempts to develop a wireless underground system. Chapter 5 presents the gathered data
from four pipe installations with the data logging system in place. Chapter 6 discusses the analysis and
comparisons of the gathered data with the developed models. Chapter 7 states conclusions and
recommendations for future work.

3
Chapter 2 – Horizontal Directional Drilling Overview HDD is used to install pipelines under rivers, creeks, cemeteries, gas pipelines, and any other obstruction
that cannot easily be trenched. It can also be a preferred method when a pipeline is being installed at
extreme depths, where trenching is an impractical solution.
2.1 Horizontal Directional Drilling Process
A HDD installation is a process that is broken down into three phases. First the initial pilot bore must be
completed. This involves a steerable drill bit being pushed from the drill rig along a predetermined path.
There are a variety of drill bits available depending on the type of soil material that will be drilled through.
To control the direction of the drill bit, the most common system used is a magnetic signal transmitter,
called a SONDE, is installed in the drill head. This transmits to the surface the orientation of the drill bit.
To make the drill bit steerable, each drill bit will have one angled face and the drill bit will always push
away from the direction that the angled face is facing. By controlling the orientation of that angled face,
the driver/operator can steer the drill bit. If the drill bit needs to move in a straight line the angled face
will be directed to spin in circles while it is being pushed. The entire time the drill bit is cutting through
the ground, drilling fluid or mud is being forced out of the bit or reamer. The importance of this drill fluid
will be detailed in Section 2.3. Figure 1 presents an example of a profile for an HDD installation.
Figure 1: Profile of a typical HDD installation (NASTT Good Practices, 2001)
Once the bore path has been drilled with the steerable drill bit and the initial bore is completed, the
second phase involves pulling back a series of reamers to expand the bore path. These reamers will
gradually increase the size of the bore and the final dimension is based on the size of the product pipe.
Table 1 details the recommended relationship between product pipe size and the reamed diameter of the

4
bore (Bennet et al, 2001). While these are recommended guidelines the actual reamed diameter will be
up to the drill operator based on the situation and ground conditions.
Table 1: Recommended Relationship between Product PIpe Size and Reamed Diameter of a bore
Product Pipe Size Reamed Diameter
< 8” Diameter of product + 4”
8”-24” Diameter of product x 1.5
> 24” Diameter of product + 12”
The final phase of installation involves pulling the product pipe into the expanded bore path. The final
reamer is again used to maintain the size of the bore path. Behind the reamer is a revolving joint, which
is a type of swivel which stops the product pipe from rotating and adding additional stresses. Then a pipe
bushing attaches the pipe to the swivel. This set up is shown in Figure 2 (Jiang et al, 2012). This system is
then pulled through the entire bore path until the reamer is retrieved at the drill rig, Figure 3. Once the
pipe has been installed, spot excavations are made at each end to complete the construction.
Figure 2: Pipe Pull back set up (Jiang et al. 2012)
Figure 3: Pullback process for a HDD Installation (Bennet et al, 2001)

5
2.2 Drill Rig Types There are three classifications for sizes of HDD rigs; mini, midi, and maxi. While each manufacturer has
slight differences between each rating of rig, HDD rigs can pull from 5000 lbs for the smallest to over 1.3
million lbs of thrust (Vermeer D1320x900). Figure 4 shows a sample picture of each sized rig. While there
is no distinct cut off point between rating a rig mini or midi there are some general guidelines. Trenchless
Technology Special Supplement: Horizontal Directional Drilling Guide and NASTT Good Practice both
define the size of HDD rigs, these are compared in Table 2.
Figure 4: Examples of Maxi, Midi and Mini HDD rigs
Table 2: NASTT Good Practices vs TT Magazine HDD Rig Size Rating
NASTT Good Practices TT Magazine HDD Guide
Mini HDD Rigs Drilling Distance (ft) ≤ 700 ≤ 600
Thrust/Pullback (lbs) < 40,000 ≤ 20,000
Torque (ft-lbs) < 4,000 ≤ 950
Midi HDD Rigs Drilling Distance (ft) ≤ 2000 ≤ 1000
Thrust/Pullback (lbs) 40,000 – 100,000 > 20,000
Torque (ft-lbs) 4,000 – 20,000 > 950
Maxi HDD Rigs Drilling Distance (ft) ≤ 6000 > 1000
Thrust/Pullback (lbs) > 100,000 -------
Torque (ft-lbs) > 20,000 -------
When choosing which size of HDD rig will be used for any particular job, one must take into account design
considerations, space limitations, time constraints, and contractor availability. Larger jobs cannot be done
with smaller rigs, but sometimes having a slightly oversized rig is more advantageous than not.

6
2.3 Drilling Fluids When beginning a HDD installation the most important consideration are the drilling fluids. The purpose
of the drilling fluid is four fold. Firstly, it lubricates the reamer, drill rods, and product pipe. Second, during
stoppages the drill fluid stabilizes the bore hole. Third, additives to the drill fluid help to prevent water
and drill fluid from escaping the bore hole. And finally, it carries the soil cuttings out of the bore path.
When drilling fluid mixes with the soil cuttings it is called ‘slurry’ and can either be discarded or recycled.
An important consideration with regards to the drill fluid is the type of soil along the bore path, because
depending on the type of soil along the bore path the drill fluid will change.
The drilling process depends on the drill fluid so much that it can only progress as fast as the drill fluid can
flow. Since the fluid is removing the soil cuttings in the slurry, if the drilling progresses faster than the drill
fluid can remove the cuttings the drill head or reamer can become stuck. The properties of the fluid are
also very important, they must be tested before the drilling operation begins to make sure that the fluid
is designed to complement the soil along the path.
Drilling fluids have a number of properties that must be balanced and tested based on in-situ soil
conditions. Balancing these properties is very important to ensure a successful HDD installation. According
to NASTT Good Practices these properties include:
Viscosity, a fluids resistance to flow. If the mud is too thick or too thin it will not function
properly
Gel Strength, how well the ‘mud’ sticks together after stoppage of flow. The idea behind
this is to make sure any solid cuttings do not settle on the bottom of the bore hole during
changes but stay afloat in the slurry.
Fluid Loss, how much filtrate (water) is lost from the mud into the soil surrounding the
bore. Low fluid loss is key for a stable bore hole.
Fluid Density, the weight per volume of the mud. As the fluid absorbs cuttings and
becomes denser it must still be able to flow and move the cuttings from the bore hole.
Filter Cake, the thickness of mud layered on the edges of the bore hole. A thicker filter
cake will reduce the amount of filtrate that can flow out of the bore hole and support the
surrounding soil.
7
Sand Content, how much sand is in the drilling fluid. High sand content will reduce the
effectiveness of the drilling fluid and reduces the life expectancy of the drilling
equipment.
pH, the acidity or alkalinity of the fluid. Typically the pH of a drilling fluid should be 8 or 9
to give the additives the optimum environment for performance.
Lubricity, how well the drill fluid reduces friction. When pulling pipe or moving cuttings
the less friction is always better.
When the soil is very sandy, an expanding clay, usually bentonite, is added to the drill fluid. This clay will
fill the voids of the walls of the bore path to stabilize them. When the soil contains large amounts of clay,
a specific type of polymer can be added to support the clay and ensure the walls do not slump into the
bore path. There are a variety of drill fluid additives and any HDD installer will have their own preference
based on soil conditions.
The direction of flow of the drilling fluid also has an effect on the pullback forces required to move the
product pipe. Fluid always tends to flow along the path of least resistance, the same is true with drilling
mud. As reamer moves along the bore the slurry will flow in the opposite direction of the pipe that is being
installed. When the reamer reaches approximately two thirds of the way to the pipe exit pit the flow of
mud will switch directions and begin to flow in the same direction that the pipe is being installed
(Duyvestyn et al, 2001).
2.4 Data Logging System All pipes, for instance stainless steel, Carbon Steel, High-Density Polyethylene (HDPE) or Polyvinyl chloride
(PVC), have a maximum yield strength. When pulling pipe, if the forces acting upon the pipe approach or
attain the particular level of yield strength for the type of pipe being used, the pipe may become damaged
or even break. The majority of pipes, if they ever fail, will do so during installation due to the active forces
during installation.
In practice today, while installing pipe, the pull and rotation pressures are monitored by the drill operator.
They are not recorded and human error can miss short spikes in pressures. After the installation if there
are any problems with the pipe, because there is no recorded data the installer can have difficultly proving
their install methods did not overstep the installation parameters. These short spikes can be caused by
obstructions catching on the reamer or pipe and could cause gouges in the product pipe. The reading from

8
the drillers gauge is the pull force felt by the rig. Since when installing pipe there is a reamer with a larger
diameter, the pull force is mostly attributed to the reamer and the force actually exerted on the product
pipe will be significantly less. Without a data logger between the reamer and the product pipe it is very
difficult to gauge the actual forces exerted on the pipe.
The TensiTrak, made by DigiTrak, is the one commercial data gathering and logging product currently on
the market that can be installed between the swivel and the product pipe to record and display in real
time the actual pull pressure felt by the pipe. This product is rated at 100,000 lbs of pull force and can
only be used on the mini and midi sized drill rigs. A similar product was developed and used at the
University of Western Ontario in 2003. These load cells were rated at different pull pressures, the largest
being 670 kN (150,000 lbf) and the smallest being 36 kN (8,000 lbf) (Baumert, Allouche & Moore, 2003).
Each load cell had a different method of downloading the data and it is unclear if the data can be viewed
real-time.
Additionally, previous research done at the University of Waterloo Duyvestyn (2001), Adedapo (2001) and
Ho (2007) using a DAQ system that was built inside an HDPE casing and fused directly to the HDPE product
pipe. This head was then attached to the swivel and used to pull back the product pipe. This equipment
monitored pull loads, mud pressures, pipe strain, temperatures and pipe wall deflection. The data
recorded by this system was stored on an internal storage unit and was available for download after the
HDPE casing was recovered. Table 3 presents a comparison of the different data logging equipment
detailed in this research. Additional references for table 3 include Baumert, et al. (2003) and Duyvestyn
(2009).
Table 3: Comparison of data logging equipment
Data Logger Origin Installation Sizes Pipe Material Loading Capacity Advantages Disadvantages University of Waterloo Custom Built PE/Steel Same as installed
Pipe No additional unit between reamer and pipe
Must be custom sized to pipe. No real time data logging
University of Western Ontario Based on Load Any 150,000 lbf Largest pull load capacity
No real time data logging. Causes turbulent mud flow.
DigiTrak TensiTrak Based on Load Any 100,000 lbf Compatible with DigiTrak walkover equipment
Causes turbulent mud flow. Limited loading capacity. Power limitations
Phase 1 Data Logging System Any Any Any Real time data Forces not measured at product pipe
Phase 2 Data Logging System Any Any Any Real time data Signal Transmission limitations. Power limitations.

9
This research was completed using an American Auger DD-1100 which can pull up to 1,100,000 lbs.
Currently, a data gathering and logging product does not exist that can be installed to withstand this pull
force.
Figure 5: American Auger DD-1100 Set up in the field
Previous research and testing by Baumert, et al. (2003) and J. Ho (2007) have worked with data logging
systems which record pipe pull forces and drilling mud pressures. However, this data was recorded using
an internal unit, installed directly between the reamer and the product pipe, and cannot be accessed until
after the pull is complete. While this can be helpful for quality assurance it does not help the installation
process or quality control. Any problems during installation could still be missed and without the real time
data problems may go unaddressed until well after the installation is complete. Those apparatus’
mentioned were only rated for mini to midi sized drill rigs so the larger, riskier, and more expensive
installations still do not have a real time quality assurance and quality control data logging system.
To further the previous research two main suggestions were put forth: first to gather data and display it
real time so that quality control can be done during pipe installation, and secondly to gather this data for
a large scale installation using a Maxi-sized drill rig. This data would not only benefit HDD contractors by
confirming their installation procedures but it would also, after further study and testing, improve
installation methods. The real time data will also be able to confirm or improve developed mathematical
models which will enhance the engineer design aspect of HDD installations.

10
Chapter 3 - Designing On-line Data Acquisition System
This design of an on-line data acquisition system was developed and broken down into two phases. Phase
one involved developing a real time data acquisition system that would record the desired data and
display it so the driller would have immediate access to it. Phase two involved designing and developing
an in-ground pressure sensor that would record pressures, strain, and forces and transmit them real time
to the driller for use during installation. This real time data transmitter would also be designed to work
with Maxi-sized drill rigs and not require a wired connection.
3.1 Developing an Ideal Data Framework Before implementing any field equipment, an ideal data gathering framework was developed to
determine what data would be ideally gathered during each installation. From the operators control
panel; carriage pressure, rotary pressure, and mud fluid pressure would be recorded. From the drill rig
frame the drilling mud flow rate would be recorded. From the drill rig CAT engine both the engine RPMs
and fuel rates would be recorded. Finally, from the reamer head in the bore path; pull stress, shear stress,
GPS location, and drilling mud fluid pressure would be recorded. All of this data would be available in real
time within the drill cab via a wireless signal.
3.2 Phase 1: Real time surface data For the purposes of this study Honeywell Model LM 5000psi pressure transducers were installed in the
drill cab and attached directly to the operators’ pressure gauge for carriage pressure, rotary pressure, and
drilling mud pressure. This data gathered by the transducers was recorded at an interval of 0.01 seconds
by a SoMat eDAQlite system and monitored directly during installation via the InField software. The SoMat
data logging system is a high accuracy customizable series of controller layers which can be set and
organized to record an infinite amount of data. InField is the interface program that can gather and display
the recorded data from the SoMat and display it in a variety of different ways. The three pressure
transducers had their calibration checked at the University of Waterloo using a dead weight testing unit.
This dead weight testing unit is similar to a scale, except the weight is converted to pressure in hydraulic
fluid. The transducers were hooked up to the hydraulic fluid to confirm their calibration. The calibration
was checked before the first field data gather and between the second and third field data gathering
session. The pressure transducers were installed using tees directly into the hydraulic lines that supply the

11
pressure for the operators’ gauges. It should be noted that for the first data gathering only the carriage
pressure (pull force) was recorded due to a limited of availability of transducers.
The surface data acquisition system was used in four separate pipe pulls. Each pipe installation was done
by the same drilling team using an American Auger DD-1100 Maxi HDD drill rig. The data was monitored
and recorded for each installation during continuous pull back. The data was originally presented via
InField, the SoMat data control software. However this data was exported and converted to MS Excel and
later TecPlot, a powerful data analysis program, for analysis. Each drill rod is 9.33 m (30 ft) long and data
was recorded and broken down over each length of drill rod pulled. Since each rod needs to be unthreaded
from the string and removed, the pull stops every rod length. Due to this stoppage in pull force the data
was processed to discount the time when the product pipe was not being moved. This reduces the amount
of data involved with movement to the product pipe.
With the high resolution of 0.01 seconds there are many micro spikes recorded by the data logger.
However, these spikes are not representative of what is actually exerted on the pipe and are attributed
to transducer noise. To more accurately present the data an Excel algorithm was developed to change the
resolution of the data to present the average pull force value over 1 second. This allows a more
appropriate presentation of the data and removes much of the transducer noise which may skew the
results.
Due to the high resolution of data, the accuracy is somewhat misleading. While each individual spike was
recorded, the actual representation of this spike is difficult to comprehend. Since the pressure transducers
record what the drill rig gauges display, this does not directly correspond to the product pipe. It is
however, what the reamer feels. The reamer, since it is larger than the product pipe (in almost all cases),
is constantly scraping against the walls of the bore path. Each of the mini spikes can easily be described
as the reamer making a small cut into the curving bore path wall.
3.3 Phase 2: Real time In-the-hole Data During the research of the wireless data logger and transmitter, a number of problems were identified.
Soil is notoriously difficult to transmit a conventional data signal through. The most effective way to
transmit through soil is with an electro-magnetic (EM) signal. However even EM signals are limited by the
amount of power within the transmitter unit. The DigiTrak TensiTrak is limited to 18 m (60 ft) depth and
runs on three D batteries. Maxi-sized drill rigs can install pipe at depths of over 20 m, which are deep

12
enough to reduce the effectiveness of EM signals. The first problem identified was how to get the data
signal from the underground transmitter.
A number of potential solutions were explored including using a short range wireless Bluetooth
transmitter to jump the signal over the ream and link into the wire line that is sometimes used within the
drill rod. This option was not viable because not all installations use a wire line, and when a wire line is
used it adds a significant amount of time to each pipe connection and disconnection. A variation of this
solution was to use a short range Bluetooth transmitter to jump into the hollow product pipe and transmit
the signal through the empty pipe. Unfortunately, during most large product pipe installations the product
pipe is filled with water to ensure the pipe does not float in the drilling mud and create extra friction on
the top of the bore path. Water is also a difficult medium for wireless signals to transmit though so this
simple solution was also not viable. A further variation of this option was to piggy back a signal in or along
the tracer wire that is installed with plastic pipes. The tracer wire is subject to breakage and is not always
installed with pipes.
The second major problem identified was the cost associated with the hardware required. To realistically
approve the installation of another unit between the reamer and the swivel, the unit must be able to
maintain a safety factor of at least 2. There are units that exist that can withstand upwards of 1,000,000
lbs of force which have built in strain gauges. These units are substantially expensive and the budget on
this research did not support acquiring one.
Additionally, most maxi-sized rig installations involve a long string of product pipe which involve a long
installation session. The size of battery required to power the transmitter for the required amount of time
was a major problem. One such transmitter that was examined for use required a 24 V battery. To power
this for an estimated 35 hours would require at least three 24 V batteries. These batteries would take up
substantial space inside the design unit.
These problems made it unrealistic to complete phase two with the available resources. For future studies,
with additional resources it will be very practical to develop phase two of this research.

13
Chapter 4 - Data Results
The data for this research was gathered at four separate pipe installations. Two separate materials and
pipe diameters were used during these installations. The length of these installations ranged from 950 ft
to 2523 ft. The data presented in this chapter is presented as pressures versus distance. The distance of
product pipe refers to the location of the end of the pipe that was attached to the swivel behind the
reamer with relation to the start of the installation. It was assumed that each drill rod was pulled through
at an approximately constant velocity. This is not necessarily accurate for all drill rods as during certain
pulls the rod was pulled at a faster rate. During installations the pull force was kept below a point where
the product pipe could be endangered. However this changed in velocity is reflected in a drop in carriage
pressure which is still represented in the data. It should also be noted that during the final three sessions
of data gathering, the mud pressure had a constant zero reading. The constant zero reading was not a
transducer error, but instead was caused by a lack of hydraulic fluid within the drill rig.
4.1 June 22, 2011 Pullback
The June 22, 2011 pullback involved installing 1500 ft of 400 mm diameter Fusible PVC SDR 18 pipe. This
pipe was installed underneath Major Mackenzie Drive along Islington Avenue, in Ontario, Canada, with
approximately 10ft of cover. This was the first set of data gathered in the research and only had a single
transducer connected to carriage pressure. This carriage pressure is related to force by a calibration table
provided by American Auger, the drill rig manufacturer, and table is represented by Figure 6. The linear
equations for the 3rd and 4th gears of the engine are shown. This study only required the 3rd and 4th gears
were used in the operation of the drill rigs during pull back.
The data has been divided by each individual drill rod involved in the installation, each of which has a
length of 30 ft. As each drill rod has been fully cleared from the drill carriage, the pull must be paused to
remove the cleared rod. While processing the data it was assumed that when the carriage drill pressure
drops below 1100 psi that the pipe ceases to move. This was used as the breaking point between each
separate set of rod data and aided to more accurately detail chainage measurements. This assumption
also assists to pin point mid rod stoppage points, so that these points could be removed to avoid the
potential for skewing the data.

14
Figure 6: Carriage Gauge conversion Pressure to Force
The data presented in Figure 7 is the processed data at high resolution. Since the friction caused by the
reamer stays approximately the same throughout the pull the increase in pull force is caused by the pipe
entering the bore path.
As shown in Figure 7, the pull force remains approximately constant until the final quarter of the pull. This
should correspond approximately to where the product pipe begins to return to surface. PVC is a brittle
plastic material and is likely making contact with the walls of the bore path in this final length. The peak
pull force more than doubles the average pull force in the rest of the pull.
There are a number of points throughout this pull where the pull force reaches a local maximum and then
drops drastically. This is done by the driller as he monitors the pull, and when the pressure starts to build
he can reduce the rate at which the pipe is being pulled, thereby causing a drop in the force to slow down
the pull.
y = 49.167x - 19666
y = 105.27x - 42113
0
200000
400000
600000
800000
1000000
1200000
0 1000 2000 3000 4000 5000 6000
Carr
iage
For
ce (l
bs)
Carriage Gauge Pressure (psi)
1st Gear
2nd Gear
3rd Gear
4th Gear

15
Figure 7: June 22, 2011 Pull Force vs Distance
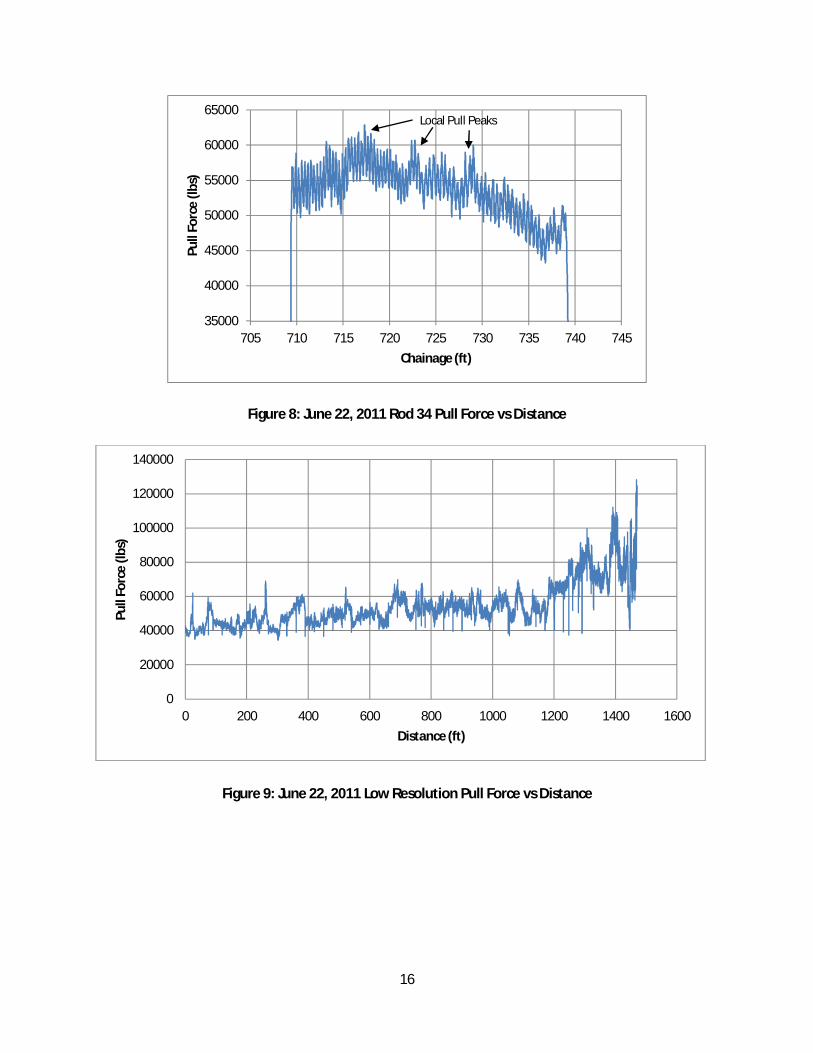
Figure 8 details the data for one individual drill rod in high resolution. As shown in Figure 8, the pull force
during a single drill rod does increase slowly over the duration of the pull. Then as the rod nears its end,
and stopping point, the driller decreases the pull rate of this particular rod to bring the force required to
finish the pull below 60,000 lbs.
Figure 9 shows the details of the carriage pull force as converted to low resolution via the excel algorithm.
It should be noted that the dip at a chainage of 1450 ft is the driller switching to 3rd gear. This same pull is
described in Figure 6, after it is converted to pounds.
Pipe Exit
Pipe Entrance
Gear Shift to 3rd
16
Figure 8: June 22, 2011 Rod 34 Pull Force vs Distance
Figure 9: June 22, 2011 Low Resolution Pull Force vs Distance
35000
40000
45000
50000
55000
60000
65000
705 710 715 720 725 730 735 740 745
Pull
Forc
e (lb
s)
Chainage (ft)
Local Pull Peaks
0
20000
40000
60000
80000
100000
120000
140000
0 200 400 600 800 1000 1200 1400 1600
Pull
Forc
e (lb
s)
Distance (ft)

17
4.2 August 24, 2011 Pullback
The August 24, 2011 pullback involved installing 2523 ft of 750 mm diameter HDPE SDR 11 pipe. This pipe
was installed underneath a cemetery along Huntington Road with approximately 15ft of cover. This was
the second set of data gathered for this research, and the largest. This was also the first pull with pressure
transducers recording data from carriage pressure gauge, rotary pressure gauge, and drilling mud
pressure gauge. The carriage pressure is related to force by a calibration table provided by American
Auger, the drill rig manufacturer, and is presented in Figure 6 which can be found in section 4.1. The rotary
pressure is related to force by a calibration table provided by American Auger, the drill rig manufacturer,
and this table is represented in Figure 10.
Figure 10: Rotation Gauge conversion Pressure to Force
It should be noted that the drilling mud pressure gauge read zero for all data gathered, and thus will not
be presented in this research. This was due to a hydraulic fluid leak being present somewhere in the drill
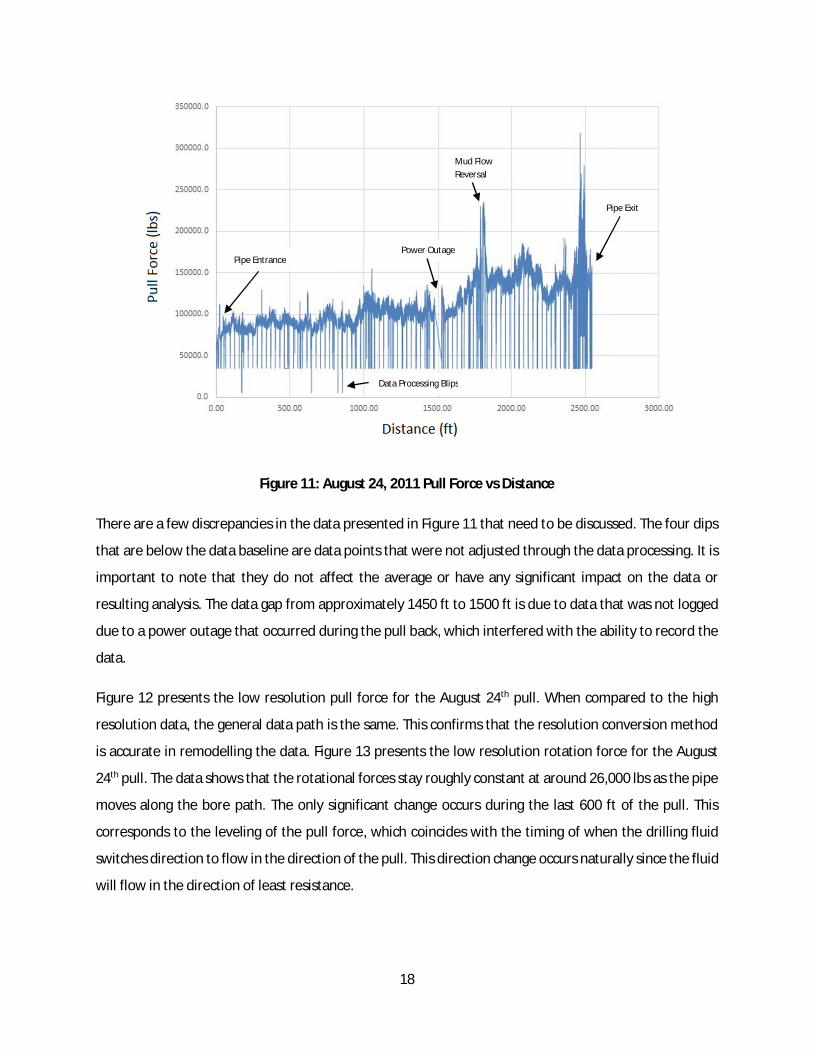
rig system, inhibiting the pressure from being visible on the drillers gauge. Figure 11 is the high resolution
data for the August 24th pull back.
y = 19.216x - 8647.1
y = 13.85x - 6232.4
y = 8.4849x - 3818.1
0
20000
40000
60000
80000
100000
120000
0 1000 2000 3000 4000 5000 6000
Forc
e (lb
s)
Pressure (psi)
Low Gear
Mid Gear
High Gear
18
Figure 11: August 24, 2011 Pull Force vs Distance
There are a few discrepancies in the data presented in Figure 11 that need to be discussed. The four dips
that are below the data baseline are data points that were not adjusted through the data processing. It is
important to note that they do not affect the average or have any significant impact on the data or
resulting analysis. The data gap from approximately 1450 ft to 1500 ft is due to data that was not logged
due to a power outage that occurred during the pull back, which interfered with the ability to record the
data.
Figure 12 presents the low resolution pull force for the August 24th pull. When compared to the high
resolution data, the general data path is the same. This confirms that the resolution conversion method
is accurate in remodelling the data. Figure 13 presents the low resolution rotation force for the August
24th pull. The data shows that the rotational forces stay roughly constant at around 26,000 lbs as the pipe
moves along the bore path. The only significant change occurs during the last 600 ft of the pull. This
corresponds to the leveling of the pull force, which coincides with the timing of when the drilling fluid
switches direction to flow in the direction of the pull. This direction change occurs naturally since the fluid
will flow in the direction of least resistance.
Data Processing Blips
Power Outage
Mud Flow Reversal
Pipe Entrance
Pipe Exit

19
Figure 12: August 24, 2011 Low Resolution Pull Force
Figure 13: August 24, 2011 Low Resolution Rotation Force
4.3 December 15, 2011 Pullback
The December 15, 2011 pullback involved installing 1870 ft of 750 mm diameter HDPE SDR 11 pipe. This
pipe was installed underneath a creek and two gas lines with small diameters along Huntington Road in
0
50000
100000
150000
200000
250000
300000
350000
400000
0 500 1000 1500 2000 2500
Pull
Forc
e (lb
s)
Distance (ft)
0
10000
20000
30000
40000
50000
60000
0 500 1000 1500 2000 2500
Rota
tion
Forc
e (lb
s)
Distance (ft)
20
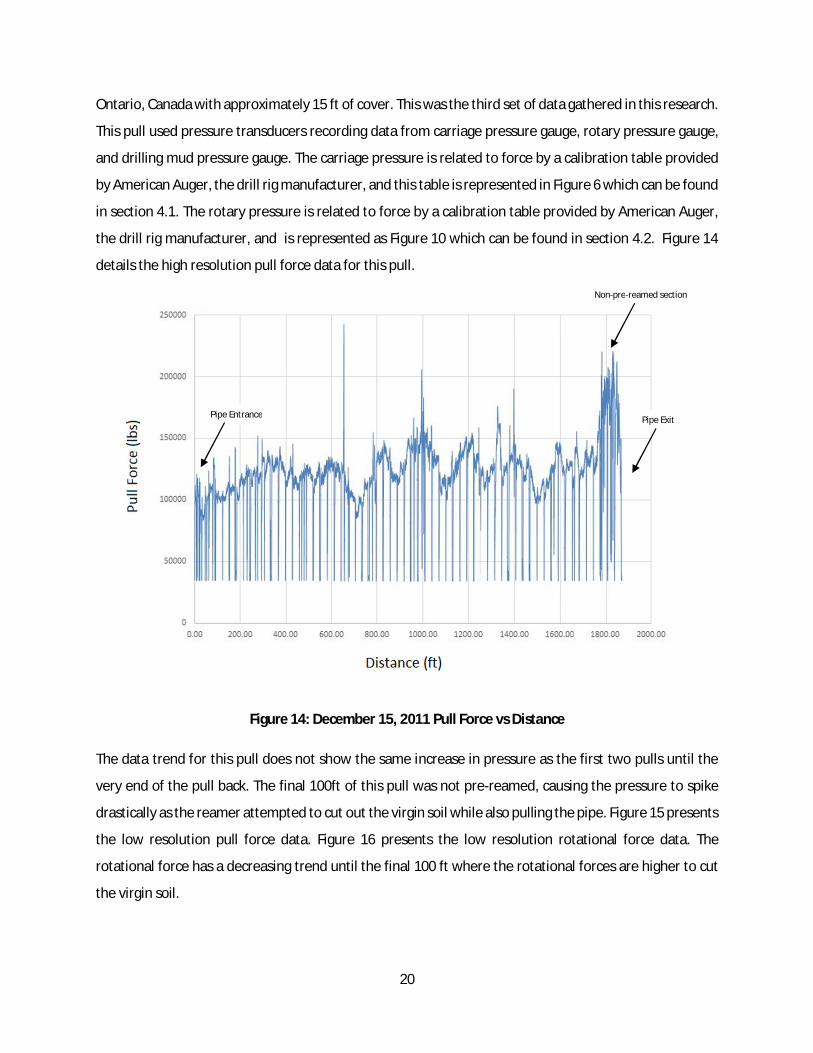
Ontario, Canada with approximately 15 ft of cover. This was the third set of data gathered in this research.
This pull used pressure transducers recording data from carriage pressure gauge, rotary pressure gauge,
and drilling mud pressure gauge. The carriage pressure is related to force by a calibration table provided
by American Auger, the drill rig manufacturer, and this table is represented in Figure 6 which can be found
in section 4.1. The rotary pressure is related to force by a calibration table provided by American Auger,
the drill rig manufacturer, and is represented as Figure 10 which can be found in section 4.2. Figure 14
details the high resolution pull force data for this pull.
Figure 14: December 15, 2011 Pull Force vs Distance
The data trend for this pull does not show the same increase in pressure as the first two pulls until the
very end of the pull back. The final 100ft of this pull was not pre-reamed, causing the pressure to spike
drastically as the reamer attempted to cut out the virgin soil while also pulling the pipe. Figure 15 presents
the low resolution pull force data. Figure 16 presents the low resolution rotational force data. The
rotational force has a decreasing trend until the final 100 ft where the rotational forces are higher to cut
the virgin soil.
Pipe Exit
Non-pre-reamed section
Pipe Entrance

21
Figure 15: December 15, 2011 Low Resolution Pull Force vs Distance
Figure 16: December 15, 2011 Rotation Force vs Distance
4.4 February 8th, 2012 Pullback
The February 8, 2012 pullback involved installing 950 ft of 750 mm diameter HDPE SDR 11 pipe. This pipe
was installed underneath two small diameter gas lines along Huntington Road, Ontario, Canada with
approximately 15 ft of cover. This was the shortest and last data gathered in this research. This pull used
pressure transducers recording data from carriage pressure gauge, rotary pressure gauge, and drilling
0
50000
100000
150000
200000
250000
0 500 1000 1500 2000
Pull
Forc
e (lb
s)
Distance (ft)
0
5000
10000
15000
20000
25000
30000
35000
40000
45000
0 500 1000 1500 2000
Rota
tion
Forc
e (lb
s)
Distance (ft)

22
mud pressure gauge. The carriage pressure is related to force by a calibration table provided by American
Auger, the drill rig manufacturer, and is represented as Figure 6, in section 4.1. The rotary pressure is
related to force by a calibration table provided by American Auger, the drill rig manufacturer, and this
table is presented as Figure 10, in section 4.2. Figure 17 details the high resolution pull force data for this
pull.
Figure 17: February 8, 2012 Pull Force vs Distance
The last 200 ft of this pull was not pre-reamed with the 42” (1066 mm) reamer, but was instead pre-
reamed using only the 24” (610 mm) reamer. The reamer was pulled at approximately the same rate
throughout the entire pull, so the force jumped up once the 24” pre-reamed section was reached. This
can be seen in Figure 17 at the 830 ft distance mark as the pull force increases and continues to increase
dramatically. In the case of this pull, the data is not complete. There is an additional 3 drill rods worth of
data missing. This data was not collected due to a mechanical problem with the drill rig and an extended
delay with pull back. The very last rod recorded and the rods that were not recorded were not pre-reamed
with either of the 42” or 24” reamer. Instead their bore path was pre-reamed using only the drill rod
having an 8.5” (215 mm) diameter. Figure 18 is the low resolution pull force data and Figure 19 is the low
resolution rotational force.
Pipe Exit Non-pre-reamed section
Virgin Soil
Pipe Entrance

23
As shown in Figure 18, as the product pipe enters the unreamed section of the bore path the force
required to pull the pipe increases to almost three times the amount needed to pull the pipe through the
reamed section of the bore path. It should be noted that this force does not necessarily indicate the
pressures from force felt by the product pipe. The force felt by the product pipe can only be accurately
recorded with a force strain gauge located between the product pipe and the reamer as described in
phase 2 of this research.
Figure 18: February 8, 2012 Low Resolution Pull Force vs Distance
Figure 19: February 8, 2012 Low Resolution Rotational Force vs Distance
0
50000
100000
150000
200000
250000
300000
350000
0 100 200 300 400 500 600 700 800 900
Pull
Forc
e (lb
s)
Distance (ft)
0
5000
10000
15000
20000
25000
30000
35000
40000
45000
0 100 200 300 400 500 600 700 800 900
Rota
tion
Forc
e (lb
s)
Distance (ft)

24
Chapter 5 - Challenges of In-the-hole Data Logging Currently the most common wireless in ground system used in HDD installation is a sonde. A sonde is an
electromagnetic transmitter that emits a signal which is picked up by a hand held receiver that is stationed
above the sonde on the surface. The sonde is used to orient and locate the drilling head as the initial drill
path is made. Most sondes are not equipped with any data transmitting devices. They are strictly used for
orientation and location purposes. Unfortunately sondes are limited to certain depths and in cases of large
scale HDD projects a sonde may not be applicable. The Sharewell TruTracker is a wire-line locating system
that transmits location and orientation of the drill bit but is not limited to depths and project size.
When this research was begun there was no such product that could safely be used with a Maxi-sized drill
rig to transmit data from underground to the surface in real time. The Digitrak TensiTrak does do this,
however it is only rated up to 100,000 lbs of pull force. Each of the described data gathers in this study
have points where the pull force goes well above the 100,000 lbs limit. The worst thing that could
potentially happen during a pipe installation is, if a piece of equipment between the reamer and the
product pipe were to break and require a spot excavation to reattach the drilling rods.
5.1 Explored Data Transfer Methods Two data transfer methods were explored in this research. The first method involved a combination of
wireless transfer methods. Initially a Bluetooth transmitter would be installed in the data recording device
which would use a short range wireless jump to get to the more powerful Phoenix Contact wireless
transmission card, 2867076 RAD-ISM-900-TX, which has a range of more than two kilometers. This
transmission card would move the signal to the surface which would then be relayed to the SoMat
eDAQlite terminal. Unfortunately, the Phoenix contact system is unable to transmit through obstructions
including soil and water. Since both these obstructions were going to be present during product
installation, this method was obsolete, which forced a different model to be explored.
The second data transfer method involved using a wired connection to reach down to the swivel, either
along the drill rods or along the product pipe, then by using a wireless Bluetooth connection to bridge the
remaining distance to the data gathering unit. This involved a substantial amount of extra work to install
this system which creates extra cost for the drilling company. A wired connection has a high chance of
breakage which would be impractical, if not impossible, to repair if it breaks. Figure 20 presents a diagram
of the explored data transfer methods.

25
Figure 20: Explored data transfer options
5.2 Future Recommendations for Development
While a small scale commercial product is available, the first steps to develop a new Maxi-sized system
would be to develop the various components required currently unavailable.
To begin, a control system that can monitor and maintain battery power to the system while it is in use
and conserve the battery during rod change or downtime is a required component. The battery, which
needs to be able to power all the components for a pre-determined length of time, must be housed within
the unit. The control system should also be able to connect the various transducers to the transmitting
device.
The next component is the data transmission system. This can either be a wireless, wired, or combination
system. A wired or combination system would need to be specially modified for each individual installation
and comes with the associated risks of breakage. A wireless system would need to be robust enough to
transfer the signal through a range of depths, materials, and distances. The medium of transfer is also an
important design aspect when dealing with underground wireless.
Finally, configuring the DAQ system is an important aspect and may change for individual installations.
However, a standard configuration can be designed to make any modifications simple to adjust
immediately prior to the installation pull.

26
With these components, if this product is developed it would be a powerful academic and QA/QC device
which will assist installation contractors and suppliers with valuable data for future use. It can also be used
to confirm or deny theoretical pull force models and improve upon current methods. Part 2 of this
research compares how data collected for this research compares to current theoretical models.

27
Chapter 6 - Result Analysis and Model Comparison
There is a variety of literature, both published and not, that have endeavoured to compare various
theoretical models for predicting pulling loads for HDD pipe installations. Some can be very complex and
use numerical models to predict loads (Cheng & Polak, 2007). Others are somewhat simplified and account
for different aspects of installation such as Duyvesten, 2009 and ASTM 1962-11. Each of these methods
has been compared, analyzed, improved, and tested against each other and the ASTM standard. While all
of these methods may be appropriate to give certain guidelines and estimates for the installation, they
will never completely match the installed pull loads generated in the field.
With regards to the research completed for this thesis, none of the previously mentioned methods have
been applied to Maxi-sized drill rigs. While in theory they should be able to encompass the larger forces
and pulls, the comparison research and testing has not yet been completed.
6.1 BoreAid
The Terein Inc. program BoreAid is the most modern computing and design aid tool for HDD installations
using PE and Steel pipes. It incorporates a number of design aspects into predicting install loads. However
just like all design methodologies, it is limited to the user interface and certain assumptions. It does
however have the most versatile interface which allows for adaptable reporting. BoreAid version 3.0 was
used during this research, but an updated, more user-friendly, and 3D version of BoreAid is currently
under development.
BoreAid uses four different methods for calculating installation loads. These methods are individually
calculated and the user can determine which method they would like to use in their own design. The first
method detailed by BoreAid uses the standard ASTM F1962 equations for PE pipe. These equations are
somewhat detailed and represent most installations very well. It is very difficult to model changing ground
conditions and complex bores using these equations, which are listed below as 1-7. Method 2 uses the
Plastic Pipe Institute handbook (Chapter 12) which uses the same equations as ASTM 1962 with a slight
modification. Instead of adding the pulling force increment Equation (7) after the force multiplications as
recommended by the ASTM, it adds the pulling force increment Equation (7) into the force multiplications.

28
Method 3 and 4 are both drag models which include the direction of slurry return. Method 3 involves
adding the drag friction forces to the force calculations as an addition component. The equation for this
is designated below as Equation 8. Method 4 uses the same drag friction force, but for the final 2/3 of the
pull, the slurry travels towards the pipe exit and the friction is subtracted from the pull force.
Table 4 details the parameters used in BoreAid which are based off the drill plan for the installation of the
pipes for each installation. POGPM represents the rate at which the drilling mud is pumped into the bore
path through the drill rods in gallons per minute. PV represents the plastic viscosity of the drilling fluid in
centipoises. YP represents the yield point of the drilling fluid in lbs per 100 ft2. The remaining values from
Table 4 are described in section 6.2.
Table 4: Parameters for BoreAid Inputs
Parameter June 22 Value August 24 Value December 15 Value
February 8 Value
POGPM (GPM) 140 180/260 260 260 PV (cP) * 30 30 30 30 YP (lbs/100 ft2) * 100 100 100 100 Dbore (in) 24 42 42/24 42/24/8.5 Dpipe (in) 15.75 29.5 29.5 29.5 H (ft) 10 15 15 15 DR 18 11 11 11 Va ** 0.5 0.5 0.5 0.5 Vb ** 0.4 0.4 0.4 0.4 γa 1.4 0.95 0.95 0.95 γm 1.5 1.5 1.5 1.5 α (°) 8 8 8 8 β (°) 13 13 10 10
* Harbin 2003 from Duyvestyn 2009 – Sandy lean clay ** Raclavsky 2008 - Typical for sandy clay
6.2 ASTM F1962 and Friction Drag Equations
ASTM F1962 is the standard for HDD design installations in North America. Figure 21 describes a general
HDD bore path. Point A is the end of the bore where the installed pipe first enters the bore as it is pulled
back. Point B is where the pipe ceases its descent and is set at grade, this is not always 0% grade as
depicted. Point C is where the pipe installation is complete and where the initial bore first reached the
installation depth. Point D is the location of the drill rig and where the installed pipe will exit the bore. The
following equations estimate the pull force felt by the installed pipe at each of these locations.

29
Figure 21: ASTM F1962 Equation Model
푇 = exp(푣 훼) (푣 푤 (퐿 + 퐿 + 퐿 + 퐿 )) (1)
푇 = exp(푣 훼) (푇 + 푣 |푤 |퐿 + 푤 퐻 − 푣 푤 퐿 exp(푣 훼)) (2)
푇 = 푇 + 푣 |푤 |퐿 − exp (푣 훼)(푣 푤 퐿 exp(푣 훼)) (3)
푇 = exp (푣 훽)(푇 + 푣 |푤 |퐿 − 푤 퐻 − exp (푣 훼)(푣 푤 퐿 exp(푣 훼)) (4)
푤 = 휋퐷퐷푅 − 1퐷푅
휌 훾 (5)
푤 =
휋퐷4
휌 (훾 − 훾 (1−2퐷푅
) )푤 (6)
훥푇 = 훥푃휋8
(퐷 −퐷 ) (7)
퐹 = 12휋퐷휇 퐿 (8) where TA = pull force on pipe at point A, lbf (N),
TB = pull force on pipe at point B, lbf (N), TC = pull force on pipe at point C, lbf (N), TD = pull force on pipe at point D, lbf (N), L1 = additional length of pipe required for handling and thermal contraction, ft (m), L2 = horizontal distance to achieve desired depth, ft (m), L3 = additional distance traversed at desired depth, ft (m), L4 = horizontal distance to rise to surface, ft (m), H = depth of bore hole from ground surface, ft (m), exp(X) = ex, where e = natural logarithm base (e = 2.71828), va = coefficient of friction applicable at the surface before the pipe enters bore hole, vb = coefficient of friction applicable within the lubricated bore hole or after the (wet) pipe exits, wa = weight of empty pipe, lbf/ft (N/m), wb = net upward buoyant force on pipe in bore hole, lbf/ft (N/m), α = bore hole angle at pipe entry (or HDD exit, at side opposite drill rig), rad, and β = bore hole angle at pipe exit (or HDD entry, at same side as drill rig), rad. γa = specific gravity of pipe material (for example, 0.955 for PE), ρw = weight density of water times length unit conversion factor, lbf/in.3 (N/mm3), and D = outside diameter of pipe, in. (mm). γb = specific gravity of mud slurry γw = specific gravity of water ΔT = pulling force increment, lbf (N), ΔP = hydrokinetic pressure, psi (kPa × 10−3), and Dhole = backreamed hole diameter, in. (mm).

30
Fd = Friction Drag caused by slurry flow, lbf μmud = Fluid Drag coefficient, psi (0.05 to 0.025)
6.3 Model Comparisons The following figures describe the actual recorded pull load data with the corresponding calculated data
using all four BoreAid methods. Table 5 summarizes all the compared model data and actual installation
data.
Figure 22: June 22 Low Resolution Data with Comparison Methods from BoreAid
Figure 22 describes the June 22nd pipe installation with the BoreAid models overlaid. While all of the
methods do not correctly model the initial pull forces, they do follow the same trend of the data. Method
3 is able to approximate the final pull force required to complete the installation however it cannot
account for the large spikes in the final section of the installation.
0
20000
40000
60000
80000
100000
120000
140000
0 200 400 600 800 1000 1200 1400 1600
Pull
Forc
e (lb
s)
Distance (ft)
Method 3Method 2Method 1Method 4
31
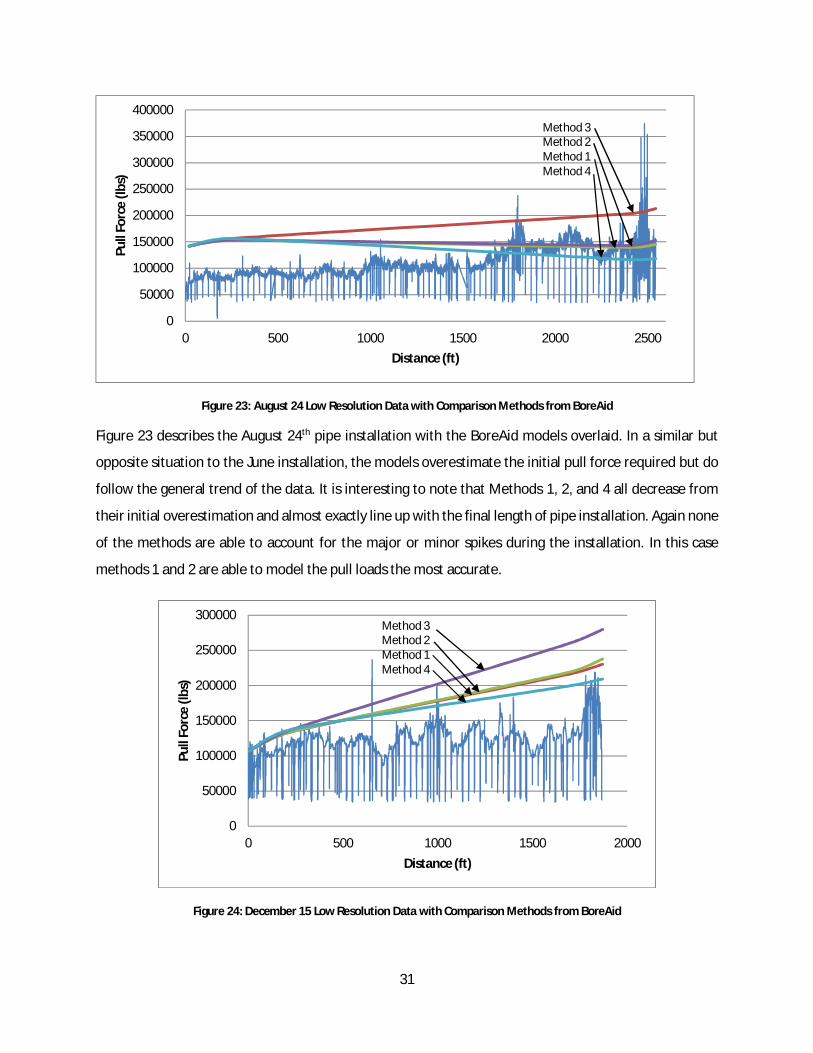
Figure 23: August 24 Low Resolution Data with Comparison Methods from BoreAid
Figure 23 describes the August 24th pipe installation with the BoreAid models overlaid. In a similar but
opposite situation to the June installation, the models overestimate the initial pull force required but do
follow the general trend of the data. It is interesting to note that Methods 1, 2, and 4 all decrease from
their initial overestimation and almost exactly line up with the final length of pipe installation. Again none
of the methods are able to account for the major or minor spikes during the installation. In this case
methods 1 and 2 are able to model the pull loads the most accurate.
Figure 24: December 15 Low Resolution Data with Comparison Methods from BoreAid
0
50000
100000
150000
200000
250000
300000
350000
400000
0 500 1000 1500 2000 2500
Pull
Forc
e (lb
s)
Distance (ft)
Method 3Method 2Method 1Method 4
0
50000
100000
150000
200000
250000
300000
0 500 1000 1500 2000
Pull
Forc
e (lb
s)
Distance (ft)
Method 3Method 2Method 1Method 4

32
Figure 24 describes the December 15th pipe installation with the BoreAid models overlaid. All of the
methods estimate an initial pull force that is very close to the actual initial pull load. In this case the
different modelling methods overestimate the trend of the data. However, other than two major spikes,
each of the methods overestimate the pull forces in all cases. In the end, Method 4 is able to very closely
estimate the final installation loads.
Figure 25: February 8 Low Resolution Data with Comparison Methods from BoreAid
Figure 25 describes the February 8th pipe installation with the BoreAid models overlaid. As with the
December installation the estimating methods accurately predict the initial loads. The difference is that
the models each follow the trend of the data closely. Other than the major spike at the end of the pull it
seems like these any of these methods approximated the pull forces accurately. The spike at the end of
the installation was caused by the soil not being pre-reamed, the estimating methods are not designed to
take that into account.
In each case the calculated models are able to follow the general trend of the actual recorded data. The
moderate dips and spikes involved with changing ground conditions and driller control cannot easily be
modelled.
0
50000
100000
150000
200000
250000
300000
350000
0 100 200 300 400 500 600 700 800 900
Pull
Forc
e (lb
s)
Distance (ft)
Method 3Method 2Method 1Method 4
33
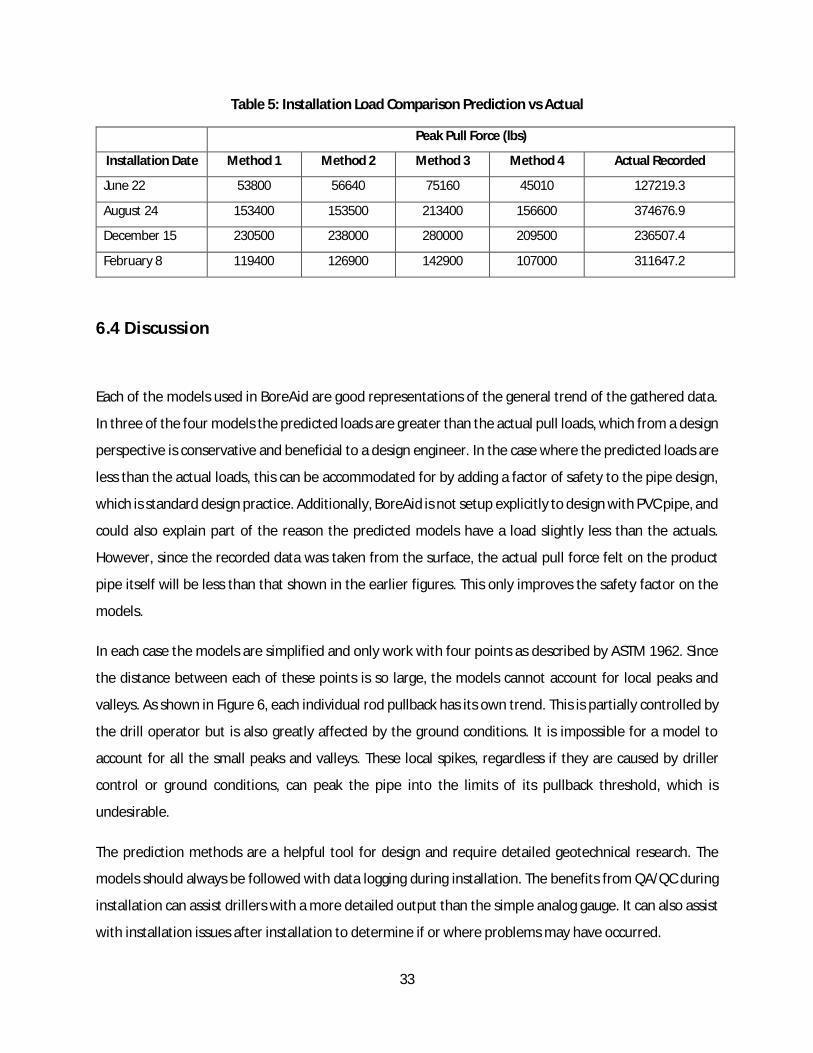
Table 5: Installation Load Comparison Prediction vs Actual
Peak Pull Force (lbs)
Installation Date Method 1 Method 2 Method 3 Method 4 Actual Recorded
June 22 53800 56640 75160 45010 127219.3
August 24 153400 153500 213400 156600 374676.9
December 15 230500 238000 280000 209500 236507.4
February 8 119400 126900 142900 107000 311647.2
6.4 Discussion
Each of the models used in BoreAid are good representations of the general trend of the gathered data.
In three of the four models the predicted loads are greater than the actual pull loads, which from a design
perspective is conservative and beneficial to a design engineer. In the case where the predicted loads are
less than the actual loads, this can be accommodated for by adding a factor of safety to the pipe design,
which is standard design practice. Additionally, BoreAid is not setup explicitly to design with PVC pipe, and
could also explain part of the reason the predicted models have a load slightly less than the actuals.
However, since the recorded data was taken from the surface, the actual pull force felt on the product
pipe itself will be less than that shown in the earlier figures. This only improves the safety factor on the
models.
In each case the models are simplified and only work with four points as described by ASTM 1962. Since
the distance between each of these points is so large, the models cannot account for local peaks and
valleys. As shown in Figure 6, each individual rod pullback has its own trend. This is partially controlled by
the drill operator but is also greatly affected by the ground conditions. It is impossible for a model to
account for all the small peaks and valleys. These local spikes, regardless if they are caused by driller
control or ground conditions, can peak the pipe into the limits of its pullback threshold, which is
undesirable.
The prediction methods are a helpful tool for design and require detailed geotechnical research. The
models should always be followed with data logging during installation. The benefits from QA/QC during
installation can assist drillers with a more detailed output than the simple analog gauge. It can also assist
with installation issues after installation to determine if or where problems may have occurred.

34
Chapter 7 – Conclusions and Recommendations
Real time data acquisition is without a doubt a very important tool to assist with Horizontal Directional
Drilling installations. The current tools for data logging from the surface can be adapted and improved to
provide a better interface for the operators and technicians to work with. In-the-hole real time data
loggers do exist and function for small scale drilling installations however maxi-sized drill rigs do not yet
have data loggers sized appropriately. Most models and design comparisons have been completed using
smaller scale drill rigs. As HDD installations become more commonplace, larger installations will become
more and more common. The large scale rigs will be operating at higher loads with larger pulls, and so
having a powerful QA/QC system will improve and protect these installations.
As recommended earlier, the real time data acquisition from in the hole will allow for better model
comparisons and the recorded data will better reflect the forces felt by the product pipe. Future research
and testing will aid in the development in such products and improve HDD installations.
35
References
Allouche, E. N., Ariaratnam, S. T., MacLeod, C. W. (2000). Software for Planning and Cost Control in Directional Drilling Projects. Journal of Construction Engineering and Management, Vol. 129, No. 4, (August 2003).
Allouche, E. N., Ariaratnam, S. T., Lueke, J. S. (2000). Horizontal Directional Drilling: Profile of an Emerging Industry. Journal of Construction Engineering and Management, ASCE 126(1), 68-76.
Ariaratnam S. T., Colwell, D. A. F. (2002). Monitoring of HDPE Pipe During Horizontal Directional Drilling Installations. Pipelines 2002.
Ariaratnam, S. T., Allouche, E. N. (2000). Suggested Practices for Installations Using Horizontal Directional Drilling. Practice Periodical on Structural Design and Construction (November 2000).
ASTM-F1962, (2011). Standard guide for use of maxi-horizontal directional drilling for placement of polyethylene pipe or conduit under obstacles, including river crossings. ASTM International.
Baumert, M. E., Allouche, E. N., Moore, I. D. (2003). Experimental investigation of pull loads and borehole pressures during horizontal directional drilling installations. Can. Geotech. J. 41: 672-685 (2004).
Bennett, D., Ariaratnam, S., Como, C. (2001) Horizontal Directional Drilling Good Practices Guidelines. HDD Consortium.4
BoreAid. (2008). Terein Inc.
Cheng, E., Polak, M. A. (2007). Theoretical model for calculating pulling loads for pipes in horizontal directional drilling. Tunnelling and Underground Space Technology 22 (2007) 633-643.
Duyvestyn, G. (2009). Comparison of Predicted and Observed HDD Installation Loads for Various Calculation Methods. NASTT and ISTT International No-Dig Show 2009.
Duyvestyn, G., Knight, M., Polak, M. A. (2001) Horizontal Directional Drilling Research Program – University of Waterloo. Underground Infrastructure Research Conference 2001.
Ho, P. J., (2007). Construction of Horizontal Wells in Municipal Solid Waste Using a Directional Drill. University of Waterloo.
Jiang, G., Xiao, S., Li, L., Wu, S. (2012). Calculations and Analysis of Pullback Force in Horizontal Directional Drilling. ICPTT 2012
Lawrence, K., Bayat, A., Knight, M., Rubeiz, C., Petroff, L. (2011). PPI-BoreAid: A Preliminary Design Tool for Horizontal Directional Drilling using Polyethylene Pipeline. Pipelines 2011: A Sound Conduit for Sharing Solutions, ASCE 2011.

36
Lawrence, K. P., Bayat, A., Knight, M. (2008). Implementation of structured framework for HDD design. University of Waterloo.
PPI, (2006). Handbook of PE Pipe. Plastic Pipe Institute (PPI). Chapter 12.
Raclavsky, J. (2008). Theoretical problems of pipe inserting by making use of the method of horizontal directional drilling. Acta Montanistica Slovaca. Czech Republic.
Slavin, L. M., & Petroff, L. (2010). Discussion of ASTM F1962 or How are the Pulling Load Formulas Derived and How Are They Used?. NASTT No-Dig Show 2010.