Embed Size (px)
Citation preview
Page 1
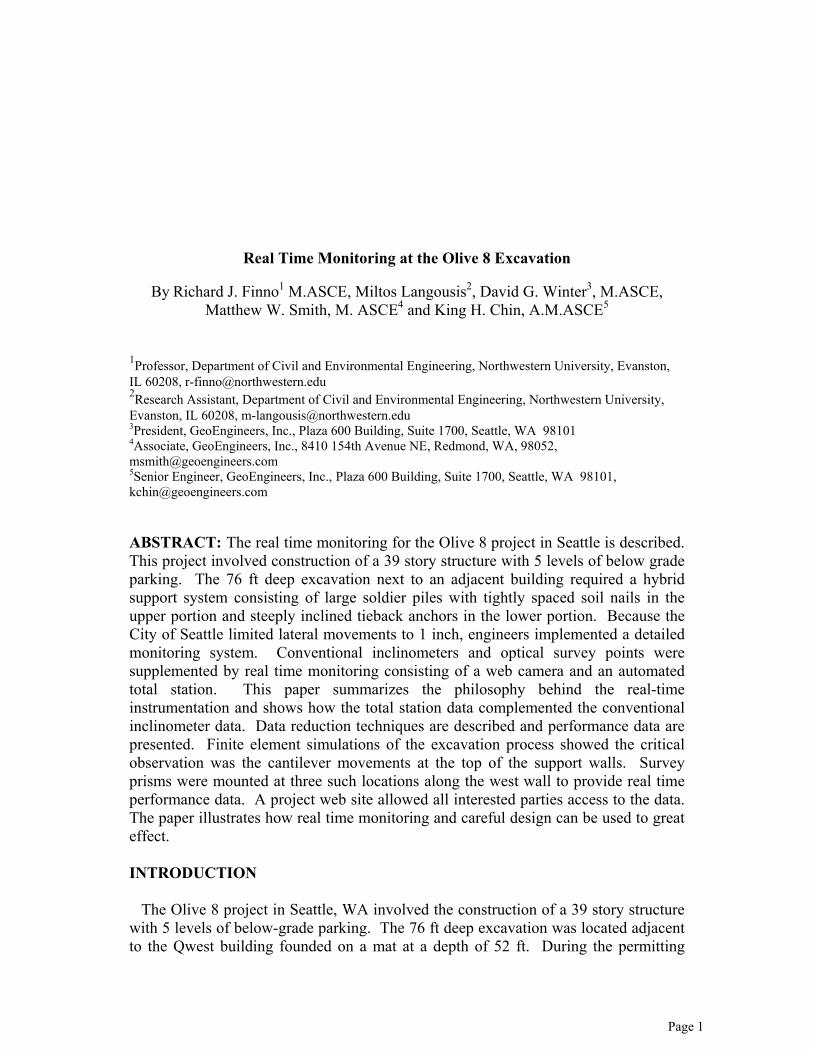
Real Time Monitoring at the Olive 8 Excavation
By Richard J. Finno1 M.ASCE, Miltos Langousis2, David G. Winter3, M.ASCE,
Matthew W. Smith, M. ASCE4 and King H. Chin, A.M.ASCE5
1Professor, Department of Civil and Environmental Engineering, Northwestern University, Evanston, IL 60208, [email protected] 2Research Assistant, Department of Civil and Environmental Engineering, Northwestern University, Evanston, IL 60208, [email protected] 3President, GeoEngineers, Inc., Plaza 600 Building, Suite 1700, Seattle, WA 98101 4Associate, GeoEngineers, Inc., 8410 154th Avenue NE, Redmond, WA, 98052, [email protected] 5Senior Engineer, GeoEngineers, Inc., Plaza 600 Building, Suite 1700, Seattle, WA 98101, [email protected] ABSTRACT: The real time monitoring for the Olive 8 project in Seattle is described. This project involved construction of a 39 story structure with 5 levels of below grade parking. The 76 ft deep excavation next to an adjacent building required a hybrid support system consisting of large soldier piles with tightly spaced soil nails in the upper portion and steeply inclined tieback anchors in the lower portion. Because the City of Seattle limited lateral movements to 1 inch, engineers implemented a detailed monitoring system. Conventional inclinometers and optical survey points were supplemented by real time monitoring consisting of a web camera and an automated total station. This paper summarizes the philosophy behind the real-time instrumentation and shows how the total station data complemented the conventional inclinometer data. Data reduction techniques are described and performance data are presented. Finite element simulations of the excavation process showed the critical observation was the cantilever movements at the top of the support walls. Survey prisms were mounted at three such locations along the west wall to provide real time performance data. A project web site allowed all interested parties access to the data. The paper illustrates how real time monitoring and careful design can be used to great effect. INTRODUCTION The Olive 8 project in Seattle, WA involved the construction of a 39 story structure with 5 levels of below-grade parking. The 76 ft deep excavation was located adjacent to the Qwest building founded on a mat at a depth of 52 ft. During the permitting
Page 2
process, the City of Seattle stipulated that if the lateral movements were observed to be in excess of ½ inch between two successive readings or if the total wall movements exceeded 1 inch, the construction of the shoring wall would be stopped to evaluate the cause of the movement and to establish the type and extent of remedial measures required. Based on past performance data of excavations through similar soil conditions, typical deflections for excavations of this height (Clough and O’Rourke 1990) were expected to vary from 0.001H to 0.003H, or ¾ inch to about 2.5 inches. Therefore particular attention was paid to designing the support system to limit the movements to less than 1 inch. To meet these requirements, the wall adjacent to the Qwest building was designed with a hybrid support system consisting of large soldier piles with tightly spaced soil nails in the upper portion and steeply inclined tieback anchors in the lower portion. To facilitate timely data acquisition and evaluation during construction, a robotic total station autonomously collected 3-dimensional movements of prisms established at the top of the support wall. These data were placed autonomously on a web site that allowed all interested parties access to the information. The total station data were combined with lateral movements behind the support wall measured with conventional inclinometers. Because design calculations suggested the cantilever movements at the top of the wall could likely have been the largest movements that would occur, the combination of the two types of data would allow essentially real time evaluation of the effects of construction on the ground movements. This paper describes the Olive 8 excavation, discusses the design studies used to develop the instrumentation approach, presents the instrumentation and data acquisition systems employed at the site, summarizes the performance of the support system and compares the design predictions with the observed responses. SITE DESCRIPTION The design of the excavation for the 8th and Olive development in Seattle presented a
number of challenges due to the presence of the adjacent Qwest building. A 16 ft alley separated the Olive 8 excavation and the Qwest building, immediately to the west. The Qwest building extends approximately 52 ft below grade and is supported on a perimeter strip footing and a mat foundation for the core of the structure. The design bearing pressure of these foundations was 10 ksf. Existing buried power and communications utilities are located in the alley along with five utility vaults. Because of the movement constraints imposed by these conditions, the design of the excavation support for that wall differed from the other three walls. A cross section through the excavation adjacent to the Qwest building is shown in Figure 1. The shoring system for the west support wall consisted of a combination of soldier piles, soil nails and tiedback ground anchors. The soldier piles were W24x162 sections spaced at approximately 8 ft centers. The upper portion of the alley soils was reinforced with a high density soil nail configuration to the elevation where the tieback anchors were installed. Typically, 9 rows of soil nails were installed at 3 ft vertical by 4 ft horizontal spacing. The soil nails were angled 15 degrees below the horizontal

Page 3
FIG 1. Subsurface Conditions and Support System at West Wall
and consisted of no. 10 rebar grouted into a rotary augered, 8-inch diameter hole. The drilling stopped approximately 1 foot from the Qwest basement wall, thus providing nearly the maximum length for the nails. With subsequent single-stage grouting, a design load transfer rate of 3 kips/foot was attained. A shotcrete facing was used for the soil nailed portion of the wall. Below the nails, tiebacks were installed by drilling a hole by rotary methods and grouting the anchor in place under high pressure. The tieback elevations were selected to maintain a minimum 3 foot clearance below the perimeter strip footing of the Qwest building. The maximum declination of the tiebacks was 45 degrees below the horizontal. The tieback horizontal spacing is 8 feet and 4 to 5 rows of tiebacks were deployed, depending on the wall section. The design load transfer rate was 4.5 kips/ft. In the tiedback portion of the wall, wood lagging spanned the W sections.
(a) (b)
FIG. 2. Site Photos: (a) west wall showing soil nails (b) at full excavated depth
Page 4
Because of the presence of several utility vaults in the alley, 3 sections were
designed for the west wall, all with the same basic support scheme. Figure 2 shows images taken from a web camera during excavation that illustrate the three different patterns of closely spaced nails along the west wall.
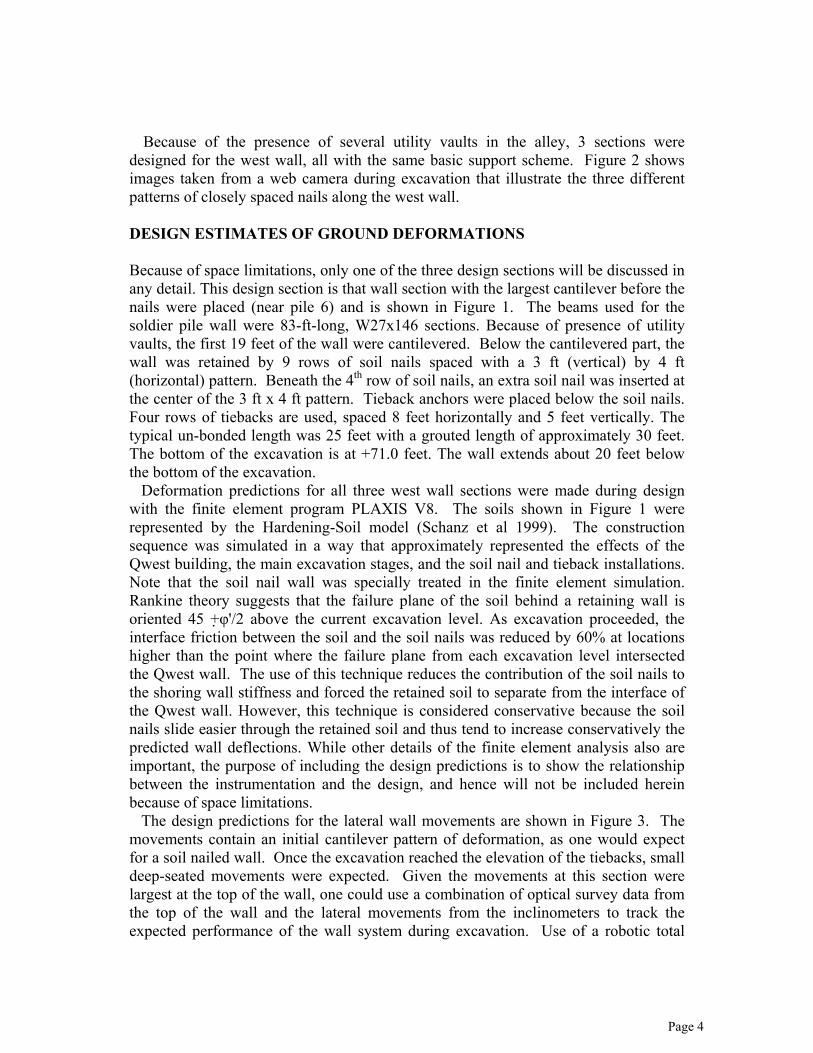
DESIGN ESTIMATES OF GROUND DEFORMATIONS Because of space limitations, only one of the three design sections will be discussed in any detail. This design section is that wall section with the largest cantilever before the nails were placed (near pile 6) and is shown in Figure 1. The beams used for the soldier pile wall were 83-ft-long, W27x146 sections. Because of presence of utility vaults, the first 19 feet of the wall were cantilevered. Below the cantilevered part, the wall was retained by 9 rows of soil nails spaced with a 3 ft (vertical) by 4 ft (horizontal) pattern. Beneath the 4th row of soil nails, an extra soil nail was inserted at the center of the 3 ft x 4 ft pattern. Tieback anchors were placed below the soil nails. Four rows of tiebacks are used, spaced 8 feet horizontally and 5 feet vertically. The typical un-bonded length was 25 feet with a grouted length of approximately 30 feet. The bottom of the excavation is at +71.0 feet. The wall extends about 20 feet below the bottom of the excavation. Deformation predictions for all three west wall sections were made during design with the finite element program PLAXIS V8. The soils shown in Figure 1 were represented by the Hardening-Soil model (Schanz et al 1999). The construction sequence was simulated in a way that approximately represented the effects of the Qwest building, the main excavation stages, and the soil nail and tieback installations. Note that the soil nail wall was specially treated in the finite element simulation. Rankine theory suggests that the failure plane of the soil behind a retaining wall is oriented 45 + φ'/2 above the current excavation level. As excavation proceeded, the interface friction between the soil and the soil nails was reduced by 60% at locations higher than the point where the failure plane from each excavation level intersected the Qwest wall. The use of this technique reduces the contribution of the soil nails to the shoring wall stiffness and forced the retained soil to separate from the interface of the Qwest wall. However, this technique is considered conservative because the soil nails slide easier through the retained soil and thus tend to increase conservatively the predicted wall deflections. While other details of the finite element analysis also are important, the purpose of including the design predictions is to show the relationship between the instrumentation and the design, and hence will not be included herein because of space limitations. The design predictions for the lateral wall movements are shown in Figure 3. The movements contain an initial cantilever pattern of deformation, as one would expect for a soil nailed wall. Once the excavation reached the elevation of the tiebacks, small deep-seated movements were expected. Given the movements at this section were largest at the top of the wall, one could use a combination of optical survey data from the top of the wall and the lateral movements from the inclinometers to track the expected performance of the wall system during excavation. Use of a robotic total
Page 5
station would allow a more timely evaluation of this expected response, especially when used in conjunction with periodic inclinometer readings.
Predicted Displacement (in.)0.0 0.4 0.8 1.2 1.6
Ele
vatio
n (ft
.)60
70
80
90
100
110
120
130
FIG 3. Design Predictions of Lateral Movements at West Wall INSTRUMENTATION An instrumentation program was established to monitor the performance of the shoring system and to provide early detection of deflections that could potentially damage the nearby structures. Instrumentation included three inclinometers along the west wall to measure lateral movements directly behind a W section, optical surveying of the shoring wall and nearby structures before and during the construction, and strain gages on the soil nails and load cells on the tiebacks to monitor the load transfer from the ground to the structural components of the wall. Three inclinometers were installed along the west wall attached to the back flange of piles 6, 13 and 18 at the locations shown in Figure 3. The casing was securely attached on the pile every 10 feet and it was filled with water prior placing the concrete into the shaft. All inclinometers extended to the bottom of the soldier piles. Inclinometer data were collected approximately once a week, with initial readings taken prior to drilling adjacent piles.
Page 6
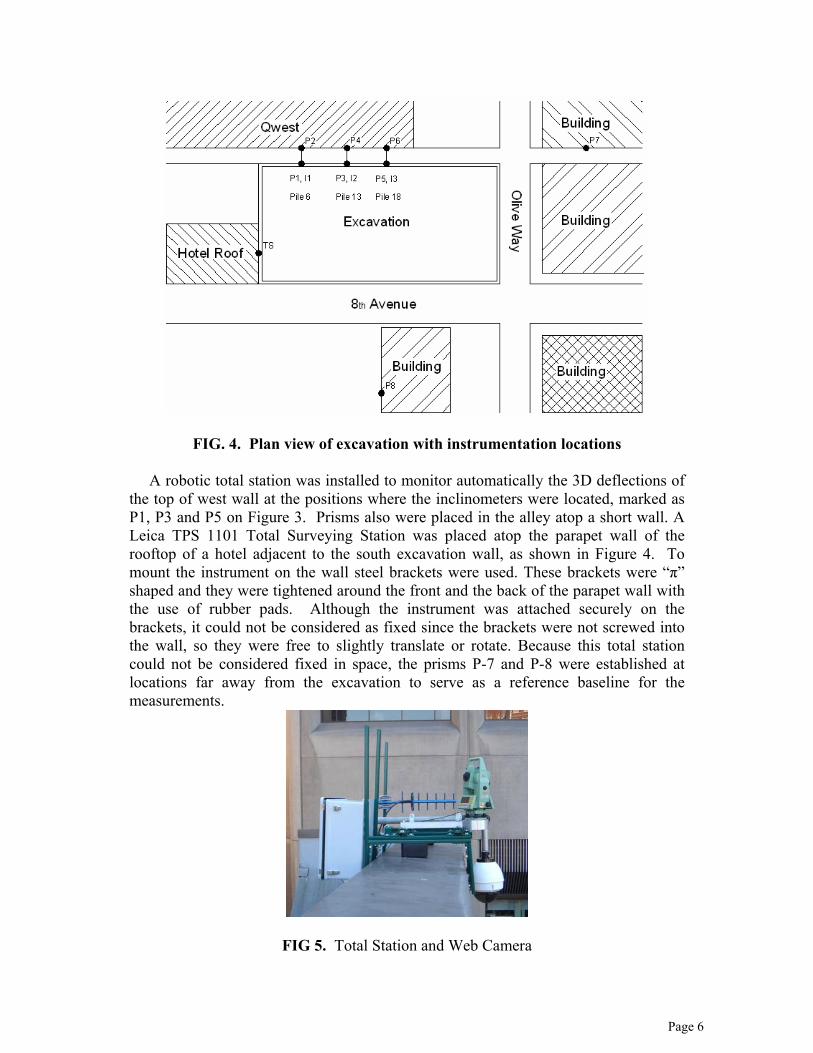
FIG. 4. Plan view of excavation with instrumentation locations A robotic total station was installed to monitor automatically the 3D deflections of the top of west wall at the positions where the inclinometers were located, marked as P1, P3 and P5 on Figure 3. Prisms also were placed in the alley atop a short wall. A Leica TPS 1101 Total Surveying Station was placed atop the parapet wall of the rooftop of a hotel adjacent to the south excavation wall, as shown in Figure 4. To mount the instrument on the wall steel brackets were used. These brackets were “π” shaped and they were tightened around the front and the back of the parapet wall with the use of rubber pads. Although the instrument was attached securely on the brackets, it could not be considered as fixed since the brackets were not screwed into the wall, so they were free to slightly translate or rotate. Because this total station could not be considered fixed in space, the prisms P-7 and P-8 were established at locations far away from the excavation to serve as a reference baseline for the measurements.
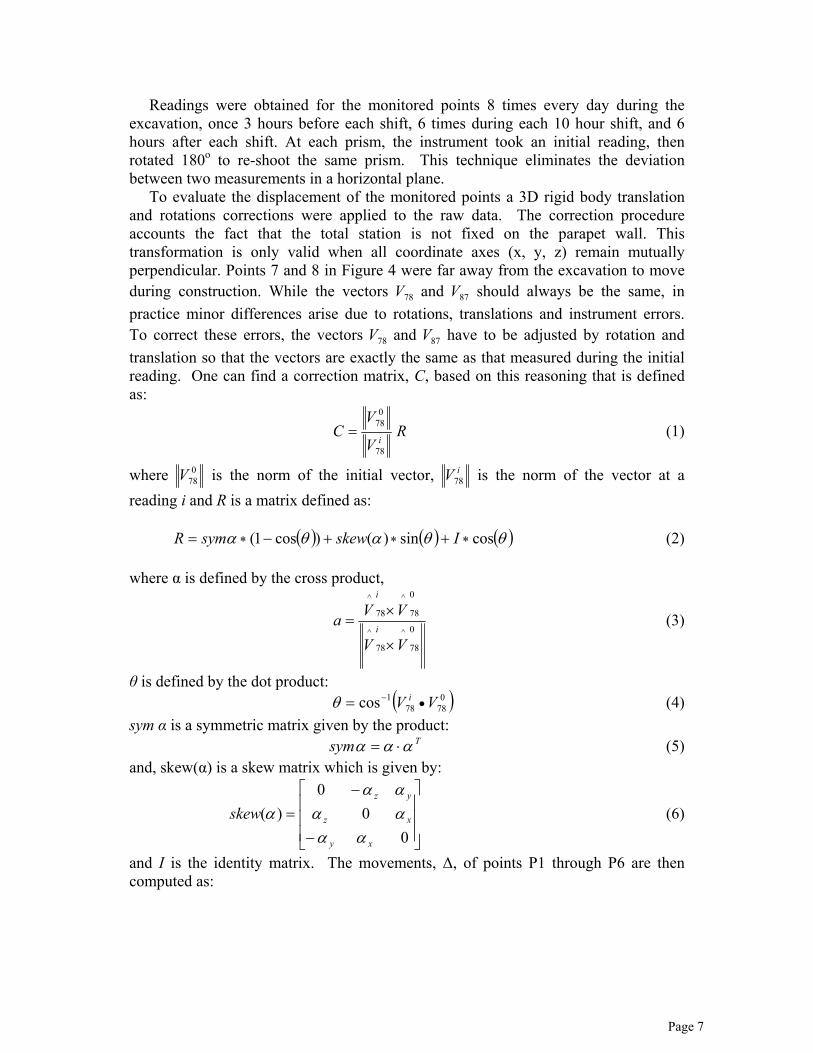
FIG 5. Total Station and Web Camera
Page 7
Readings were obtained for the monitored points 8 times every day during the excavation, once 3 hours before each shift, 6 times during each 10 hour shift, and 6 hours after each shift. At each prism, the instrument took an initial reading, then rotated 180o to re-shoot the same prism. This technique eliminates the deviation between two measurements in a horizontal plane. To evaluate the displacement of the monitored points a 3D rigid body translation and rotations corrections were applied to the raw data. The correction procedure accounts the fact that the total station is not fixed on the parapet wall. This transformation is only valid when all coordinate axes (x, y, z) remain mutually perpendicular. Points 7 and 8 in Figure 4 were far away from the excavation to move during construction. While the vectors 78V and 87V should always be the same, in practice minor differences arise due to rotations, translations and instrument errors. To correct these errors, the vectors 78V and 87V have to be adjusted by rotation and translation so that the vectors are exactly the same as that measured during the initial reading. One can find a correction matrix, C, based on this reasoning that is defined as:
RV
VC
i78
078
= (1)
where 078V is the norm of the initial vector, iV78 is the norm of the vector at a
reading i and R is a matrix defined as:
( ) ( ) ( )θθαθα cossin)()cos1( ∗∗∗ ++−= IskewsymR (2) where α is defined by the cross product,
0
78
^
78
^
0
78
^
78
^
VV
VVai
i
×
×= (3)
θ is defined by the dot product: ( )0
78781cos VV i •−=θ (4)
sym α is a symmetric matrix given by the product: Tsym ααα ⋅= (5)
and, skew(α) is a skew matrix which is given by:
−
−=
00
0)(
xy
xz
yz
skewαα
αααα
α (6)
and I is the identity matrix. The movements, ∆, of points P1 through P6 are then computed as:
Page 8
077 j
ij
j
j
j
VVCzyx
−=
∆∆∆
(7)
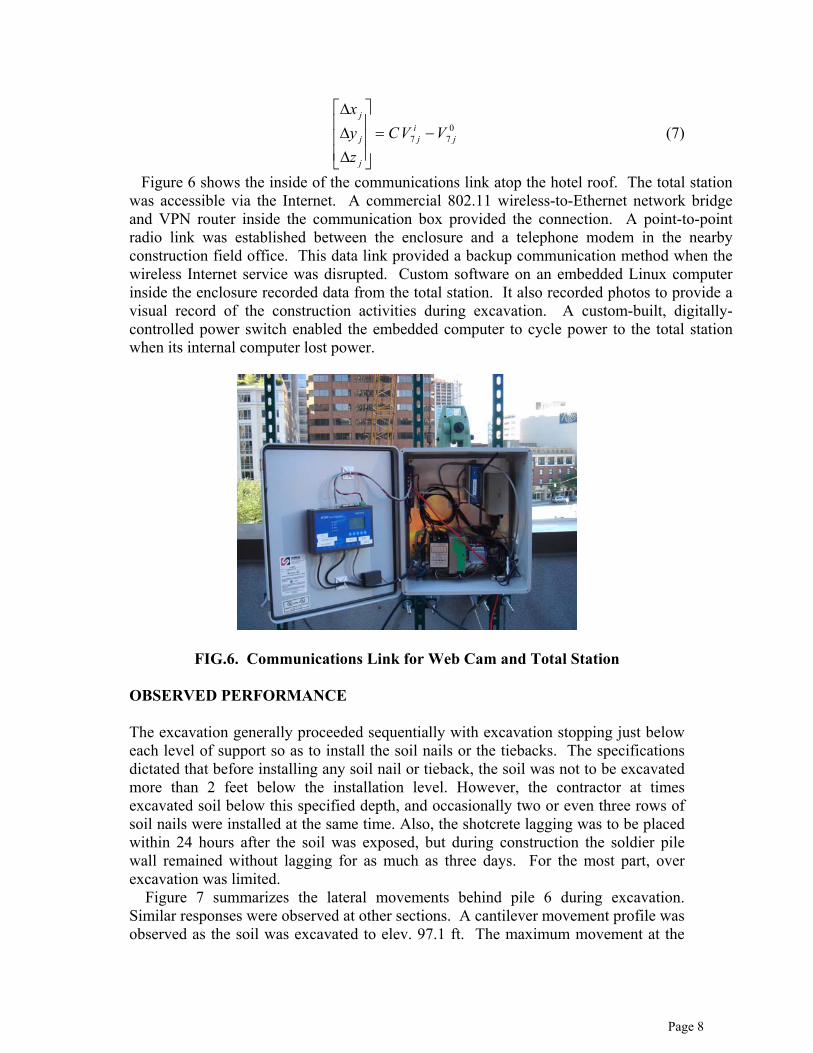
Figure 6 shows the inside of the communications link atop the hotel roof. The total station was accessible via the Internet. A commercial 802.11 wireless-to-Ethernet network bridge and VPN router inside the communication box provided the connection. A point-to-point radio link was established between the enclosure and a telephone modem in the nearby construction field office. This data link provided a backup communication method when the wireless Internet service was disrupted. Custom software on an embedded Linux computer inside the enclosure recorded data from the total station. It also recorded photos to provide a visual record of the construction activities during excavation. A custom-built, digitally-controlled power switch enabled the embedded computer to cycle power to the total station when its internal computer lost power.
FIG.6. Communications Link for Web Cam and Total Station
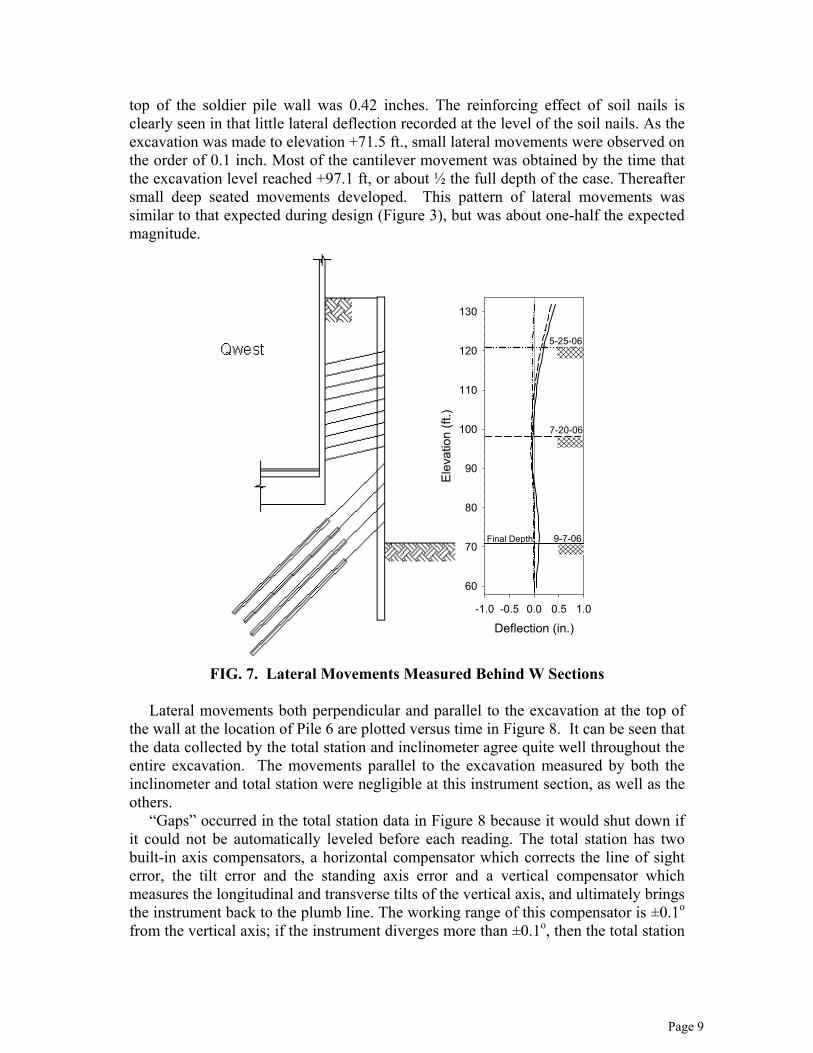
OBSERVED PERFORMANCE The excavation generally proceeded sequentially with excavation stopping just below each level of support so as to install the soil nails or the tiebacks. The specifications dictated that before installing any soil nail or tieback, the soil was not to be excavated more than 2 feet below the installation level. However, the contractor at times excavated soil below this specified depth, and occasionally two or even three rows of soil nails were installed at the same time. Also, the shotcrete lagging was to be placed within 24 hours after the soil was exposed, but during construction the soldier pile wall remained without lagging for as much as three days. For the most part, over excavation was limited. Figure 7 summarizes the lateral movements behind pile 6 during excavation. Similar responses were observed at other sections. A cantilever movement profile was observed as the soil was excavated to elev. 97.1 ft. The maximum movement at the
Page 9
top of the soldier pile wall was 0.42 inches. The reinforcing effect of soil nails is clearly seen in that little lateral deflection recorded at the level of the soil nails. As the excavation was made to elevation +71.5 ft., small lateral movements were observed on the order of 0.1 inch. Most of the cantilever movement was obtained by the time that the excavation level reached +97.1 ft, or about ½ the full depth of the case. Thereafter small deep seated movements developed. This pattern of lateral movements was similar to that expected during design (Figure 3), but was about one-half the expected magnitude.
Deflection (in.)-1.0 -0.5 0.0 0.5 1.0
Ele
vatio
n (ft
.)
60
70
80
90
100
110
120
130
Final Depth 9-7-06
7-20-06
5-25-06
FIG. 7. Lateral Movements Measured Behind W Sections
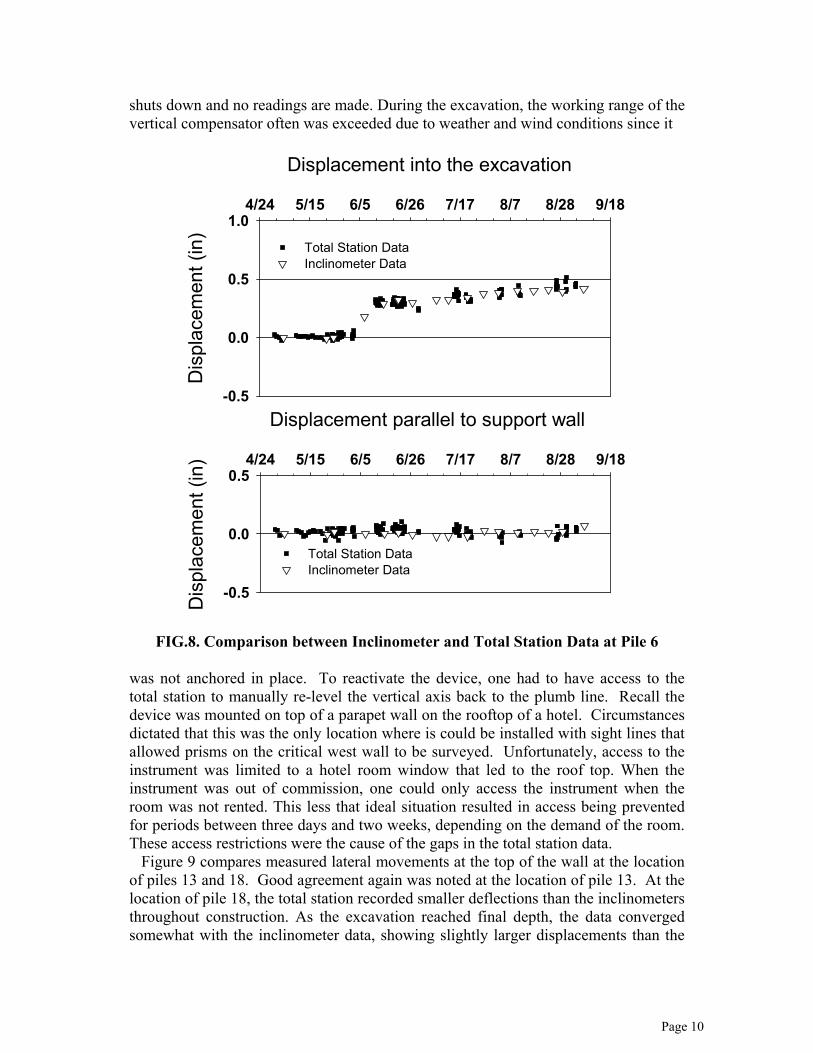
Lateral movements both perpendicular and parallel to the excavation at the top of the wall at the location of Pile 6 are plotted versus time in Figure 8. It can be seen that the data collected by the total station and inclinometer agree quite well throughout the entire excavation. The movements parallel to the excavation measured by both the inclinometer and total station were negligible at this instrument section, as well as the others. “Gaps” occurred in the total station data in Figure 8 because it would shut down if it could not be automatically leveled before each reading. The total station has two built-in axis compensators, a horizontal compensator which corrects the line of sight error, the tilt error and the standing axis error and a vertical compensator which measures the longitudinal and transverse tilts of the vertical axis, and ultimately brings the instrument back to the plumb line. The working range of this compensator is ±0.1o from the vertical axis; if the instrument diverges more than ±0.1o, then the total station
Page 10
shuts down and no readings are made. During the excavation, the working range of the vertical compensator often was exceeded due to weather and wind conditions since it
Displacement into the excavation
4/24 5/15 6/5 6/26 7/17 8/7 8/28 9/18D
ispl
acem
ent (
in)
-0.5
0.0
0.5
1.0Total Station DataInclinometer Data
Displacement parallel to support wall
4/24 5/15 6/5 6/26 7/17 8/7 8/28 9/18
Dis
plac
emen
t (in
)
-0.5
0.0
0.5
Total Station DataInclinometer Data
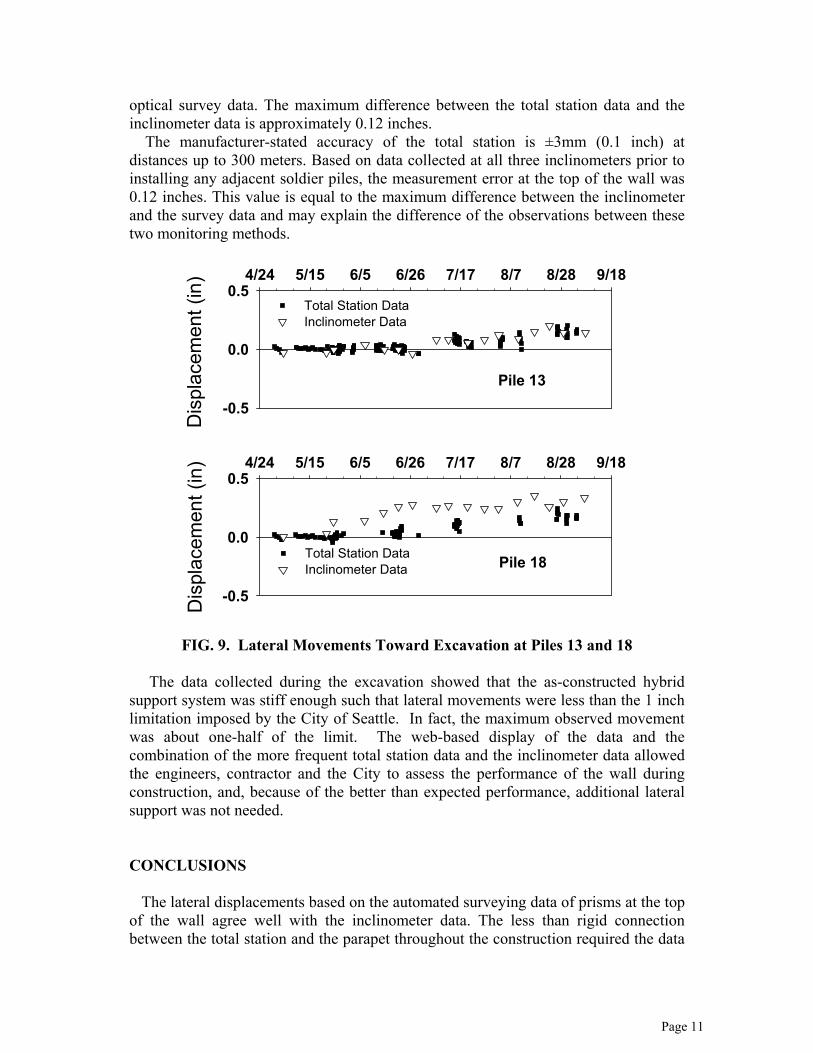
FIG.8. Comparison between Inclinometer and Total Station Data at Pile 6 was not anchored in place. To reactivate the device, one had to have access to the total station to manually re-level the vertical axis back to the plumb line. Recall the device was mounted on top of a parapet wall on the rooftop of a hotel. Circumstances dictated that this was the only location where is could be installed with sight lines that allowed prisms on the critical west wall to be surveyed. Unfortunately, access to the instrument was limited to a hotel room window that led to the roof top. When the instrument was out of commission, one could only access the instrument when the room was not rented. This less that ideal situation resulted in access being prevented for periods between three days and two weeks, depending on the demand of the room. These access restrictions were the cause of the gaps in the total station data. Figure 9 compares measured lateral movements at the top of the wall at the location of piles 13 and 18. Good agreement again was noted at the location of pile 13. At the location of pile 18, the total station recorded smaller deflections than the inclinometers throughout construction. As the excavation reached final depth, the data converged somewhat with the inclinometer data, showing slightly larger displacements than the
Page 11
optical survey data. The maximum difference between the total station data and the inclinometer data is approximately 0.12 inches. The manufacturer-stated accuracy of the total station is ±3mm (0.1 inch) at distances up to 300 meters. Based on data collected at all three inclinometers prior to installing any adjacent soldier piles, the measurement error at the top of the wall was 0.12 inches. This value is equal to the maximum difference between the inclinometer and the survey data and may explain the difference of the observations between these two monitoring methods.
4/24 5/15 6/5 6/26 7/17 8/7 8/28 9/18
Dis
plac
emen
t (in
)
-0.5
0.0
0.5Total Station DataInclinometer Data
Pile 13
4/24 5/15 6/5 6/26 7/17 8/7 8/28 9/18
Dis
plac
emen
t (in
)
-0.5
0.0
0.5
Total Station DataInclinometer Data Pile 18
FIG. 9. Lateral Movements Toward Excavation at Piles 13 and 18 The data collected during the excavation showed that the as-constructed hybrid support system was stiff enough such that lateral movements were less than the 1 inch limitation imposed by the City of Seattle. In fact, the maximum observed movement was about one-half of the limit. The web-based display of the data and the combination of the more frequent total station data and the inclinometer data allowed the engineers, contractor and the City to assess the performance of the wall during construction, and, because of the better than expected performance, additional lateral support was not needed. CONCLUSIONS The lateral displacements based on the automated surveying data of prisms at the top of the wall agree well with the inclinometer data. The less than rigid connection between the total station and the parapet throughout the construction required the data
Page 12
to be analyzed using corrections based on observations from stationary prisms located away from the zone of influence of the excavation. This connection also caused the total station to shut down a number of times during the excavation. ACKNOWLEDGMENTS This work was accomplished with the support of the owner, R.C. Hedreen Co., the general contractor, Skanska, the excavation support contractor, DBM, and KPFF the structural and civil engineer for the project. Financial support for this work was in part provided by National Science Foundation grant CMS-0219123 and the Infrastructure Technology Institute (ITI) of Northwestern University. The support of Dr. Richard Fragaszy, program director at NSF, and Mr. David Schulz, ITI’s director, is greatly appreciated. . REFERENCES Clough, G. W. and O’Rourke, T. D. (1990). “Construction induced movements of in-
situ walls.” Design and Performance of Earth Retaining Structures, Proceedings of a Specialty Conference at Cornell University, ASCE, New York, 439-470.
Schantz, T., Vermeer, P.A. and Bonnier, P.G. 1999. Formulation and verification of the Hardening–Soil Model. R.B.J. Brinkgreve, Beyond 2000 in Computational Geotechnics. Balkema, Rotterdam, 281-290.
.


![RMU-2 Project Specific Soil Excavation Monitoring ... PROJECT SPECIFIC SOIL EXCAVATION MONITORING, MANAGEMENT AND CORRECTIVE ACTION PLAN [NOTE: To be added to the Permit in its entirety]](https://img.pdfslide.net/doc/110x75/5b09a1af7f8b9a5f6d8e3ae6/rmu-2-project-specific-soil-excavation-monitoring-project-specific-soil-excavation.jpg)