Embed Size (px)
Citation preview

Univers
ity of
Cap
e Tow
n
Real-time motion and magnetic field correction for
GABA editing using EPI volumetric navigated MEGA-
SPECIAL sequence: Reproducibility and Gender effects
Muhammad G. Saleh
Department of Human Biology
University of Cape Town
Thesis presented for the degree of
Doctor of Philosophy
February 2016

The copyright of this thesis vests in the author. No quotation from it or information derived from it is to be published without full acknowledgement of the source. The thesis is to be used for private study or non-commercial research purposes only.
Published by the University of Cape Town (UCT) in terms of the non-exclusive license granted to UCT by the author.
Univers
ity of
Cap
e Tow
n

All praise is due to Allah, the Lord of the Worlds
Salutations and benedictions to His beloved and His beloved’s immaculate family

To my beloved parents, sisters, teachers, relatives and friends

Jesus was once asked, “Who taught you ethics?” He replied, “No one. I saw the ugliness of
ignorance and strayed away from it.”
Introduction to Islam
Islamic Humanitarian Service
Amirul Momineen Ali ibn Abi Talib (peace be upon him) said: ‘O believer, knowledge and manners
are values of yourself, thus make efforts in gaining knowledge, as much as your knowledge and
manners increase, your status and value would also increase, because through knowledge you
would be guided to your Lord and through manners you would be able to serve the Lord in the best
way and one who has good manners would become eligible for the guardianship and proximity of
God. Hence, accept good advice, so that you may be saved from the punishment of God.”
Introduction to Islam
Ayatollah Ibrahim Amini

ABSTRACT
γ-aminobutyric acid (GABA) is the primary inhibitory neurotransmitter and is of great interest to
the magnetic resonance spectroscopy (MRS) community due to its role in several neurological
diseases and disorders. Since GABA acquisition without macromolecule contamination requires
long scan times and strongly depends on magnetic field (B0) stability, it is highly susceptible to
motion and B0 inhomogeneity. In this work, a pair of three-dimensional (3D) echo planar imaging
(EPI) volumetric navigators (vNav) with different echo times, were inserted in MEGA-SPECIAL to
perform prospective correction for changes in the subject’s head position and orientation, as well as
changes in B0. The navigators do not increase acquisition time and have negligible effect on the
GABA signal. The motion estimates are obtained by registering the first of the pairs of successive
vNav volume images to the first volume image. The 3D field maps are calculated through complex
division of the pair of vNav contrasts and are used for estimating zero- and first-order shim changes
in the volume of interest (VOI).
The efficacy of the vNav MEGA-SPECIAL sequence was demonstrated in-vitro and in vivo.
Without motion and shim correction, spectral distortions and increases in spectral fitting error,
linewidth and GABA concentration relative to creatine were observed in the presence of motion.
The navigated sequence yielded high spectral quality despite significant subject motion.
Using the volumetric navigated MEGA-SPECIAL sequence, the reproducibility of GABA
measurements over a 40 minute period was investigated in two regions, the anterior cingulate
(ACC) and medial parietal (PAR) cortices, and compared for different analysis packages, namely
LCModel, jMRUI and GANNET. LCModel analysis yielded the most reproducible results,
followed by jMRUI and GANNET. GABA levels in ACC were unchanged over time, while GABA
levels in PAR were significantly lower for the second measurement.
In ACC, GABA levels did not differ between males and females. In contrast, males had higher
GABA levels in PAR. This gender difference was, however, only present in the first acquisition.
Only in males did GABA levels in PAR decrease over time. These results demonstrate that gender
differences are regional, and that GABA levels may fluctuate differently in different regions and
sexes.
i
Acknowledgements Drs. Ernesta Meintjes and A. Alhamud supervised the work. They provided the context, expert
ideas, advice, support and numerous resources required for the implementation of this work. Dr.
Andre J.W. van der Kouwe– from the Martinos Center for Biomedical Imaging at Massachusetts
General Hospital – provided ideas, discussion and review of my work. Dr. Jamie Near provided
guidance and engaged in technical discussions on different aspects of the project. Dr. Lindie du
Plessis on assisting with preparation of phantom for in vitro scans. Dr. Frances Robertson on
technical support for image segmentation. Steven Randall on assisting with recruiting healthy
subjects for the project. Charles Harris constructed the moving phantom jigs. Radiographers Nailah
Maroof and Alison Siljeur for assisting with data collection.
The following organizations have provided the resources used in this work: University of Cape
Town and Cape Universities Brain Imaging Centre.
Funding was provided by by the NRF/DST South African Research Chairs Initiative, NIH grant
R01HD071664 and the South African Medical Research Council (MRC).
Funding through the following scholarships: University of Cape Town scholarship for international
students, NRF scholarships for Doctoral research, University of Cape Town international
conference travel scholarship and NRF Knowledge Interchange and Collaboration scholarship.

ii
DECLARATION I, Muhammad Gulamabbas Saleh, hereby declare that the work on which this dissertation is based is
my original work (except where acknowledgements indicate otherwise) and that neither the whole
work nor any part of it has been, is being, or is to be submitted for another degree in this or any
other university. I empower the university to reproduce for the purpose of research either the whole
or any portion of the contents in any manner whatsoever.
Signature: ………… ………………………
Date:…………………………………….

iii
List of Figures
Figure 2.1: 1H spectrum of the human brain acquired at 3T. Peaks correspond to N-acetyl aspartate
(NAA), creatine (Cr), choline (Cho), Myo-Inositol (mI) Glutamate (Glu), Glutamine (Gln) and
GABA (Hess et al., 2012). ................................................................................................................... 8
Figure 2.2: GABA A) Chemical structure and B) Simulated spectrum acquired at 300MHz with a
line width of 1 Hz (De Graaf, 2008). ................................................................................................... 9
Figure 2.3: A)Water resonance dominates 1H spectrum. B) Vibration induced sidebands of water
obscure the metabolite resonances. C) Eradication of water resonance results in a 1H MRS spectrum
devoid of artefact, permitting reliable detection and quantification of metabolites (De Graaf, 2008).
............................................................................................................................................................ 10
Figure 2.4: Seven CHESS elements with optimized flip angles applied at different times. Evolution
of the water Mz for three different RF flip angles (β=65o, 95o and 125o). A water T1=1.5 ms was
used in the calculation (Tkáć et al., 1999). ........................................................................................ 11
Figure 2.5: MEGA pulse sequence diagram illustrating RF pulses and gradient waveforms (Mescher
et al., 1996). ........................................................................................................................................ 12
Figure 2.6: MEGA has higher tolerance to errors in the flip angles of the selective pulses (αs)
compared to the WATERGATE water suppression technique(Mescher et al., 1996). ..................... 12
Figure 2.7: PRESS sequence for single volume localisation. Gx, Gy, Gz are gradients applied in the
x, y and z directions, respectively. Trapezoidal gradients and semi-elliptical gradients (grey shade)
represent slice and crusher gradients, respectively (De Graaf, 2008). ............................................... 13
Figure 2.8: SPECIAL localization sequence. A) 180o (on, off) used for inverting spins
perpendicular to the original column of tissue. It was added in even scans 180o (on) and removed in
odd scans 180o (off). B) Subtraction of two SEs result in signal originating from a voxel. WS is an
additional water suppression pulse (Mlynárik et al., 2006). .............................................................. 14
Figure 2.9: Spins undergo scalar evolution, θ, following a 90 degree pulse. .................................... 15
Figure 2.10: Scalar coupling evolutions of the doublet spin system during the spin echo sequence.
A) Basic spin echo sequence. B) Acquired TE dependent phase shift of the I spin population. The
iv
180o refocusing pulse inverts the acquired phase and inverts the S spin population. C) Transverse
coherences and corresponding MRS spectra of I spins as a function of TE (De Graaf, 2008). ........ 16
Figure 2.11: A) Basic J-difference editing sequence with both selective and non-selective180o rf
pulses. B) I spin population acquired TE dependent phase shift. The 180osrefocusing pulse only
inverts the S spins causing the direction of rotation to be reversed(De Graaf, 2008). ...................... 17
Figure 2.12: Principles of J-difference spectral editing. A) Simulated, non-edited 1H MRS spectrum.
Spin I overlaps with lipid resonance making it difficult to detect. B) Non-selective experiment
where the phase of the doublet resonance from the I spins is inverted relative to uncoupled
resonances. C) Selective experiment where I spins are in phase with uncoupled resonances. D,E)
Subtraction and addition of the previous two spectra for selective detection of spin I resonance and
removal of spin I, respectively(De Graaf, 2008). .............................................................................. 18
Figure 2.13: MEGA-PRESS sequence. Double banded Gaussian 180ospulses are used for GABA
editing and to suppress water signals. 180os are flanked by gradients (G1 and G2) used to dephase
water spins.TE =68 ms for GABA MRS(Mescher et al., 1998). ....................................................... 19
Figure 2.14: Regional modulation patterns of GABA signal in the voxel (80 x 80 mm). A) Editing
pulses on. B) Editing pulses off. C) The difference between A and B. I, II, III, IV are subdivisions
of the voxel illustrating variation of GABA signal due to spatial variation of scalar coupling.
Subdivisions II and IV show total loss of GABA signal (R. A. Edden & Barker, 2007). ................. 20
Figure 2.15: Regional modulation patterns of the GABA signal in the voxel. A) Editing pulses on.
B) Editing pulses off. C) The difference between A and B. I, II are subdivisions of the voxel
illustrating variation of GABA signal due to spatial variation of scalar coupling (Near et al., 2011).
............................................................................................................................................................ 21
Figure 2.16: Integration of the area under the curves indicates that MEGA-SPECIAL yields 10%
improvement in editing efficiency over MEGA-PRESS (Near et al., 2011). .................................... 22
Figure 3.1: Axial image of the spherical phantom with an inner cube at the centre of the phantom
used for testing performance of the vNav during motion. Red (inside the cube) and blue squares
represent voxel localization and their corresponding spectra. The spectrum from the outside of the
cube depicts presence of Glu at 3.75 ppm. The spectra were apodized using 5 Hz Lorentzian filter.
............................................................................................................................................................ 26

v
Figure 3.2: Scans of the spherical phantom acquired using the standard MEGA-SPECIAL (MSpc;
A1) and volume navigated MSpc (vNavMSpc) sequences for different scenarios: (A) at rest; (B)
with a frequency offset; (C) with a first-order shim offset; (D) with a frequency and first-order shim
offset; and (E) a scan during which the inner cube was rotated through 7 degrees during the scan.
vNavMSpc scans were acquired without (NoCo) and with (ShMoCo) shim and motion correction
applied. In B, C, and D frequency and first-order shim offsets led to poor quality spectra from
NoCo scans while ShMoCo scans recovered the spectra. The first-order shim offset caused loss of
the pseudo-doublet pattern of the GABA peak 4(indicated by 1 and 3) and NAA line broadening
(2). Similarly, motion in the NoCo scan also caused loss of the GABA multiplet (indicated by 4). 33
Figure 3.3: Scans in three volunteers without (reference scans) and with intentional motion,
respectively, acquired using the volume navigated MEGA-SPECIAL (vNavMSpc) sequence with
either no correction (NoCo) or both shim and motion correction (ShMoCo) applied prospectively
during the scan. The GABA fitting is shown on the reference scans. Effects of motion on the NoCo
acquisitions are indicated with arrows and include a slanted baseline (A) and distorted and
broadened (B) GABA peak in subject 1, subtraction artefact (C) in subject 2, increased GABA
amplitude (D) in subjects 2 and 3, and insufficient NAA suppression (E) in the edit-on spectrum in
subject 3. ............................................................................................................................................ 34
Figure 3.4: Means of the fitting parameters A) FitErr, B) SNR, C) FWHM and D) GABA/Cr ratio
for the edited spectra without (NoCo) and with shim and motion correction (ShMoCo), both in the
absence (reference) and presence (motion) of intentional motion. (a.u: arbitrary units; ppm: parts
per million; % percentage). ................................................................................................................ 35
Figure 4.1: Voxel positioning in the (a) ACC and (b) PAR. A: Anterior. P: Posterior. R: Right. L:
Left. .................................................................................................................................................... 40
Figure 4.2: Spectral fitting of a subject’s GABA-edited spectra from the ACC (left) and PAR (right)
using A) LCModel, B) AMARES in jMRUI and C) GANNET. The Glx (Glutamate + Glutamine)
peak at 3.75 ppm and inverted NAA peak at 2 ppm are co-edited with GABA. Apodization using a
5 Hz Lorentzian filter and zero filling to a factor of 16 were applied prior to jMRUI and GANNET
fitting. The spectral fitting plots generated by the different software packages are not on the same
scale. ................................................................................................................................................... 45
Figure 4.3: LCModel measurements of GABAH2O and GABA/Cr from the ACC (left) and PAR
(right) regions. The red circle (O) represents data from acquisition 1 and the black circle (O) from
acquisition 2. ...................................................................................................................................... 50
vi
Figure 5.1: Voxel localization on T1 structural image for (a) anterior cingulate cortex (ACC) and
(b) medial parietal cortex (PAR). The acquisitions were performed in an interleaved manner. A:
Anterior. P: Posterior. R: Right. L: Left. ........................................................................................... 57
Figure 5.2: GABA-edited spectra from ACC (left) and PAR (right). GABA is clearly observed at 3
ppm. Other visible metabolites include Glx (Glutamate+Glutamine) at 3.75 ppm and inverted NAA
at 2 ppm. Apodization using a 5 Hz Lorentzian filter was applied to the spectra. ............................ 59
Figure 5.3: LCmodel fit of GABA at 3 ppm, Glx (Glutamate + Glutamine) at 3.75 ppm and NAA at
2 ppm. ................................................................................................................................................. 59
Figure 5.4: Linear regression analysis to determine, by extrapolation, GABAH2O (left) and
GABA/Cr (right) in pure GM (GMratio=1) and WM (GMratio=0). i.u: institutional units. GMratio: grey
matter ratio. r: Pearson’s correlation coefficient. .............................................................................. 61
Figure 5.5: a) Estimated marginal means of GABAH2O(left) and GABA/Cr (right) for males and
females in medial parietal cortex (PAR) for the first and second acquisitions, showing significant
gender differences only for the first acquisition. b) Effects of time on GABAH2O (left) and
GABA/Cr (right) in PAR. Only male participants reveal significant differences between the two
acquisitions. pBonf: Bonferroni corrected p values. ............................................................................ 63
vii
List of Tables
Table 2.1: Comparison of the characteristics of NAA and Cr compared to GABA (Levy & Degnan,
2013). ................................................................................................................................................... 9
Table 4.1: Measures of reproducibility for GABA measurements using LCModel .......................... 47
Table 4.2: Measures of reproducibility for GABA measurements using AMARES in jMRUI ........ 47
Table 4.3: Measures of reproducibility for GABA measurements using GANNET ......................... 48
Table 4.4: Inter-software reliability of GABAH2O and GABA/Cr measurements ............................. 48
Table 5.1: Comparison of tissue fractions (Mean ± SEM) in males and females in ACC and PAR . 61

Table of Contents
ACKNOWLEDGEMENTS .............................................................................................................. I
LIST OF FIGURES ........................................................................................................................ III
LIST OF TABLES ......................................................................................................................... VII
PREFACE ........................................................................................................................................ XI
CHAPTER 1 INTRODUCTION ................................................................................................... 1
1.1 Description of the Problem ......................................................................................................... 2
1.2 Objectives of the Project ............................................................................................................. 2
1.3 Thesis Outline ............................................................................................................................. 3
CHAPTER 2 LITERATURE REVIEW ....................................................................................... 5
2.1 GABA MRS Sequences .............................................................................................................. 5
2.2 Motion and Shim Correction Techniques ................................................................................... 5
2.3 Studies on GABA ....................................................................................................................... 6
2.4 Properties of GABA .................................................................................................................... 7
2.5 Critical Components of GABA MRS Acquisition ...................................................................... 9
2.6 Spatial Localisation ................................................................................................................... 12
2.7 Spectral Editing ......................................................................................................................... 14
CHAPTER 3 VOLUMETRIC NAVIGATED MEGA-SPECIAL FOR REAL-TIME
MOTION AND SHIM CORRECTED GABA EDITING ............................................................ 23
3.1 ABSTRACT .............................................................................................................................. 23
3.2 INTRODUCTION .................................................................................................................... 23

3.3 METHODS ............................................................................................................................... 25
3.4 RESULTS ................................................................................................................................. 29
3.5 DISCUSSION ........................................................................................................................... 30
3.6 CONCLUSION ......................................................................................................................... 36
3.7 ACKNOWLEDGEMENTS ...................................................................................................... 36
CHAPTER 4 REPRODUCIBILITY OF MACROMOLECULE SUPPRESSED GABA
MEASUREMENT USING MOTION AND SHIM NAVIGATED MEGA-SPECIAL WITH
LCMODEL, JMRUI AND GANNET ............................................................................................ 37
4.1 ABSTRACT .............................................................................................................................. 37
4.2 INTRODUCTION .................................................................................................................... 37
4.3 METHODS ............................................................................................................................... 40
4.4 RESULTS ................................................................................................................................. 44
4.5 DISCUSSION ........................................................................................................................... 46
4.6 CONCLUSION ......................................................................................................................... 53
4.7 ACKNOWLEDGEMENTS ...................................................................................................... 53
CHAPTER 5 EFFECTS OF TISSUE AND GENDER ON MACROMOLECULE
SUPPRESSED GABA ACQUIRED BY MOTION AND SHIM NAVIGATED MEGA-
SPECIAL…………………………………………………………………………………………...54
5.1 ABSTRACT .............................................................................................................................. 54
5.2 INTRODUCTION .................................................................................................................... 54
5.3 METHODS ............................................................................................................................... 56
5.4 RESULTS ................................................................................................................................. 60
5.5 DISCUSSION ........................................................................................................................... 62

5.6 CONCLUSION ......................................................................................................................... 68
5.7 ACKNOWLEDGEMENTS ...................................................................................................... 68
CHAPTER 6 DISCUSSION ......................................................................................................... 69
CHAPTER 7 CONCLUSION ...................................................................................................... 75
REFERENCES ................................................................................................................................. 76
xi
Preface This dissertation presents and evaluates a novel method to improve the efficacy of in vivo γ-
aminobutyric acid (GABA) acquisition using Mescher-Garwood with spin echo full intensity
acquired localisation (MEGA-SPECIAL) at 3T. There has been a long-standing interest at the
University of Cape Town (UCT) to study learning deficits in children with prenatal alcohol
exposure through measuring changes in GABA. The rationale for this work was to implement a
technique for robust quantification of GABA in the presence of significant subject motion.
This dissertation includes three independent articles which are found in chapters three, four and
five. Each chapter begins with an introduction that provides the necessary background and context
to the work, documents and evaluates aspects of methodology, results and conclusion. This style
permits direct access and concise evaluation of the different methodologies and follows the logical
progression of the work. This format of the thesis, however, contains repetition as each core chapter
is being presented as an independent article. The contribution of the co-authors to each chapter is
given below:
Chapter one provides a brief background on magnetic resonance spectroscopy (MRS) followed by
objectives and an outline of the dissertation.
Chapter two provides relevant background on different methods that have been used for motion and
magnetic field correction in MRS, followed by a brief review of GABA studies, properties of
GABA, and some background theory on J-editing and invivo GABA acquisition.
Chapter three is a journal article (Saleh et al., 2016) that has been peer reviewed and published in
NMR in Biomedicine (http://www.ncbi.nlm.nih.gov/pubmed/26663075).The chapter describes the
sequence and demonstrates that motion and shim correction effectively reduces subtraction artefacts
resulting in well-edited GABA peaks even in the presence of subject motion. Superior spectral quality
was demonstrated relative to scans with no correction. I am the primary author of this article with
assistance from all co-authors. André van der Kouwe conceptualised the EPI navigator. My primary
supervisor, Ernesta Meintjes, identified the problem of motion in SV GABA spectroscopy,
recommended the solution and assisted with overall project supervision. My co-supervisor, A.
Alhamud, provided technical assistance relevant to the project. Jamie Near first developed the
MEGA-SPECIAL sequence at the University of Oxford, provided guidance on the transfer of the
sequence to UCT, and engaged in technical discussions on different aspects of the sequence. It was
primarily my idea to use the MEGA-SPECIAL sequence for this project. I designed the project,
performed all technical work – including porting of the MEGA-SPECIAL sequence to the software

xii
platform of the 3T Allegra MRI at UCT and inserting the volumetric navigators – collaborated with the
project affiliates, planned all experiments, performed data acquisition and data analysis, drafted the
journal paper and gave it to the co-authors for editorial and scientific review.
Chapters four and five are manuscripts that will be submitted for publication. These chapters
investigate reproducibility of GABA measurements, tissue and gender effects to provide insight
into the robustness of the technology for neuro-spectroscopy applications. In both chapters four and
five, subjects’ data are the same. In chapter four the data are used to determine reproducibility of
MM suppressed GABA measurements obtained using three different software packages, while in
chapter five the data are used to determine tissue and gender-related effects on GABA. Briefly,
analyses of GABA MRS data are usually done using one of three available software packages,
namely LCModel, jMRUI and GANNET. To date, the agreement on the reproducibility of
macromolecule (MM) suppressed GABA has not been established between the different packages.
To date, gender differences have also not been investigated using MM suppressed GABA. I am the
primary author of the manuscripts with insights and assistance from all co-authors. My primary
supervisor, Ernesta Meintjes, assisted with overall project supervision. My co-supervisor, A.
Alhamud, provided technical assistance relevant to the project. Frances Robertson provided
technical assistance on image segmentation. André van der Kouwe gave expert guidance on data
capturing. Jamie Near developed the MEGA-SPECIAL sequence at University of Oxford, provided
guidance on the transfer of the sequence to UCT and engaged in technical discussions on different
aspects of the sequence. Jamie Near provided post-processing toolkits to develop a basis set for
LCModel and a priori information for jMRUI. The idea of conducting said studies was primarily
mine. Furthermore, I designed the project, collaborated with the project affiliates, performed all
data acquisition and data analysis, drafted the journal paper and gave it to the co-authors for
editorial and scientific input.
Chapter six provides a comprehensive discussion of the contribution of the present study to the GABA
MRS field, and highlights limitations and possible future work.
Chapter seven presents the conclusion.

1
Chapter 1 Introduction The field of spectroscopy is based on interactions between matter and electromagnetic radiation
(ER). The interaction between atoms and ER is described by absorption and emission of photons,
whose energy matches an energy level difference in the atom. Since the energy of a photon is
directly proportional to its frequency, different forms of spectroscopy are based on the frequencies
involved. One of them is nuclear magnetic resonance (NMR) spectroscopy which uses
radiofrequencies (RF) in the range 10-800 MHz (De Graaf, 2008).
Magnetic resonance spectroscopy (MRS) is a non-invasive technique, based on the principles of
NMR and allows direct detection of endogenous metabolites in the human body in vivo. Clinically,
neurometabolic information provides clinicians and researchers with a powerful tool to evaluate
diseases or to perform longitudinal studies of disease progression. Previously, neurometabolite
measurements were generally limited to concentration levels in the blood and cerebrospinal fluid
(CSF) but these are only an indirect measure of brain levels. Moreover, they cannot be attributed to
a particular region of the brain to evaluate localized metabolism or regional pathology (Levy &
Degnan, 2013). Neuro-MRS circumvents these challenges and allows quantitative evaluation of
metabolic changes associated with disease progression, brain development, brain processes,
neurological disorders and drug mediated effects (Mason et al., 2006; Sanacora et al., 2002).
The most commonly studied nuclei with MRS are hydrogen (1H), carbon-13 (13C), phosphorous
(31P) and sodium (23Na), of which hydrogen, also called proton (1H) MRS, is most widely used.
Typical metabolites of 1H MRS include N-Acetylaspartate (NAA), the choline containing
compounds Glycerophosphocholine (GPC) and Phosphocholine (PCh), Phosphocreatine (PCr),
creatine (Cr), Myo-Inositol (Ins) and Glutamate (Glu) (De Graaf, 2008). These metabolites can be
detected robustly at 3 Tesla (T) field strengths due to the fact that they are present in detectable
concentrations in the human brain and their chemical shifts are different enough that they represent
distinct peaks in the 1H MRS spectrum at 3T.
Recently, there has been an increasing interest in measuring γ-aminobutyric acid (GABA) levels in
the brain (R. A. Edden & Barker, 2007; Near et al., 2012). GABA is the primary inhibitory
neurotransmitter in the brain and accounts for almost half of the synaptic activity (Govindaraju et
al., 2000). Altered concentrations of GABA have been linked to several neurological disorders such
as motor disorders, mood and anxiety disorders, sleep disorders, olfactory, and gustatory disorders
(Bigal et al., 2008; Hasler et al., 2007; Levy et al., 2005; Winkelman et al., 2008). At the University
of Cape Town (UCT) there has been a long-standing interest in studying learning deficits in
children with prenatal alcohol exposure and the ability to measure changes in GABA during

2
learning tasks – such as motor learning (Floyer-Lea et al., 2006) or eyeblink conditioning (Jacobson
et al., 2011) – could provide new insights into the physiological basis of these learning deficits.
In vivo measurement of GABA remains challenging due to all three GABA resonances (two triplets
and one quintet) overlapping with macromolecules (MM) and signals from more concentrated
metabolites, namely Cr, NAA, and Glu making direct observation impossible especially at magnetic
field strengths < 4T (Puts & Edden, 2012). As a result, GABA MRS requires the application of
advanced spectral editing techniques, such as MEscher-GArwood (MEGA) point resolved
spectroscopy (MEGA-PRESS) and MEGA spin echo full intensity acquired localisation (MEGA-
SPECIAL) (Mescher et al., 1998; Near et al., 2011). These spectral editing techniques separate C4-
GABA at 3 ppm from other overlapping metabolites. However, successfully suppressing MM at 3
ppm (MM7) is highly dependent upon magnetic field homogeneity, frequency selective pulse
duration and editing strategy (De Graaf, 2008), as explained in the next chapter. Therefore most
studies acquire GABA without MM suppression, commonly referred to as GABA+ (Mullins et al.,
2012). Alternative approaches would be application of two-dimensional MRS methods or
spectroscopy at higher field strengths, which is not feasible due to the unavailability of a scanner in
South Africa with field strength greater than 3T (Ke et al., 2000; Puts & Edden, 2012; Tkáć &
Gruetter, 2005). In this study, we employed single voxel (SV) MEGA-SPECIAL (Near et al., 2011)
to acquire GABA without macromolecule (MM) contamination.
1.1 Description of the Problem GABA acquisitions usually have long scan times (≈10-20 minutes) due to the characteristically low
signal to noise ratio (SNR) of GABA, making these acquisitions highly susceptible to subject
motion (Puts & Edden, 2012). Besides the long scan time, MEGA, as a difference technique, is
even more motion sensitive. Subject motion can cause data to be acquired at the incorrect volume of
interest (VOI) and/or induce B0 inhomogeneity leading to line broadening, spectral distortion, and
compromised spectral editing (Drost et al., 2002; Kreis, 2004), thus adversely affecting the already
tiny GABA signal (Harris et al., 2013; Zhu et al., 2011). Furthermore, the MM suppression
technique depends on magnetic field (B0) stability. In the presence of B0 instability suppression is
incomplete resulting in GABA contaminated with residual MM.
1.2 Objectives of the Project The aims of this project were:

3
1. to insert three dimensional (3D) echo planar imaging (EPI) volumetric navigators into the
MEGA-SPECIAL sequence to perform real-time motion and shim correction and compare
performance with the standard MEGA-SPECIAL sequence;
2. to apply motion and shim navigated MEGA-SPECIAL to compare reproducibility of GABA
using commonly employed analysis software, namely LCModel (Provencher, 2001), jMRUI
(Vanhamme et al., 1997) and GANNET (R. A. Edden et al., 2013); and
3. to apply motion and shim navigated MEGA-SPECIAL to determine tissue-specific
concentrations of GABA and effects of gender on GABA concentrations.
1.3 Thesis Outline The thesis presents a novel method to correct B0 errors and artefacts caused by motion in single
voxel spectroscopy (SVS) MEGA-SPECIAL followed by application of the technique to assess
reproducibility of GABA measurements, tissue concentrations, and gender effects.
Chapter 2 presents the relevant background of the techniques that were implemented to perform
motion and shim correction in MRS, followed by a literature review of GABA MRS.
Chapter 3 describes the implementation of 3D EPI volumetric navigators to perform real-time
motion and shim correction for mitigating artefacts caused by motion and B0 inhomogeneity.
Chapters 4 and 5 describe results from the application of the motion and shim navigated MEGA-
SPECIAL sequence to investigate reproducibility and tissue specific concentrations of GABA, as
well as gender differences in GABA levels.
Chapter 6 provides a comprehensive discussion, highlighting limitations and considerations for
GABA MRS studies.
Chapter 7 presents the conclusions.
Chapter 3 has been accepted for publication in NMR in Biomedicine. Work from chapters 3, 4 and 5
have also been accepted for presentation at the 24th Annual Meeting of the International Society for
Magnetic Resonance in Medicine (ISMRM) in May 2016. Chapters 4 and 5 have been written as
manuscript and will be submitted for publication. Below are the references for the journal article
and conference papers:
Saleh MG, Alhamud A, Near J, van der Kouwe AJ, Meintjes EM: Volumetric navigated MEGA-
SPECIAL for real-time motion and shim corrected GABA editing. NMR Biomed, 29, 248-255.

4
Saleh MG, Alhamud A, Near J, van der Kouwe AJ, Meintjes EM: Reproducibility of
macromolecule suppressed GABA measurement using motion and shim navigated MEGA-
SPECIAL with LCModel, jMRUI and GANNET. Magnetic Resonance Materials in Physics,
Biology and Medicine, under review.
Saleh MG, Near J, Alhamud A, du Plessis L, van der Kouwe AJW, Meintjes EM: Volumetric
Navigated MEGA-SPECIAL for real-time zero- and first-order shim and motion corrected
GABA MRS. Proceedings of 24th Annual Meeting ISMRM: 2016; Singapore.
Saleh MG, Alhamud A, Near J, Robertson F, van der Kouwe AJW, Meintjes EM: Reproducibility
and gender-related effects on macromolecule suppressed GABA. Proceedings of 24th Annual
Meeting ISMRM: 2016; Singapore.

5
Chapter 2 Literature review
2.1 GABA MRS Sequences There are several sequences that could be used to acquire GABA spectra but the most common one
is the MEGA-PRESS sequence (Mescher et al., 1998; Near et al., 2011; Zhu et al., 2011). In this
project, we will be using MEGA-SPECIAL with MM suppression (Near et al., 2011).
2.2 Motion and Shim Correction Techniques The MEGA-SPECIAL sequence involves four acquisitions making it more motion sensitive than
the ubiquitous two-acquisition MEGA-PRESS sequence. Subject motion not only results in
measurements from incorrect anatomical regions, but also in B0 inhomogeneity, leading to signal
degradation.
Currently, motion and artefact corrections in MRS data are based on i) retrospective frequency and
phase corrections, and (ii) prospective motion and shim correction.
The retrospective corrections are performed using phase and frequency information from
metabolites with a large signal (Waddell et al., 2007), such as NAA or Cr, or the whole spectrum
(Near et al., 2015) for spectral alignment prior to averaging. This method reduces frequency and
phase errors, and subtraction artefacts, however, localization errors and poor signal arising from
subject motion and motion-related B0 changes cannot be corrected retrospectively. Furthermore,
this method is dependent on available SNR, which is a limiting factor for GABA editing (Near et
al., 2015).
Navigator-based motion tracking methods employ properties of rigid body transformations to
subsample k-space in a time efficient manner (Fu et al., 1995; van der Kouwe et al., 2006; Welch et
al., 2002) to track motion throughout the scan. MRS is well suited to an imaging navigator because
of its long repetition times (typically 1.5-3 s) – most of which allows for signal relaxation and as
such is available for navigator acquisition. MRS also benefits greatly from such an imaging
navigator due to its lack of anatomical information. One such navigator is PROspective MOtion
correction (PROMO, (White et al., 2010)), which uses three orthogonal, low resolution spiral
images to register head position to a reference map. Keating et al. integrated PROMO and a water-
suppression cycling system into the PRESS sequence for prospective motion correction and
retrospective shot to shot frequency and phase correction (Keating et al., 2010). Zaitsev et al.
modified the PRESS sequence to integrate an optical tracking system and a frequency navigator for
prospective motion correction and retrospective frequency correction, respectively (Zaitsev et al.,
6
2010). Although these techniques provide efficient motion tracking and correction, adequate MM
suppression depends on B0 stability and real-time frequency correction is needed to maintain the
editing pulses symmetrically about 1.7 ppm. Keating et al. implemented a method using PROMO
and navigators to correct both motion and linear shim terms in real time (Keating & Ernst, 2012).
This method mitigated spectral distortions and maintained spectral quality in the presence of subject
motion. To our knowledge, this technique has not been implemented in GABA editing sequences.
Hess et al. implemented a pair of echo planar imaging (EPI) volumetric navigators in a single voxel
PRESS sequence to correct in real-time both the volume of interest (subject motion) and zero- to
first-order changes in B0 (Hess et al., 2011). The navigator minimally affected the signals of
metabolites with high concentration and maintained spectral quality when a subject moved during
the scan. EPI volumetric navigators have previously been implemented in GABA+ Magnetic
Resonance Spectroscopic Imaging (MRSI) using MEGA Localization by Adiabatic SElective
Refocusing (MEGA-LASER) (Bogner et al., 2014). Since GABA+ acquisition does not require
MM suppression, it is less sensitive to frequency drift because of the large bandwidth of the non-
overlapping spectral edit-on (1.9 ppm) and edit-off (4.7 ppm) pulses. To date, real-time motion and
shim correction has not been implemented in SVS J-editing MEGA-SPECIAL. The primary aim of
this project was to incorporate EPI volumetric navigators into the MEGA-SPECIAL sequence to
correct in real-time for both motion and B0 inhomogeneity, for the accurate quantification of MM-
suppressed GABA.
2.3 Studies on GABA
2.3.1 Reproducibility of GABA
Several studies use GABA+ (GABA+MM) as a substitute for pure MM-suppressed GABA.
Previous studies have shown that GABA+ and GABA have weak to no correlation probably due to
the problems related with the MM suppression technique. This also suggests that GABA+ is a weak
substitute for underlying GABA (Harris et al., 2014; Mikkelsen et al., 2015; Near et al., 2011).
Measuring pure GABA has become increasingly important due to its role in several neurological
conditions (Bigal et al., 2008; Hasler et al., 2007; Levy et al., 2005; Winkelman et al., 2008). As
explained above, measuring pure GABA is, however, challenging due to its dependence on B0
stability.
GABA+ can be quantified using either tissue water (H2O) or Cr as internal references (Bai et al.,
2014; Bogner et al., 2010; Harris et al., 2014). To date, intra- and inter-subject variability of GABA
concentrations have not been investigated using the MEGA-SPECIAL sequence. Therefore, the
second aim of this project was to use the motion and shim navigated MEGA-SPECIAL sequence to
7
examine intra- and inter-subject variability of GABA, referenced to H2O and Cr, using LCModel
(Provencher, 2001), AMARES in jMRUI (Vanhamme et al., 1997) and GANNET (R. A. Edden et
al., 2013).
2.3.2 Tissue-specific concentrations of GABA
In the healthy human brain, concentrations of GABA are highly heterogeneous (Rothman et al.,
1993). The SVS sequences that are widely used to measure GABA levels typically use large VOI’s
due to the low SNR of GABA (Puts & Edden, 2012), inevitably including all three tissue types,
namely grey matter (GM), white matter (WM) and cerebrospinal fluid (CSF). It is therefore
necessary to determine the fractions of each tissue type that is present in the voxel to quantify
tissue-specific brain concentrations of GABA. The ratio of GM to WM (GM/WM) concentration of
GABA has been quantified across the brain previously using a two dimensional (2D) chemical shift
imaging (CSI) sequence (I.-Y. Choi et al., 2006; Jensen et al., 2005). Since GABA is susceptible to
B0 changes, we employed our motion and shim corrected MEGA-SPECIAL sequence to compare
here GM/WM concentrations of GABA in anterior cingulate (ACC) and medial parietal (PAR)
cortices with reported values.
2.3.3 Gender-related effects on GABA
GABA-based evaluations of neurological conditions usually involve a mixed gender group of
healthy controls. Gender-related differences in GABA+ have, however, been demonstrated in
dorsolateral prefrontal cortex (DLPFC) and occipital cortex (OCC) (O'Gorman et al., 2011;
Sanacora et al., 1999). It is possible that these differences reflect different concentrations of MM
between males and females, rather than differences in pure GABA (Harris et al., 2014; Near et al.,
2011). Alternatively, GABA may not be stable over time in either or both genders. Therefore, the
final aim of this project was to examine gender-related differences in pure MM-suppressed GABA,
referenced to H2O and Cr, in healthy subjects in ACC and PAR.
2.4 Properties of GABA A typical 1H-MRS spectrum acquired in vivo at 3 T in a healthy adult is shown below Figure 2.1.
The x-axis depicts the chemical shift in ppm, while the area under the curve for each peak
represents the relative concentration of that metabolite.

8
Figure 2.1: 1H spectrum of the human brain acquired at 3T. Peaks correspond to N-acetyl aspartate (NAA), creatine (Cr), choline (Cho), Myo-Inositol (mI) Glutamate (Glu), Glutamine (Gln) and GABA (Hess et al., 2012).
Several brain metabolites contain 1H and thus a wide range of metabolites can be detected through 1H-MRS. Here we will focus only on the role of GABA, which is the main focus of this project.
GABA is an inhibitory neurotransmitter that has a brain concentration of approximately 1 mmol/L.
It accounts for almost half of the synaptic activity. Altered GABA concentration are associated with
the menstrual cycle (Epperson et al., 2002), alcohol and substance abuse (Behar et al., 1999), as
well as numerous neurological and psychiatric disorders, such as sleep disorders, mood and anxiety
disorders, motor disorders and panic disorders (Bigal et al., 2008; Goddard et al., 2001; Hasler et
al., 2007; Levy et al., 2005; Winkelman et al., 2008). GABA has three methylene (CH2) groups,
giving rise to three different multiplets (Figure 2.2). The GABA-C4 and GABA-C2 triplets (each
arising from two neighbouring hydrogen nuclei located on the adjacent methylene group) appear at
resonances 3.01 ppm and 2.28 ppm, respectively, while the GABA-C3 quintet (arising from 4
neighbouring hydrogen nuclei on two adjacent methylene groups) appears at 1.89 ppm (Figure 2.2).
These multiplets overlap with the resonances of other metabolites that are present in far higher
concentrations (Figure 2.1 and Table 2.1). As a result, measurement of GABA requires the use of
spectral editing techniques to observe the multiplet centred at 3.01 ppm.
NAA
Cr Cho
Cr mI Glu
Gln
GABA
9
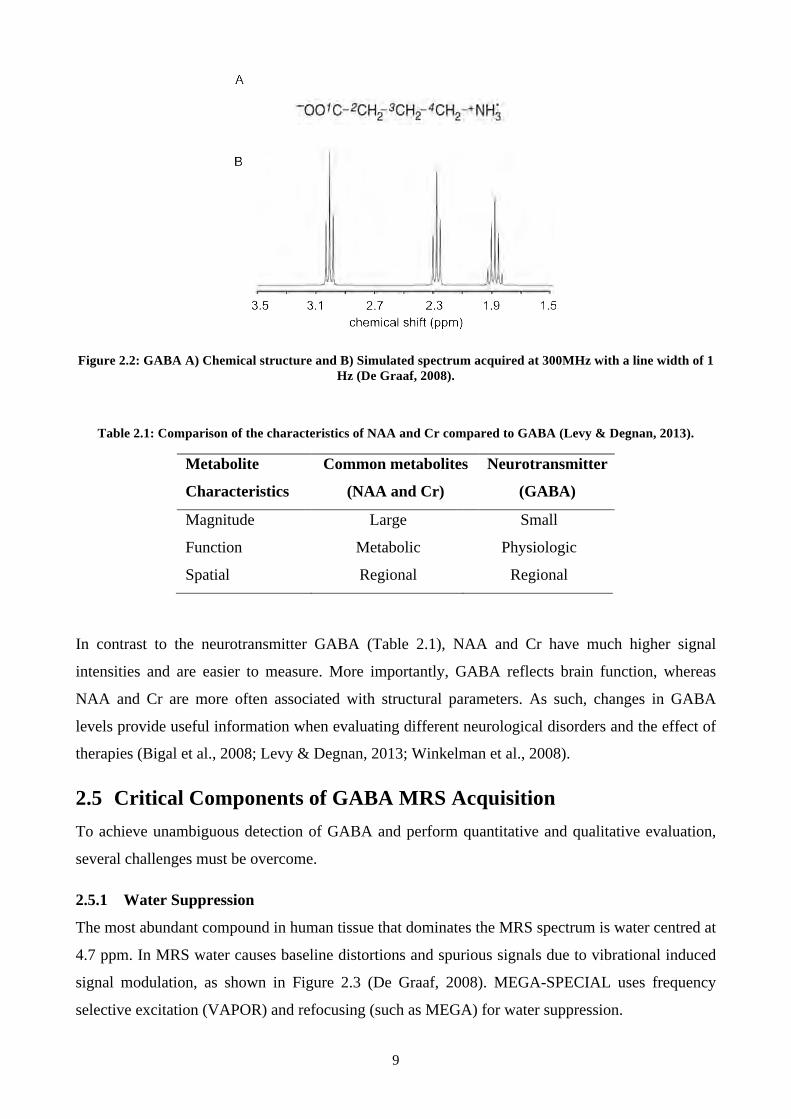
Figure 2.2: GABA A) Chemical structure and B) Simulated spectrum acquired at 300MHz with a line width of 1 Hz (De Graaf, 2008).
Table 2.1: Comparison of the characteristics of NAA and Cr compared to GABA (Levy & Degnan, 2013).
Metabolite
Characteristics
Common metabolites
(NAA and Cr)
Neurotransmitter
(GABA)
Magnitude Large Small
Function Metabolic Physiologic
Spatial Regional Regional
In contrast to the neurotransmitter GABA (Table 2.1), NAA and Cr have much higher signal
intensities and are easier to measure. More importantly, GABA reflects brain function, whereas
NAA and Cr are more often associated with structural parameters. As such, changes in GABA
levels provide useful information when evaluating different neurological disorders and the effect of
therapies (Bigal et al., 2008; Levy & Degnan, 2013; Winkelman et al., 2008).
2.5 Critical Components of GABA MRS Acquisition To achieve unambiguous detection of GABA and perform quantitative and qualitative evaluation,
several challenges must be overcome.
2.5.1 Water Suppression
The most abundant compound in human tissue that dominates the MRS spectrum is water centred at
4.7 ppm. In MRS water causes baseline distortions and spurious signals due to vibrational induced
signal modulation, as shown in Figure 2.3 (De Graaf, 2008). MEGA-SPECIAL uses frequency
selective excitation (VAPOR) and refocusing (such as MEGA) for water suppression.

10
Figure 2.3: A)Water resonance dominates 1H spectrum. B) Vibration induced sidebands of water obscure the metabolite resonances. C) Eradication of water resonance results in a 1H MRS spectrum devoid of artefact,
permitting reliable detection and quantification of metabolites (De Graaf, 2008).
2.5.2 Variable Pulse Power and Optimized Relaxation Delays (VAPOR)
Tkáć et al. developed a highly efficient water suppression method called VAPOR that utilizes seven
chemical shift selective (CHESS) pulses applied at fixed time intervals followed by crusher
gradients interleaved with outer volume saturation modules (Tkáć et al., 1999). The amplitudes of
three of the CHESS pulses are 1.78 times greater than the other pulses (Figure 2.4) (Tkáć et al.,
1999). Similar to CHESS, VAPOR is applied before localisation. The major advantage of VAPOR
is that it is insensitive to variations in the T1 of water (1 to 2 s) and can be used with a large range of
flip angles (65o-125o, Figure 2.4). Signals outside the chemical shift region of 4.65±0.5 ppm are not
affected by this scheme.

11
Figure 2.4: Seven CHESS elements with optimized flip angles applied at different times. Evolution of the water Mz for three different RF flip angles (β=65o, 95o and 125o). A water T1=1.5 ms was used in the calculation (Tkáć
et al., 1999).
Furthermore, VAPOR can be applied in clinical scanners without the need for careful RF power
adjustment, due to lower sensitivity to applied RF power. This can considerably increase the quality
and reliability of clinical MRS (Near et al., 2013; Near et al., 2011; Tkáć et al., 1999).
2.5.3 Mescher Garwood (MEGA) editing
MEGA water suppression is applied after excitation using combinations of RF pulses and magnetic
field gradients. Figure 2.5 shows that two frequency selective (s) 180°s pulses (at the water
frequency) are applied before and after the broadband non-selective (ns) 180°ns pulse, each flanked
by gradients applied on two different axes (G1 and G2). These gradient pairs before and after the
non-selective inversion pulse will refocus spins that were unaffected by the selective inversion
pulses, while spins (e.g. water 1H) inverted by the selective inversion pulses will be dephased. The
third gradient (G3) is applied along a different direction and is placed symmetrically on each side of
the 180ons pulse which generates the primary Hahn spin echo (Mescher et al., 1996). The major
advantages of this method are (1) better tolerance to flip angle errors of the frequency selective
pulses relative to other suppression techniques such as WATERGATE (Figure 2.6), (2) no phase
distortion of peaks outside the water resonance, (3) avoidance of inter-conversions between Mz and
Mxy, and (4) it is easy to implement since identical 180°s pulses are used (Mescher et al., 1998;
Mescher et al., 1996). The only drawback of this technique is that the minimum TE is prolonged,
though this does not hinder longer TE acquisitions, such as spectral editing techniques (e.g. TE= 68
ms for GABA). This method is most commonly used in conjunction with the PRESS sequence,
known as MEGA-PRESS, for efficient suppression of water and detection of GABA (Mescher et

12
al., 1998; Mullins et al., 2012). Recently, this technique has been incorporated in the MEGA-
SPECIAL sequence, which will be discussed later (Near et al., 2011).
Figure 2.5: MEGA pulse sequence diagram illustrating RF pulses and gradient waveforms (Mescher et al., 1996).
Figure 2.6: MEGA has higher tolerance to errors in the flip angles of the selective pulses (αs) compared to the WATERGATE water suppression technique(Mescher et al., 1996).
2.6 Spatial Localisation The two most widely used sequences for GABA MRS are MEGA-PRESS and MEGA-SPECIAL.
These sequences use different methods for spatial localisation as described below.
2.6.1 Point Resolved Spectroscopy (PRESS)
The PRESS sequence (Bottomley, 1987) employs the most popular single volume localisation
method in spectroscopy. Compared with the Stimulated Echo Acquisition Mode (STEAM), PRESS
ensures better metabolite signal to noise ratio (SNR). The PRESS sequence is a double spin echo
method, in which a 90°slice-selective pulse is combined with two slice-selective refocusing pulses
(De Graaf, 2008). The slice-selective gradients are applied in three mutually orthogonal directions
to achieve spatial localisation.
13
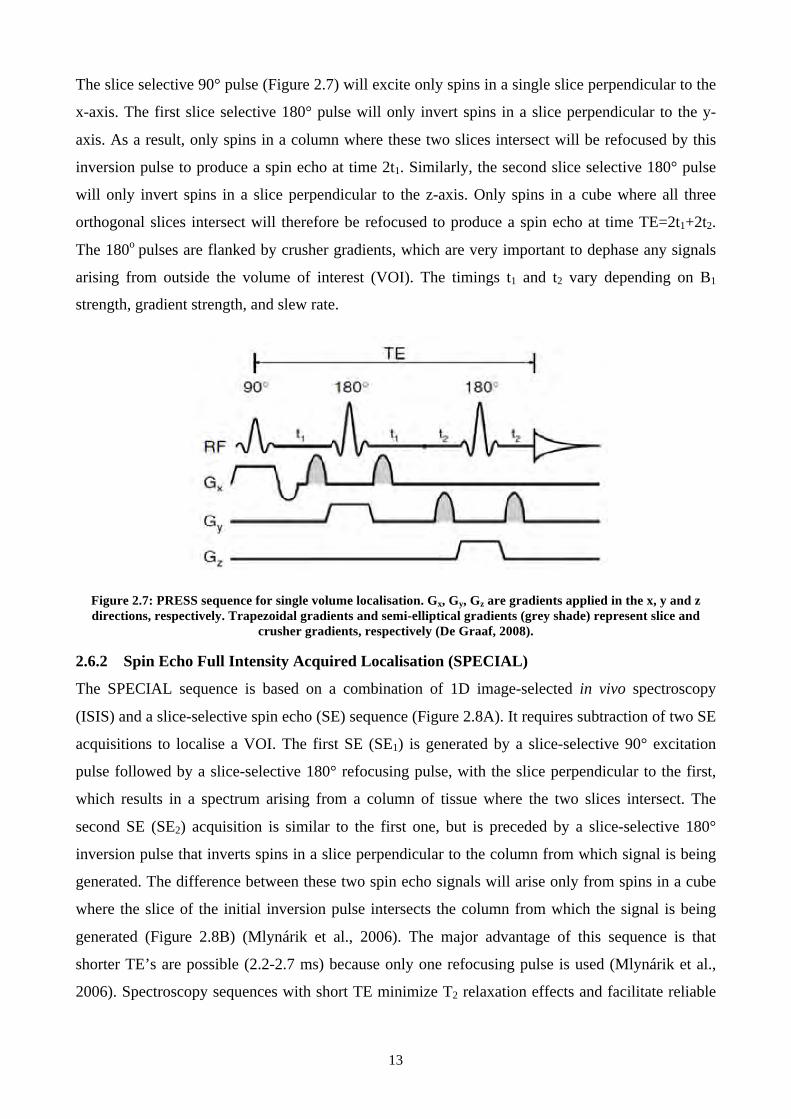
The slice selective 90° pulse (Figure 2.7) will excite only spins in a single slice perpendicular to the
x-axis. The first slice selective 180° pulse will only invert spins in a slice perpendicular to the y-
axis. As a result, only spins in a column where these two slices intersect will be refocused by this
inversion pulse to produce a spin echo at time 2t1. Similarly, the second slice selective 180° pulse
will only invert spins in a slice perpendicular to the z-axis. Only spins in a cube where all three
orthogonal slices intersect will therefore be refocused to produce a spin echo at time TE=2t1+2t2.
The 180o pulses are flanked by crusher gradients, which are very important to dephase any signals
arising from outside the volume of interest (VOI). The timings t1 and t2 vary depending on B1
strength, gradient strength, and slew rate.
Figure 2.7: PRESS sequence for single volume localisation. Gx, Gy, Gz are gradients applied in the x, y and z directions, respectively. Trapezoidal gradients and semi-elliptical gradients (grey shade) represent slice and
crusher gradients, respectively (De Graaf, 2008).
2.6.2 Spin Echo Full Intensity Acquired Localisation (SPECIAL)
The SPECIAL sequence is based on a combination of 1D image-selected in vivo spectroscopy
(ISIS) and a slice-selective spin echo (SE) sequence (Figure 2.8A). It requires subtraction of two SE
acquisitions to localise a VOI. The first SE (SE1) is generated by a slice-selective 90° excitation
pulse followed by a slice-selective 180° refocusing pulse, with the slice perpendicular to the first,
which results in a spectrum arising from a column of tissue where the two slices intersect. The
second SE (SE2) acquisition is similar to the first one, but is preceded by a slice-selective 180°
inversion pulse that inverts spins in a slice perpendicular to the column from which signal is being
generated. The difference between these two spin echo signals will arise only from spins in a cube
where the slice of the initial inversion pulse intersects the column from which the signal is being
generated (Figure 2.8B) (Mlynárik et al., 2006). The major advantage of this sequence is that
shorter TE’s are possible (2.2-2.7 ms) because only one refocusing pulse is used (Mlynárik et al.,
2006). Spectroscopy sequences with short TE minimize T2 relaxation effects and facilitate reliable

14
detection and quantification of many crucial metabolites such as Glu, Gln as well as Glucose (Glc)
(Michaelis et al., 1993; Tkáć et al., 1999).
Figure 2.8: SPECIAL localization sequence. A) 180o (on, off) used for inverting spins perpendicular to the original column of tissue. It was added in even scans 180o (on) and removed in odd scans 180o (off). B)
Subtraction of two SEs result in signal originating from a voxel. WS is an additional water suppression pulse (Mlynárik et al., 2006).
2.7 Spectral Editing The 1H-MRS spectrum contains several metabolites (Figure 2.1) in a small chemical shift range
leading to considerable spectral overlap, impeding spectral peak assignment and quantification. The
most noticeable examples are lactate and GABA. Lactate overlaps with lipids and macromolecules
(R. A. Edden et al., 2006), while GABA overlaps with macromolecules, total Cr, NAA and other
resonances (Henry et al., 2001). The technique implemented to separate metabolites is called
spectral editing. Spectral editing utilizes scalar coupling between spins to separate scalar coupled
and uncoupled spins. The information presented below is primarily from (De Graaf, 2008;
Govindaraju et al., 2000).

15
2.7.1 Scalar Coupling Evolution
As shown previously, the splitting of resonances into multiplets can be observed at high resolution.
This phenomenon is called scalar coupling or J-coupling. For a simple two-spin (I and S) system,
the scalar coupling evolution (θ, Figure 2.9) is given by:
𝜃 = 𝜋𝐽!"×𝜏
where JIS is the coupling constant for the two-spin spin system and τ is the time. For example, if
τ=0, θ=0. If τ=1/(2JIS), θ=90°.
Figure 2.9: Spins undergo scalar evolution, θ, following a 90 degree pulse.
This can be illustrated using a J modulated spin echo experiment (Figure 2.10A). This spin system
is characterized by a doublet with frequencies νI- JIS/2 and νI+ JIS/2, resulting from the coupling of I
spins with S spins in the lower energy (α) and higher energy (β) spin states, respectively.
Figure 2.10B illustrates the scalar evolution using vector diagrams. Briefly, following excitation,
the I spins acquire a TE dependent phase shift θ due to scalar coupling evolution. However,
dephasing resulting from magnetic field inhomogeneity and chemical shift is refocussed by the
180° pulse. The non-selective 180°pulse has two major effects on the coherences under
investigation: (1) the pulse inverts the phase evolution of the I spins from π(νI± JIS/2) to -π(νI±
JIS/2), and (2) inverts the S spin population, such that I spins attached to S spins in the α state and
resonating at the lower frequency (νI- JIS/2) are attached to spins in the β state and accordingly
resonate at the higher frequency (νI + JIS/2) after the 180° pulse. At TE = 1/2JIS, the transverse
magnetization is in a state of complete antiphase coherence(θ=90°), while at TE = 1/JIS it is in a
state of complete in-phase coherence (θ=180°) but inverted relative to TE=0 (Figure 2.10C).

16
Figure 2.10: Scalar coupling evolutions of the doublet spin system during the spin echo sequence. A) Basic spin echo sequence. B) Acquired TE dependent phase shift of the I spin population. The 180o refocusing pulse inverts the acquired phase and inverts the S spin population. C) Transverse coherences and corresponding MRS spectra
of I spins as a function of TE (De Graaf, 2008).
2.7.2 J-Difference Editing
The above spin echo sequence forms the basis for J-difference spectral editing. In the above
example (Figure 2.10) a non-selective 180° pulse was used and resulted in a simple spin echo
signal. For J-difference editing sequences both non-selective and selective 180° pulses are used
(Figure 2.11A).
Following the 90° excitation pulse, I spins acquire a TE dependent phase shift θ due to scalar
coupling evolution. A selective 180° (180°s) pulse inverts the S spins, which reverses the direction
of rotation of the scalar coupling evolution of the I spins (Figure 2.11B). This means that I spins
attached to S spins in the α state and resonating at the lower frequency are attached to S spins in the
β state and accordingly resonate at the higher frequency after the 180°s pulse.
The non-selective pulse only refocuses phase evolution that arises from chemical shift and magnetic
field inhomogeneity. During the third delay, scalar coupling evolution occurs which will be
refocused by a second 180°s.

17
Figure 2.11: A) Basic J-difference editing sequence with both selective and non-selective180o rf pulses. B) I spin population acquired TE dependent phase shift. The 180o
srefocusing pulse only inverts the S spins causing the direction of rotation to be reversed(De Graaf, 2008).
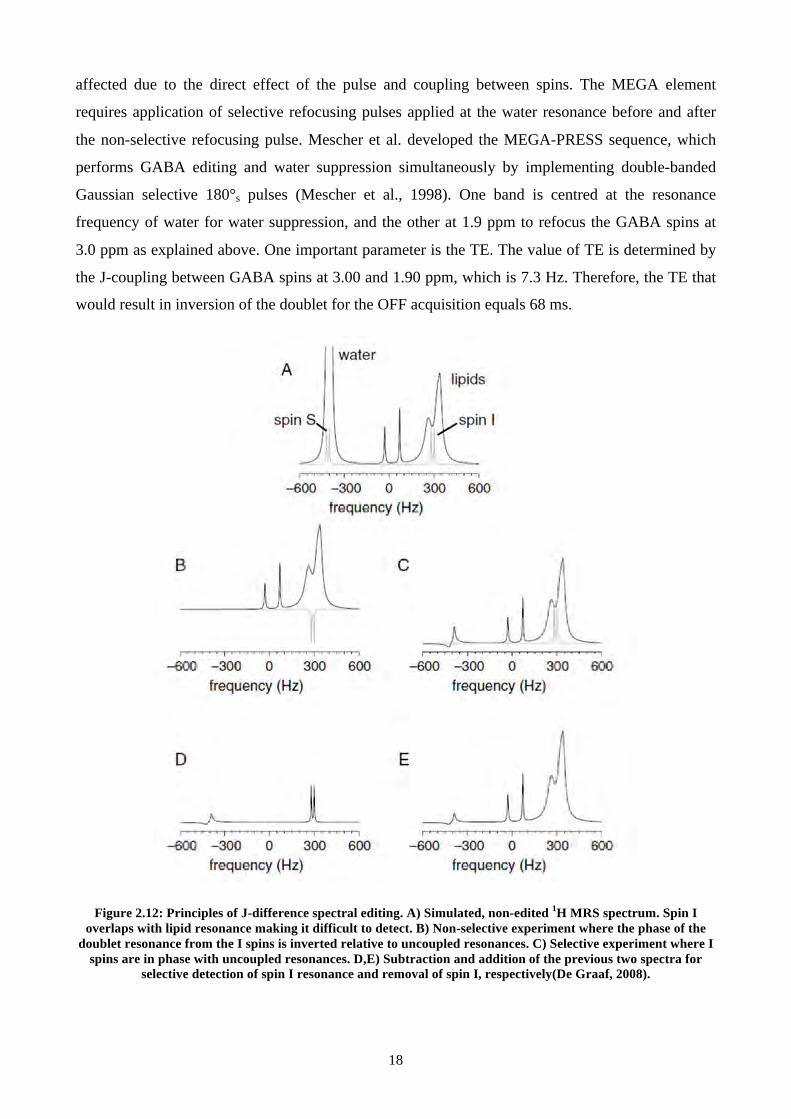
Water and Cr resonances do not exhibit scalar coupling and thus acquire the same phase in the
presence or absence of the 180°s pulses (Figure 2.12A). In the experiment without the slice selective
inversion pulses (Figure 2.10), the phase of the doublet resonance corresponding to the I spins is
inverted for TE=1/JIS relative to the uncoupled spins (Figure 2.12B). In contrast, the I spin doublet
will have the same phase as the uncoupled spins in the experiment with the slice selective inversion
pulses (Figure 2.12C). Subtraction of the two spectra will result in cancellation of signal from the
uncoupled spins and selective detection of resonances from the coupled spins (I spins) (Figure
2.12D), while addition will result in elimination of signal from I spins (Figure 2.12E).
Several sequences use the principles of J-difference editing to detect GABA in the human brain
(Mescher et al., 1998; Near et al., 2011; Puts & Edden, 2012; Zhu et al., 2011), of which the two
primary ones are described below.
2.7.2.1 Mescher -‐Garwood Point Resolved Spectroscopy (MEGA-‐PRESS) The MEGA-PRESS sequence comprises PRESS localisation and MEGA elements for water
suppression (Figure 2.13). It is the sequence most commonly used to measure brain concentrations
of the inhibitory neurotransmitter GABA. It employs the J-difference editing technique and
subtraction of two spectra. For the first (ON), selective frequency pulses are applied to GABA spins
at 1.9 ppm, which also affects GABA spins at 3 ppm due to J-coupling between them. In the
second non-selective dataset (OFF), non-selective refocusing pulses are applied allowing J-coupling
evolution throughout the echo time. The difference between the two datasets will result in a
spectrum in which GABA can be detected. Other signals close to and remote from 1.9 ppm are
18
affected due to the direct effect of the pulse and coupling between spins. The MEGA element
requires application of selective refocusing pulses applied at the water resonance before and after
the non-selective refocusing pulse. Mescher et al. developed the MEGA-PRESS sequence, which
performs GABA editing and water suppression simultaneously by implementing double-banded
Gaussian selective 180°s pulses (Mescher et al., 1998). One band is centred at the resonance
frequency of water for water suppression, and the other at 1.9 ppm to refocus the GABA spins at
3.0 ppm as explained above. One important parameter is the TE. The value of TE is determined by
the J-coupling between GABA spins at 3.00 and 1.90 ppm, which is 7.3 Hz. Therefore, the TE that
would result in inversion of the doublet for the OFF acquisition equals 68 ms.
Figure 2.12: Principles of J-difference spectral editing. A) Simulated, non-edited 1H MRS spectrum. Spin I overlaps with lipid resonance making it difficult to detect. B) Non-selective experiment where the phase of the
doublet resonance from the I spins is inverted relative to uncoupled resonances. C) Selective experiment where I spins are in phase with uncoupled resonances. D,E) Subtraction and addition of the previous two spectra for
selective detection of spin I resonance and removal of spin I, respectively(De Graaf, 2008).

19
Figure 2.13: MEGA-PRESS sequence. Double banded Gaussian 180ospulses are used for GABA editing and to
suppress water signals. 180os are flanked by gradients (G1 and G2) used to dephase water spins.TE =68 ms for
GABA MRS(Mescher et al., 1998).
The MEGA-PRESS sequence has two major drawbacks that can hinder accurate quantitative
measurements of GABA. The first drawback is the coediting of macromolecules (MM), which
considerably contaminates the edited GABA signal (Rothman et al., 1993). The coedited MM
signals appear at 3.0 ppm, which is coupled with the MM at 1.7 ppm, which is close to the GABA-
C3 resonance at 1.9 ppm where the spectral editing pulse is applied. Several methods have been
developed to avoid contamination of GABA signals. The Henry method involves using selective
pulses in both the ON and OFF acquisitions (Henry et al., 2001). In the first acquisition (ON) the
selective pulse is applied at the GABA resonance (1.9 ppm), while in the second (OFF) acquisition
it is applied at 1.5 ppm, i.e. positioned symmetrically around the MM resonance at 1.7 ppm. The
MM peak will be affected equally in both acquisitions so that the subtraction will result in a pure
GABA signal devoid of MM. This method has previously successfully been applied at 7T and is
highly favoured because it does not require additional scans and is not sensitive to changes in T1 of
MM or metabolites (Terpstra et al., 2002). Also, accuracy is increased by up to a factor of 2 (Henry
et al., 2001). However, due to narrow spectral dispersion at 3T, the editing pulse exhibits reduced
spectral selectivity, rendering it very challenging to implement the Henry method.
The second drawback is chemical shift displacement of slice-selective localisation pulses in the
PRESS sequence that causes the scalar evolution of the GABA-C4 multiplet to be highly spatially
dependent (Figure 2.14) (R. A. Edden & Barker, 2007). This results in substantial loss of the
GABA signal (see regions II and IV in Figure 2.14C) due to reduced spectral editing efficiency and
inaccurate GABA quantification.

20
Figure 2.14: Regional modulation patterns of GABA signal in the voxel (80 x 80 mm). A) Editing pulses on. B) Editing pulses off. C) The difference between A and B. I, II, III, IV are subdivisions of the voxel illustrating
variation of GABA signal due to spatial variation of scalar coupling. Subdivisions II and IV show total loss of GABA signal (R. A. Edden & Barker, 2007).
2.7.2.2 Mescher-‐Garwood Spin Echo Full Intensity Acquired Localized (MEGA-‐SPECIAL) MEGA-SPECIAL uses SPECIAL localisation and MEGA elements for detection and measurement
of GABA. Near et al. developed this sequence which comprises much longer and more frequency
selective editing pulses than MEGA-PRESS, thus permitting the use of Henry’s method to remove
MM contamination when sufficiently narrow bandwidth editing pulses could not otherwise be
achieved (Near et al., 2011).
As explained above, Henry’s method requires application of editing pulses at resonances of 1.9
ppm (ON) (GABA-C3) and 1.5 ppm (OFF), respectively. The difference between the resonances is
approximately 51 Hz at 3T. The OFF acquisition should not affect the GABA-C3 resonance; thus
the spins at 51 Hz from the centre of the editing band should experience less than 1% inversion.
Therefore, the editing pulse should have a Half Width 1% Maximum (HW1%M) of less than 51 Hz.
21
In MEGA-PRESS, the two slice refocusing pulses must be applied within the TE of 68 ms.
Consequently, the approximate duration of each editing pulse is limited to between 14 and 20 ms
(R. A. Edden & Barker, 2007; Mescher et al., 1998). Such short durations result in very broad
bandwidths with HW1%M of 88 Hz and 61 Hz, respectively, assuming a time-bandwidth product
of 1.128, which fails to satisfy the aforementioned HW1%M requirement for application of Henry’s
method (Near et al., 2011).
However, the MEGA-SPECIAL sequence has only one slice refocusing pulse within the TE of 68
ms, allowing longer editing pulses to be implemented in the sequence. The duration of the editing
pulses in the sequence is about 26 ms, resulting in much narrower inversion profiles with HW1%M
of 47 Hz, which fulfils the spectral selectivity requirement. Thus MEGA-SPECIAL is compatible
with Henry’s method.
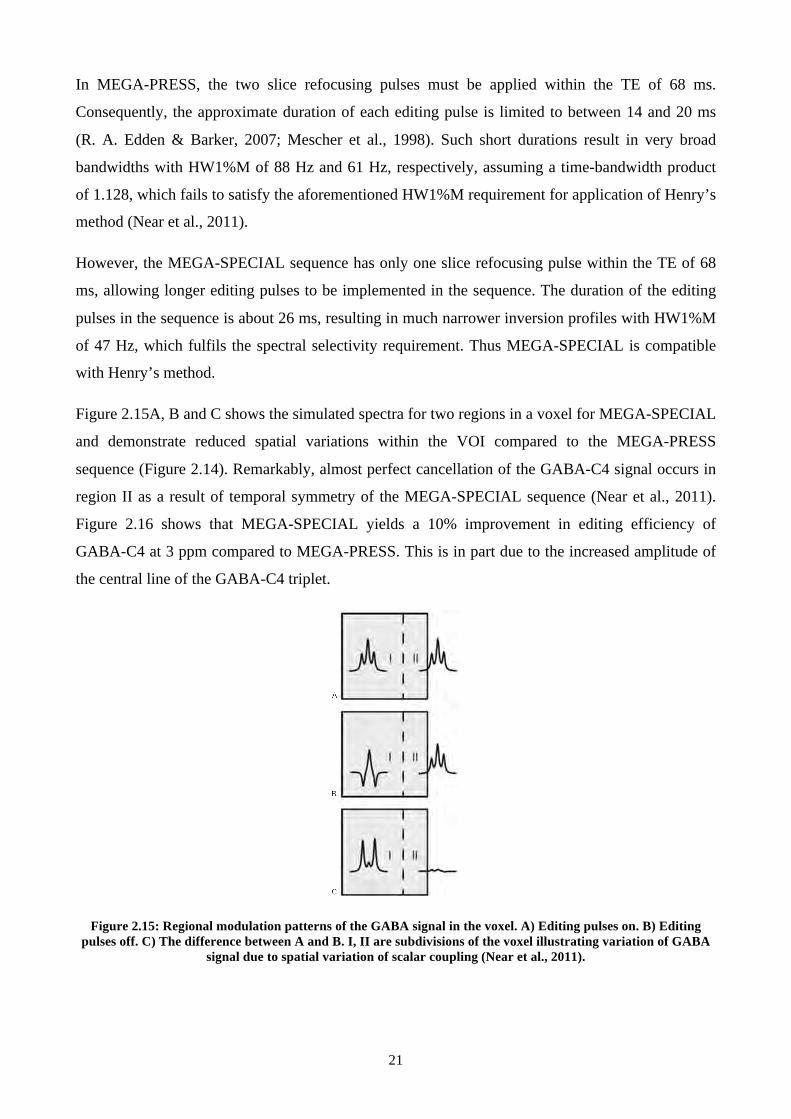
Figure 2.15A, B and C shows the simulated spectra for two regions in a voxel for MEGA-SPECIAL
and demonstrate reduced spatial variations within the VOI compared to the MEGA-PRESS
sequence (Figure 2.14). Remarkably, almost perfect cancellation of the GABA-C4 signal occurs in
region II as a result of temporal symmetry of the MEGA-SPECIAL sequence (Near et al., 2011).
Figure 2.16 shows that MEGA-SPECIAL yields a 10% improvement in editing efficiency of
GABA-C4 at 3 ppm compared to MEGA-PRESS. This is in part due to the increased amplitude of
the central line of the GABA-C4 triplet.
Figure 2.15: Regional modulation patterns of the GABA signal in the voxel. A) Editing pulses on. B) Editing pulses off. C) The difference between A and B. I, II are subdivisions of the voxel illustrating variation of GABA
signal due to spatial variation of scalar coupling (Near et al., 2011).

22
Figure 2.16: Integration of the area under the curves indicates that MEGA-SPECIAL yields 10% improvement in editing efficiency over MEGA-PRESS (Near et al., 2011).

23
Chapter 3 Volumetric navigated MEGA-SPECIAL
for real-time motion and shim corrected GABA editing1 Muhammad G. Saleh2, A. Alhamud2, Jamie Near3, André J.W. van der Kouwe4, and Ernesta M.
Meintjes2
3.1 ABSTRACT MEGA-editing with SPECIAL localization (MSpc) is a technique to acquire γ-aminobutyric acid
(GABA) without macromolecule (MM) contamination at TE of 68 ms. However, due to the
requirement of multiple shot-localization, it is often susceptible to subject motion and B0
inhomogeneity. A method is presented for real-time motion and shim correction (ShMoCo) using
volumetric navigators to correct for motion and motion-related B0 inhomogeneity during MSpc
acquisition. A phantom experiment demonstrates that ShMoCo restores the GABA peak and
improves spectral quality in the presence of motion, zero- and first-order shim changes. The
ShMoCo scans were validated in 3 subjects who performed up-down and left-right head rotations.
Qualitative assessment of these scans indicates effective reduction of subtraction artefacts and well
edited GABA peaks, while quantitative analysis indicates superior fitting and spectral quality
relative to scans with no correction.
3.2 INTRODUCTION γ-aminobutyric acid (GABA) is the primary inhibitory neurotransmitter in the brain and accounts
for almost half of the synaptic activity (Govindaraju et al., 2000). Altered concentrations of GABA
have been linked to several neurological conditions (Levy & Degnan, 2013). In vivo measurements
of GABA are acquired through the spectral editing methods, which enable separation of C4-GABA
with overlapping resonances of creatine (Cr) and Phosphocreatine (PCr). MEGA-SPECIAL (MSpc)
is a magnetic resonance spectroscopy (MRS) sequence comprising longer frequency selective
editing pulses, allowing GABA acquisition without macromolecule (MM) at TE of 68 ms (Near et
al., 2011). Unlike the MEGA-PRESS (Mescher et al., 1998), MEGA-LASER (Bogner et al., 2014)
and MEGA-sLASER (Andreychenko et al., 2012) sequences, MSpc requires four acquisitions per
1 Published in NMR in Biomedicine and reproduced with the permission from John Wiley & Sons Ltd 2 University of Cape Town 3 McGill University 4 Massachusetts General Hospital, Harvard Medical School

24
localized edited spectrum, rendering it more sensitive to subject motion and magnetic field (B0)
inhomogeneity.
Subject motion can cause data to be acquired from an unintended volume of interest (VOI) and
induce B0 inhomogeneity leading to spectral distortion, thus adversely affecting the already tiny
GABA signal (Harris et al., 2013; Zhu et al., 2011). Currently, motion and artefact corrections in
GABA MRS data are based on retrospective corrections (Near et al., 2015; Waddell et al., 2007),
and prospective corrections using water-based navigators (Bhattacharyya et al., 2007; Zhu et al.,
2011). However, the prospective techniques are only able to correct for the change in
B0inhomogeneity.
Prospective correction has been implemented previously by Zaitsev et al. (Zaitsev et al., 2010)
using an optical system for prospective motion correction and interleaved navigator for
retrospective frequency correction. Although this technique provides efficient motion tracking and
correction, the MM-suppression technique is highly dependent on B0 field stability, necessitating
real-time frequency updates to ensure frequency selective pulses are applied symmetrically about
1.7 ppm (Near et al., 2011). Keating et al. (Keating & Ernst, 2012) implemented PROMO and real-
time linear shim terms correction using interleaved navigator echoes. This technique mitigated
spectral distortions and maintained spectral quality in the presence of large motion. To our
knowledge, this technique has not been implemented in J-editing single voxel spectroscopy (SVS)
sequences.
There are several navigator-based motion tracking techniques that employ k-space properties of
rigid body transformations to subsample k-space in a time efficient manner (Fu et al., 1995; van der
Kouwe et al., 2006; Welch et al., 2002). GABA MRS is well suited to an imaging navigator
because of its long repetition times (typically 2.5-3.5 s) (Andreychenko et al., 2012) and absence of
intrinsically acquired structural images. Most of the repetition time is spent waiting for signal
relaxation, and this time is available for navigator acquisitions at no cost to total acquisition time.
This has been demonstrated by Hess et al. (Hess et al., 2011) who implemented volume navigators
in the SVS point resolved spectroscopy (PRESS) sequence to correct in real-time for both VOI
changes arising from motion and zero- to first-order B0 inhomogeneity.
To date no real-time motion and shim correction (ShMoCo) has been incorporated into the J-editing
SVS MSpc sequence for MM-suppressed GABA acquisition. Therefore, the purpose of this work
was to incorporate the echo planar imaging (EPI) volume navigator into the J-editing SVS MSpc
sequence to correct in real-time VOI changes, zero- and first-order B0 inhomogeneity arising from
25
motion. Phantom and in vivo scans were performed to demonstrate that the vNav affects the signal
minimally and maintains spectral quality in the presence of motion.
3.3 METHODS All protocols and experiments were approved by the Human Research Ethics Committee of the
Faculty of Health Sciences at the University of Cape Town and written informed consent was
obtained from all subjects. All MRI/MRS experiments were performed on a Siemens Allegra 3 T
scanner (Erlangen, Germany) using a single channel transmit/receive (T/R) volumetric coil.
3.3.1 MEGA-SPECIAL sequence
The MM-suppressed MSpc sequence was used for editing C4-GABA without MM contamination
(Near et al., 2011). Briefly, the sequence consists of two iterations: In the first MEGA-editing
iteration the editing-band is applied to the C3-GABAresonance at 1.9 ppm (edit-on), while in the
second iteration the editing-band is applied at 1.5 ppm (edit-off). The water suppression band of the
dual-banded editing pulses was always applied at 4.7 ppm.
One complete cycle of the MSpc sequence consists of four acquisitions: A) inversion-on, edit-on B)
inversion-off, edit-on C) inversion-on, edit-off D) inversion-off, edit-off. Therefore, the final
GABA spectrum is obtained by subtracting the acquisitions: GABA= A – B – (C – D). Prior to
excitation, outer volume suppression (OVS) and VAPOR water suppression (Tkáć et al., 1999)
pulses are applied to saturate spins outside the VOI and to improve water suppression.
3.3.2 Motion and Shim correction in the MEGA-SPECIAL sequence
To measure and correct simultaneously in real-time for head position and magnetic field
inhomogeneity (shimming), two volume navigators (vNavs) with different echo times were inserted
in the recovery time of each TR of the standard MSpc sequence. The vNav protocol was as follows:
3D encoded EPI, 32 x 32 x 28, flip angle 2°, TR 16 ms, TE 6.6/9 ms (ΔTE 2.4 ms for fat in-phase at
3 T). The two echoes were interleaved to minimize the effect of motion on the field map during the
total navigator time of 928 ms.
Following the acquisition of the vNav, motion estimation was performed using Prospective
Acquisition Correction (PACE) (Thesen et al., 2000), where magnitude images of the first navigator
were used as reference for subsequent vNavs. The estimated motion parameters were applied to the
MSpc to track subject motion in real time. A field map was reconstructed from the phase difference
images of each pair of navigators with different TEs. The field map was masked using the navigator
magnitudes images and the phase was unwrapped using PRELUDE (Jenkinson, 2003). The VOI for
the MEGA-SPECIAL acquisition is smaller than the VOI for the navigator, which has to cover the

26
whole brain for accurate motion tracking. Multiple regression was applied to estimate shim
parameters separately for the MEGA-SPECIAL VOI and the navigator VOI.
The real-time shim estimates were applied each TR starting after the first preparation scan, while
the pose estimates were calculated and applied from the second TR to allow the shim to stabilize.
These estimates were applied synchronously and immediately after the vNav block (but before the
water suppression pulses) to all gradients and RF pulses, including the localization, MEGA-editing,
OVS and VAPOR pulses.
3.3.3 In vitro validation
3.3.3.1 Phantom preparation A spherical phantom with an inner cube (length 5 cm) aligned with the magnet isocentre was used
to assess spectral quality in the presence of motion and shim changes. The fluid in the outer portion
of the phantom (blue square, Figure 3.1) consisted of an aqueous solution of GABA, creatine (Cr),
N-acetylaspartate (NAA) and Glutamate (Glu) in equal concentrations of 10 mM, and adjusted to
pH 7.2. Similarly, the inner cube (red square, Figure 3.1) contained the same metabolites but
without Glu.
Figure 3.1: Axial image of the spherical phantom with an inner cube at the centre of the phantom used for testing performance of the vNav during motion. Red (inside the cube) and blue squares represent voxel
localization and their corresponding spectra. The spectrum from the outside of the cube depicts presence of Glu at 3.75 ppm. The spectra were apodized using 5 Hz Lorentzian filter.
3.3.3.2 In vitro acquisition In vitro GABA edited spectra were acquired with standard MSpc (reference) and vNavMSpc
sequences from a voxel positioned in the cube. The vNavMSpc sequence included feedback from
vNav for shim and motion correction (ShMoCo), and without feedback for no correction (NoCo).
Acquisitions were performed for each of the following conditions: A) static with no manual
frequency or shim offsets, B) frequency (zero-order) offset by 15 Hz, C) first-order linear shim
offset by 10 µT/m, D) zero- and first-order shims offset by 15 Hz and 10 µT/m, respectively, and E)
a scan with intentional motion and optimal shim values.
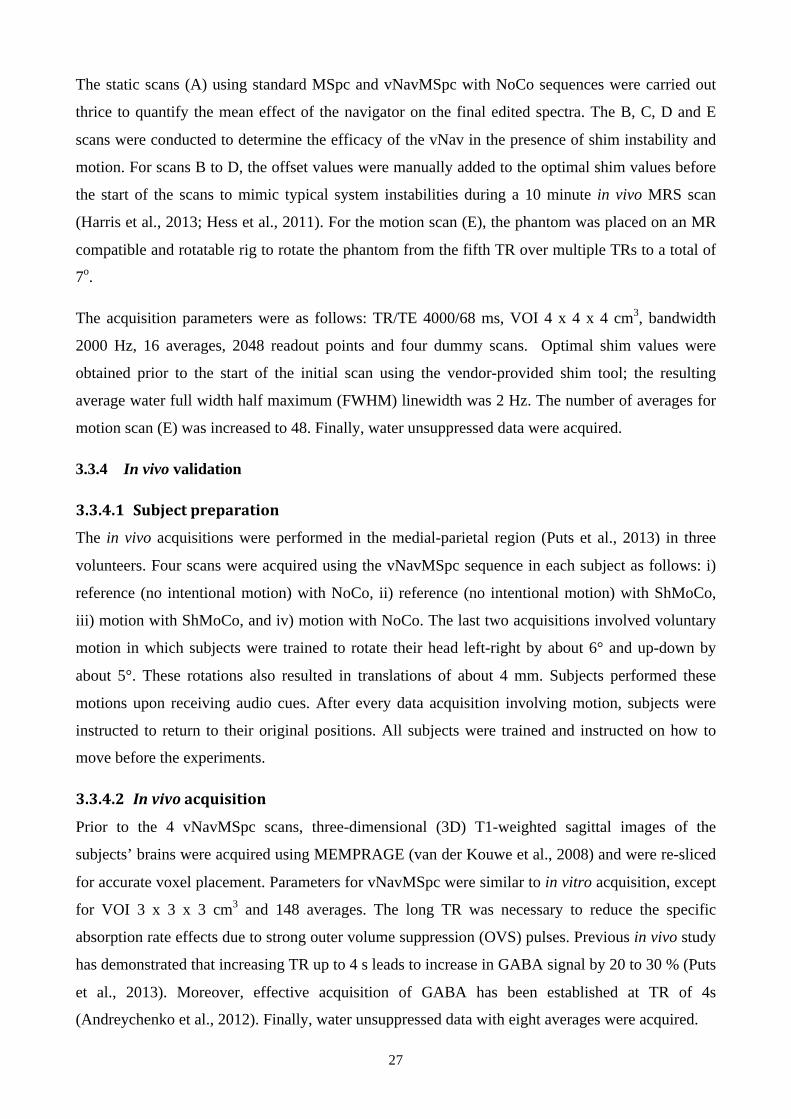
27
The static scans (A) using standard MSpc and vNavMSpc with NoCo sequences were carried out
thrice to quantify the mean effect of the navigator on the final edited spectra. The B, C, D and E
scans were conducted to determine the efficacy of the vNav in the presence of shim instability and
motion. For scans B to D, the offset values were manually added to the optimal shim values before
the start of the scans to mimic typical system instabilities during a 10 minute in vivo MRS scan
(Harris et al., 2013; Hess et al., 2011). For the motion scan (E), the phantom was placed on an MR
compatible and rotatable rig to rotate the phantom from the fifth TR over multiple TRs to a total of
7o.
The acquisition parameters were as follows: TR/TE 4000/68 ms, VOI 4 x 4 x 4 cm3, bandwidth
2000 Hz, 16 averages, 2048 readout points and four dummy scans. Optimal shim values were
obtained prior to the start of the initial scan using the vendor-provided shim tool; the resulting
average water full width half maximum (FWHM) linewidth was 2 Hz. The number of averages for
motion scan (E) was increased to 48. Finally, water unsuppressed data were acquired.
3.3.4 In vivo validation
3.3.4.1 Subject preparation The in vivo acquisitions were performed in the medial-parietal region (Puts et al., 2013) in three
volunteers. Four scans were acquired using the vNavMSpc sequence in each subject as follows: i)
reference (no intentional motion) with NoCo, ii) reference (no intentional motion) with ShMoCo,
iii) motion with ShMoCo, and iv) motion with NoCo. The last two acquisitions involved voluntary
motion in which subjects were trained to rotate their head left-right by about 6° and up-down by
about 5°. These rotations also resulted in translations of about 4 mm. Subjects performed these
motions upon receiving audio cues. After every data acquisition involving motion, subjects were
instructed to return to their original positions. All subjects were trained and instructed on how to
move before the experiments.
3.3.4.2 In vivo acquisition Prior to the 4 vNavMSpc scans, three-dimensional (3D) T1-weighted sagittal images of the
subjects’ brains were acquired using MEMPRAGE (van der Kouwe et al., 2008) and were re-sliced
for accurate voxel placement. Parameters for vNavMSpc were similar to in vitro acquisition, except
for VOI 3 x 3 x 3 cm3 and 148 averages. The long TR was necessary to reduce the specific
absorption rate effects due to strong outer volume suppression (OVS) pulses. Previous in vivo study
has demonstrated that increasing TR up to 4 s leads to increase in GABA signal by 20 to 30 % (Puts
et al., 2013). Moreover, effective acquisition of GABA has been established at TR of 4s
(Andreychenko et al., 2012). Finally, water unsuppressed data with eight averages were acquired.
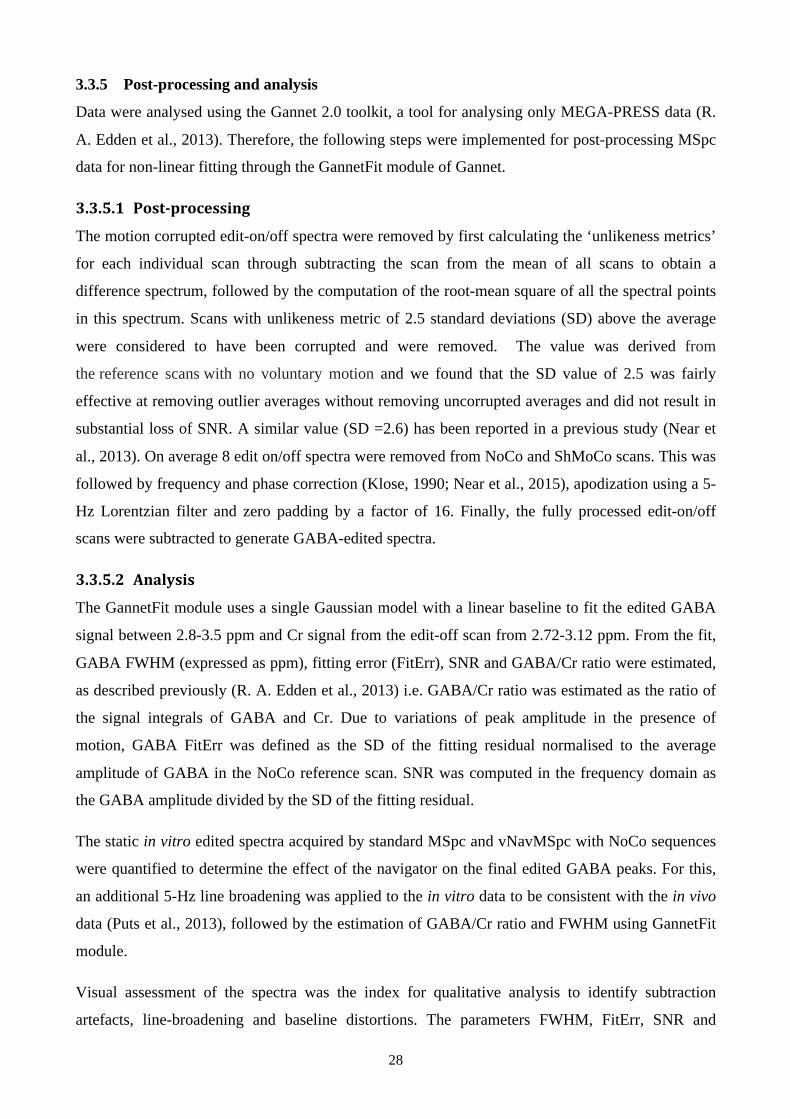
28
3.3.5 Post-processing and analysis
Data were analysed using the Gannet 2.0 toolkit, a tool for analysing only MEGA-PRESS data (R.
A. Edden et al., 2013). Therefore, the following steps were implemented for post-processing MSpc
data for non-linear fitting through the GannetFit module of Gannet.
3.3.5.1 Post-‐processing The motion corrupted edit-on/off spectra were removed by first calculating the ‘unlikeness metrics’
for each individual scan through subtracting the scan from the mean of all scans to obtain a
difference spectrum, followed by the computation of the root-mean square of all the spectral points
in this spectrum. Scans with unlikeness metric of 2.5 standard deviations (SD) above the average
were considered to have been corrupted and were removed. The value was derived from
the reference scans with no voluntary motion and we found that the SD value of 2.5 was fairly
effective at removing outlier averages without removing uncorrupted averages and did not result in
substantial loss of SNR. A similar value (SD =2.6) has been reported in a previous study (Near et
al., 2013). On average 8 edit on/off spectra were removed from NoCo and ShMoCo scans. This was
followed by frequency and phase correction (Klose, 1990; Near et al., 2015), apodization using a 5-
Hz Lorentzian filter and zero padding by a factor of 16. Finally, the fully processed edit-on/off
scans were subtracted to generate GABA-edited spectra.
3.3.5.2 Analysis The GannetFit module uses a single Gaussian model with a linear baseline to fit the edited GABA
signal between 2.8-3.5 ppm and Cr signal from the edit-off scan from 2.72-3.12 ppm. From the fit,
GABA FWHM (expressed as ppm), fitting error (FitErr), SNR and GABA/Cr ratio were estimated,
as described previously (R. A. Edden et al., 2013) i.e. GABA/Cr ratio was estimated as the ratio of
the signal integrals of GABA and Cr. Due to variations of peak amplitude in the presence of
motion, GABA FitErr was defined as the SD of the fitting residual normalised to the average
amplitude of GABA in the NoCo reference scan. SNR was computed in the frequency domain as
the GABA amplitude divided by the SD of the fitting residual.
The static in vitro edited spectra acquired by standard MSpc and vNavMSpc with NoCo sequences
were quantified to determine the effect of the navigator on the final edited GABA peaks. For this,
an additional 5-Hz line broadening was applied to the in vitro data to be consistent with the in vivo
data (Puts et al., 2013), followed by the estimation of GABA/Cr ratio and FWHM using GannetFit
module.
Visual assessment of the spectra was the index for qualitative analysis to identify subtraction
artefacts, line-broadening and baseline distortions. The parameters FWHM, FitErr, SNR and

29
GABA/Cr were indices for quantitative analysis. These indices are frequently applied to gauge
spectral quality (Bhattacharyya et al., 2007; Keating & Ernst, 2012), and for our study, to determine
the efficacy of volume navigators to recover spectra in the presence of motion. All spectra are
compared to reference scans and all values are expressed as mean ± standard error of mean (SEM).
3.4 RESULTS
3.4.1 In vitro validation
The static scans acquired using the standard MSpc (reference) and vNavMSpc sequences produced
similarly excellent quality and fully resolved edited spectra (Figure 3.2A). The parameters derived
from standard MSpc (GABA/Cr: 0.125 ± 0.002, FWHM: 0.147 ± 0.001) and vNavMspc with NoCo
(GABA/Cr: 0.128 ± 0.002; FWHM: 0.147 ± 0.001 ppm) sequences were similar.
For the vNavMSpc with NoCo acquisitions, the manually applied zero-order shim offset led to a
distorted and inverted C4-GABA peak and slightly noisy baseline (Figure 3.2B), while manually
applied first-order shim offset caused substantial GABA peak degradation and NAA line
broadening (Figure 3.2C: arrows 1 and 2). The combination of zero- and first-order shim offsets
affected the NoCo scan in a similar manner to the first-order shim offset, resulting in a loss of the
pseudo-doublet pattern (Near et al., 2012) of the GABA peak (Figure 3.2D: arrow 3). The
corresponding ShMoCo scans adjusted the shim offsets, improved the quality of the spectra and
compare favourably with the reference scan. The 7o rotation caused distortion of the GABA peak
(Figure 3.2E: arrow 4), so that the multiplet could not be resolved. The ShMoCo scan improved
spectral quality, but the pseudo-doublet pattern of GABA was less prominent relative to the static
scans.
3.4.2 In vivo validation
Although subjects were fairly successful in remaining still throughout the reference scans with
average translations of -0.04 ± 0.01 mm and rotations of -0.08 ± 0.06 degrees, these minor changes
led to uncorrected shim changes in the NoCo scans. For the scans involving intentional motion,
subjects moved as instructed according to a pre-defined schedule.
Figure 3.3 shows edited spectra from NoCo and ShMoCo scans, acquired with and without
intentional motion, and GABA fitting overlaid over the reference scans to demonstrate the fitting
quality. The edited spectra from the NoCo and ShMoCo reference scans have comparable and
excellent spectral quality. The motion scans with NoCo demonstrate different effects of motion on
the edited spectra. Subject 1 shows a distorted and broadened GABA peak and slanted baseline
between about 2.2 and 3 ppm. Subject 2 exhibits subtraction artefact and elevated GABA

30
amplitude, which is also evident in subject 3. In subject 3, motion was not large enough to
substantially degrade edit-off spectral quality, but the NoCo edit-on spectrum of the third subject
shows insufficient suppression of the NAA peak. The ShMoCo scans reduced the artefacts
substantially and compare favourably with reference scans.
The artefacts in subject 1’s edited spectrum are substantial relative to the other two subjects’ edited
spectra, originating from baseline distortions and line-broadening in edit-on/off scans (Figure 3.3:
Artefact A) due to larger head motions (up-down 4.0° versus 3.1° ± 0.0°, left-right: 4.5° versus 3.0°
± 0.0°) relative to the other two subjects. The resulting absolute first order-shim changes
( (∆𝐺𝑥)! + ∆𝐺𝑦 ! + ∆𝐺𝑧 !), derived from maximum shim changes in Gx, Gy, and Gz, from subject 1
were larger relative to the other two subjects during up-down (5.8 versus 3.6 ± 0.7 µT/m) and left-
right (3.6 versus 2.9 ± 0.0 µT/m) rotations. These distortions are attributable primarily to distortions
along the Y-axis (perpendicular to coronal plane (Gy): up-down: 5.2 versus 3.3 ± 0.8 µT/m; left-
right: 2.4 versus 1.4 ± 0.0).
The quantitative parameters for the three subjects are presented in Figure 3.4. Although the NoCo
and ShMoCo reference scans without intentional motion show similar results, NoCo scans have
slightly larger standard errors in FitErr (±0.81 versus ±0.31) and SNR (±3.2 versus ±1.68) than
ShMoCo scans. NoCo motion scans show increases in all parameters (FWHM: 0.25 ± 0.12 ppm;
FitErr: 15.22 ± 2.43; SNR: 15.31 ± 5.53; GABA/Cr: 0.22 ± 0.17), while ShMoCo recovers the data
yielding values similar to the reference values (FWHM: 0.13 ± 0.01 ppm; FitErr: 9.98 ± 1.92; SNR:
10.42 ± 2.01; GABA/Cr: 0.037 ± 0.01).
3.5 DISCUSSION In this work, we implemented a pair of 3D EPI vNav in the J-editing SVS MSpc sequence to
correct in real-time changes in VOI localisation due to motion and zero- to first-order shim terms.
Firstly, we investigated in a phantom whether (i) the presence of vNav in the sequence affect the
GABA signal. Secondly, the accuracy of the vNav in measuring and correcting changes in position
and B0.
The static scans acquired using the standard MSpc and vNavMSpc sequences show excellent
agreement and well-resolved GABA peaks. The vNavMSpc with NoCo scan revealed that the
inclusion of the navigator had minimal effect on the edited spectrum. Applying zero- and first-order
shim offsets led to distortion, line-broadening and depreciated peaks in the NoCo scans (arrows 1-4;
Figure 3.2B, C and D), while ShMoCo scans compare favourably with the reference scans. Our data
suggest that broadening of peaks and loss of the GABA multiplet structure arise largely due to
changes in the first-order shim terms, while frequency drift appears to cause subtraction artefacts.
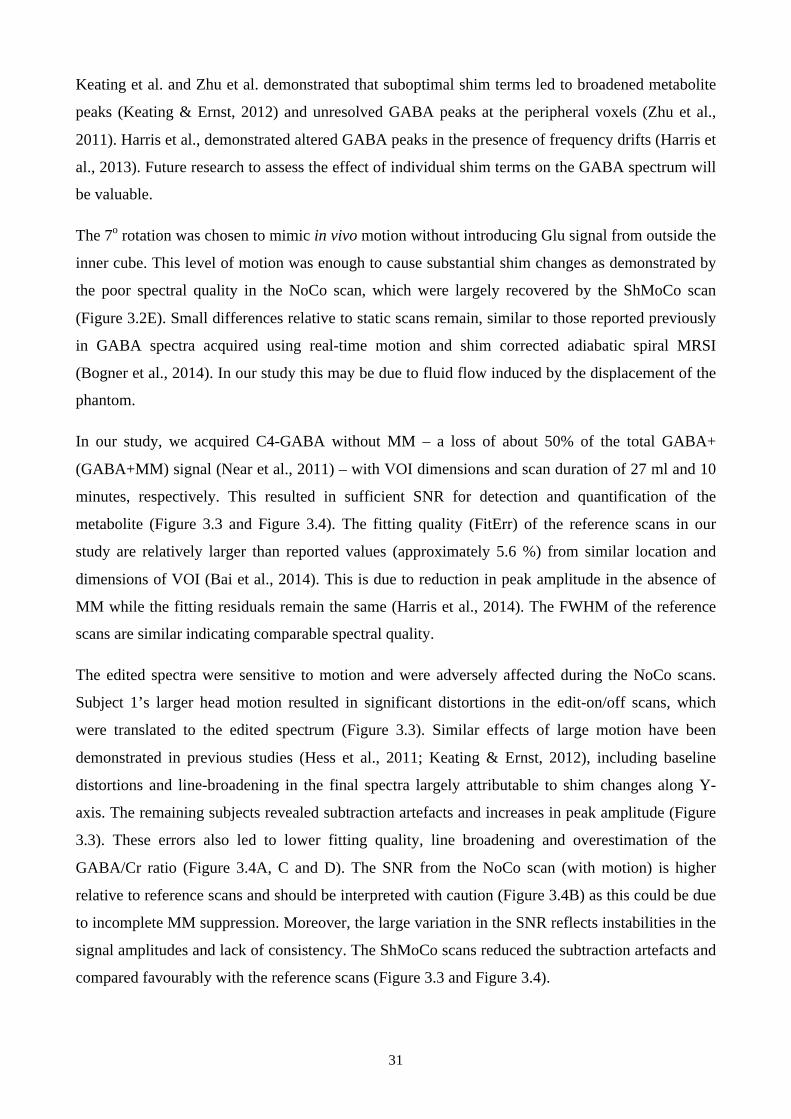
31
Keating et al. and Zhu et al. demonstrated that suboptimal shim terms led to broadened metabolite
peaks (Keating & Ernst, 2012) and unresolved GABA peaks at the peripheral voxels (Zhu et al.,
2011). Harris et al., demonstrated altered GABA peaks in the presence of frequency drifts (Harris et
al., 2013). Future research to assess the effect of individual shim terms on the GABA spectrum will
be valuable.
The 7o rotation was chosen to mimic in vivo motion without introducing Glu signal from outside the
inner cube. This level of motion was enough to cause substantial shim changes as demonstrated by
the poor spectral quality in the NoCo scan, which were largely recovered by the ShMoCo scan
(Figure 3.2E). Small differences relative to static scans remain, similar to those reported previously
in GABA spectra acquired using real-time motion and shim corrected adiabatic spiral MRSI
(Bogner et al., 2014). In our study this may be due to fluid flow induced by the displacement of the
phantom.
In our study, we acquired C4-GABA without MM – a loss of about 50% of the total GABA+
(GABA+MM) signal (Near et al., 2011) – with VOI dimensions and scan duration of 27 ml and 10
minutes, respectively. This resulted in sufficient SNR for detection and quantification of the
metabolite (Figure 3.3 and Figure 3.4). The fitting quality (FitErr) of the reference scans in our
study are relatively larger than reported values (approximately 5.6 %) from similar location and
dimensions of VOI (Bai et al., 2014). This is due to reduction in peak amplitude in the absence of
MM while the fitting residuals remain the same (Harris et al., 2014). The FWHM of the reference
scans are similar indicating comparable spectral quality.
The edited spectra were sensitive to motion and were adversely affected during the NoCo scans.
Subject 1’s larger head motion resulted in significant distortions in the edit-on/off scans, which
were translated to the edited spectrum (Figure 3.3). Similar effects of large motion have been
demonstrated in previous studies (Hess et al., 2011; Keating & Ernst, 2012), including baseline
distortions and line-broadening in the final spectra largely attributable to shim changes along Y-
axis. The remaining subjects revealed subtraction artefacts and increases in peak amplitude (Figure
3.3). These errors also led to lower fitting quality, line broadening and overestimation of the
GABA/Cr ratio (Figure 3.4A, C and D). The SNR from the NoCo scan (with motion) is higher
relative to reference scans and should be interpreted with caution (Figure 3.4B) as this could be due
to incomplete MM suppression. Moreover, the large variation in the SNR reflects instabilities in the
signal amplitudes and lack of consistency. The ShMoCo scans reduced the subtraction artefacts and
compared favourably with the reference scans (Figure 3.3 and Figure 3.4).
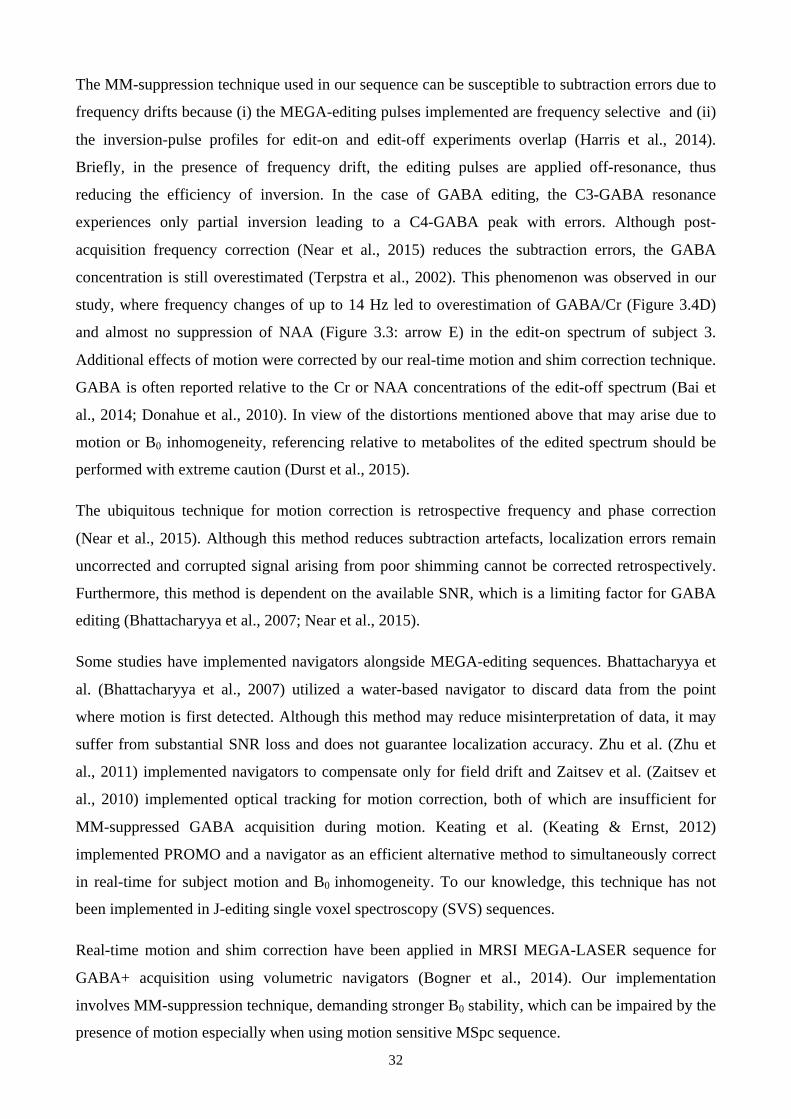
32
The MM-suppression technique used in our sequence can be susceptible to subtraction errors due to
frequency drifts because (i) the MEGA-editing pulses implemented are frequency selective and (ii)
the inversion-pulse profiles for edit-on and edit-off experiments overlap (Harris et al., 2014).
Briefly, in the presence of frequency drift, the editing pulses are applied off-resonance, thus
reducing the efficiency of inversion. In the case of GABA editing, the C3-GABA resonance
experiences only partial inversion leading to a C4-GABA peak with errors. Although post-
acquisition frequency correction (Near et al., 2015) reduces the subtraction errors, the GABA
concentration is still overestimated (Terpstra et al., 2002). This phenomenon was observed in our
study, where frequency changes of up to 14 Hz led to overestimation of GABA/Cr (Figure 3.4D)
and almost no suppression of NAA (Figure 3.3: arrow E) in the edit-on spectrum of subject 3.
Additional effects of motion were corrected by our real-time motion and shim correction technique.
GABA is often reported relative to the Cr or NAA concentrations of the edit-off spectrum (Bai et
al., 2014; Donahue et al., 2010). In view of the distortions mentioned above that may arise due to
motion or B0 inhomogeneity, referencing relative to metabolites of the edited spectrum should be
performed with extreme caution (Durst et al., 2015).
The ubiquitous technique for motion correction is retrospective frequency and phase correction
(Near et al., 2015). Although this method reduces subtraction artefacts, localization errors remain
uncorrected and corrupted signal arising from poor shimming cannot be corrected retrospectively.
Furthermore, this method is dependent on the available SNR, which is a limiting factor for GABA
editing (Bhattacharyya et al., 2007; Near et al., 2015).
Some studies have implemented navigators alongside MEGA-editing sequences. Bhattacharyya et
al. (Bhattacharyya et al., 2007) utilized a water-based navigator to discard data from the point
where motion is first detected. Although this method may reduce misinterpretation of data, it may
suffer from substantial SNR loss and does not guarantee localization accuracy. Zhu et al. (Zhu et
al., 2011) implemented navigators to compensate only for field drift and Zaitsev et al. (Zaitsev et
al., 2010) implemented optical tracking for motion correction, both of which are insufficient for
MM-suppressed GABA acquisition during motion. Keating et al. (Keating & Ernst, 2012)
implemented PROMO and a navigator as an efficient alternative method to simultaneously correct
in real-time for subject motion and B0 inhomogeneity. To our knowledge, this technique has not
been implemented in J-editing single voxel spectroscopy (SVS) sequences.
Real-time motion and shim correction have been applied in MRSI MEGA-LASER sequence for
GABA+ acquisition using volumetric navigators (Bogner et al., 2014). Our implementation
involves MM-suppression technique, demanding stronger B0 stability, which can be impaired by the
presence of motion especially when using motion sensitive MSpc sequence.

33
Figure 3.2: Scans of the spherical phantom acquired using the standard MEGA-SPECIAL (MSpc; A1) and volume navigated MSpc (vNavMSpc) sequences for different scenarios: (A) at rest; (B) with a frequency offset; (C) with a first-order shim offset; (D) with a frequency and first-order shim offset; and (E) a scan during which the inner cube was rotated through 7 degrees during the scan. vNavMSpc scans were acquired without (NoCo) and with (ShMoCo) shim and motion correction applied. In B, C, and D frequency and first-order shim offsets led to poor quality spectra from NoCo scans while ShMoCo scans recovered the spectra. The first-order shim
offset caused loss of the pseudo-doublet pattern of the GABA peak 4(indicated by 1 and 3) and NAA line broadening (2). Similarly, motion in the NoCo scan also caused loss of the GABA multiplet (indicated by 4).
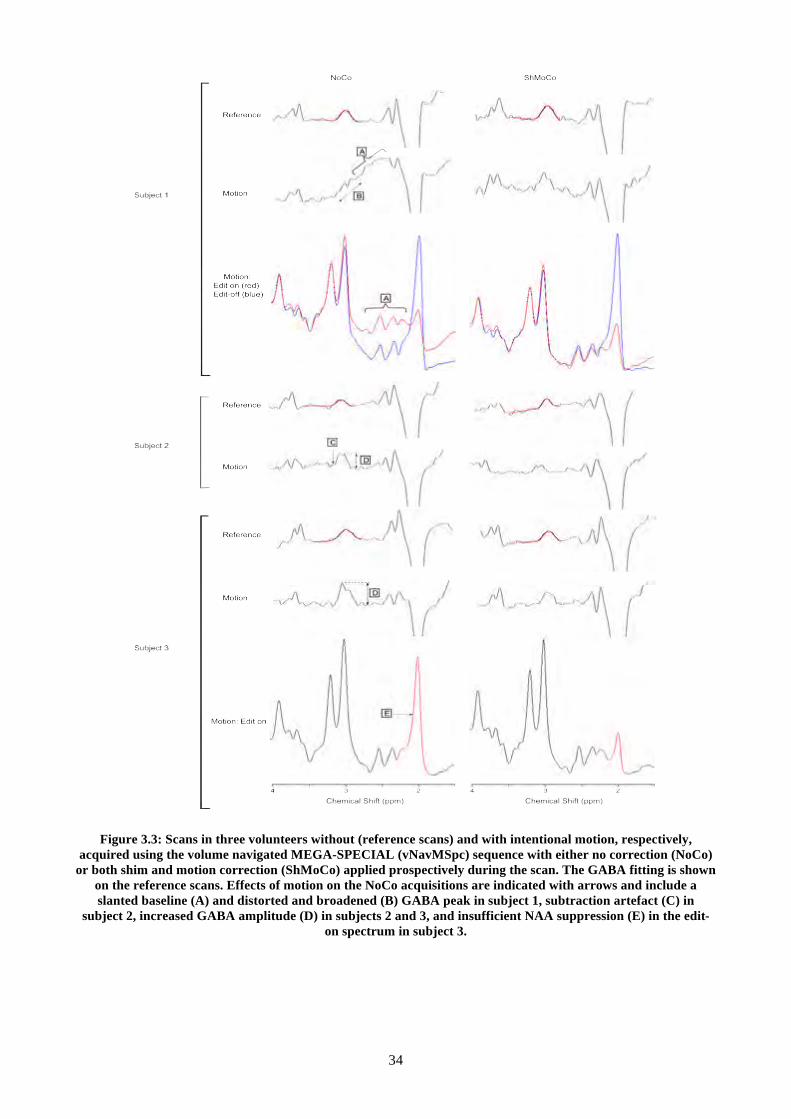
34
Figure 3.3: Scans in three volunteers without (reference scans) and with intentional motion, respectively, acquired using the volume navigated MEGA-SPECIAL (vNavMSpc) sequence with either no correction (NoCo)
or both shim and motion correction (ShMoCo) applied prospectively during the scan. The GABA fitting is shown on the reference scans. Effects of motion on the NoCo acquisitions are indicated with arrows and include a slanted baseline (A) and distorted and broadened (B) GABA peak in subject 1, subtraction artefact (C) in
subject 2, increased GABA amplitude (D) in subjects 2 and 3, and insufficient NAA suppression (E) in the edit-on spectrum in subject 3.

35
Figure 3.4: Means of the fitting parameters A) FitErr, B) SNR, C) FWHM and D) GABA/Cr ratio for the edited spectra without (NoCo) and with shim and motion correction (ShMoCo), both in the absence (reference) and
presence (motion) of intentional motion. (a.u: arbitrary units; ppm: parts per million; % percentage).
There are no direct comparisons between MEGA-LASER or MEGA-sLASER and MSpc
sequences, but when referenced to MEGA-PRESS, MEGA-LASER and MEGA-sLASER
demonstrate lower spatial variations, are less sensitive to motion and yield more GABA signal than
MSpc (Andreychenko et al., 2012; Bogner et al., 2014; Near et al., 2011). This suggests that the
real-time motion and shim correction is a necessity for MSpc sequence to ensure proper C4-GABA
acquisition. Further studies involving comparison between different real-time motion and shim
corrected J-editing sequences will be valuable.
Finally, this work has not addressed reacquisition (Zaitsev et al., 2010) to further improve spectral
quality. To avoid prolonging scan time, we decided instead to remove corrupted data during post-
processing, as previously done (Near et al., 2013). Higher order shims can also be calculated from
the field maps but the current Siemens hardware does not permit real-time control of the higher
order shims. While the linear gradients are eddy current compensated, the higher order shims are
not, and switching these shims in real time would result in eddy currents that would compromise
image and spectral quality.
36
3.6 CONCLUSION Subject motion causes detrimental effects on the GABA edited spectra. We have demonstrated that
the addition of volume navigators to the MEGA-SPECIAL sequence mitigates spectral distortions
due to motion and B0 inhomogeneity without increasing scan time or compromising SNR.
3.7 ACKNOWLEDGEMENTS Support was provided by the NRF/DST South African Research Chairs Initiative, NIH grant
R01HD071664 and the South African Medical Research Council (MRC).
37
Chapter 4 Reproducibility of macromolecule
suppressed GABA measurement using motion and shim
navigated MEGA-SPECIAL with LCModel, jMRUI
and GANNET1 Muhammad G. Saleh2, Jamie Near3, A. Alhamud2, Frances Robertson2, André J.W. van der
Kouwe4, Ernesta M. Meintjes2
4.1 ABSTRACT Measuring the pure form of GABA has become increasingly important due to its link with
pathology and behaviour. The aim of this study is to assess reproducibility of GABA using a shim
and motion navigated MEGA-SPECIAL sequence with LCModel, jMRUI and GANNET software.
20 healthy subjects were scanned. For every subject, four motion and shim navigated MEGA-
SPECIAL scans were acquired in a single session. Two acquisitions were performed for each of
two regions, the anterior cingulate (ACC) and medial-parietal cortices (PAR). Absolute GABA
concentrations (GABAH2O) and GABA/Cr were quantified using the three different software
packages. The GABA concentrations from the two acquisitions in the PAR were statistically
different (p < 0.05) from each other. The reproducibility measured as coefficient of variation
within-subjects (CVws) was ≈13-22% in both the ACC and PAR determined using all three software
packages. Based on CVws, GABA concentrations are reproducible in both the ACC and PAR using
a shim and motion corrected MEGA-SPECIAL sequence with three different software packages.
This study shows the potential to quantify the pure form of GABA using any of the three software
packages in studies relating GABA to pathology and healthy behaviour.
4.2 INTRODUCTION γ-aminobutyric acid (GABA) is a primary inhibitory neurotransmitter and accounts for almost half
of synaptic activity (Levy & Degnan, 2013). GABA quantification remains challenging due to
overlapping resonances arising from macromolecules (MM) and metabolites such as creatine
(Mullins et al., 2012). Currently one preferred method for measuring C4-GABA is through spectral
1 Chapter written as an article intended for review and publication 2 University of Cape Town 3 McGill University 4 Massachusetts General Hospital, Harvard Medical School
38
editing methods, such as MEGA-PRESS and MEGA-SPECIAL. Most studies acquire C4-GABA
with macromolecule (MM) contamination, commonly referred to as GABA+ (Mullins et al., 2012).
Several studies have established test-retest reproducibility of GABA+ within- and between-subjects
using LCModel, jMRUI and GANNET (Bogner et al., 2010; Evans et al., 2010; Mikkelsen et al.,
2015; Near et al., 2014; O'Gorman et al., 2011). These studies employed coefficient of variation
(CV) as an index to determine reproducibility of GABA+, which was referenced to either tissue
water (GABAH2O) or creatine (GABA/Cr). Bogner et al., performed a reproducibility study in the
occipital cortex (OCC) and found average within-subjects CV (CVws) ranging between 10 to 12%
and between-subjects CV (CVbs) ≈13% using AMARES package in jMRUI (Bogner et al., 2010).
Evans et al., measured CVws and CVbs in the OCC (CVws ≈7% and CVbs ≈9%) and sensorimotor
cortex (SMC: CVws of ≈9% and CVbs ≈12%) using MATLAB (The Mathworks, Natick, MA),
which was similar to GANNET software (Evans et al., 2010). O’Gorman et al., measured GABA+
in the dorsolateral prefrontal cortex (DLPFC) and demonstrated CVws of 7%, 9% and 12% using,
respectively, LCModel, AMARES in jMRUI and MATLAB, which was similar to GANNET
software (O'Gorman et al., 2011). Near et al., found CVws in the OCC of about 4% using AMARES
in jMRUI (Near et al., 2014). Mikkelsen et al., found CVws of about 15% and 4% in the anterior
cingulate cortex (ACC) and OCC using GANNET (Mikkelsen et al., 2015).
Previous studies (Harris et al., 2014; Near et al., 2011) have shown that the MM contribution varies
between subjects, resulting in a very weak correlation between GABA+ and GABA (MM-
suppressed). Another reason for weak correlation could be due to the problems related with the MM
suppression technique. Measuring the pure form of GABA is becoming increasingly important due
to its relationship with several neurologic conditions including Alzheimer’s disease (Bai et al.,
2014), epilepsy (Yamamoto et al., 1985), alcohol and drug abuse (Ticku, 1990), insomnia
(Winkelman et al., 2008) and depression (Block et al., 2009; Sanacora et al., 2002). GABA levels
are also correlated with hemodynamic contrasts measured through blood-oxygen level dependent
(BOLD) functional magnetic resonance imaging (fMRI) and cerebral blood flow (CBF)-weighted
arterial spin labelling (ASL) (Donahue et al., 2010; Muthukumaraswamy et al., 2009). Furthermore,
variations in GABA levels are observed with motor learning (Floyer-Lea et al., 2006) and working
memory (Michels et al., 2012) tasks.
GABA acquisition is challenging due to the requirement of high magnetic field (B0) stability for
adequate MM-suppression, which can be hampered by several factors, including incidental motion.
Furthermore, a previous pilot study suggested that removal of MM from GABA+ reduces the
reliability of GABA measurements (determined by Cramer Rao Lower Bound increasing from 20%
to 40%) (O'Gorman et al., 2007). Therefore, it is important to establish reproducibility of GABA

39
prior to GABA-based evaluation of aforementioned studies, including pathology and healthy
behaviour.
GABA measurements are performed using a range of software, however most commonly employed
(Bogner et al., 2010; Mikkelsen et al., 2015; Mullins et al., 2012; Near et al., 2014) are LCModel
(Provencher, 2001), the AMARES (Vanhamme et al., 1997) package in jMRUI (Naressi et al.,
2001) and GANNET (R. A. Edden et al., 2013). The commercial LCModel software utilises prior
knowledge of the individual metabolite basis spectra (a basis set) to fit GABA in the frequency
domain. The jMRUI software is freely available to non-profit organizations, and through the
AMARES package, performs time-domain fitting by utilizing user-defined a priori information.
The MATLAB-based software, GANNET, is open-source and specifically developed for
quantitative analysis of GABA through nonlinear least-squares Gaussian fitting in the frequency
domain. Several studies implement different software which – given the different techniques
implemented in performing GABA measurements – will introduce bias and variance in GABA
measurements (Levy & Degnan, 2013; Mullins et al., 2012; Puts & Edden, 2012).
To our knowledge, two studies using MEGA-PRESS with the MM suppression technique have
investigated reproducibility of GABA, of which one study quantified GABA at 7 T through manual
integration of the area under the C4-GABA peak and found CVws ≈14% and ≈13% in the ACC and
DLPFC, respectively (Wijtenburg et al., 2013). The second study employed GANNET software to
quantify GABA in the ACC and OCC (Mikkelsen et al., 2015). The study found CVws ≈13% and
CVbs ≈14% in the ACC and CVws ≈5-9% and CVbs ≈15% (Mikkelsen et al., 2015).
A motion and shim navigated MEGA-SPECIAL sequence has recently been demonstrated that
acquires the J-edited spectrum with superior spectral quality, permitting more accurate
quantification of GABA (Saleh et al., 2016). To date, the extent of intra- and inter-subject
variability of GABA acquired by motion and shim navigated MEGA-SPECIAL has not been
investigated and compared between commonly employed spectral fitting methods (R. A. Edden et
al., 2013; Provencher, 2001; Vanhamme et al., 1997). GABA+ concentration has been quantified
using internal references, such as water (H2O) and creatine (Cr) (Bai et al., 2014; Bogner et al.,
2010; Harris et al., 2014). Cr is widely used as a reference for GABA+ (Bogner et al., 2010; Near et
al., 2014). Therefore, the aim of this study was to use motion and shim navigated MEGA-SPECIAL
(Saleh et al., 2016) to assess intra- and inter-subject variability in GABA concentration in two brain
regions, referenced to H2O and Cr, as determined with LCModel (Provencher, 2001), AMARES
(Vanhamme et al., 1997) in jMRUI (Naressi et al., 2001) and GANNET (R. A. Edden et al., 2013).
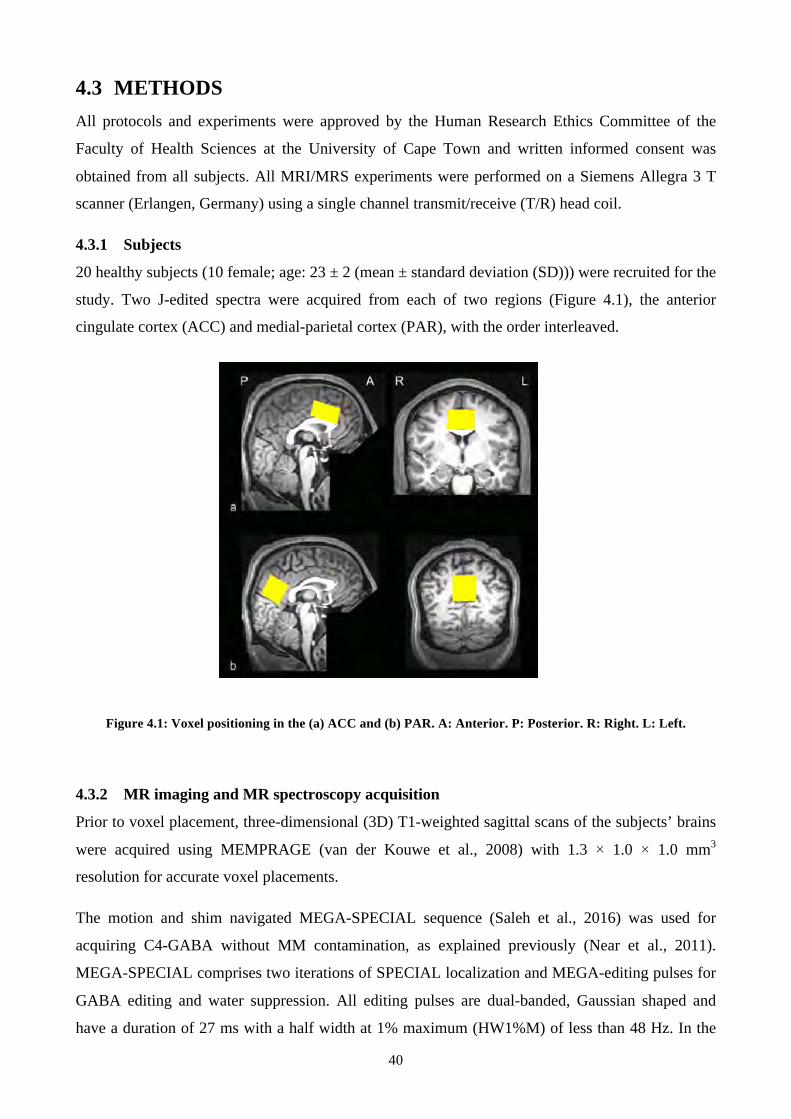
40
4.3 METHODS All protocols and experiments were approved by the Human Research Ethics Committee of the
Faculty of Health Sciences at the University of Cape Town and written informed consent was
obtained from all subjects. All MRI/MRS experiments were performed on a Siemens Allegra 3 T
scanner (Erlangen, Germany) using a single channel transmit/receive (T/R) head coil.
4.3.1 Subjects
20 healthy subjects (10 female; age: 23 ± 2 (mean ± standard deviation (SD))) were recruited for the
study. Two J-edited spectra were acquired from each of two regions (Figure 4.1), the anterior
cingulate cortex (ACC) and medial-parietal cortex (PAR), with the order interleaved.
Figure 4.1: Voxel positioning in the (a) ACC and (b) PAR. A: Anterior. P: Posterior. R: Right. L: Left.
4.3.2 MR imaging and MR spectroscopy acquisition
Prior to voxel placement, three-dimensional (3D) T1-weighted sagittal scans of the subjects’ brains
were acquired using MEMPRAGE (van der Kouwe et al., 2008) with 1.3 × 1.0 × 1.0 mm3
resolution for accurate voxel placements.
The motion and shim navigated MEGA-SPECIAL sequence (Saleh et al., 2016) was used for
acquiring C4-GABA without MM contamination, as explained previously (Near et al., 2011).
MEGA-SPECIAL comprises two iterations of SPECIAL localization and MEGA-editing pulses for
GABA editing and water suppression. All editing pulses are dual-banded, Gaussian shaped and
have a duration of 27 ms with a half width at 1% maximum (HW1%M) of less than 48 Hz. In the
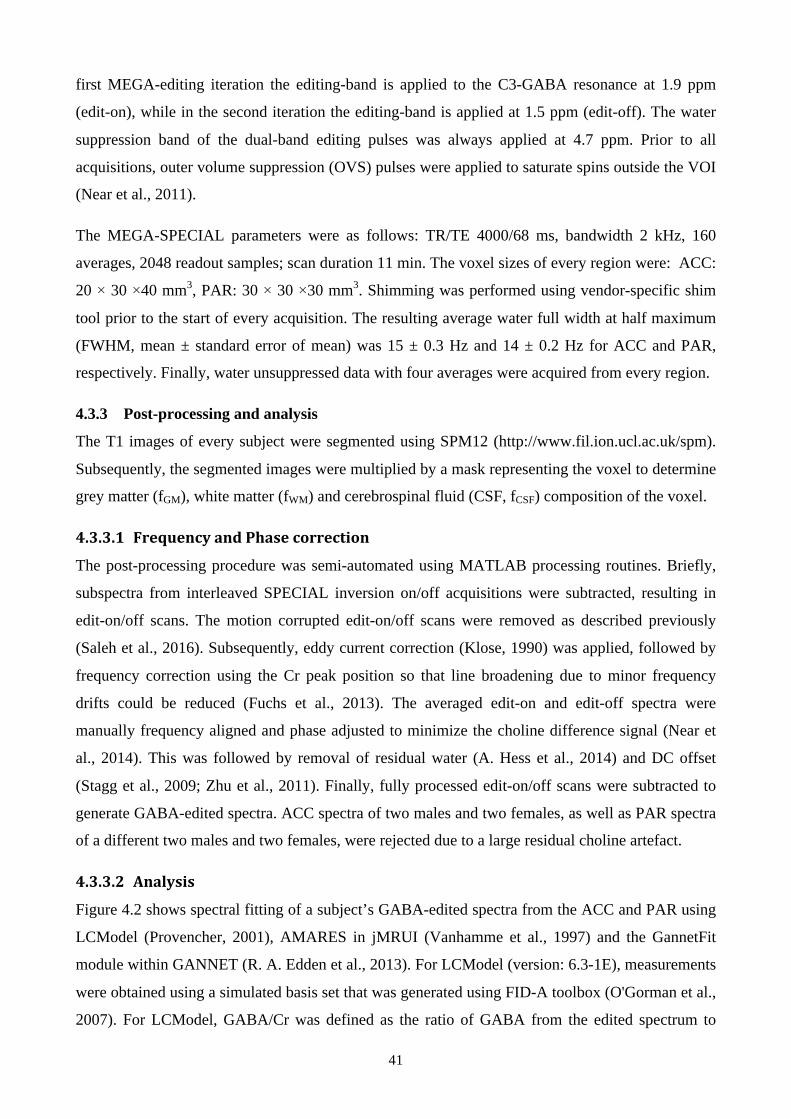
41
first MEGA-editing iteration the editing-band is applied to the C3-GABA resonance at 1.9 ppm
(edit-on), while in the second iteration the editing-band is applied at 1.5 ppm (edit-off). The water
suppression band of the dual-band editing pulses was always applied at 4.7 ppm. Prior to all
acquisitions, outer volume suppression (OVS) pulses were applied to saturate spins outside the VOI
(Near et al., 2011).
The MEGA-SPECIAL parameters were as follows: TR/TE 4000/68 ms, bandwidth 2 kHz, 160
averages, 2048 readout samples; scan duration 11 min. The voxel sizes of every region were: ACC:
20 × 30 ×40 mm3, PAR: 30 × 30 ×30 mm3. Shimming was performed using vendor-specific shim
tool prior to the start of every acquisition. The resulting average water full width at half maximum
(FWHM, mean ± standard error of mean) was 15 ± 0.3 Hz and 14 ± 0.2 Hz for ACC and PAR,
respectively. Finally, water unsuppressed data with four averages were acquired from every region.
4.3.3 Post-processing and analysis
The T1 images of every subject were segmented using SPM12 (http://www.fil.ion.ucl.ac.uk/spm).
Subsequently, the segmented images were multiplied by a mask representing the voxel to determine
grey matter (fGM), white matter (fWM) and cerebrospinal fluid (CSF, fCSF) composition of the voxel.
4.3.3.1 Frequency and Phase correction The post-processing procedure was semi-automated using MATLAB processing routines. Briefly,
subspectra from interleaved SPECIAL inversion on/off acquisitions were subtracted, resulting in
edit-on/off scans. The motion corrupted edit-on/off scans were removed as described previously
(Saleh et al., 2016). Subsequently, eddy current correction (Klose, 1990) was applied, followed by
frequency correction using the Cr peak position so that line broadening due to minor frequency
drifts could be reduced (Fuchs et al., 2013). The averaged edit-on and edit-off spectra were
manually frequency aligned and phase adjusted to minimize the choline difference signal (Near et
al., 2014). This was followed by removal of residual water (A. Hess et al., 2014) and DC offset
(Stagg et al., 2009; Zhu et al., 2011). Finally, fully processed edit-on/off scans were subtracted to
generate GABA-edited spectra. ACC spectra of two males and two females, as well as PAR spectra
of a different two males and two females, were rejected due to a large residual choline artefact.
4.3.3.2 Analysis Figure 4.2 shows spectral fitting of a subject’s GABA-edited spectra from the ACC and PAR using
LCModel (Provencher, 2001), AMARES in jMRUI (Vanhamme et al., 1997) and the GannetFit
module within GANNET (R. A. Edden et al., 2013). For LCModel (version: 6.3-1E), measurements
were obtained using a simulated basis set that was generated using FID-A toolbox (O'Gorman et al.,
2007). For LCModel, GABA/Cr was defined as the ratio of GABA from the edited spectrum to

42
total Cr (creatine + phosphocreatine) from the edit-off spectrum. For jMRUI (version 5.2), GABA
and Cr were modelled as double and single Lorentzian peaks, respectively. The frequency, phases
and linewidths of the peaks were all constrained relative to either the residual NAA peak for GABA
or the NAA peak of the edit-off spectrum for Cr at 3 ppm. For GANNET (version 2.0), a Gaussian
doublet with linear baseline was used to fit the GABA signal between 2.8 and 3.4 ppm, while a
Gaussian singlet was used to fit Cr between 2.72 and 3.12 ppm. For jMRUI and GANNET
analyses, apodization using a 5 Hz Lorentzian filter and zero padding to a factor of 16 were applied
prior to fitting.
Tissue H2O and Cr were used as internal references. The water concentration along with partial
volume correction were estimated as shown in equation 1 and used in all three spectral fitting
toolkits (Provencher, 2001). The absolute concentration of GABA (GABAH2O) and the ratio of
GABA to Cr (GABA/Cr) from jMRUI and GANNET were estimated as shown in equations 2 and
3, respectively.
𝑊𝐶𝑂𝑁𝐶 = !""##!!" !!"##$!!" !!!!!"!!"# !!!!"#
[1]
𝐺𝐴𝐵𝐴!!! !"## =!!"#"!!!!
×𝑊𝐶𝑂𝑁𝐶× !!!!!" !!!!!
!!!!!" !!!"#"× !!!" !!!!!
!!!" !!!"#"× !
!""!"#" [2]
𝐺𝐴𝐵𝐴 𝐶𝑟 !"## =!!"#"!!"
× !!"!!"#"
× !!!!!" !!!"
!!!!!" !!!"#"× !!!" !!!"
!!!" !!!"#"× !
!""!"#" [3]
where WCONC: concentration of water in institutional units (i.u), fGM: fraction of grey matter, fWM:
fraction of white matter, fCSF: fraction of CSF, SGABA: integral of the modelled GABA signal, SH2O:
integral of the modelled water signal, SCr: integral of the modelled Cr signal, HCr/ HGABA: ratio of 1H in Cr to GABA, effGABA: editing efficiency of GABA, T1 and T2: relaxation times of
metabolites and water. The editing efficiency (eff) of GABA is 0.45 (Near et al., 2011). The
HCr/HGABA 1H ratio is 3/2.
All concentrations and ratios were corrected for T1 and T2 relaxation effects using published values
(R. Edden, Intrapiromkul, et al., 2012; Mlynárik et al., 2001; Puts et al., 2013). All GABAH2O are
reported in institutional units (i.u). Estimates of GABA fit error were used to evaluate spectral
quality. In LCModel Cramer-Rao Lower Bounds (CRLB) were used, and fitting error (FitErr) for
jMRUI and GANNET. AMARES within jMRUI provides the Cramer-Rao standard deviation
(CRSD) and amplitude of every Lorentzian peak. We computed the ratio of the CRSD to the
amplitude for every Lorentzian peak and defined the FitErr for jMRUI (FitErrjMRUI) as the average
of these ratios. The FitErr from GANNET (FitErrGANNET) was defined as the SD of the fitting
residuals normalized to the Gaussian amplitude of the GABA peak.

43
4.3.4 Statistical analysis
Statistical analyses were performed in SPSS 22. All data were tested for normality using the
Shapiro-Wilk test.
4.3.4.1 Test-‐retest Reproducibility The repeated measures were compared using paired t-tests; non-normally distributed data were log
transformed. The extent of intra- and inter-subject variability of GABA measurements from the
three different software packages was compared in each region using coefficients of variation
within subjects (CVws) and between subjects (CVbs) as described by the previous studies
(Mikkelsen et al., 2015; Near et al., 2014). Firstly, the CV of each subject (CVs) was estimated as
follows:
𝐶𝑉𝑠 = 𝜎𝑠𝜇𝑠 100
where µs and σs are the mean and SD, respectively, of GABA concentrations measured for each
subject. Then the CVws was measured as the average of CVs:
𝐶𝑉𝑤𝑠 = 𝐶𝑉𝑠
The 95% confidence interval (CI) of CVws was estimated using a bootstrapping technique to
resample with replacement 10,000 times, as described previously (Mikkelsen et al., 2015; Near et
al., 2014). Finally, the CVbs was estimated as the ratio of the SD of subject means (σ) to the mean of
the subject means (µ):
𝐶𝑉𝑏𝑠 = 𝜎𝜇 100
The relationship between pairs of GABA measurements acquired for each subject in each region
were examined for each of the software packages using either Pearson (r) or Spearman (ρ)
correlation for normally and non-normally distributed data, respectively.
A two-factor analysis of variance (ANOVA) was used to compute the proportional contribution of
variance between the subjects (between-subjects variability excluding individual differences, σ2p)
and variance due to error (error, σ2e) to the total variance in the dataset, as described previously
(Mikkelsen et al., 2015). As a measure of intra-software reliability, intraclass correlation (ICC)
between repeated measures was computed for each software package in each brain region using a
two-way mixed effects model with measures of consistency (Weir, 2005).
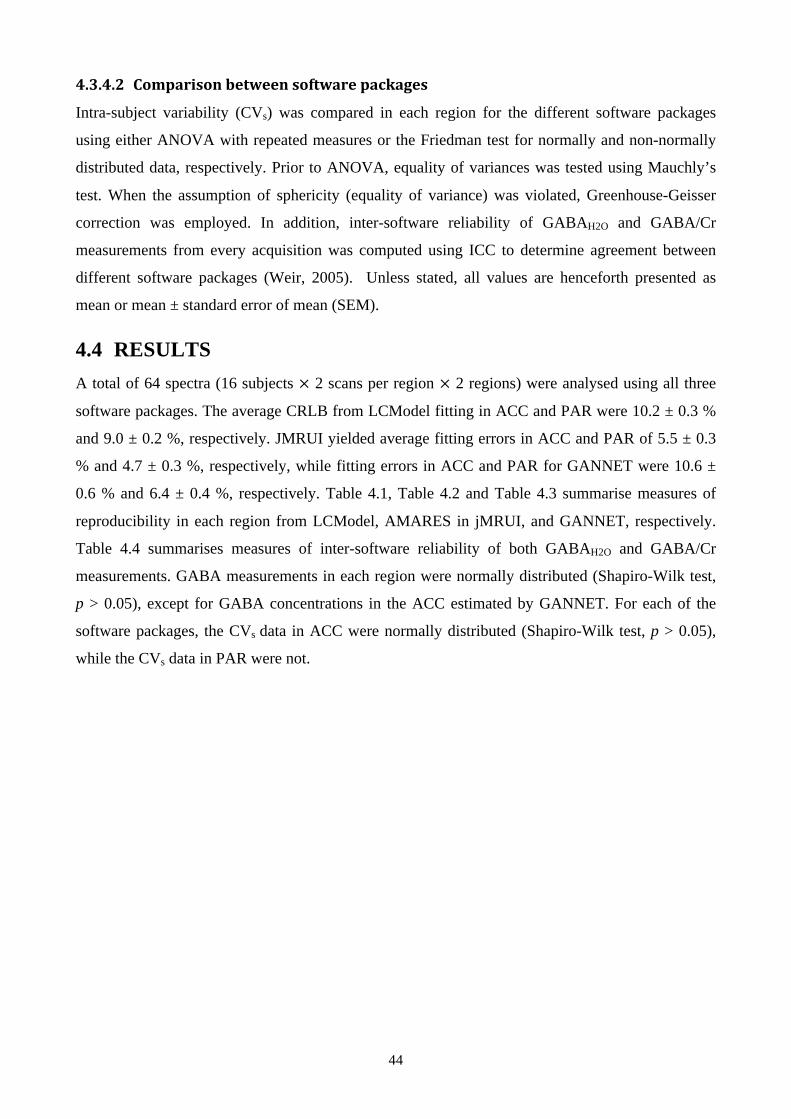
44
4.3.4.2 Comparison between software packages Intra-subject variability (CVs) was compared in each region for the different software packages
using either ANOVA with repeated measures or the Friedman test for normally and non-normally
distributed data, respectively. Prior to ANOVA, equality of variances was tested using Mauchly’s
test. When the assumption of sphericity (equality of variance) was violated, Greenhouse-Geisser
correction was employed. In addition, inter-software reliability of GABAH2O and GABA/Cr
measurements from every acquisition was computed using ICC to determine agreement between
different software packages (Weir, 2005). Unless stated, all values are henceforth presented as
mean or mean ± standard error of mean (SEM).
4.4 RESULTS A total of 64 spectra (16 subjects × 2 scans per region × 2 regions) were analysed using all three
software packages. The average CRLB from LCModel fitting in ACC and PAR were 10.2 ± 0.3 %
and 9.0 ± 0.2 %, respectively. JMRUI yielded average fitting errors in ACC and PAR of 5.5 ± 0.3
% and 4.7 ± 0.3 %, respectively, while fitting errors in ACC and PAR for GANNET were 10.6 ±
0.6 % and 6.4 ± 0.4 %, respectively. Table 4.1, Table 4.2 and Table 4.3 summarise measures of
reproducibility in each region from LCModel, AMARES in jMRUI, and GANNET, respectively.
Table 4.4 summarises measures of inter-software reliability of both GABAH2O and GABA/Cr
measurements. GABA measurements in each region were normally distributed (Shapiro-Wilk test,
p > 0.05), except for GABA concentrations in the ACC estimated by GANNET. For each of the
software packages, the CVs data in ACC were normally distributed (Shapiro-Wilk test, p > 0.05),
while the CVs data in PAR were not.
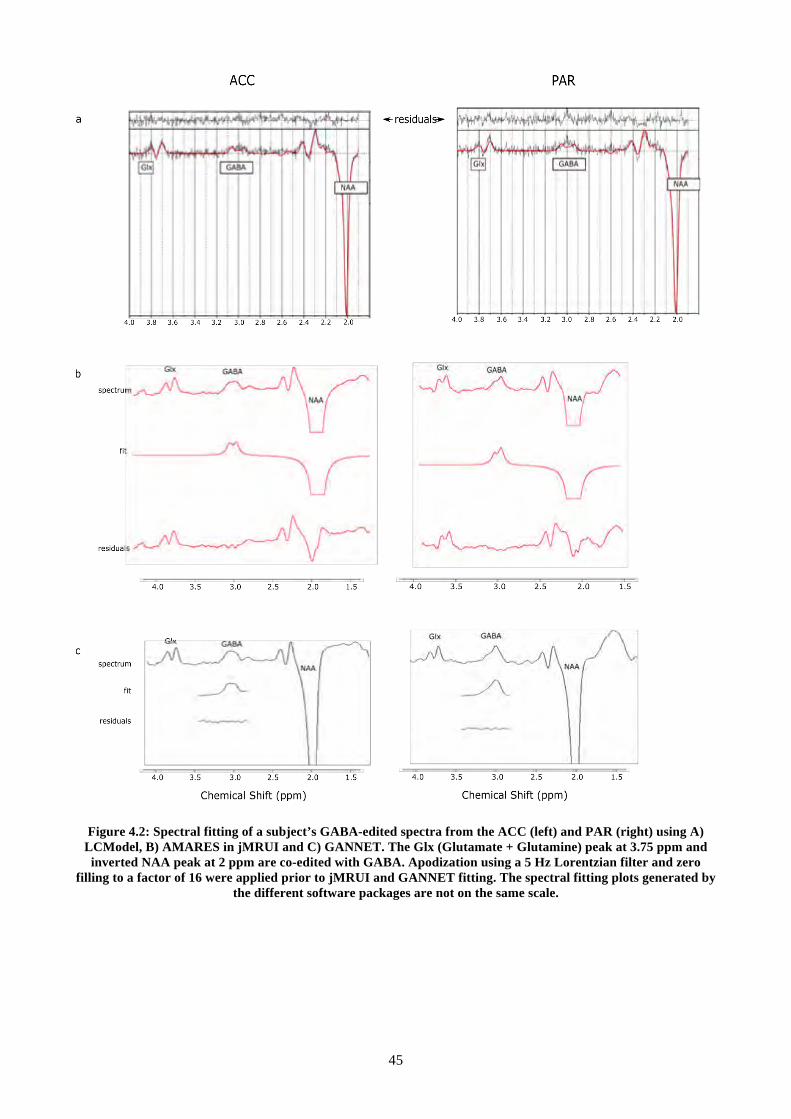
45
Figure 4.2: Spectral fitting of a subject’s GABA-edited spectra from the ACC (left) and PAR (right) using A) LCModel, B) AMARES in jMRUI and C) GANNET. The Glx (Glutamate + Glutamine) peak at 3.75 ppm and
inverted NAA peak at 2 ppm are co-edited with GABA. Apodization using a 5 Hz Lorentzian filter and zero filling to a factor of 16 were applied prior to jMRUI and GANNET fitting. The spectral fitting plots generated by
the different software packages are not on the same scale.
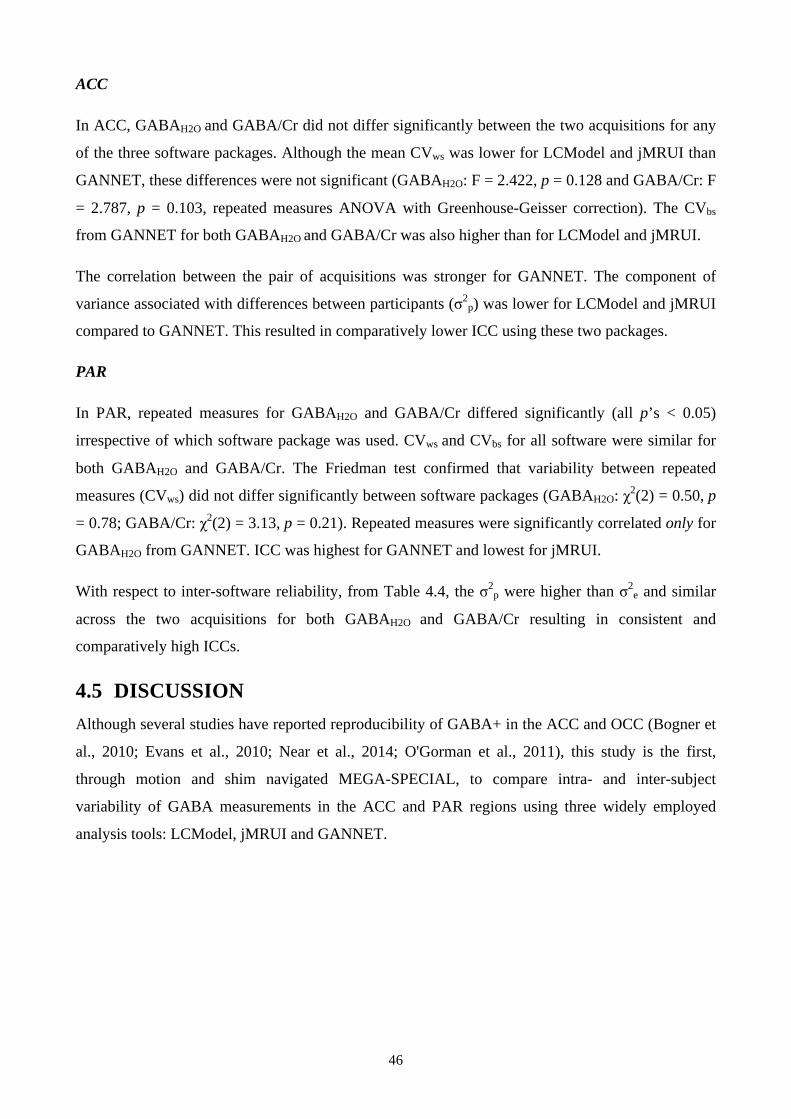
46
ACC
In ACC, GABAH2O and GABA/Cr did not differ significantly between the two acquisitions for any
of the three software packages. Although the mean CVws was lower for LCModel and jMRUI than
GANNET, these differences were not significant (GABAH2O: F = 2.422, p = 0.128 and GABA/Cr: F
= 2.787, p = 0.103, repeated measures ANOVA with Greenhouse-Geisser correction). The CVbs
from GANNET for both GABAH2O and GABA/Cr was also higher than for LCModel and jMRUI.
The correlation between the pair of acquisitions was stronger for GANNET. The component of
variance associated with differences between participants (σ2p) was lower for LCModel and jMRUI
compared to GANNET. This resulted in comparatively lower ICC using these two packages.
PAR
In PAR, repeated measures for GABAH2O and GABA/Cr differed significantly (all p’s < 0.05)
irrespective of which software package was used. CVws and CVbs for all software were similar for
both GABAH2O and GABA/Cr. The Friedman test confirmed that variability between repeated
measures (CVws) did not differ significantly between software packages (GABAH2O: χ2(2) = 0.50, p
= 0.78; GABA/Cr: χ2(2) = 3.13, p = 0.21). Repeated measures were significantly correlated only for
GABAH2O from GANNET. ICC was highest for GANNET and lowest for jMRUI.
With respect to inter-software reliability, from Table 4.4, the σ2p were higher than σ2
e and similar
across the two acquisitions for both GABAH2O and GABA/Cr resulting in consistent and
comparatively high ICCs.
4.5 DISCUSSION Although several studies have reported reproducibility of GABA+ in the ACC and OCC (Bogner et
al., 2010; Evans et al., 2010; Near et al., 2014; O'Gorman et al., 2011), this study is the first,
through motion and shim navigated MEGA-SPECIAL, to compare intra- and inter-subject
variability of GABA measurements in the ACC and PAR regions using three widely employed
analysis tools: LCModel, jMRUI and GANNET.

47
!
Tab
le 4
.1: M
easu
res o
f rep
rodu
cibi
lity
for
GA
BA
mea
sure
men
ts u
sing
LC
Mod
el
a Con
cent
ratio
ns a
re e
xpre
ssed
as
mea
n ±
stan
dard
err
or o
f m
ean
(SEM
), p-
valu
es a
re f
rom
pai
red
t-tes
t be
twee
n ac
quis
ition
s; 9
5% C
I: 95
% c
onfid
ence
int
erva
l ge
nera
ted
by
boot
stra
ppin
g th
e C
Vs; σ2 p:
betw
een-
subj
ects
com
pone
nt o
f var
ianc
e; σ
2 e: va
rianc
e du
e to
err
or; I
CC
: Int
racl
ass c
orre
latio
n co
effic
ient
.
Tab
le 4
.2: M
easu
res o
f rep
rodu
cibi
lity
for
GA
BA
mea
sure
men
ts u
sing
AM
AR
ES
in jM
RU
I
A
CC
PAR
G
AB
AH
2O
GA
BA
/Cr
G
AB
AH
2O
GA
BA
/Cr
Con
cent
ratio
n (i.
u) a
Acq
uisi
tion
1 2.
81 ±
0.1
5 p=
0.62
0.
170
± 0.
009
p=0.
50
3.
79 ±
0.1
6 p=
0.02
0.
220
± 0.
009
p=0.
04
Acq
uisi
tion
2 2.
90 ±
0.1
0 0.
180
± 0.
007
3.
30 ±
0.1
5 0.
190
± 0.
008
Mea
n C
Vw
s(%)
15.2
14
.2
14
.5
14.9
95
% C
I (%
) 10
.4–2
0.2
9.1–
19.3
9.1–
20.8
9.
3–21
.1
CV
bs (%
) 12
.9
15.0
13.4
12
.5
Pear
son
(r)
0.03
(p=0
.91)
0.
22 (p
=0.4
2)
0.
17 (p
=0.
52)
0.05
(p=0
.86)
σ2 p
(%)
51
61
59
52
σ2 e
(%)
49
39
41
48
IC
C
0.06
0.
35
0.
30
0.09
a C
once
ntra
tions
are
exp
ress
ed a
s m
ean
± st
anda
rd e
rror
of
mea
n (S
EM),
p-va
lues
are
fro
m p
aire
d t-t
est
betw
een
acqu
isiti
ons;
95%
CI:
95%
con
fiden
ce i
nter
val
gene
rate
d by
boot
stra
ppin
g th
e C
Vs; σ2 p:
betw
een-
subj
ects
com
pone
nt o
f var
ianc
e; σ
2 e: va
rianc
e du
e to
err
or; I
CC
: Int
racl
ass c
orre
latio
n co
effic
ient
.
A
CC
PAR
G
AB
AH
2O
GA
BA
/Cr
G
AB
AH
2O
GA
BA
/Cr
Con
cent
ratio
n (i.
u) a
Acq
uisi
tion
1 1.
08 ±
0.0
6 p=
0.92
0.
097
± 0.
005
p=0.
95
1.
24 ±
0.1
1 p<
0.01
0.
105
± 0.
004
p=0.
01
Acq
uisi
tion
2 1.
08 ±
0.0
4
0.09
7 ±
0.00
4
1.03
± 0
.04
0.09
0 ±
0.00
3 M
ean
CV
ws(%
) 13
.3
12.9
14.2
13
.3
95%
CI (
%)
10.0
–16.
7 9.
6–16
.2
8.
7–20
.2
8.2–
19.0
C
Vbs
(%)
13.8
14
.6
14
.0
12.6
Pe
arso
n (r
) 0.
21 (p
=0.4
4)
0.29
(p=0
.28)
0.34
(p=
0.20
) 0.
28 (p
=0.
30)
σ2 p (%
) 60
64
66
63
σ2 e (%
) 40
36
34
37
ICC
0.
33
0.44
0.50
0.
42

48
!
Tab
le 4
.3: M
easu
res o
f rep
rodu
cibi
lity
for
GA
BA
mea
sure
men
ts u
sing
GA
NN
ET
A
CC
PAR
G
AB
AH
2O
GA
BA
/Cr
G
AB
AH
2O
GA
BA
/Cr
Con
cent
ratio
n (i.
u) a
Acq
uisi
tion
1 1.
72 ±
0.1
8 p=
0.56
0.
130
± 0.
014
p=0.
65
2.
55 ±
0.1
0 p<
0.01
0.
18 ±
0.0
08
p<0.
01
Acq
uisi
tion
2 1.
58 ±
0.1
4 0.
120
± 0.
012
2.
07 ±
0.1
3 0.
15 ±
0.0
09
Mea
n C
Vw
s(%)
22.1
22
.2
17
.6
17.6
95
% C
I (%
) 15
.1–2
9.7
15.0
–30.
0
11.5
–24.
1 11
.7–2
3.9
CV
bs (%
) 32
.7
35.5
17.0
16
.6
Pear
son
(r)/S
pear
man
(ρ)
ρ=0.
37 (p
=0.1
7)
ρ=0.
43 (p
=0.0
9)
r=
0.57
(p=0
.02)
r=
0.38
(p=
0.15
) σ2 p
(%)
72
75
73
69
σ2 e
(%)
28
25
27
31
IC
C
0.60
0.
66
0.
62
0.56
a C
once
ntra
tions
are
exp
ress
ed a
s m
ean
± st
anda
rd e
rror
of
mea
n (S
EM),
p-va
lues
are
fro
m p
aire
d t-t
est
betw
een
acqu
isiti
ons;
95%
CI:
95%
con
fiden
ce i
nter
val
gene
rate
d by
boot
stra
ppin
g th
e C
Vs; σ2 p:
betw
een-
subj
ects
com
pone
nt o
f var
ianc
e; σ
2 e: va
rianc
e du
e to
err
or; I
CC
: Int
racl
ass c
orre
latio
n co
effic
ient
.
Tab
le 4
.4: I
nter
-sof
twar
e re
liabi
lity
of G
AB
AH
2O a
nd G
AB
A/C
r m
easu
rem
ents
σ2 p: be
twee
n-su
bjec
ts c
ompo
nent
of v
aria
nce;
σ2 e:
varia
nce
due
to e
rror
;ICC
: Int
racl
ass c
orre
latio
n co
effic
ient
.
G
AB
AH
2O
G
AB
A/C
r
Acq
uisi
tion
1 A
cqui
sitio
n 2
A
cqui
sitio
n 1
Acq
uisi
tion
2
σ2 p (%
) 76
78
77
77
σ2 e (%
) 24
22
23
23
ICC
0.
69
0.72
0.70
0.
70

49
Suppressing MM is beneficial for GABA-based evaluation of neurologic conditions (Levy &
Degnan, 2013), especially those involving correlational designs. For instance, Aufhaus et al.,
demonstrated age-related increase in GABA+, but when MM is suppressed, the relationship
between GABA and age no longer exists (Aufhaus et al., 2013). However, the MM-suppressed
GABA acquisition is challenging due to its strong dependence on B0 stability, which can be
exacerbated in the presence of motion. Furthermore, a previous pilot study demonstrated that
removal of MM by subtracting MM – acquired from metabolite nulled scan – from GABA+
reduces reliability (based on CRLB) of GABA measurements from 20% to 40% (O'Gorman et al.,
2007). The technique of removal of MM in (O'Gorman et al., 2007) increases the level of noise in
the final edited GABA spectrum, thus reducing reliability of GABA measurements (Mullins et al.,
2012). It also prolongs scan duration and involves subtraction of non-interleaved acquisitions, thus
increasing sensitivity to subject motion (Mullins et al., 2012).
In this study, we implemented 3D EPI volumetric navigators along with MEGA-SPECIAL to
prospectively correct for motion and B0 drift (Saleh et al., 2016) throughout the acquisition.
Pairwise motion and shim updates, i.e. once for every pair of edit-on/off measurements, have been
shown previously to reduce subtraction artifacts (e.g. choline artefatcs) in MEGA-PRESS and
MEGA-LASER (Bogner et al., 2014; Evans et al., 2013). Since the MEGA-SPECIAL sequence
requires four acquisitions (4 ×TR = 16 s for this study) to acquire a single GABA edited spectrum,
it is more sensitive to motion than MEGA-PRESS and MEGA-LASER that each require two TRs
per edited spectrum. In view of this, the motion and shim estimates were updated every TR, rather
than once for every set of measurements, to reduce the impact of motion and B0 drift on the final
GABA spectrum (Saleh et al., 2016). Nevertheless, comparison between the individual and pairwise
updates of motion and shim terms during MEGA-SPECIAL acquisition would be favourable.
This strategy resulted in spectra with high quality as evidenced by the low values of the CRLB
(ACC: ≈10%, PAR: ≈9%) from LCModel, and low fitting errors for jMRUI and GANNET.
Differences in GABA fit errors between the two regions reflect differences in signal to noise ratio
(SNR). The SNR was calculated in GANNET as the ratio of the amplitude of the fitted Gaussian to
the SD of the noise between 0.2 and 0.5 ppm. The average SNR from ACC (6 ± 0.9) was lower than
the SNR from PAR (11 ± 0.6). A previous study demonstrated higher SNR in posterior regions of
the brain such as OCC, compared to mid-brain regions, such as SMC (Evans et al., 2010). This may
be due to RF magnetic field (B1) inhomogeneity. Another contributor to the higher SNR in PAR
was that the VOI for PAR was larger (27 cm3) relative to the VOI for ACC (24 cm3). The intrinsic
concentration of GABA in PAR could also be higher than that in ACC, thus influencing the SNR.

50
Figure 4.3: LCModel measurements of GABAH2O and GABA/Cr from the ACC (left) and PAR (right) regions. The red circle (O) represents data from acquisition 1 and the black circle (O) from acquisition 2.
In this study we assessed reproducibility between repeated measures using a paired t-test, ICC, and
Pearson (or Spearman) correlation. Figure 4.3 shows GABA levels computed using LCModel for
each subject in each of the two regions for the pairs of acquisitions. We used the paired t-test to
detect systematic differences between repeated measures. In ACC there were no statistically
significant differences between repeated measures for GABA levels computed using any of the
software tools (all p’s > 0.50). Despite the absence of differences, ICC’s were low (< 0.5) except
for measurements obtained using GANNET. In contrast, the second measurements in the pair of
repeats yielded lower GABA levels in PAR for all three software packages. Similar to results in
ACC, ICC’s and correlations were, however, again low and not significant, except for data obtained
using GANNET.
In ACC, CVws ranged from 13% for LCModel (Figure 4.3) to 22% for GANNET. In PAR, CVws
ranged from 13% for LCModel (Figure 4.3) to 18% for GANNET. These results are similar to those
of a previous GABA+ reproducibility study performed in the dorsolateral prefrontal cortex
(DLPFC) (O'Gorman et al., 2011) where the lowest CVws were obtained using LCModel followed
by jMRUI and MATLAB-based fitting, the latter being similar to GANNET (Mullins et al., 2012).
Differences between CVws for different software packages were not significant in either region.
Unlike LCModel and jMRUI, GANNET estimated higher CVws in the ACC than PAR. This is

51
consistent with a previous study that has demonstrated higher CVws from GANNET in the ACC
than OCC (Mikkelsen et al., 2015). This is probably due to higher SNR from the OCC and PAR
relative to ACC. However, the regional difference in SNR did not modulate the CVws from
LCModel and jMRUI, suggesting that CVws from GANNET is dependent on SNR.
Similarly, the CVbs values from GANNET were higher in the ACC and could have been influenced
by larger between-subject variability in tissue fractions in the ACC than PAR. However, regional
differences in between-subject variability in tissue fractions did not affect CVbs from LCModel and
jMRUI, suggesting that CVbs values from GANNET, similar to the corresponding CVws values, are
SNR dependent. Future research comparing SNR and both CVws and CVbs from GANNET in
different regions of the brain would be informative.
For both regions, between-subject variability appears to be higher when using GANNET as
evidenced by higher CVbs and σ2p relative to values obtained using the other two software packages.
This high variance improved the ICC values for GANNET. Near et al. (Near et al., 2014)
previously reported an ICC value greater than 0.50 using jMRUI, while Harada et al. (Harada et al.,
2011) reported ICC values greater than 0.7 using LCModel. Mikkelsen et al., reported ICC values
greater than 0.40 using GANNET (Mikkelsen et al., 2015). Our study yielded similar ICC values
for GANNET, while LCModel and jMRUI ICC values were lower. This is probably due to the fact
that the two previous studies using jMRUI and LCModel measured GABA+ (Harada et al., 2011;
Near et al., 2014).
The inter-software ICC values (Table 4) are above 0.60 across the acquisitions for both GABAH2O
and GABA/Cr. Since ICC values ranging from 0.60 to 0.74 are considered good (Buckens et al.,
2013; Hodkinson et al., 2013; Near et al., 2014), these values suggest good agreement between the
three software packages. However, the large differences in GABAH20 and GABA/Cr levels found in
this study when using the three different software packages, indicate that direct comparison
between studies implementing different analysis software should be performed with great caution.
Although Cr is widely used as a referencing method (Bai et al., 2014; Bogner et al., 2010; Near et
al., 2014), some studies have shown that it might not be a stable choice for comparisons in some
neurological disorders (Deicken et al., 2001; Gruber et al., 2003). In view of the inter-software
agreement, measurements of GABAH2O could be used to detect changes between healthy and
unhealthy subjects.
To the author’s knowledge, only two studies using MEGA-PRESS (with MM-suppression) have
investigated reproducibility of GABA. One study by Wijtenburg et al. scanned 4 subjects at 7T in
the ACC and dorsolateral prefrontal cortex (DLPFC) using a 32 channel coil, 27 ml isotropic voxel,
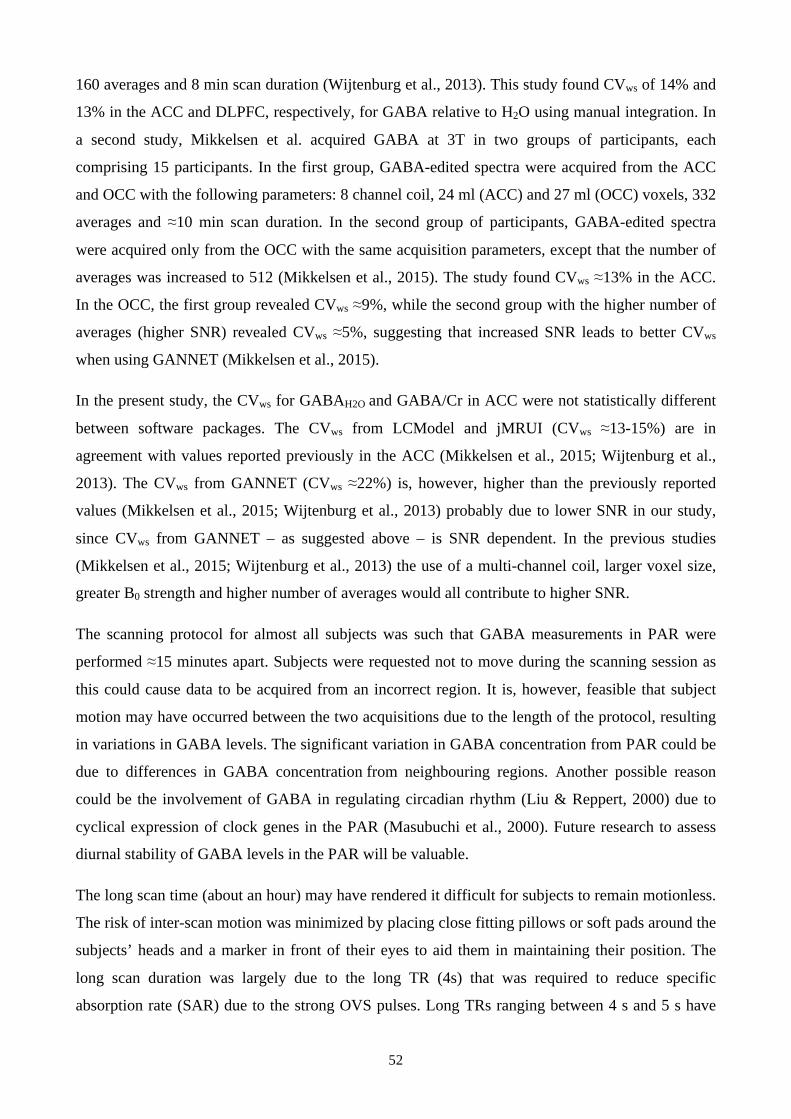
52
160 averages and 8 min scan duration (Wijtenburg et al., 2013). This study found CVws of 14% and
13% in the ACC and DLPFC, respectively, for GABA relative to H2O using manual integration. In
a second study, Mikkelsen et al. acquired GABA at 3T in two groups of participants, each
comprising 15 participants. In the first group, GABA-edited spectra were acquired from the ACC
and OCC with the following parameters: 8 channel coil, 24 ml (ACC) and 27 ml (OCC) voxels, 332
averages and ≈10 min scan duration. In the second group of participants, GABA-edited spectra
were acquired only from the OCC with the same acquisition parameters, except that the number of
averages was increased to 512 (Mikkelsen et al., 2015). The study found CVws ≈13% in the ACC.
In the OCC, the first group revealed CVws ≈9%, while the second group with the higher number of
averages (higher SNR) revealed CVws ≈5%, suggesting that increased SNR leads to better CVws
when using GANNET (Mikkelsen et al., 2015).
In the present study, the CVws for GABAH2O and GABA/Cr in ACC were not statistically different
between software packages. The CVws from LCModel and jMRUI (CVws ≈13-15%) are in
agreement with values reported previously in the ACC (Mikkelsen et al., 2015; Wijtenburg et al.,
2013). The CVws from GANNET (CVws ≈22%) is, however, higher than the previously reported
values (Mikkelsen et al., 2015; Wijtenburg et al., 2013) probably due to lower SNR in our study,
since CVws from GANNET – as suggested above – is SNR dependent. In the previous studies
(Mikkelsen et al., 2015; Wijtenburg et al., 2013) the use of a multi-channel coil, larger voxel size,
greater B0 strength and higher number of averages would all contribute to higher SNR.
The scanning protocol for almost all subjects was such that GABA measurements in PAR were
performed ≈15 minutes apart. Subjects were requested not to move during the scanning session as
this could cause data to be acquired from an incorrect region. It is, however, feasible that subject
motion may have occurred between the two acquisitions due to the length of the protocol, resulting
in variations in GABA levels. The significant variation in GABA concentration from PAR could be
due to differences in GABA concentration from neighbouring regions. Another possible reason
could be the involvement of GABA in regulating circadian rhythm (Liu & Reppert, 2000) due to
cyclical expression of clock genes in the PAR (Masubuchi et al., 2000). Future research to assess
diurnal stability of GABA levels in the PAR will be valuable.
The long scan time (about an hour) may have rendered it difficult for subjects to remain motionless.
The risk of inter-scan motion was minimized by placing close fitting pillows or soft pads around the
subjects’ heads and a marker in front of their eyes to aid them in maintaining their position. The
long scan duration was largely due to the long TR (4s) that was required to reduce specific
absorption rate (SAR) due to the strong OVS pulses. Long TRs ranging between 4 s and 5 s have

53
been implemented successfully in previous studies and have been shown to result in improved SNR
(Puts et al., 2013; Saleh et al., 2016).
4.6 CONCLUSION GABA concentrations are reproducible (CVws: ≈13-22%) using a shim and motion corrected
MEGA-SPECIAL sequence with three different software packages in both the ACC and PAR,
using either absolute concentrations or ratios relative to Cr. GABA levels were, however,
significantly lower for the second measurements in PAR. This study shows the potential of
quantifying pure GABA using any of the three available software packages to determine its
relationship with pathology and healthy behaviour.
4.7 ACKNOWLEDGEMENTS Support was provided by the NRF/DST South African Research Chairs Initiative, NIH grant
R01HD071664 and the South African Medical Research Council (MRC).

54
Chapter 5 Effects of Tissue and Gender on
Macromolecule suppressed GABA acquired by Motion
and Shim navigated MEGA-SPECIAL1 Muhammad G. Saleh2, Jamie Near3, A. Alhamud2, André J.W. van der Kouwe4, Ernesta M.
Meintjes2
5.1 ABSTRACT The aims of this study are to implement a motion and shim navigated MEGA-SPECIAL sequence
to determine the ratio of grey to white matter (GM/WM) concentration of GABA and compare with
literature values, and to investigate gender-related differences in GABA in healthy subjects. 20
healthy subjects were scanned. For every subject, two acquisitions were performed for each of two
regions, the anterior cingulate cortex (ACC) and medial-parietal cortex (PAR), with the order
interleaved. Absolute GABA (GABAH2O) and GABA/Cr concentrations were measured using
LCModel. LCModel fitting revealed an overall average Cramer-Rao Lower Bound ≈10%. The
GM/WM concentrations of GABAH2O and GABA/Cr were 3 and 1.5, respectively, in agreement
with literature. The ACC revealed no gender-related differences in GABA. The PAR revealed time-
related changes in concentrations of GABA in male participants and thus gender-related
differences. The higher GM/WM concentrations of GABA found in this study and literature might
be reflective of heterogeneous distribution of GABA around the brain. The gender- and time-related
differences in the PAR emphasize that gender- and time-matching are critical for GABA scans.
5.2 INTRODUCTION γ-aminobutyric acid (GABA) is the primary inhibitory neurotransmitter accounting for almost half
of synaptic activity. Measuring GABA is becoming increasingly important due to its relationship
with several neurological conditions, including epilepsy (Yamamoto et al., 1985), motor disorders
(Jacobson et al., 2011), alcohol and drug abuse (Ticku, 1990) and diseases (Bai et al., 2014; Wong
et al., 2003). GABA concentrations are also correlated with changes in blood-oxygen level
dependent (BOLD) functional magnetic resonance imaging (fMRI) and cerebral blood flow (CBF)-
weighted arterial spin labelling (ASL) (Donahue et al., 2010; A. D. Harris et al., 2015;
1 Chapter written as an article intended for review and publication 2 University of Cape Town 3 McGill University 4 Massachusetts General Hospital, Harvard Medical School
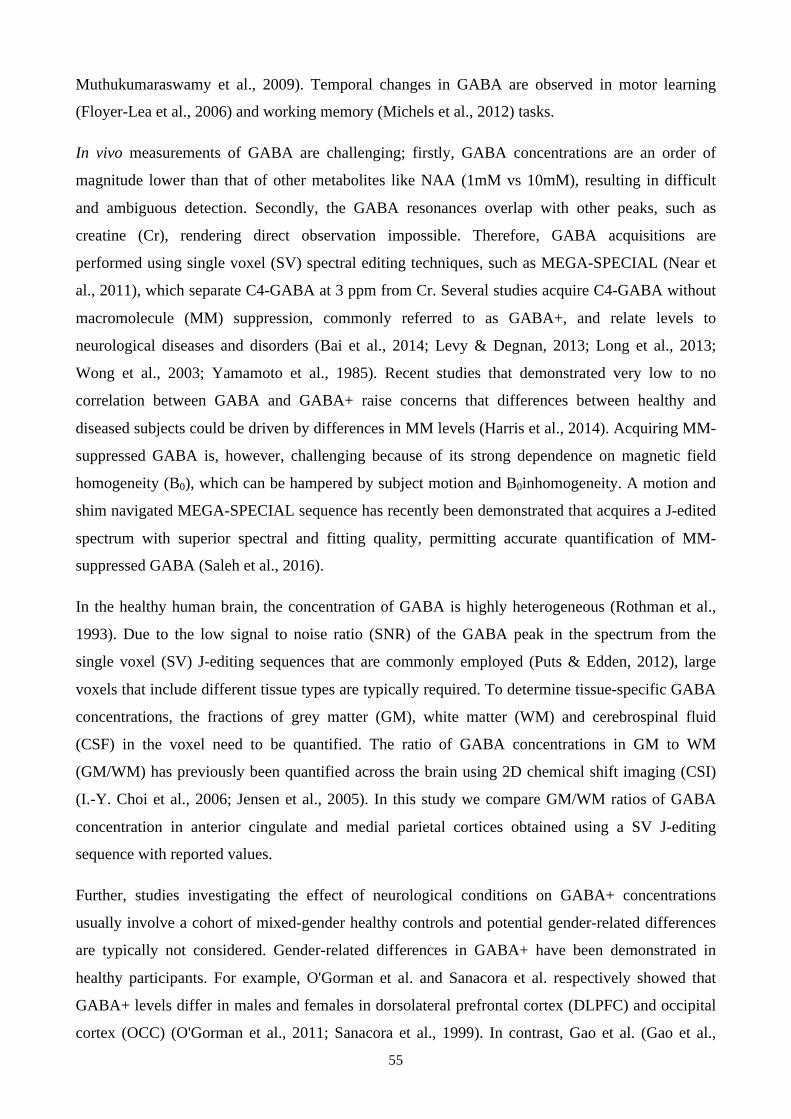
55
Muthukumaraswamy et al., 2009). Temporal changes in GABA are observed in motor learning
(Floyer-Lea et al., 2006) and working memory (Michels et al., 2012) tasks.
In vivo measurements of GABA are challenging; firstly, GABA concentrations are an order of
magnitude lower than that of other metabolites like NAA (1mM vs 10mM), resulting in difficult
and ambiguous detection. Secondly, the GABA resonances overlap with other peaks, such as
creatine (Cr), rendering direct observation impossible. Therefore, GABA acquisitions are
performed using single voxel (SV) spectral editing techniques, such as MEGA-SPECIAL (Near et
al., 2011), which separate C4-GABA at 3 ppm from Cr. Several studies acquire C4-GABA without
macromolecule (MM) suppression, commonly referred to as GABA+, and relate levels to
neurological diseases and disorders (Bai et al., 2014; Levy & Degnan, 2013; Long et al., 2013;
Wong et al., 2003; Yamamoto et al., 1985). Recent studies that demonstrated very low to no
correlation between GABA and GABA+ raise concerns that differences between healthy and
diseased subjects could be driven by differences in MM levels (Harris et al., 2014). Acquiring MM-
suppressed GABA is, however, challenging because of its strong dependence on magnetic field
homogeneity (B0), which can be hampered by subject motion and B0inhomogeneity. A motion and
shim navigated MEGA-SPECIAL sequence has recently been demonstrated that acquires a J-edited
spectrum with superior spectral and fitting quality, permitting accurate quantification of MM-
suppressed GABA (Saleh et al., 2016).
In the healthy human brain, the concentration of GABA is highly heterogeneous (Rothman et al.,
1993). Due to the low signal to noise ratio (SNR) of the GABA peak in the spectrum from the
single voxel (SV) J-editing sequences that are commonly employed (Puts & Edden, 2012), large
voxels that include different tissue types are typically required. To determine tissue-specific GABA
concentrations, the fractions of grey matter (GM), white matter (WM) and cerebrospinal fluid
(CSF) in the voxel need to be quantified. The ratio of GABA concentrations in GM to WM
(GM/WM) has previously been quantified across the brain using 2D chemical shift imaging (CSI)
(I.-Y. Choi et al., 2006; Jensen et al., 2005). In this study we compare GM/WM ratios of GABA
concentration in anterior cingulate and medial parietal cortices obtained using a SV J-editing
sequence with reported values.
Further, studies investigating the effect of neurological conditions on GABA+ concentrations
usually involve a cohort of mixed-gender healthy controls and potential gender-related differences
are typically not considered. Gender-related differences in GABA+ have been demonstrated in
healthy participants. For example, O'Gorman et al. and Sanacora et al. respectively showed that
GABA+ levels differ in males and females in dorsolateral prefrontal cortex (DLPFC) and occipital
cortex (OCC) (O'Gorman et al., 2011; Sanacora et al., 1999). In contrast, Gao et al. (Gao et al.,

56
2013) found no gender differences in GABA+ in anterior cingulate and medial parietal regions.
These differences may be due to regional variations in GABA+. The fact that the relative
contribution of MM to the total GABA+ signal varies from 40% to 60% in individuals (Harris et al.,
2014; Near et al., 2011), and may differ in different regions, may further impact the results
(O'Gorman et al., 2011; Sanacora et al., 1999). To date, only one study has investigated gender-
related differences in MM-suppressed GABA and only in one region (Aufhaus et al., 2013). The
absence of gender differences in GABA in the anterior cingulate cortex found in that study
(Aufhaus et al., 2013) needs to be validated and it is required to establish whether this result persists
over different brain regions.
The aims of this study were therefore to use a motion and shim navigated MEGA-SPECIAL
sequence (i) to determine in anterior cingulate and medial parietal regions the relative concentration
of GABA in GM compared to WM (for both water and Cr internal references), and (ii) to
investigate gender differences in GABA levels in healthy subjects in both these regions.
5.3 METHODS All protocols and experiments were approved by the Human Research Ethics Committee of the
Faculty of Health Sciences at the University of Cape Town and written informed consent was
obtained from all subjects. All MRI/MRS experiments were performed on a Siemens Allegra 3 T
scanner (Erlangen, Germany) using a single channel transmit/receive (T/R) volumetric coil.
5.3.1 Subjects
20 healthy subjects (10 female; age: 23 ± 2 years (mean ± SD)) were recruited for the study, with
no history of neurological or psychiatric disorders. Two J-edited spectra were acquired from each of
two regions(Figure 5.1), the anterior cingulate cortex (ACC) and medial-parietal cortex (PAR), with
the order interleaved.

57
Figure 5.1: Voxel localization on T1 structural image for (a) anterior cingulate cortex (ACC) and (b) medial parietal cortex (PAR). The acquisitions were performed in an interleaved manner. A: Anterior. P: Posterior. R:
Right. L: Left.
5.3.2 MR imaging and MR spectroscopy acquisition
Prior to voxel placement, three-dimensional (3D) T1-weighted sagittal scans of the subjects’ brains
were acquired using MEMPRAGE (van der Kouwe et al., 2008) with 1.3 × 1.0 × 1.0 mm3
resolution for accurate voxel placement.
The C4-GABA edited spectra were derived from the motion and shim navigated MEGA-SPECIAL
sequence without MM contamination, as explained previously (Saleh et al., 2016). Briefly, there are
two iterations of MEGA-editing. In the first iteration, the editing-band is applied to the C3-GABA
resonance at 1.9 ppm (edit-on), while in the second iteration the editing-band is applied at 1.5 ppm
(edit-off). The water suppression band of the dual-banded editing pulses was always applied at 4.7
ppm.
The MEGA-SPECIAL parameters were as follows: TR/TE 4000/68 ms, bandwidth 2 kHz, 160
averages, 2048 readout samples and four dummy scans; scan duration 11 min. The voxel sizes
were: ACC: 20 × 30 × 40 mm3 and PAR: 30 × 30 × 30 mm3, respectively. Prior to all acquisitions,
outer volume suppression (OVS) pulses were applied to saturate spins outside the VOI (Near et al.,
2011). Finally, water unsuppressed data with four averages were acquired from every region.
5.3.3 Post-processing
The T1 images of every subject were segmented using SPM12’s New Segment (Ashburner &
Friston, 2005). Subsequently, the segmented images were multiplied by a mask representing the

58
voxel to determine fractions of GM (fGM), WM (fWM), and CSF (fCSF) in the voxel and to compute
GM ratio (GMratio), defined as the fraction of brain tissue that is GM (GMratio=fGM/(fGM+fWM)).
5.3.3.1 Frequency and Phase correction The subspectra from interleaved SPECIAL inversion-on/off acquisitions were subtracted resulting
in edit-on/off spectra. The motion corrupted edit-on/off spectra were removed as described
previously (Saleh et al., 2016). Subsequently, eddy current correction (Klose, 1990) was applied,
followed by frequency correction using the position of the Cr peak to reduce line broadening arising
from minor frequency drifts, as described previously (Fuchs et al., 2013). The averaged edit-on and
edit-off spectra were manually frequency aligned and phase adjusted to minimize the choline
difference signal (Near et al., 2014). This was followed by removal of residual water (A. Hess et al.,
2014) and DC offset (Stagg et al., 2009; Zhu et al., 2011). Two ACC and two PAR spectra were
rejected from both males and females due to a large residual choline artefact. Finally, fully
processed edit-on/off spectra were subtracted to generate GABA-edited spectra (Figure 5.2).
5.3.3.2 Spectral Analysis The GABA-edited spectra were analysed using LCModel version 6.3-1E (Provencher, 2001) using
a simulated basis set (Figure 5.3) that was generated by FID-A toolbox (O'Gorman et al., 2007).
Tissue water (H2O) and total creatine (Cr: creatine + phosphocreatine) were used as internal
concentration references. Water concentration (WCONC) along with partial volume correction
(Provencher, 2005) was estimated using
𝑊𝐶𝑂𝑁𝐶 = !""##!!" !!"##$!!" !!!!!"!!"# !!!!"#
where fGM is the fraction of grey matter, fWM is the fraction of white matter, and fCSF is the fraction
of CSF. Absolute concentrations of GABA (GABAH2O) and total creatine (CrH2O) were determined.
Absolute concentrations are reported in institutional units (i.u). GABA/Cr is defined here as the
ratio of the absolute concentration of GABA (GABAH2O) from the edited spectrum to the absolute
concentration of creatine (CrH2O) from the edit-off spectrum. All concentrations and ratios were
corrected for T1 and T2 relaxation effects using published values (R. Edden, Intrapiromkul, et al.,
2012; Mlynárik et al., 2001; Puts et al., 2013). Cramer-Rao Lower Bounds (CRLB) from LCModel
were used as a measure of spectral quality and GABA fit error.
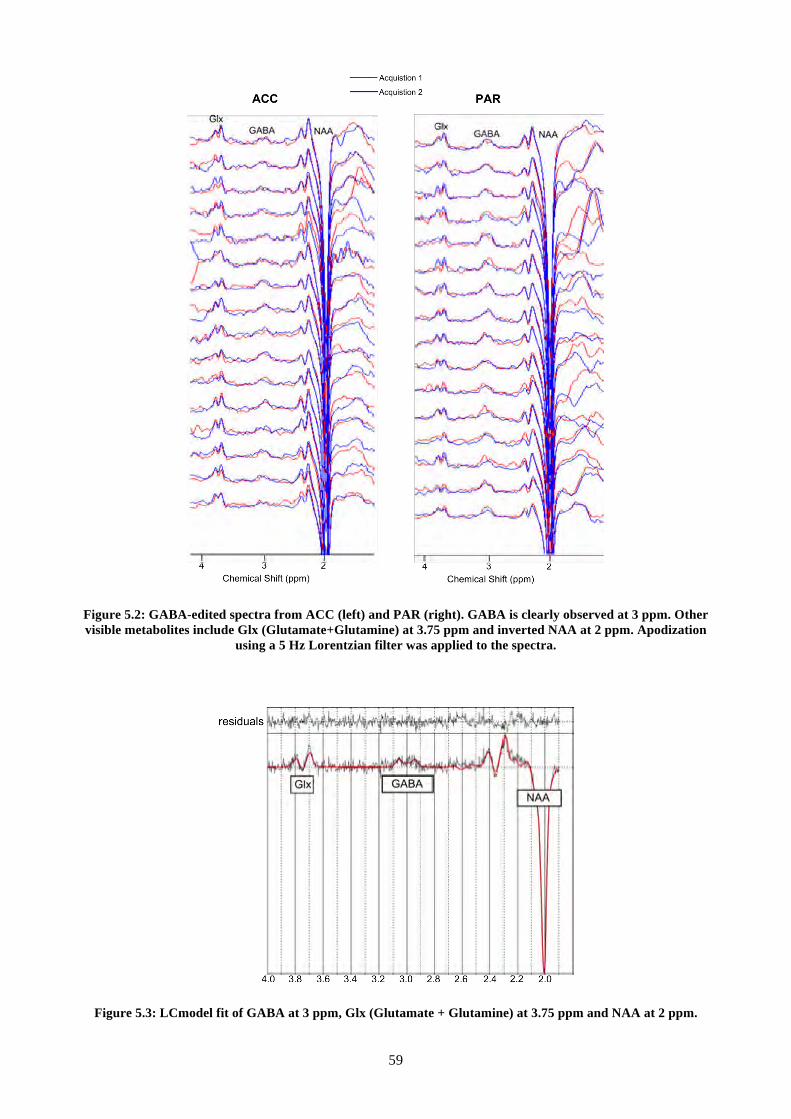
59
Figure 5.2: GABA-edited spectra from ACC (left) and PAR (right). GABA is clearly observed at 3 ppm. Other visible metabolites include Glx (Glutamate+Glutamine) at 3.75 ppm and inverted NAA at 2 ppm. Apodization
using a 5 Hz Lorentzian filter was applied to the spectra.
Figure 5.3: LCmodel fit of GABA at 3 ppm, Glx (Glutamate + Glutamine) at 3.75 ppm and NAA at 2 ppm.

60
5.3.4 Statistical analysis
All measures were normally distributed (Shapiro-Wilk test), except for GABAH2O and GABA/Cr in
the ACC. Non-normally distributed data were inverted (1/GABAH2O and 1/(GABA/Cr)) following
the procedure described in (Pallant, 2001).
5.3.4.1 GABA levels for pure GM and WM fGM, fWM, fCSF and GMratio were averaged in each region, as well as for males and females separately
in each region. Gender-related differences were examined in each brain region using unpaired t-
tests with unequal variance assumed.
Pearson correlation was used to examine associations between levels of GABAH2O or GABA/Cr
and GMratio. Data from all acquisitions for all participants and in both regions were used for this
analysis. Linear regression analysis was performed to determine GM and WM concentrations of
GABAH2O and GABA/Cr, as shown in previous works (C. Choi et al., 2007; I.-Y. Choi et al., 2006;
Jensen et al., 2005). The levels of GABAH2O and GABA/Cr in pure GM and WM were estimated by
plotting GABAH2O and GABA/Cr against GMratio and fitting a linear least squares line. The pure
GM and WM concentrations of GABAH2O and GABA/Cr were then estimated by extrapolating the
regression line to GMratio equal to 1 and 0, respectively.
5.3.4.2 Effects of Gender and Time on GABA levels Gender-related differences in GABAH2O and GABA/Cr were examined using two-way analysis of
variance (ANOVA) for repeated measures (SPSS 22 software package), with time as the repeated
measure. Post hoc tests with Bonferroni correction were performed to compare effects of time and
gender on GABAH2O and GABA/Cr.
Unless stated otherwise, all values are henceforth reported as mean ± standard error of mean (SEM)
and the error bars represent ± SEM.
5.4 RESULTS A total of 64 spectra were analysed, 32 from male and 32 from female participants, of which half
were in the ACC and half in the PAR. Figure 5.2 shows the J-edited spectra from the two
acquisitions performed in each participant for ACC and PAR. Figure 5.3 shows a typical LCModel
fit of the J-edited spectrum. Low residuals indicate a good fit. Moreover, average CRLB from male
and female participants were not significantly different for both ACC (male: 9.8 ± 0.3% and female:
10.6 ± 0.6%, p = 0.28) and PAR (male: 8.6 ± 0.3% and female: 9.3 ± 0.3%, p = 0.19).
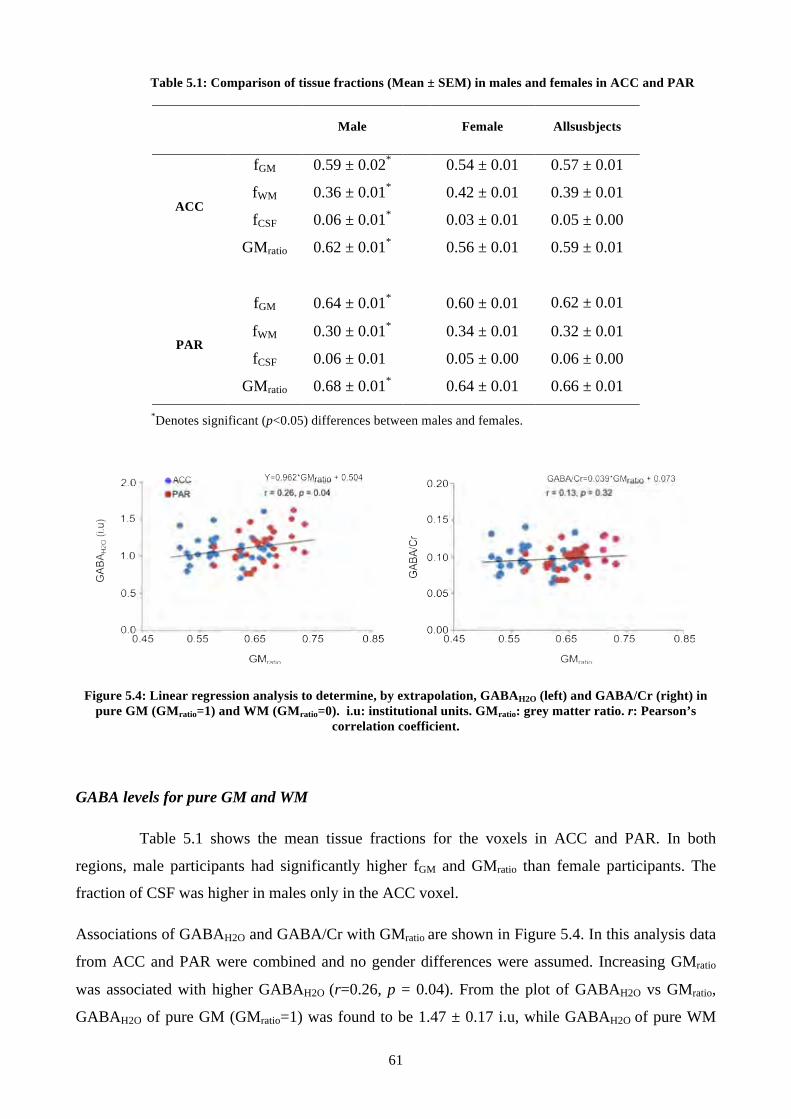
61
Table 5.1: Comparison of tissue fractions (Mean ± SEM) in males and females in ACC and PAR
*Denotes significant (p<0.05) differences between males and females.
Figure 5.4: Linear regression analysis to determine, by extrapolation, GABAH2O (left) and GABA/Cr (right) in pure GM (GMratio=1) and WM (GMratio=0). i.u: institutional units. GMratio: grey matter ratio. r: Pearson’s
correlation coefficient.
GABA levels for pure GM and WM
Table 5.1 shows the mean tissue fractions for the voxels in ACC and PAR. In both
regions, male participants had significantly higher fGM and GMratio than female participants. The
fraction of CSF was higher in males only in the ACC voxel.
Associations of GABAH2O and GABA/Cr with GMratio are shown in Figure 5.4. In this analysis data
from ACC and PAR were combined and no gender differences were assumed. Increasing GMratio
was associated with higher GABAH2O (r=0.26, p = 0.04). From the plot of GABAH2O vs GMratio,
GABAH2O of pure GM (GMratio=1) was found to be 1.47 ± 0.17 i.u, while GABAH2O of pure WM
Male
Female Allsusbjects
ACC
fGM 0.59 ± 0.02*
0.54 ± 0.01 0.57 ± 0.01
fWM 0.36 ± 0.01* 0.42 ± 0.01 0.39 ± 0.01
fCSF 0.06 ± 0.01* 0.03 ± 0.01 0.05 ± 0.00
GMratio 0.62 ± 0.01* 0.56 ± 0.01 0.59 ± 0.01
PAR
fGM 0.64 ± 0.01*
0.60 ± 0.01 0.62 ± 0.01
fWM 0.30 ± 0.01* 0.34 ± 0.01 0.32 ± 0.01
fCSF 0.06 ± 0.01 0.05 ± 0.00 0.06 ± 0.00
GMratio 0.68 ± 0.01* 0.64 ± 0.01 0.66 ± 0.01

62
(GMratio= 0) was 0.50 ± 0.28 i.u. Similarly, GABA/Cr of pure GM was found to be 0.112 ± 0.015,
while GABA/Cr of pure WM was 0.073 ± 0.024. These results yield GM to WM ratios (GM/WM)
for GABAH2O and GABA/Cr of 2.94 and 1.53, respectively.
Effects of Gender and Time on GABA levels
In the ACC, there were no statistically significant differences in GABAH2O (male: 1.14 ± 0.07 i.u vs
female:1.02 ± 0.06 i.u, F(1,14) = 3.38, p= 0.09) or GABA/Cr (male: 0.101 ± 0.006 vs female:
0.092 ± 0.006, F(1,14) = 2.31, p= 0.15) between male and female participants. In contrast, in PAR
both GABAH2O (male: 1.23 ± 0.08 i.u vs female: 1.04 ± 0.06 i.u, F(1,14) = 8.99, p = 0.01) and
GABA/Cr (male: 0.104 ± 0.007 vs female: 0.091 ± 0.005, F(1,14) = 5.58, p = 0.03) were
significantly higher in males compared to females.
The effect of time (Acquisition 1 (Acq 1) vs Acquisition 2 (Acq 2)) on GABAH2O and GABA/Cr
was examined in both regions. In the ACC, there was no effect of time for GABAH2O (F(1,14) =
0.01, p = 0.93) or GABA/Cr (F(1,14) = 0.05, p = 0.83), while in PAR there was a significant effect
of time for both GABAH2O (F(1,14) = 17.84, p< 0.01) and GABA/Cr (F(1,14) = 15.40, p< 0.01).
Figure 5.5a shows estimated marginal means of GABAH2O and GABA/Cr in PAR for each
acquisition, revealing significantly larger gender-related differences in both GABAH2O (male: 1.39
± 0.05 vs female: 1.08 ± 0.06, p < 0.01) and GABA/Cr (male: 0.12 ± 0.01 vs female: 0.09 ± 0.01, p
< 0.01) for the first acquisition compared to the second acquisition. Figure 5.5b shows for males
and females separately how GABAH2O and GABA/Cr levels differ between the first and second
acquisitions in PAR. Post hoc tests using Bonferroni correction revealed that GABAH2O (Acq 1:
1.39 ± 0.05 vs Acq 2: 1.07 ± 0.06, p(Bonf)< 0.01) and GABA/Cr (Acq 1: 0.117 ± 0.005 vs Acq 2:
0.094 ± 0.005, p(Bonf)< 0.01) differ significantly between acquisitions in the male participants
only.
5.5 DISCUSSION Several studies have acquired GABA from different brain regions using 2D J-resolved chemical
shift imaging (CSI), multiple quantum filtering (MQF) CSI and single voxel (SV) J-editing
techniques (Bhattacharyya et al., 2011; I.-Y. Choi et al., 2006; Jensen et al., 2005). The J-editing
SV sequences (SVS) are widely implemented due to conceptual simplicity and ease of
implementation (Puts & Edden, 2012). However, acquiring GABA without MM is challenging as it
requires editing pulses to be consistently applied symmetrically about 1.7 ppm to adequately
suppress MM, which can be hampered by subject motion and B0 inhomogeneity. The other possible
means of removing MM is by subtracting MM – attained by a separate metabolite nulled scan using
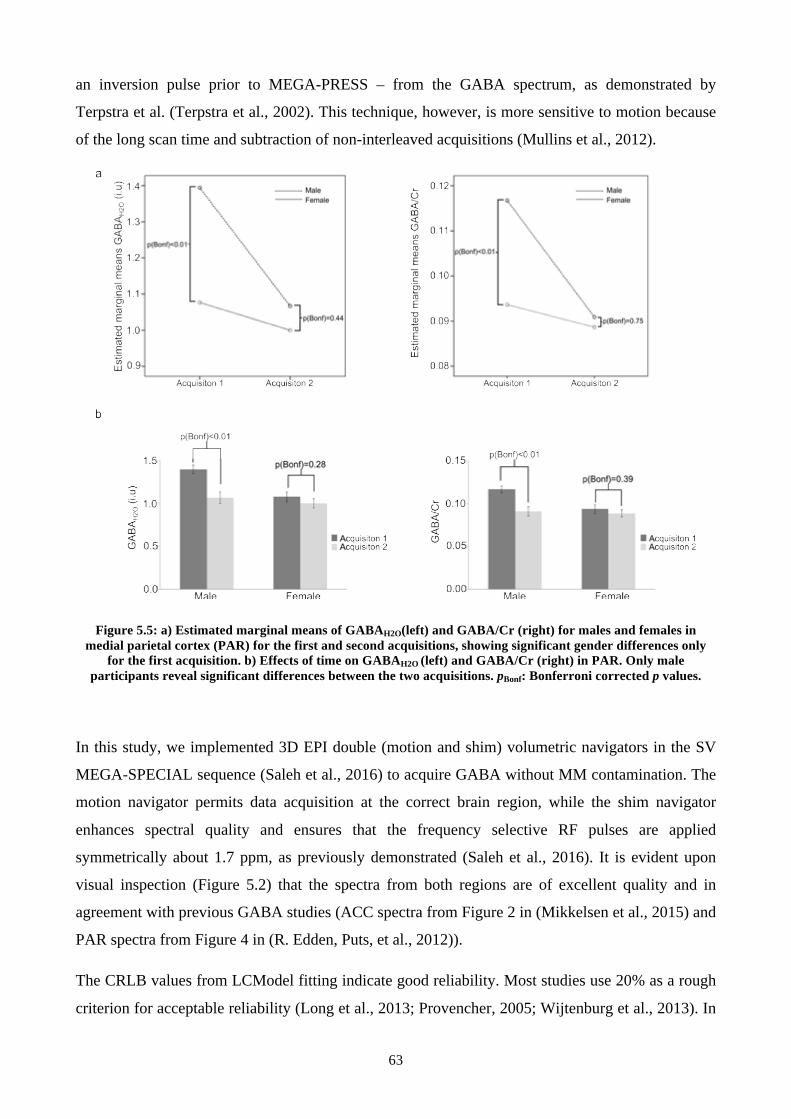
63
an inversion pulse prior to MEGA-PRESS – from the GABA spectrum, as demonstrated by
Terpstra et al. (Terpstra et al., 2002). This technique, however, is more sensitive to motion because
of the long scan time and subtraction of non-interleaved acquisitions (Mullins et al., 2012).
Figure 5.5: a) Estimated marginal means of GABAH2O(left) and GABA/Cr (right) for males and females in medial parietal cortex (PAR) for the first and second acquisitions, showing significant gender differences only
for the first acquisition. b) Effects of time on GABAH2O (left) and GABA/Cr (right) in PAR. Only male participants reveal significant differences between the two acquisitions. pBonf: Bonferroni corrected p values.
In this study, we implemented 3D EPI double (motion and shim) volumetric navigators in the SV
MEGA-SPECIAL sequence (Saleh et al., 2016) to acquire GABA without MM contamination. The
motion navigator permits data acquisition at the correct brain region, while the shim navigator
enhances spectral quality and ensures that the frequency selective RF pulses are applied
symmetrically about 1.7 ppm, as previously demonstrated (Saleh et al., 2016). It is evident upon
visual inspection (Figure 5.2) that the spectra from both regions are of excellent quality and in
agreement with previous GABA studies (ACC spectra from Figure 2 in (Mikkelsen et al., 2015) and
PAR spectra from Figure 4 in (R. Edden, Puts, et al., 2012)).
The CRLB values from LCModel fitting indicate good reliability. Most studies use 20% as a rough
criterion for acceptable reliability (Long et al., 2013; Provencher, 2005; Wijtenburg et al., 2013). In

64
our study, the maximum and overall average CRLB’s are 15% and 10%, respectively. Both are well
below the criterion and in agreement with values that have been reported in previous studies (Long
et al., 2013; Wijtenburg et al., 2013).
In this study, linear regression analysis was employed to determine GABA concentrations in GM
and WM. This method for extrapolating metabolite concentrations of pure GM (GMratio= 1) and
WM (GMratio = 0) has been demonstrated in previous studies using CSI (I.-Y. Choi et al., 2006;
Gasparovic et al., 2006; Jensen et al., 2005). The major benefit of CSI over SV spectroscopy (SVS)
is that the former acquires a large number of data points (one per voxel) from a single acquisition
compared to SVS and is therefore less susceptible to error. In our study, we performed repeated
measures (4 per subject) to obtain sufficient data to effectively perform the analysis. For example,
Jensen et al. performed the analysis using 68 data points (voxels) compared to the 64 data points in
our study (Jensen et al., 2005).
I-Y Choi et al., through structural image based segmentation and non-linear least square fitting,
reported about eight-fold higher GABAH2O (GM: 1.30 ± 0.36 mM vs WM: 0.16 ± 0.16 mM) and
about five-fold higher GABA/Cr (GM: 0.16 ± 0.04 vs WM: 0.03 ± 0.03) in GM relative to WM
across prefrontal and parietal regions using MQF CSI (I.-Y. Choi et al., 2006). Jensen et al.,
reported 2-fold higher GABAH2O (GM: 0.96 ± 0.24 mM vs WM: 0.44 ± 0.16 mM) in GM than WM
across dorsolateral prefrontal and parieto-occipital regions using 2D J-resolved CSI (Jensen et al.,
2005). The GM and WM concentrations of GABAH2O in Jensen et al., (Jensen et al., 2005) were
derived from multiplying GM GABA/Cr with literature values of GM CrH2O (8.3 mM) and WM
GABA/Cr with literature values of WM CrH2O (6.5 mM). Using this method with values for
GABA/Cr in GM and WM from our study, yields a GM to WM ratio for GABAH2O of 1.7, which is
comparable with the value of 2 reported by Jensen et al. C Choi et al. reported that GABAH2O levels
in GM were about 3 times higher than in WM (GM: 1.1 ± 0.1 mM vs WM: 0.4 ± 0.1 mM) in
prefrontal and left frontal cortices using SV localized double quantum filtering (DQF) (C. Choi et
al., 2007).
Our study yielded three-fold higher GABAH2O in GM relative to WM, which is in close agreement
with C Choi et al. (C. Choi et al., 2007), while GABA/Cr was about 1.5 times higher in GM
compared to WM, similar to values reported by Jensen et al. (Jensen et al., 2005). Notably the latter
agreement gets even better when using the method performed by Jensen et al. (Jensen et al., 2005)
to derive GABAH2O in GM and WM, respectively. Caution should be taken when comparing results
with those from literature as differences in approach could affect these. For example, the relatively
larger GM GABAH2O and GABA/Cr found by I-Y Choi et al. (I.-Y. Choi et al., 2006) could be due
to the non-linear least square estimation of the non-linear model implemented, in contrast with the
65
non-linear least square estimation of the linear model implemented here. Another possible reason
could be the larger field of view chosen in their study (I.-Y. Choi et al., 2006) that encompassed
brain regions, such as sensorimotor cortex (Bhattacharyya et al., 2011), with higher levels of GABA
in GM relative to WM. Overall, the higher GABAH2O and GABA/Cr in GM found in the two
regions examined in our study along with the disparate results from literature (C. Choi et al., 2007;
I.-Y. Choi et al., 2006; Jensen et al., 2005) reflect the highly heterogeneous distribution of GABA
in the human brain (Rothman et al., 1993).
Due to the low SNR of GABA, the SV sequences usually acquire data from large voxels of interest
(VOI) inevitably comprising all tissue types (GM, WM, CSF). Acquiring data from any group of
participants will most likely result in some degree of variation in tissue fractions. Given the
aforementioned differences in GM and WM concentrations of GABA, the variations in tissue
fractions would result in variances in GABA concentrations and could impact GABA-based
evaluation of disease (A. Harris et al., 2015). Recently, Harris et al. demonstrated effects of
differences in tissue fractions on GABA+H2O and developed a new technique involving a correction
factor (α) – defined as the ratio of GABA+H2O in WM to GM – to minimize the dependence of
GABA+H2O on tissue fractions (A. Harris et al., 2015). Harris et al. suggested an α value of 0.43
deduced using in vivo measurements of GABA+H2O in the OCC, DLPFC, sensorimotor cortex
(SMC), frontal eye fields and auditory cortex (A. Harris et al., 2015). In this study, we suggest an α
value of 0.34 - the ratio of GABAH2O in WM to GM – to adjust GABAH2O to correct for different
tissue fractions.
While GABAH2O was associated with GMratio, GABA/Cr was not. However, CrH2O was found to be
strongly associated with GMratio (r = 0.53, p < 0.01) and was about 1.6-fold higher in GM (GM:
13.20 ± 0.37 i.u vs WM: 8.38 ± 0.61 i.u) than in WM, similar to results of a previous study
(Gasparovic et al., 2006). Since both GABAH2O and CrH2O were independently related to GMratio,
the ratio of GABAH2O to CrH2O would reduce the dependence on GMratio. This is also reflected by
the reduction in GM/WM concentrations of GABA/Cr to 1.5 from 3 for GABAH2O. Since
GABA/Cr is independent of GMratio,Cr may be a suitable internal reference in MRS studies (Puts &
Edden, 2012). This may, however, not be ideal for some neurological studies (Gruber et al., 2003),
and thus GABAH2O can be used in such cases along with the aforementioned tissue correction
technique (A. Harris et al., 2015).
Several studies have performed GABA-based evaluation of neurological conditions through
GABA+ measurements (Levy & Degnan, 2013). The weak to no correlation between GABA+ and
GABA could be due to the problems related with the MM suppression technique. This also suggests
that GABA+ cannot be used as a substitute for underlying GABA (Harris et al., 2014; Mikkelsen et
66
al., 2015). Furthermore, observed gender-related differences in GABA+ (O'Gorman et al., 2011;
Sanacora et al., 1999) may be attributable to varying levels of MM (≈40-60%) in individuals (Harris
et al., 2014; Near et al., 2011). To our knowledge, only one study has examined gender differences
in MM-suppressed GABA in only one region, namely ACC. This study found no gender-related
differences (Aufhaus et al., 2013).
In our study we also found no gender differences in GABA in the ACC. In contrast, males had
higher GABA and GABA/Cr in PAR. These results, together with those from previous studies
showing gender-related differences in GABA+ in the DLPFC and OCC (O'Gorman et al., 2011;
Sanacora et al., 1999), provide evidence that effects of gender on GABA levels may vary
regionally. Furthermore, the fact that gender-related differences have been observed in both
GABA+ and GABA may indicate that contributions from MM are similar in males and females so
that gender differences are not impacted. Future research assessing the levels of MM in different
regions of the brain in both male and female participants is necessary.
Since each acquisition was repeated twice in each subject in our study (with the start of repeated
acquisitions separated by about 15 minutes), we performed ANOVA with repeated measures to
examine gender effects. Notably, there was an effect of time only in males and only in PAR. The
absence of an effect of time in ACC suggests concentrations of GABA in ACC are stable over time
in both male and female participants. In contrast, GABA levels in PAR were stable over time in
females, while concentrations in males decreased significantly from the first to the second
acquisition, with GABA levels for the second acquisition being similar to those of females. This
lack of stability in GABA levels in PAR in males does not appear to be due to dissimilar tissue
fractions between genders or regions, since tissue fractions between males and females differed
significantly in both ACC and PAR, and GMratio’s were higher in PAR for both sexes (
Table 5.1).
The neurophysiological reasons for the decreasing GABA levels with time in males in PAR are not
yet fully understood. Neuroactive steroids, including ovary-produced progesterone and testis-
produced testosterone, are known to have modulatory effects on the release of neurotransmitters,
including GABA (Zheng, 2009). The mechanisms by which the modulatory effects occur are
complex and may depend on many factors, including type of neuroactive steroids, and may vary by
region (Zheng, 2009). The observed effect of time on gender differences could be due to the
neuroactive steroidal-related modulation of GABA, however further studies are needed to
determine correlation between concentrations of GABA and plasma hormone levels.

67
Another possible reason could be the involvement of GABA in regulating circadian rhythm (Liu &
Reppert, 2000) due to the presence of clock genes in the parietal cortex (Masubuchi et al., 2000).
Duffy et al. demonstrated using measurements of core body temperature and plasma melatonin that
the intrinsic circadian period is significantly shorter in women than in men (Duffy et al., 2011).
This difference may explain the absence in females of the changes in GABA levels observed in
males with time. In the present study, these time-related changes in GABA levels were observed
over a period of about 40 minutes. It is possible that GABA levels may be stable at certain times of
day, as demonstrated previously for GABA+ in OCC and SMC (Evans et al., 2010).
Given the neuroactive steroidal-related modulation of GABA, GABA-based regulation of circadian
rhythm and gender-related differences in circadian rhythm, it would be beneficial to investigate
diurnal stability of GABA along with plasma hormone levels in both male and female participants
in future research. The diurnal measurements of GABA could provide information as to the time of
day when GABA levels are stable, thus facilitating investigations of alterations in GABA associated
with neurological conditions.
The scanning protocol for almost all subjects was such that GABA measurements in PAR were
performed ≈15 min apart. Subjects were requested not to move during the scanning session as this
could cause data to be acquired from an incorrect region. It is, however, possible that males are less
able to keep their head still over time, since substantial variation in GABA levels are observed in
male participants only.
It has been shown previously that heating of the iron shim coils throughout gradient-intensive
scanning (such as diffusion tensor imaging or BOLD fMRI) will cause frequency drifts of up to 15
Hz over roughly 6 minutes of scanning, which will increase further over time with repeated
acquisitions (Alhamud et al., 2016; Harris et al., 2013). Since the data acquired in the present scans
were typically not the first scans of the day, it is therefore possible that such heating may have
occurred, resulting in gradient-induced frequency shifts, and that this may be the reason for the
time-changing GABA measurements observed in PAR in males. However, since all participants
(males and females) were scanned in an interleaved manner and the PAR region was scanned
second and last in all subjects (except for two males in whom PAR acquisitions were done before
ACC acquisitions), we do not believe that this is the reason for the observed time-related changes in
GABA levels in males in PAR, since prior heating would have affected the first ACC acquisitions
most severely (Harris et al., 2013). This change in GABA in PAR was also not evident in females
in whom the same scanning order was used. Prospective shim correction employed here would
further ensure correct frequency settings for these acquisitions despite potential drift from heating
of the shim coils (Saleh et al., 2016).
68
Although the outcomes of our study might be limited by small sample size, previous studies
demonstrating tissue-specific concentrations of GABA and effects of gender on GABA used similar
sample sizes (Gasparovic et al., 2006; Jensen et al., 2005; O'Gorman et al., 2011; Sanacora et al.,
1999). In this study, the ACC and PAR regions were selected due to the role of GABA in several
neurological conditions where these regions are implicated (Bai et al., 2014; Puts & Edden, 2012).
Future research should involve other regions of the brain, such as OCC, SMC and DLPFC, due to
their important role in both healthy behaviour and pathology (Puts & Edden, 2012), especially in
view of the fact that alterations in GABA appear to be region specific.
5.6 CONCLUSION The motion and shim navigated MEGA-SPECIAL sequence acquired data with superior quality
from both ACC and PAR regions, allowing us to determine tissue-specific GABAH2O and
GABA/Cr, and to investigate gender-related differences in GABAH2O and GABA/Cr. The higher
GABAH2O and GABA/Cr in GM reflect the heterogeneous distribution of GABA in the brain. The
gender difference in GABA observed in PAR, and how it changes over time, emphasizes the
importance of not only gender- but also time-matching when evaluating changes in GABA in
neurological conditions.
5.7 ACKNOWLEDGEMENTS Support was provided by the NRF/DST South African Research Chairs Initiative, NIH grant
R01HD071664 and the South African Medical Research Council (MRC).

69
Chapter 6 Discussion In this work, we presented a motion and shim corrected MEGA-SPECIAL sequence for accurate
quantification of MM-suppressed GABA. Reproducibility (over a period of about 40 minutes) of
GABA measurements was highest for LCModel processing. GABA levels in ACC did not change
over time, while GABA levels in PAR decreased over time. Although GABA levels did not differ
between males and females in ACC, they were higher in males in PAR. This difference was only
present in the first acquisition, as GABA levels in PAR decreased significantly for the second
acquisition in males only.
GABA is the primary inhibitory neurotransmitter in the brain and accounts for almost half of the
synaptic activity (Levy & Degnan, 2013). Measurement of GABA is becoming increasingly
important due to its link with neurological conditions (Levy & Degnan, 2013; Mullins et al., 2012;
Puts & Edden, 2012). At the University of Cape Town (UCT) there has been a long-standing
interest in studying learning deficits in children with prenatal alcohol exposure and the ability to
measure changes in GABA during learning tasks – such as motor learning (Floyer-Lea et al., 2006)
or eyeblink conditioning (Jacobson et al., 2011) – could provide new insights into the physiological
basis of these learning deficits.
In vivo measurement of GABA is challenging because of the low signal to noise ratio (SNR), and
overlap with macromolecules (MM) and more concentrated metabolites, such as NAA and Cr,
rendering direct observation challenging (Mullins et al., 2012; Puts & Edden, 2012). Consequently,
spectral editing methods, such as MEGA-SPECIAL and MEGA-PRESS (Mescher et al., 1998; Near
et al., 2011), are typically implemented that separate GABA at 3 ppm (C4-GABA) from
overlapping metabolites. Removal of MM is challenging and most studies acquire GABA with
MM, commonly referred to as GABA+ (Mullins et al., 2012; Puts & Edden, 2012). Other
approaches to acquire GABA, such as acquisition at higher field strengths, are not feasible due to
the fact that high-field scanners (> 3 T) are not widely available and have not been optimised for
routine clinical use (Ke et al., 2000).In this study, we implemented an optimised motion and shim
corrected single voxel (SV) MEGA-SPECIAL (Near et al., 2011) sequence and used it to acquire
GABA without MM contamination.
Compared to the more widely used MEGA-PRESS sequence, MEGA-SPECIAL demonstrates
reduced spatial variations within the volume of interest (VOI) and yields a 10% improvement in
editing efficiency of GABA (Near et al., 2011). However, At the same TR, the MEGA-SPECIAL
70
sequence requires twice the time to localize a VOI compared to MEGA-PRESS ((Near et al.,
2011)), rendering it more sensitive to subject motion. Since the GABA signal suffers from low
SNR, a large number of measurements are required, further increasing the scan time and sensitivity
to motion and B0 inhomogeneity. These limitations have been addressed in this study by
implementing a technique involving pairs of three-dimensional (3D) echo planar imaging (EPI)
volumetric navigators to correct in real time for subject motion and B0 inhomogeneity throughout
the acquisition.
In vitro phantom scans demonstrated that the individual shim terms affect the final edited spectra
differently. Manually added frequency offsets of 15 Hz led to substantial subtraction artefacts,
while manually added first-order shim distortions of 10 µT led to severe line broadening and loss of
the pseudo-doublet pattern of the GABA peak. These results suggest that subtraction artefacts are
caused by frequency drifts, while broadening of peaks and loss of multiplet structure may be due to
first-order shim terms.
Spectra acquired in vivo demonstrated that subject motion can lead to artefacts beyond the
commonly reported choline artefact (Evans et al., 2013; Harris et al., 2013), and that larger head
motion can cause severe spectral distortions. Furthermore, motion-related effects could be present
in edit-on or edit-off spectra without prominent artefacts in the edited spectra, so that referencing
GABA relative to metabolites from the edited spectra should be done with extreme caution (Durst
et al., 2015).
Most MRS studies rely on spectral linewidth (FWHM) and SNR as indices for spectral quality
(Hess et al., 2011; Keating & Ernst, 2012; Kreis, 2004). In GABA MRS, FWHM values of GABA
ranging between 0.11 ppm and 0.19 ppm are considered indicative of good spectral quality
(Bhattacharyya et al., 2007; Harris et al., 2014; Mescher et al., 1998). However, in the present study
GABA spectra acquired in the presence of limited motion (< 3.1°) without any correction yielded a
similar range of FWHM values (0.12-0.14 ppm), indicating that FWHM of GABA as a measure of
spectral quality should be used with caution. Similarly, SNR from the GABA scans could be
misleading (Dharmadhikari et al., 2015) due to signal elevations arising from inadequate
suppression of MM due to motion-related frequency drift.
In view of the above, we recommend that GABA-edited spectra should be assessed quantitatively –
through indices such as Cramer-Rao Lower Bounds in LCModel , fitting error in GANNET or
Cramer-Rao standard deviation in jMRUI – and visually to ensure reliable concentration
71
quantification, as explained in (Dharmadhikari et al., 2015; R. A. Edden et al., 2013; Gao et al.,
2013; Kreis, 2004; Provencher, 2001, 2005).
Several methods are used to gauge the quality of data, including CRLBs that provide a measure of
how well the fitting algorithm could fit the data (Kreis, 2004). It is standard practice to reject
GABA+ measurements with relative CRLB values – expressed as a percentage of the estimated
area or concentration of the metabolite – exceeding 20% (Long et al., 2013; Wijtenburg et al.,
2013). However, GABA will typically have higher relative CRLBs than GABA+, which should be
interpreted with caution as this could be the result of a decrease in concentration rather than being
indicative of a less reliable fit (Kreis, 2016).
Motion-related frequency drifts can severely compromise spectral editing during GABA acquisition
especially when scanning paediatric and patient populations (Alhamud et al., 2015; A. T. Hess et
al., 2014) resulting in MM contamination in the edited GABA signal. The present study provides an
efficient technique that mitigates motion-related frequency drifts and permits symmetric editing of
C4-GABA without MM contamination. Since previous studies have demonstrated weak to no
relationship between GABA+ and GABA, there is no support for using GABA+ as a substitute for
underlying GABA (Harris et al., 2014; Mikkelsen et al., 2015), and MM suppression is
recommended. Further, differences in levels of MM have been observed in patients with tumours,
multiple sclerosis and stroke (Graham et al., 2001; Howe et al., 2003; Mader et al., 2001), and age-
related decreases of GABA+ (Gao et al., 2013) did not persist when MM were suppressed (Aufhaus
et al., 2013).
A previous study involving a cohort of 8 participants (1 female) reported diurnal stability of
GABA+ in occipital cortex (OCC) and sensorimotor cortex (SMC) (Evans et al., 2010). In view of
the differences in stability of GABA levels over time found between males and females in PAR
only in our study, it may not be appropriate to extrapolate these results to females in general, or to
other brain regions. For instance, GABA levels in regions such as suprachiasmatic nucleus and PAR
have been shown to exhibit changes that may be associated with the control of circadian rhythms
(Liu & Reppert, 2000; Masubuchi et al., 2000). Some studies also choose to exclude female
participants due to reported variations in GABA+ levels with the menstrual cycle (Harada et al.,
2011; Near et al., 2014; Puts & Edden, 2012). In contrast, in our study GABA levels in females
were stable over time in both regions, even though we did not control for menstrual cycle. In view
of variations in MM levels between individuals and in neurological conditions, it is possible that the
72
observations described above for GABA+ may not reflect accurately the levels of pure GABA. As
such, results obtained for GABA+ require validation for pure GABA.
Previous studies have demonstrated that behavioural interventions cause changes in GABA levels.
Floyer-Lea et al. demonstrated that GABA decreases significantly in the SMC after 50 minutes of
performing a repetitive motor learning task in a cohort of 23 subjects. These learning-related
changes in GABA were not observed in 10 and 7 different subjects after performing random and
rest tasks, respectively (Floyer-Lea et al., 2006). Levy et al. demonstrated significant reductions of
GABA in SMC during an ischemic nerve block in 12 subjects (2 females) (Levy et al., 2002).
Kupers et al. performed painful heat stimuli on 13 subjects (7 females) that led to a significant
increase in GABA in ACC (Kupers et al., 2009). Sanacora et al. reported that cognitive behavioural
therapy as a treatment for major depression has a moderate effect on GABA in OCC relative to both
electroconvulsive therapy (ECT) and selective serotonin reuptake inhibitor (SSRI) treatments in 8
medication-free subjects with major depression (Sanacora et al., 2006).
Given the differences in reproducibility found between males and females in different brain regions
in the present study, gender-related effects may have introduced bias in the above studies. For
example, Floyer Lea et al. used different groups of subjects for the different tasks, which may have
affected the results if the groups were not matched for gender (and possibly age). In the study by
Levy et al. 83% of the subjects were male (Levy et al., 2002). Although gender could be used as a
covariate (Sanacora et al., 1999), this might not be feasible due to lack of statistical power to detect
group differences for the small sample sizes typically used in these studies (Kupers et al., 2009;
Levy et al., 2002; Sanacora et al., 2006; Sanacora et al., 1999).The author recommends that future
studies should emphasize gender-matching prior to conducting GABA-based investigations.
Limitations and future work
A technical limitation of the navigator system implemented is that the EPI specific frequency
updates are disabled after the start of the motion correction to avoid interaction between frequency
adjustment and motion correction. By not updating the EPI frequency in real time, the image is
displaced in the phase encode direction and the slice profile will be shifted. A solution to this
interaction would be to subtract the frequency-based phase encode translation estimate from that
applied. This would permit simultaneous frequency and translation estimates to be applied to the
EPI acquisition.
73
Subject motion can result in second-order shim changes that cause B0 distortion (Figures 5 and 6 in
(Hess et al., 2011)). One possible solution is to update the second order-shim estimates in a similar
manner to that of first-order shim updates. Although the EPI navigator estimates the second-order
shim in the present work, the current Siemens hardware does not allow real-time control of the
higher-order shims due to the lack of eddy current compensation.
This work has not addressed the reacquisition technique to further enhance the spectral quality
(Bogner et al., 2014). This technique could lead to subject fatigue due to prolonged scan time. Here
we removed individual corrupted spectra during post-processing, as previously done (Near et al.,
2013), rather than performing reacquisition.
Evans et al. demonstrated – on GABA spectra acquired by MEGA-PRESS – that pairwise (edit-
on/off) frequency updates are superior and reduces subtraction artefacts (Evans et al., 2013). Bogner
et al. demonstrated – on GABA spectra acquired by MEGA-LASER – that updating motion and
shim terms once every pair of edit-on/off reduces choline artefacts and enhances spectral quality
(Bogner et al., 2014). The MEGA-SPECIAL sequence requires four acquisitions (4 x TR = 16s for
this study) to acquire a single GABA edited spectrum, rendering it very sensitive to motion
compared to MEGA-PRESS and MEGA-LASER, which both require two TR’s per edited
spectrum. Therefore, in this work, the motion and shim estimates were updated every TR, rather
than once for every set of measurements, to reduce the impact of motion and B0 inhomogeneity on
the final GABA spectrum. Nevertheless, comparison between the individual and pairwise updates
of motion and shim terms during MEGA-SEPCIAL acquisition would be favourable.
The long TR of 4 s was necessary for this study to reduce specific absorption rate (SAR) due to
strong outer volume suppression (OVS) pulses – a necessity for MEGA-SPECIAL (Near et al.,
2011) – to eliminate any signal outside the VOI. Previous studies have demonstrated that long TRs
ranging from 4s to 5s increase SNR by 20-30%. Furthermore, GABA editing has been well
established for a TR of 4 s (Andreychenko et al., 2012).
In this study, the reproducibility, tissue-specific concentrations of GABA, and effects of gender and
time on GABA concentrations were evaluated in the ACC and PAR due to the role of GABA in
several neurological conditions (Bai et al., 2014; Puts & Edden, 2012) in which these regions are
implicated. Future research should involve other regions of the brain, such as OCC, SMC and
DLPFC, due to the correlation of GABA levels in these regions with pathology and healthy
behaviour (Levy & Degnan, 2013; Mullins et al., 2012; Puts & Edden, 2012). Given the neuroactive

74
steroidal-related modulation of GABA and GABA-based regulation of circadian rhythm, it is
important to investigate diurnal stability of GABA along with plasma hormone levels in both male
and female participants.
In this study, the reproducibility of GABA levels was performed within a session. Repetition of
session would have been more informative. However, the scope of the study was to determine
reproducibility using different analysis packages, and therefore within session examination is
adequate to achieve this objective. Furthermore, the scope and the outcome of the study support the
findings of a previous GABA+ study (O'Gorman et al., 2011).
Finally, as previously mentioned, at University of Cape Town, there has been long-standing interest
in studying learning deficits in children with prenatal alcohol exposure. Therefore, future work will
include GABA-based investigation into the physiological basis of these learning deficits by
implementing GABA acquisition before and after performing learning tasks, such as motor learning
(Floyer-Lea et al., 2006) or eyeblink conditioning (Jacobson et al., 2011).

75
Chapter 7 CONCLUSION γ-aminobutyric acid (GABA) is the primary inhibitory neurotransmitter and is of great interest to
the MRS community due to its relevance with several neurological diseases and disorders. GABA
acquisition is challenging and susceptible to motion and B0 inhomogeneity. A novel technique has
been presented that performs prospective motion, zero- and first-order shim correction using 3D
EPI volumetric navigators. The registration of the navigator images using the PACE technique
provides robust estimates of head position and orientation for motion correction. The field map
generated by the navigator provides reliable B0 estimates for zero- and first-order shim correction.
The navigators were incorporated in the MEGA-SPECIAL sequence with no impact on the
acquisition time, producing GABA edited spectra with superior spectral quality. The navigators
maintain spectral quality in the presence and absence of motion. Scans with B0 disruptions, and with
and without correction in the presence of motion, unequivocally demonstrate the necessity of real-
time motion and shim correction.
The motion and shim navigated MEGA-SPECIAL sequence was used to acquire GABA spectra
from the anterior cingulate (ACC) and medial parietal (PAR) cortices with superior quality and
permitted investigations of reproducibility, variations of GABA levels in different tissues, and
effects of gender. It was found that GABA measurements are most reproducible in both regions
using LCModel followed by jMRUI and then GANNET. However, GABA levels were significantly
lower for the second measurement in PAR.
Although GABA concentrations did not differ between males and females in ACC, the
concentration in PAR was significantly higher in males, emphasizing the importance of gender-
matching during GABA-based investigations of neurological conditions in mixed-gender groups. In
addition, the concentration of GABA in male participants decreased over roughly 40 minutes in
PAR only, stressing the need to determine the time of day during which GABA is stable in brain
regions of interest prior to conducting GABA-based evaluations of neurological conditions.

76
References Alhamud, A, Taylor, Paul A, Laughton, Barbara, van der Kouwe, André JW, & Meintjes, Ernesta
M. (2015). Motion artifact reduction in pediatric diffusion tensor imaging using fast prospective correction. Journal of Magnetic Resonance Imaging, 41(5), 1353-1364.
Alhamud, A, Taylor, Paul A, van der Kouwe, Andre JW, & Meintjes, Ernesta M. (2016). Real-time measurement and correction of both B0 changes and subject motion in diffusion tensor imaging using a double volumetric navigated (DvNav) sequence. Neuroimage, 126, 60-71.
Andreychenko, Anna, Boer, Vincent O, Arteaga de Castro, Catalina S, Luijten, Peter R, & Klomp, Dennis WJ. (2012). Efficient spectral editing at 7 T: GABA detection with MEGA-sLASER. Magnetic resonance in medicine, 68(4), 1018-1025.
Ashburner, John, & Friston, Karl J. (2005). Unified segmentation. Neuroimage, 26(3), 839-851. Aufhaus, E, Weber-Fahr, W, Sack, M, Tunc-Skarka, N, Oberthuer, G, Hoerst, M, Meyer-
Lindenberg, A, Boettcher, U, & Ende, G. (2013). Absence of changes in GABA concentration with age and gender in the human anterior cingulate cortex: A MEGA-PRESS study with symmetric editing pulse frequencies for macromolucule suppression. Magnetic resonance in medicine, 69(2), 317-320.
Bai, Xue, Edden, Richard AE, Gao, Fei, Wang, Guangbin, Wu, Lebin, Zhao, Bin, Wang, Minzhong, Chan, Queenie, Chen, Weibo, & Barker, Peter B. (2014). Decreased γ-aminobutyric acid levels in the parietal region of patients with Alzheimer's disease. Journal of Magnetic Resonance Imaging, 41, 1326-1331.
Behar, Kevin L, Rothman, Douglas L, Petersen, Kitt F, Hooten, Michael, Delaney, Richard, Petroff, Ognen AC, Shulman, Gerald I, Navarro, Victor, Petrakis, Ismene L, Charney, Dennis S, & Krystal, JH. (1999). Preliminary evidence of low cortical GABA levels in localized 1H-MR spectra of alcohol-dependent and hepatic encephalopathy patients. American Journal of Psychiatry, 156, 952-954.
Bhattacharyya, PK, Lowe, MJ, & Phillips, MD. (2007). Spectral quality control in motion-corrupted single-voxel J-difference editing scans: An interleaved navigator approach. Magnetic resonance in medicine, 58(4), 808-812.
Bhattacharyya, PK, Phillips, MD, Stone, LA, & Lowe, MJ. (2011). In-vivo MRS measurement of gray-matter and white-matter GABA concentration in sensorimotor cortex using a motion-controlled MEGA-PRESS Sequence. Magnetic resonance imaging, 29(3), 374.
Bigal, ME, Hetherington, H, Pan, J, Tsang, A, Grosberg, B, Avdievich, N, Friedman, B, & Lipton, RB. (2008). Occipital levels of GABA are related to severe headaches in migraine. Neurology, 70(22), 2078-2080.
Block, Wolfgang, Träber, Frank, von Widdern, Olrik, Metten, Martin, Schild, Hans, Maier, Wolfgang, Zobel, Astrid, & Jessen, Frank. (2009). Proton MR spectroscopy of the hippocampus at 3 T in patients with unipolar major depressive disorder: correlates and predictors of treatment response. International Journal of Neuropsychopharmacology, 12(3), 415-422.
Bogner, W, Gagoski, Borjan, Hess, Aaron T, Bhat, Himanshu, Tisdall, M Dylan, van der Kouwe, Andre JW, Strasser, Bernhard, Marjańska, Małgorzata, Trattnig, Siegfried, Grant, Ellen, Rosen, B, & Andronesi, OC. (2014). 3D GABA imaging with real-time motion correction, shim update and reacquisition of adiabatic spiral MRSI. Neuroimage, 103, 290-302.
Bogner, W, Gruber, S, Doelken, M, Stadlbauer, A, Ganslandt, O, Boettcher, U, Trattnig, S, Doerfler, A, Stefan, H, & Hammen, T. (2010). In vivo quantification of intracerebral GABA by single-voxel (1)H-MRS-How reproducible are the results? European journal of radiology, 73(3), 526-531.
Bottomley, Paul A. (1987). Spatial localization in NMR spectroscopy in vivo. Annals of the New York Academy of Sciences, 508(1), 333-348.
Buckens, Constantinus F, de Jong, Pim A, Mol, Christian, Bakker, Eric, Stallman, Hein P, Mali, Willem P, van der Graaf, Yolanda, & Verkooijen, Helena M. (2013). Intra and interobserver

77
reliability and agreement of semiquantitative vertebral fracture assessment on chest computed tomography. PloS one, 8(8), e71204.
Choi, Changho, Bhardwaj, Paramjit P, Kalra, Sanjay, Casault, Colin A, Yasmin, Umme S, Allen, Peter S, & Coupland, Nicholas J. (2007). Measurement of GABA and contaminants in gray and white matter in human brain in vivo. Magnetic resonance in medicine, 58(1), 27-33.
Choi, In-Young, Lee, Sang-Pil, Merkle, Hellmut, & Shen, Jun. (2006). In vivo detection of gray and white matter differences in GABA concentration in the human brain. Neuroimage, 33(1), 85-93.
De Graaf, Robin A. (2008). In vivo NMR spectroscopy: principles and techniques: John Wiley & Sons.
Deicken, Raymond F, Eliaz, Yael, Feiwell, Robert, & Schuff, Norbert. (2001). Increased thalamic N-acetylaspartate in male patients with familial bipolar I disorder. Psychiatry Research: Neuroimaging, 106(1), 35-45.
Dharmadhikari, Shalmali, Ma, Ruoyun, Yeh, Chien-Lin, Stock, Ann-Kathrin, Snyder, Sandy, Zauber, S Elizabeth, Dydak, Ulrike, & Beste, Christian. (2015). Striatal and thalamic GABA level concentrations play differential roles for the modulation of response selection processes by proprioceptive information. Neuroimage, 120, 36-42.
Donahue, Manus J, Near, Jamie, Blicher, Jakob U, & Jezzard, Peter. (2010). Baseline GABA concentration and fMRI response. Neuroimage, 53(2), 392-398.
Drost, Dick J, Riddle, William R, & Clarke, Geoffrey D. (2002). Proton magnetic resonance spectroscopy in the brain: report of AAPM MR Task Group# 9. Medical physics, 29(9), 2177-2197.
Duffy, Jeanne F, Cain, Sean W, Chang, Anne-Marie, Phillips, Andrew JK, Münch, Mirjam Y, Gronfier, Claude, Wyatt, James K, Dijk, Derk-Jan, Wright, Kenneth P, & Czeisler, Charles A. (2011). Sex difference in the near-24-hour intrinsic period of the human circadian timing system. Proceedings of the National Academy of Sciences, 108(Supplement 3), 15602-15608.
Durst, Christopher R, Michael, Navin, Tustison, Nicholas J, Patrie, James T, Raghavan, Prashant, Wintermark, Max, & Velan, S Sendhil. (2015). Noninvasive evaluation of the regional variations of GABA using magnetic resonance spectroscopy at 3 Tesla. Magnetic resonance imaging, 33(5), 611-617.
Edden, R, Intrapiromkul, Jarunee, Zhu, He, Cheng, Ying, & Barker, Peter B. (2012). Measuring T2 in vivo with J-difference editing: Application to GABA at 3 tesla. Journal of Magnetic Resonance Imaging, 35(1), 229-234.
Edden, R, Puts, Nicolaas AJ, & Barker, Peter B. (2012). Macromolecule-suppressed GABA-edited magnetic resonance spectroscopy at 3T. Magnetic resonance in medicine, 68(3), 657-661.
Edden, Richard AE, & Barker, Peter B. (2007). Spatial effects in the detection of γ-aminobutyric acid: Improved sensitivity at high fields using inner volume saturation. Magnetic resonance in medicine, 58(6), 1276-1282.
Edden, Richard AE, Puts, Nicolaas AJ, Harris, Ashley D, Barker, Peter B, & Evans, C John. (2013). Gannet: A batch-processing tool for the quantitative analysis of gamma-aminobutyric acid–edited MR spectroscopy spectra. Journal of Magnetic Resonance Imaging, 40, 1445-1452.
Edden, Richard AE, Schär, Michael, Hillis, Argye E, & Barker, Peter B. (2006). Optimized detection of lactate at high fields using inner volume saturation. Magnetic resonance in medicine, 56(4), 912-917.
Epperson, C Neill, Haga, Kristin, Mason, Graeme F, Sellers, Edward, Gueorguieva, Ralitza, Zhang, Wenjiang, Weiss, Erica, Rothman, Douglas L, & Krystal, John H. (2002). Cortical gamma-aminobutyric acid levels across the menstrual cycle in healthy women and those with Premenstrual Dysphoric Disorder: a proton magnetic resonance spectroscopy study. Archives of General Psychiatry, 59(9), 851-858.

78
Evans, Christopher John, McGonigle, David John, & Edden, Richard Anthony Edward. (2010). Diurnal stability of γ-aminobutyric acid concentration in visual and sensorimotor cortex. Journal of Magnetic Resonance Imaging, 31(1), 204-209.
Evans, Christopher John, Puts, Nicolaas AJ, Robson, Siân E, Boy, Frederic, McGonigle, David J, Sumner, Petroc, Singh, Krish D, & Edden, Richard AE. (2013). Subtraction artifacts and frequency (Mis-) alignment in J-difference GABA editing. Journal of Magnetic Resonance Imaging, 38(4), 970-975.
Floyer-Lea, Anna, Wylezinska, Marzena, Kincses, Tamas, & Matthews, Paul M. (2006). Rapid modulation of GABA concentration in human sensorimotor cortex during motor learning. Journal of neurophysiology, 95(3), 1639-1644.
Fu, Zhuo Wu, Wang, Yi, Grimm, Roger C, Rossman, Phillip J, Felmlee, Joel P, Riederer, Stephen J, & Ehman, Richard L. (1995). Orbital navigator echoes for motion measurements in magnetic resonance imaging. Magnetic resonance in medicine, 34(5), 746-753.
Fuchs, Alexander, Luttje, Mariska, Boesiger, Peter, & Henning, Anke. (2013). SPECIAL semi-LASER with lipid artifact compensation for 1H MRS at 7 T. Magnetic resonance in medicine, 69(3), 603-612.
Gao, Fei, Edden, Richard AE, Li, Muwei, Puts, Nicolaas AJ, Wang, Guangbin, Liu, Cheng, Zhao, Bin, Wang, Huiquan, Bai, Xue, Zhao, Chen, Wang, X, & Barker, PB. (2013). Edited magnetic resonance spectroscopy detects an age-related decline in brain GABA levels. Neuroimage, 78, 75-82.
Gasparovic, Charles, Song, Tao, Devier, Deidre, Bockholt, H Jeremy, Caprihan, Arvind, Mullins, Paul G, Posse, Stefan, Jung, Rex E, & Morrison, Leslie A. (2006). Use of tissue water as a concentration reference for proton spectroscopic imaging. Magnetic resonance in medicine, 55(6), 1219-1226.
Goddard, Andrew W, Mason, Graeme F, Almai, Ahmad, Rothman, Douglas L, Behar, Kevin L, Petroff, Ognen AC, Charney, Dennis S, & Krystal, John H. (2001). Reductions in occipital cortex GABA levels in panic disorder detected with 1h-magnetic resonance spectroscopy. Archives of General Psychiatry, 58(6), 556-561.
Govindaraju, Varanavasi, Young, Karl, & Maudsley, Andrew A. (2000). Proton NMR chemical shifts and coupling constants for brain metabolites. NMR in Biomedicine, 13(3), 129-153.
Graham, Glenn D, Hwang, Jong-Hee, Rothman, Douglas L, & Prichard, James W. (2001). Spectroscopic assessment of alterations in macromolecule and small-molecule metabolites in human brain after stroke. Stroke, 32(12), 2797-2802.
Gruber, Stephan, Frey, Richard, Mlynárik, Vladimir, Stadlbauer, Andreas, Heiden, Angela, Kasper, Siegfried, Kemp, Graham J, & Moser, Ewald. (2003). Quantification of metabolic differences in the frontal brain of depressive patients and controls obtained by 1H-MRS at 3 Tesla. Investigative radiology, 38(7), 403-408.
Harada, Masafumi, Kubo, Hitoshi, Nose, Ayumi, Nishitani, Hiromu, & Matsuda, Tsuyoshi. (2011). Measurement of variation in the human cerebral GABA level by in vivo MEGA-editing proton MR spectroscopy using a clinical 3 T instrument and its dependence on brain region and the female menstrual cycle. Human brain mapping, 32(5), 828-833.
Harris, A, Puts, N, & Edden, R. (2015). Tissue correction for GABA-edited MRS: Considerations of voxel composition, tissue segmentation, and tissue relaxations. Journal of Magnetic Resonance Imaging, 42(5), 1431-1440.
Harris, Ashley D, Glaubitz, Benjamin, Near, Jamie, John Evans, C, Puts, Nicolaas AJ, Schmidt-Wilcke, Tobias, Tegenthoff, Martin, Barker, Peter B, & Edden, Richard AE. (2013). Impact of frequency drift on gamma-aminobutyric acid-edited MR spectroscopy. Magnetic resonance in medicine, 72(4), 941-948.
Harris, Ashley D, Puts, Nicolaas AJ, Anderson, Brian A, Yantis, Steven, Pekar, James J, Barker, Peter B, & Edden, Richard AE. (2015). Multi-Regional Investigation of the Relationship between Functional MRI Blood Oxygenation Level Dependent (BOLD) Activation and GABA Concentration. PloS one, 10(2), e0117531.

79
Harris, Ashley D, Puts, Nicolaas AJ, Barker, Peter B, & Edden, Richard AE. (2014). Spectral-editing measurements of GABA in the human brain with and without macromolecule suppression. Magnetic resonance in medicine, 74(6), 1523-1529.
Hasler, Gregor, van der Veen, Jan Willem, Tumonis, Toni, Meyers, Noah, Shen, Jun, & Drevets, Wayne C. (2007). Reduced prefrontal glutamate/glutamine and {gamma}-aminobutyric acid levels in major depression determined using proton magnetic resonance spectroscopy. Archives of General Psychiatry, 64(2), 193-200.
Henry, Pierre-Gilles, Dautry, Caroline, Hantraye, Philippe, & Bloch, Gilles. (2001). Brain GABA editing without macromolecule contamination. Magn. Reson. Med., 45(3), 517-520.
Hess, A, Jacobson, SW, Jacobson, JL, Molteno, CD, van der Kouwe, André JW, & Meintjes, Ernesta M. (2014). A comparison of spectral quality in magnetic resonance spectroscopy data acquired with and without a novel EPI-navigated PRESS sequence in school-aged children with fetal alcohol spectrum disorders. Metabolic brain disease, 29(2), 323-332.
Hess, Aaron T, Andronesi, Ovidiu C, Dylan Tisdall, M, Gregory Sorensen, A, Kouwe, André JW, & Meintjes, Ernesta M. (2012). Real-time motion and B0 correction for localized adiabatic selective refocusing (LASER) MRSI using echo planar imaging volumetric navigators. NMR in Biomedicine, 25(2), 347-358.
Hess, Aaron T, Dylan Tisdall, M, Andronesi, Ovidiu C, Meintjes, Ernesta M, & van der Kouwe, André JW. (2011). Real-time motion and B0 corrected single voxel spectroscopy using volumetric navigators. Magnetic resonance in medicine, 66(2), 314-323.
Hess, Aaron T, Kouwe, André JW, Mbugua, Kenneth K, Laughton, Barbara, & Meintjes, Ernesta M. (2014). Quality of 186 child brain spectra using motion and B0 shim navigated single voxel spectroscopy. Journal of Magnetic Resonance Imaging, 40(4), 958-965.
Hodkinson, Duncan J, Krause, Kristina, Khawaja, Nadine, Renton, Tara F, Huggins, John P, Vennart, William, Thacker, Michael A, Mehta, Mitul A, Zelaya, Fernando O, Williams, Steven CR, & Howard, MA. (2013). Quantifying the test–retest reliability of cerebral blood flow measurements in a clinical model of on-going post-surgical pain: A study using pseudo-continuous arterial spin labelling. NeuroImage: Clinical, 3, 301-310.
Howe, FA, Barton, SJ, Cudlip, SA, Stubbs, M, Saunders, DE, Murphy, M, Wilkins, P, Opstad, KS, Doyle, VL, McLean, MA, Bell, BA, & Griffiths, JR. (2003). Metabolic profiles of human brain tumors using quantitative in vivo 1H magnetic resonance spectroscopy. Magnetic resonance in medicine, 49(2), 223-232.
Jacobson, Sandra W, Stanton, Mark E, Dodge, Neil C, Pienaar, Mariska, Fuller, Douglas S, Molteno, Christopher D, Meintjes, Ernesta M, Hoyme, H Eugene, Robinson, Luther K, Khaole, Nathaniel, & Jacobson, JL. (2011). Impaired Delay and Trace Eyeblink Conditioning in School-Age Children With Fetal Alcohol Syndrome. Alcoholism: Clinical and Experimental Research, 35, 250-264.
Jenkinson, Mark. (2003). Fast, automated, N-dimensional phase-unwrapping algorithm. Magnetic resonance in medicine, 49(1), 193-197.
Jensen, JE, Frederick, Bde B, & Renshaw, PF. (2005). Grey and white matter GABA level differences in the human brain using two-dimensional, J-resolved spectroscopic imaging. NMR in Biomedicine, 18(8), 570-576.
Ke, Yong, Cohen, Bruce M, Bang, Jeannette Y, Yang, Manqiu, & Renshaw, Perry F. (2000). Assessment of GABA concentration in human brain using two-dimensional proton magnetic resonance spectroscopy. Psychiatry Research: Neuroimaging, 100(3), 169-178.
Keating, Brian, Deng, Weiran, Roddey, J Cooper, White, Nathan, Dale, Anders, Stenger, V Andrew, & Ernst, Thomas. (2010). Prospective motion correction for single-voxel 1H MR spectroscopy. Magnetic resonance in medicine, 64(3), 672-679.
Keating, Brian, & Ernst, Thomas. (2012). Real-time dynamic frequency and shim correction for single-voxel magnetic resonance spectroscopy. Magnetic resonance in medicine, 68(5), 1339-1345.

80
Klose, Uwe. (1990). In vivo proton spectroscopy in presence of eddy currents. Magnetic resonance in medicine, 14(1), 26-30.
Kreis, Roland. (2004). Issues of spectral quality in clinical 1H-magnetic resonance spectroscopy and a gallery of artifacts. NMR in Biomedicine, 17(6), 361-381.
Kreis, Roland. (2016). The trouble with quality filtering based on relative Cramér-Rao lower bounds. Magnetic resonance in medicine, 75(1), 15-18.
Kupers, Ron, Danielsen, Else R, Kehlet, Henrik, Christensen, Rune, & Thomsen, Carsten. (2009). Painful tonic heat stimulation induces GABA accumulation in the prefrontal cortex in man. Pain, 142(1), 89-93.
Levy, L, & Degnan, AJ. (2013). GABA-based evaluation of neurologic conditions: MR spectroscopy. American Journal of Neuroradiology, 34, 259-265.
Levy, L, Levy-Reis, Igor, Fujii, Mavis, & Dalakas, Marinos C. (2005). Brain Gamma-Aminobutyric Acid Changes in Stiff-Person Syndrome. Archives of neurology, 62(6), 970-974.
Levy, L, Ziemann, Ulf, Chen, Robert, & Cohen, Leonardo G. (2002). Rapid modulation of GABA in sensorimotor cortex induced by acute deafferentation. Annals of neurology, 52(6), 755-761.
Liu, Chen, & Reppert, Steven M. (2000). GABA synchronizes clock cells within the suprachiasmatic circadian clock. Neuron, 25(1), 123-128.
Long, Zaiyang, Medlock, Carla, Dzemidzic, Mario, Shin, Yong-Wook, Goddard, Andrew W, & Dydak, Ulrike. (2013). Decreased GABA levels in anterior cingulate cortex/medial prefrontal cortex in panic disorder. Progress in Neuro-Psychopharmacology and Biological Psychiatry, 44, 131-135.
Mader, I, Seeger, U, Weissert, R, Klose, U, Naegele, T, Melms, A, & Grodd, W. (2001). Proton MR spectroscopy with metabolite-nulling reveals elevated macromolecules in acute multiple sclerosis. Brain, 124(5), 953-961.
Mason, Graeme F, Petrakis, Ismene L, de Graaf, Robin A, Gueorguieva, Ralitza, Guidone, Elizabeth, Coric, Vladimir, Epperson, C Neill, Rothman, Douglas L, & Krystal, John H. (2006). Cortical gamma-aminobutyric acid levels and the recovery from ethanol dependence: preliminary evidence of modification by cigarette smoking. Biological psychiatry, 59(1), 85-93.
Masubuchi, Satoru, Honma, Sato, Abe, Hiroshi, Ishizaki, Kouji, Namihira, Masakazu, Ikeda, Masaaki, & Honma, Ken-ichi. (2000). Clock genes outside the suprachiasmatic nucleus involved in manifestation of locomotor activity rhythm in rats. European Journal of Neuroscience, 12(12), 4206-4214.
Mescher, M, Merkle, H, Kirsch, J, Garwood, M, & Gruetter, R. (1998). Simultaneous in vivo spectral editing and water suppression. NMR in Biomedicine, 11(6), 266-272.
Mescher, M, Tannus, A, Johnson, M, & Garwood, M. (1996). Solvent suppression using selective echo dephasing. Journal of Magnetic Resonance, Series A, 123(2), 226-229.
Michaelis, T, Merboldt, KD, Bruhn, H, Hänicke, W, & Frahm, J. (1993). Absolute concentrations of metabolites in the adult human brain in vivo: quantification of localized proton MR spectra. Radiology, 187(1), 219-227.
Michels, Lars, Martin, Ernst, Klaver, Peter, Edden, Richard, Zelaya, Fernando, Lythgoe, David J, Lüchinger, Rafael, Brandeis, Daniel, & O’Gorman, Ruth L. (2012). Frontal GABA levels change during working memory. PloS one, 7(4), e31933.
Mikkelsen, Mark, Singh, Krish D, Sumner, Petroc, & Evans, C John. (2015). Comparison of the repeatability of GABA-edited magnetic resonance spectroscopy with and without macromolecule suppression. Magnetic resonance in medicine, 75(3), 946-953.
Mlynárik, Vladimír, Gambarota, Giulio, Frenkel, Hanne, & Gruetter, Rolf. (2006). Localized short-echo-time proton MR spectroscopy with full signal-intensity acquisition. Magnetic resonance in medicine, 56(5), 965-970.
81
Mlynárik, Vladimír, Gruber, Stephan, & Moser, Ewald. (2001). Proton T1 and T2 relaxation times of human brain metabolites at 3 Tesla. NMR in Biomedicine, 14(5), 325-331.
Mullins, Paul G, McGonigle, David J, O'Gorman, Ruth, Puts, Nicolaas AJ, Vidyasagar, Rishma, Evans, C John, & Edden, Richard AE. (2012). Current Practice in the use of MEGA-PRESS spectroscopy for the detection of GABA. Neuroimage, 86, 43-52.
Muthukumaraswamy, Suresh D, Edden, Richard AE, Jones, Derek K, Swettenham, Jennifer B, & Singh, Krish D. (2009). Resting GABA concentration predicts peak gamma frequency and fMRI amplitude in response to visual stimulation in humans. Proceedings of the National Academy of Sciences, 106(20), 8356-8361.
Naressi, A, Couturier, C, Devos, JM, Janssen, M, Mangeat, C, De Beer, R, & Graveron-Demilly, D. (2001). Java-based graphical user interface for the MRUI quantitation package. Magnetic Resonance Materials in Physics, Biology and Medicine, 12(2-3), 141-152.
Near, Jamie, Andersson, Jesper, Maron, Eduard, Mekle, Ralf, Gruetter, Rolf, Cowen, Philip, & Jezzard, Peter. (2013). Unedited in vivo detection and quantification of γ-aminobutyric acid in the occipital cortex using short-TE MRS at 3 T. NMR in Biomedicine, 26, 1353-1362.
Near, Jamie, Edden, Richard, Evans, C John, Paquin, Raphaël, Harris, Ashley, & Jezzard, Peter. (2015). Frequency and phase drift correction of magnetic resonance spectroscopy data by spectral registration in the time domain. Magnetic resonance in medicine, 73(1), 44-50.
Near, Jamie, Evans, C John, Puts, Nicolaas AJ, Barker, Peter B, & Edden, Richard AE. (2012). J-difference editing of gamma-aminobutyric acid (GABA): Simulated and experimental multiplet patterns. Magnetic resonance in medicine, 70(5), 1183-1191.
Near, Jamie, Ho, Yi-Ching Lynn, Sandberg, Kristian, Kumaragamage, Chathura, & Blicher, Jakob Udby. (2014). Long-term reproducibility of GABA magnetic resonance spectroscopy. Neuroimage, 99, 191-196.
Near, Jamie, Simpson, Robin, Cowen, Philip, & Jezzard, Peter. (2011). Efficient γ-aminobutyric acid editing at 3T without macromolecule contamination: MEGA-SPECIAL. NMR in Biomedicine, 24(10), 1277-1285.
O'Gorman, R , Edden, R, Michels, L, Murdoch, JB, & Martin, E. (2007). Precision and repeatability of in vivo GABA and glutamate quantification. Paper presented at the Proceedings of the 19th scientific meeting, International Society for Magnetic Resonance in medicine, Montreal, Canada.
O'Gorman, R , Michels, Lars, Edden, Richard A, Murdoch, James B, & Martin, Ernst. (2011). In vivo detection of GABA and glutamate with MEGA-PRESS: Reproducibility and gender effects. Journal of Magnetic Resonance Imaging, 33(5), 1262-1267.
Pallant, J. (2001). SPSS survival manual: a step by step to data analysis using SPSS. Provencher, Stephen W. (2001). Automatic quantitation of localized in vivo 1H spectra with
LCModel. NMR in Biomedicine, 14(4), 260-264. Provencher, Stephen W. (2005). LCModel & LCMgui user’s manual. Stephen W. Provencher. Puts, Nicolaas AJ, Barker, Peter B, & Edden, Richard AE. (2013). Measuring the longitudinal
relaxation time of GABA in vivo at 3 Tesla. Journal of Magnetic Resonance Imaging, 37(4), 999-1003.
Puts, Nicolaas AJ, & Edden, Richard AE. (2012). In vivo magnetic resonance spectroscopy of GABA: A methodological review. Progress in nuclear magnetic resonance spectroscopy, 60, 29-41.
Rothman, Douglas L, Petroff, OA, Behar, Kevin L, & Mattson, Richard H. (1993). Localized 1H NMR measurements of gamma-aminobutyric acid in human brain in vivo. Proceedings of the National Academy of Sciences, 90(12), 5662-5666.
Saleh, Muhammad G., Alhamud, A., Near, Jamie, van der Kouwe, André JW, & Meintjes, Ernesta M. (2016). Volumetric navigated MEGA-SPECIAL for real-time motion and shim corrected GABA editing. NMR in Biomedicine, 29, 248-255.
Sanacora, Gerard, Fenton, Lisa R, Fasula, Madonna K, Rothman, Douglas L, Levin, Yael, Krystal, John H, & Mason, Graeme F. (2006). Cortical γ-aminobutyric acid concentrations in
82
depressed patients receiving cognitive behavioral therapy. Biological psychiatry, 59(3), 284-286.
Sanacora, Gerard, Mason, Graeme F, Rothman, Douglas L, Behar, Kevin L, Hyder, Fahmeed, Petroff, Ognen AC, Berman, Robert M, Charney, Dennis S, & Krystal, John H. (1999). Reduced cortical γ-aminobutyric acid levels in depressed patients determined by proton magnetic resonance spectroscopy. Archives of General Psychiatry, 56(11), 1043-1047.
Sanacora, Gerard, Mason, Graeme F, Rothman, Douglas L, & Krystal, John H. (2002). Increased occipital cortex GABA concentrations in depressed patients after therapy with selective serotonin reuptake inhibitors. American Journal of Psychiatry, 159, 663-665.
Stagg, Charlotte J, Wylezinska, Marzena, Matthews, Paul M, Johansen-Berg, Heidi, Jezzard, Peter, Rothwell, John C, & Bestmann, Sven. (2009). Neurochemical effects of theta burst stimulation as assessed by magnetic resonance spectroscopy. Journal of neurophysiology, 101(6), 2872-2877.
Terpstra, Melissa, Ugurbil, Kamil, & Gruetter, Rolf. (2002). Direct in vivo measurement of human cerebral GABA concentration using MEGA-editing at 7 Tesla. Magnetic resonance in medicine, 47(5), 1009-1012.
Thesen, Stefan, Heid, Oliver, Mueller, Edgar, & Schad, Lothar R. (2000). Prospective acquisition correction for head motion with image-based tracking for real-time fMRI. Magnetic resonance in medicine, 44(3), 457-465.
Ticku, Maharaj K. (1990). Alcohol and GABA-benzodiazepine receptor function. Annals of medicine, 22(4), 241-246.
Tkáć, I, & Gruetter, R. (2005). Methodology of 1H NMR spectroscopy of the human brain at very high magnetic fields. Applied Magnetic Resonance, 29(1), 139-157.
Tkáć, I, Starcuk, Z, Choi, IY, & Gruetter, R. (1999). In Vivo 1H NMR Spectroscopy of Rat Brain at 1 ms Echo Time. Magnetic resonance in medicine, 41, 649-656.
van der Kouwe, André JW, Benner, Thomas, & Dale, Anders M. (2006). Real-time rigid body motion correction and shimming using cloverleaf navigators. Magnetic resonance in medicine, 56(5), 1019-1032.
van der Kouwe, André JW, Benner, Thomas, Salat, David H, & Fischl, Bruce. (2008). Brain morphometry with multiecho MPRAGE. Neuroimage, 40(2), 559-569.
Vanhamme, Leentje, van den Boogaart, Aad, & Van Huffel, Sabine. (1997). Improved method for accurate and efficient quantification of MRS data with use of prior knowledge. Journal of Magnetic Resonance, 129(1), 35-43.
Waddell, Kevin W, Avison, Malcolm J, Joers, James M, & Gore, John C. (2007). A practical guide to robust detection of GABA in human brain by J-difference spectroscopy at 3 T using a standard volume coil. Magnetic resonance imaging, 25(7), 1032-1038.
Weir, Joseph P. (2005). Quantifying test-retest reliability using the intraclass correlation coefficient and the SEM. The Journal of Strength & Conditioning Research, 19(1), 231-240.
Welch, Edward Brian, Manduca, Armando, Grimm, Roger C, Ward, Heidi A, & Jack Jr, Clifford R. (2002). Spherical navigator echoes for full 3D rigid body motion measurement in MRI. Magn. Reson. Med., 47(1), 32-41.
White, Nathan, Roddey, Cooper, Shankaranarayanan, Ajit, Han, Eric, Rettmann, Dan, Santos, Juan, Kuperman, Josh, & Dale, Anders. (2010). PROMO: Real-time prospective motion correction in MRI using image-based tracking. Magnetic resonance in medicine, 63(1), 91-105.
Wijtenburg, S Andrea, Rowland, Laura M, Edden, Richard AE, & Barker, Peter B. (2013). Reproducibility of brain spectroscopy at 7T using conventional localization and spectral editing techniques. Journal of Magnetic Resonance Imaging, 38(2), 460-467.
Winkelman, John W, Buxton, Orfeu M, Jensen, J Eric, Benson, Kathleen L, O'Connor, Shawn P, Wang, Wei, & Renshaw, Perry F. (2008). Reduced brain GABA in primary insomnia: preliminary data from 4T proton magnetic resonance spectroscopy (1H-MRS). Sleep, 31(11), 1499-1506.

83
Wong, C, Bottiglieri, Teodoro, & Snead, O Carter. (2003). Gaba, γ-hydroxybutyric acid, and neurological disease. Annals of neurology, 54(S6), S3-S12.
Yamamoto, Mitsutoshi, Takahashi, Shigeru, Otsuki, Saburo, Kugoh, Toshiaki, Hosokawa, Kiyoshi, & Ogawa, Norio. (1985). GABA levels in cerebrospinal fluid of patients with epilepsy. Psychiatry and Clinical Neurosciences, 39(4), 515-519.
Zaitsev, M, Speck, O, Hennig, J, & Büchert, M. (2010). Single-voxel MRS with prospective motion correction and retrospective frequency correction. NMR in Biomedicine, 23(3), 325-332.
Zheng, Ping. (2009). Neuroactive steroid regulation of neurotransmitter release in the CNS: action, mechanism and possible significance. Progress in neurobiology, 89(2), 134-152.
Zhu, He, Edden, Richard AE, Ouwerkerk, Ronald, & Barker, Peter B. (2011). High resolution spectroscopic imaging of GABA at 3 Tesla. Magn. Reson. Med., 65(3), 603-609.