Embed Size (px)
Citation preview

Real-time Visualization of Streaming Text with Force-Based Dynamic
System
Jamal AlsakranKent State University
Yang ChenUNC - Charlotte
Dongning LuoUNC - Charlotte
Ye ZhaoKent State University
Jing YangUNC - Charlotte
Wenwen Dou
UNC - Charlotte
Shixia Liu
Microsoft Research Asia
ABSTRACT
An interactive visualization system, STREAMIT, enables users toexplore text streams on-the-fly without prior knowledge of the data.It incorporates incoming documents from a continuous source intoexisting visualization context with automatic grouping and sepa-ration based on document similarities. STREAMIT supports in-teractive exploration with good scalability: First, keyword impor-tance is adjustable on-the-fly for preferred clustering effects fromvarying interests. Second, topic modeling is used to represent thedocuments with higher level semantic meanings. Third, documentclusters are generated to promote better understanding. The systemperformance is optimized to achieve instantaneous animated visual-ization even for a very large data collection. STREAMIT providesa powerful user interface for in-depth data analysis. Case studiesare presented to demonstrate the effectiveness of STREAMIT.
1 INTRODUCTION
Advanced technologies (e.g. mobile phone and internet) havegreatly increased the quantity and accessibility of text documentsin human society. Massive documents are generated at a significantspeed, e.g., from daily, hourly, or minutely emails, messages, webs,broadcasts, and TVs. They have introduced an urgent need for effi-cient storage, processing, and analysis of such constantly growingtext collections. Recently, visualization tools have been success-fully applied in processing and analyzing text data.
A stream text collection constantly evolves as new documentsare continuously generated and published. Unlike traditional textdatabase, the quantity and representation (e.g. keywords or topics)of the documents are not known in advance. Visual explorationof real text streams is a challenging task. First, text streams con-tinuously evolve. Visualization aids should be provided to tracethe temporal evolution of existing topics, monitor emerging topics,and examine the relationships between them. Second, a visualiza-tion system should process a text stream without pre-scanning thewhole stream or assuming a priori knowledge. Third, a visualiza-tion system should allow users to interactively change their infor-mation seeking focus at any time and receive immediate feedback.Such interactivity is a decisive factor for a visual analytic system inreal applications where domain users usually do not know the textstreams in advance. Fourth, a visualization system should scale tolarge volumes of text streams and respond to their evolution in realtime.
In this paper, we design a novel dynamic visualization system,named STREAMIT, for exploratory applications of text streams.The paper is expanded from our previous work [2] by introducingtopic modeling, automatic cluster discovery, and enhanced visual-izations. The system is based on a dynamic force-directed simula-tion into which documents are continuously inserted. Each docu-
ment is represented as a mass particle that moves inside a 2D vi-sualization domain. A potential energy is defined by pairwise textsimilarity between documents. Minimizing the total potential en-ergy of the system moves similar document particles closer anddrives away dissimilar ones, which are achieved by attractive andrepulsive forces between particles. Consequently, an equilibriumstate of the particles visually depicts the data clusters and outliersat a particular moment. The system automatically adjusts its vi-sual output with newly injected document particles. The dynamicprocedure of this change is critical for reducing change blindnesswhen new patterns emerge. This system has the following featuresto enable effective text stream visualization:
Continual evolvement: This physical model is well-suited to vi-sualize text streams for continuous depiction and analysis of grow-ing document collections, where the dynamic nature is simulatedthrough the dynamic behavior of particles. Text documents enterthe system at any time and automatically join clusters of relatedcollections. In the meantime, the particles already inside the systemtravel continuously under the impact of new particles. The visualstructures hence gradually evolve without abrupt changes that breakthe mental picture users already formed. Erratic motion of particu-lar particles (e.g., moving from one cluster to another cluster) mayreveal outliers or significant new trends. This is advantageous to ex-isting static or time-window based visualization approaches, whichdepict only stationary data patterns or the sporadic transitions be-tween these patterns.
Dynamic processing: Text documents are typically representedand manipulated through the vector of keywords. Existing meth-ods usually pre-calculate similarity between documents from theirpredefined constituent keywords. Instead, we develop dynamickeyword vectors that upgrade adaptively from the incoming docu-ments. Essentially, our system does not require a scan of the wholecollection before visualization. The visualization parameters andfunctions can be managed with respect to the temporal context.
Interactive exploration: We propose a Dynamic Keyword Impor-tance that presents the significance of a keyword at a certain time.It reflects user interest so that similarity is updated on-the-fly, andconsequently the visualization artifacts. For instance, keywordswith increasing importance will make documents having those key-words aggregated closer.
Scalability: Our system works well with topic modeling tech-niques, such as the LDA model [3]. They summarize the documentsusing a set of probabilistic topics, while the topics are described bya probability distribution of keywords. By using topics, we reducethe operating space from a large number of keywords to a muchlower dimensional feature space, which can be easily used to in-vestigate thematic variation. In addition, we generate clusters on-the-fly from the force-based results, where a Delaunay triangulationcombined with graph cut are applied by directly utilizing geomet-ric features. This dynamic clustering function enables easy visu-alization of cluster growth, split, and merge for better knowledgediscovery.
Performance optimization: We optimize our method by introduc-
ing a similarity grid that helps new particles quickly reach theirpreferred location. Moreover, our particle system is inherently par-allel for direct GPU acceleration, which achieves fast speed for avery large number of documents.
2 RELATED WORK
Many text visualization systems use similarity-based projection tohelp users get insights from large text collections. IN-SPIRE [11]uses multidimensional scaling (MDS) to map documents with simi-lar contents close to each other, and thus form “galaxies” or “moun-tains” in the displays. A point placement approach is proposed in[9] to build a hierarchy of the documents and project them as cir-cles. Our approach is different in that it uses a dynamic similarity-based projection system to depict text streams.
Related to our aim to handle continuous incoming text streams,TextPool [1] produces a visual summary that clusters related termsas a dynamic textual collage. Unlike our method, it visualizes veryrecent stream content as a partially connected graph, which is “notfor analyzing any significant portion of stream history”. Besides,the graph represents salient terms of the stream instead of the doc-uments. Wong et al. [12] dynamically visualize stream data in amoving time window using incremental data fusion. Newly arriveddata items are inserted into existing layout when the error of thesimilarity placement is smaller than a given threshold. Once thethreshold is exceeded, the whole layout is recalculated. Interac-tive exploration and user control are not addressed in [12]. Even-triver [8] processes incoming documents on the fly using a dynamickeyword processing and an incremental text clustering algorithmwhere individual documents are not visible from the overview ofthe stream. However, in our approach, individual documents can beexamined within the global temporal and similarity context. Het-zler et al. [6] visualize text collections in a 2D projection spacewith fresh and stale documents visually distinguished. They applyIN-SPIRE [11] to a dynamic document flow. When new documentsare added, the existing vocabulary content is adjusted and the visualresult is regenerated. However, the method does not show the ani-mated transition of the view. In comparison, our system reveals theevolvement of the stream in fine details with controllable transientanimations.
Our algorithm employs Force-Directed Placement (FDP) for vi-sualizing dynamic documents. FDP [5] has O(N3) complexitywhich urges researchers to improve its computational performance.Restrictions are imposed on the force calculations to a subset of theentire data, which could possibly lead to misleading approximatedresults. Unlike these methods working on static high-dimensionaldata, our approach is among the first efforts to visualize text streamsusing force-directed placement. Furthermore, to make correct dy-namic behavior, we avoid reducing force computation scope ononly a portion of the particles. Instead, we use a spatial divisionof the visualization domain for fast locating the appropriate initialposition of particles. More importantly, we fully utilize the paral-lel nature of the simulation algorithm by GPU acceleration whichachieves a dramatic speedup.
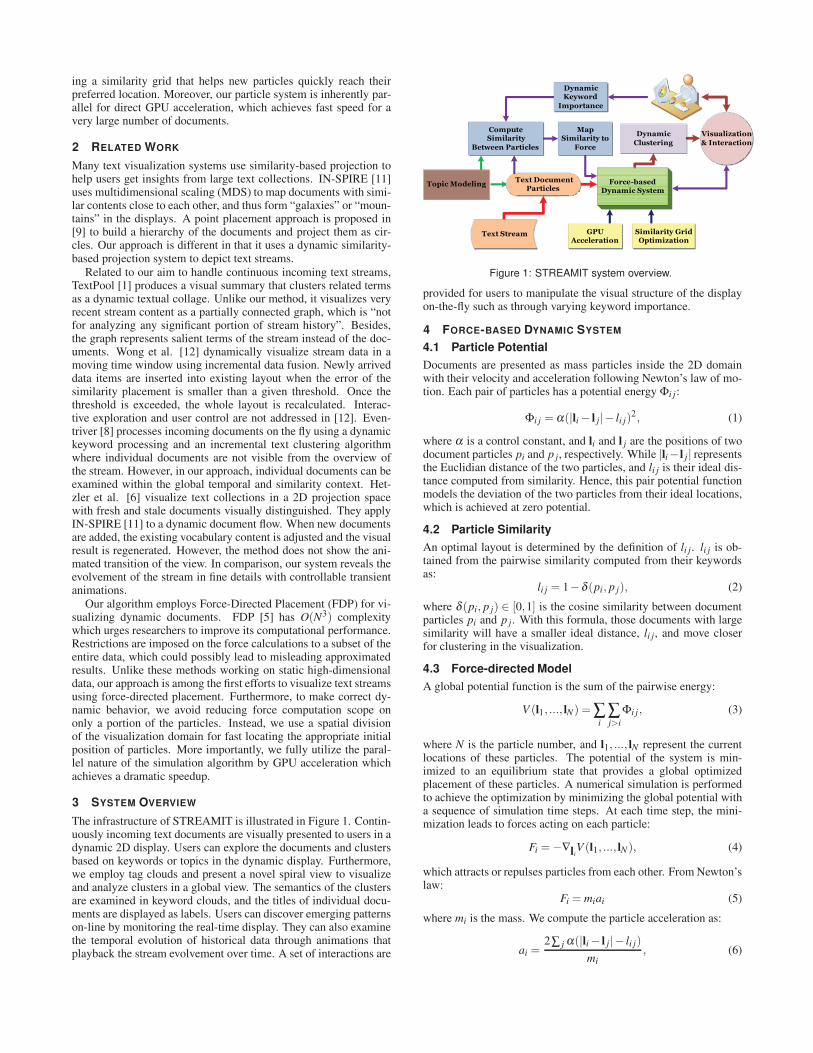
3 SYSTEM OVERVIEW
The infrastructure of STREAMIT is illustrated in Figure 1. Contin-uously incoming text documents are visually presented to users in adynamic 2D display. Users can explore the documents and clustersbased on keywords or topics in the dynamic display. Furthermore,we employ tag clouds and present a novel spiral view to visualizeand analyze clusters in a global view. The semantics of the clustersare examined in keyword clouds, and the titles of individual docu-ments are displayed as labels. Users can discover emerging patternson-line by monitoring the real-time display. They can also examinethe temporal evolution of historical data through animations thatplayback the stream evolvement over time. A set of interactions are
Force-based Dynamic System
Text DocumentParticles
Text Stream
Compute Similarity
Between Particles
Map Similarity to
Force
DynamicKeyword
Importance
Visualization
& Interaction
GPU Acceleration
Similarity GridOptimization
Topic Modeling
Dynamic
Clustering
Figure 1: STREAMIT system overview.
provided for users to manipulate the visual structure of the displayon-the-fly such as through varying keyword importance.
4 FORCE-BASED DYNAMIC SYSTEM
4.1 Particle Potential
Documents are presented as mass particles inside the 2D domainwith their velocity and acceleration following Newton’s law of mo-tion. Each pair of particles has a potential energy Φi j:
Φi j = α(|li − l j|− li j)2, (1)
where α is a control constant, and li and l j are the positions of twodocument particles pi and p j, respectively. While |li− l j| representsthe Euclidian distance of the two particles, and li j is their ideal dis-tance computed from similarity. Hence, this pair potential functionmodels the deviation of the two particles from their ideal locations,which is achieved at zero potential.
4.2 Particle Similarity
An optimal layout is determined by the definition of li j. li j is ob-tained from the pairwise similarity computed from their keywordsas:
li j = 1−δ (pi, p j), (2)
where δ (pi, p j) ∈ [0,1] is the cosine similarity between documentparticles pi and p j. With this formula, those documents with largesimilarity will have a smaller ideal distance, li j, and move closerfor clustering in the visualization.
4.3 Force-directed Model
A global potential function is the sum of the pairwise energy:
V (l1, ..., lN) = ∑i
∑j>i
Φi j, (3)
where N is the particle number, and l1, ..., lN represent the currentlocations of these particles. The potential of the system is min-imized to an equilibrium state that provides a global optimizedplacement of these particles. A numerical simulation is performedto achieve the optimization by minimizing the global potential witha sequence of simulation time steps. At each time step, the mini-mization leads to forces acting on each particle:
Fi =−∇liV (l1, ..., lN), (4)
which attracts or repulses particles from each other. From Newton’slaw:
Fi = miai (5)
where mi is the mass. We compute the particle acceleration as:
ai =2∑ j α(|li − l j|− li j)
mi, (6)
which is used to update the location of the particle, pi, at each sim-ulation time step. While every particle no longer moves (in numer-ical computing, the displacement smaller than a threshold ξ ), thesystem is optimized to its best visual layout.
Algorithm 1 Dynamic Simulation Algorithm
Set the maximum displacement D as a large valuewhile D > ξ do
for i = 0 to N - 1 dofor j = i+1 to N do
Fi+= 2∗α(|li − l j|− li j)end for
end forfor i = 0 to N - 1 do
ai = Fi/mi
update the position of this particleupdate maximum displacement D of all particles
end forend while
Algorithm 1 describes the basic computing procedure, where weassume every particle has the same unit mass. The constant α isan empirical parameter used to control the force (α = 0.01 in thecase studies), so that the numerical simulation is stable, i.e., all theparticles will not totally move out of the 2D domain or be squeezedto the center of this domain.
5 ADVANCED FEATURES FOR INTERACTIVE EXPLORATION
AND SCALABILITY
The evolving force-based system successfully generates andpresents document clusters, as well as outliers, for dynamic visu-alization. It automatically creates temporal visual output from con-tinuously inserted documents. We further develop techniques foradvanced data exploration.
5.1 Dynamic Keyword Importance
Keywords are vital words that frequently occur in a document. Thesimilarity δ (pi, p j) is typically computed by predefined formula,e.g. cosine similarity, from the keyword vector of documents pi
and p j . However, stream text collections usually span a long periodof time. For a real world stream, one keyword might excessively ap-pear for a period of time and then fade out, while another one mightfrequently pop up during the entire period of time. While userstypically do not have knowledge about the incoming documents,they will change their focus of interest along the stream evolve-ment. Consequently, the definition and computation of similarityshould instead be a function of time and adjusted by user input.
To address the challenge, we propose Dynamic Keyword Impor-tance in addition to the computation of δ (pi, p j), which interac-tively enables the users to manipulate the significance of keywordsat any time. The classic cosine similarity can be improved as:
δ (pi, p j) =∑K
k=1(wikIk)(w jkIk)√
∑Kk=1(wikIk)2.∑n
k=1(w jkIk)2(7)
where Ik is the importance of keyword k, K is the number of key-words, and wik is the weight of keyword k in the document pi. Theclassic cosine similarity can be considered as a special case whereIk = 1. All the K weights form the keyword vector of this doc-ument. The length of the current vector is dynamically updated,so that our system can handle data streams not prerecorded. Theweight of keywords is calculated as:
wik = Oik ∗ log2
N
nk
(8)
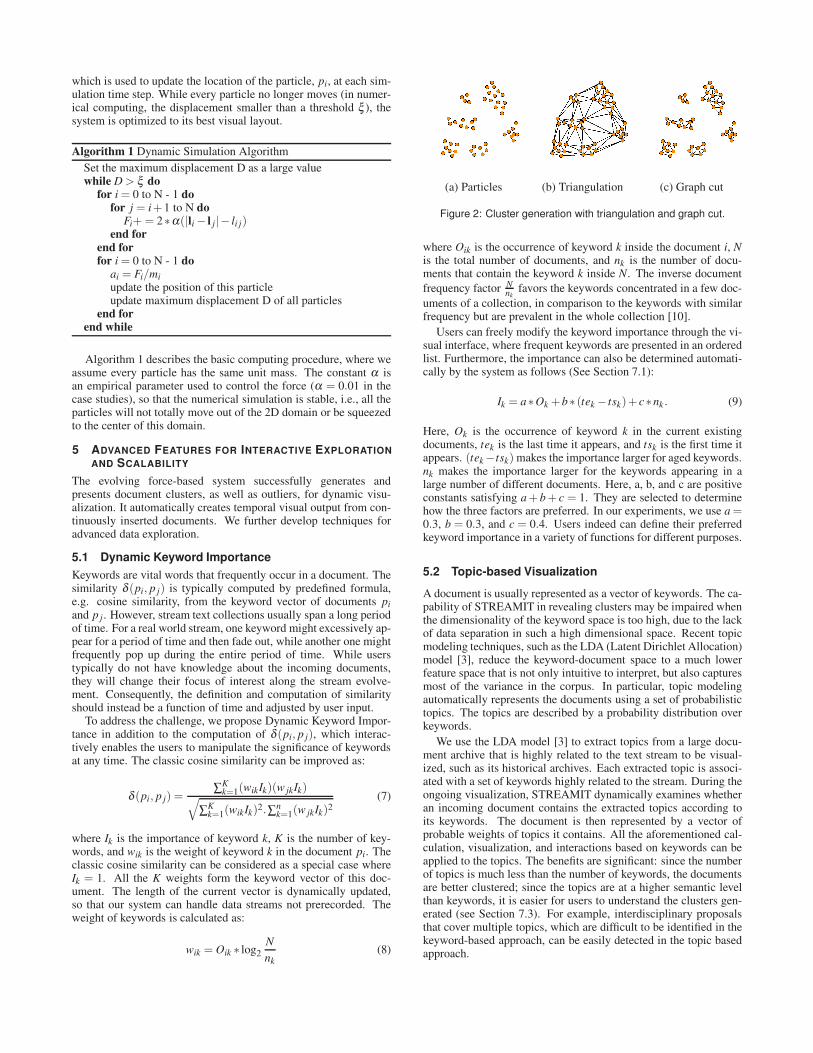
(a) Particles (b) Triangulation (c) Graph cut
Figure 2: Cluster generation with triangulation and graph cut.
where Oik is the occurrence of keyword k inside the document i, Nis the total number of documents, and nk is the number of docu-ments that contain the keyword k inside N. The inverse document
frequency factor Nnk
favors the keywords concentrated in a few doc-
uments of a collection, in comparison to the keywords with similarfrequency but are prevalent in the whole collection [10].
Users can freely modify the keyword importance through the vi-sual interface, where frequent keywords are presented in an orderedlist. Furthermore, the importance can also be determined automati-cally by the system as follows (See Section 7.1):
Ik = a∗Ok +b∗ (tek − tsk)+c∗nk . (9)
Here, Ok is the occurrence of keyword k in the current existingdocuments, tek is the last time it appears, and tsk is the first time itappears. (tek−tsk) makes the importance larger for aged keywords.nk makes the importance larger for the keywords appearing in alarge number of different documents. Here, a, b, and c are positiveconstants satisfying a+ b+ c = 1. They are selected to determinehow the three factors are preferred. In our experiments, we use a =0.3, b = 0.3, and c = 0.4. Users indeed can define their preferredkeyword importance in a variety of functions for different purposes.
5.2 Topic-based Visualization
A document is usually represented as a vector of keywords. The ca-pability of STREAMIT in revealing clusters may be impaired whenthe dimensionality of the keyword space is too high, due to the lackof data separation in such a high dimensional space. Recent topicmodeling techniques, such as the LDA (Latent Dirichlet Allocation)model [3], reduce the keyword-document space to a much lowerfeature space that is not only intuitive to interpret, but also capturesmost of the variance in the corpus. In particular, topic modelingautomatically represents the documents using a set of probabilistictopics. The topics are described by a probability distribution overkeywords.
We use the LDA model [3] to extract topics from a large docu-ment archive that is highly related to the text stream to be visual-ized, such as its historical archives. Each extracted topic is associ-ated with a set of keywords highly related to the stream. During theongoing visualization, STREAMIT dynamically examines whetheran incoming document contains the extracted topics according toits keywords. The document is then represented by a vector ofprobable weights of topics it contains. All the aforementioned cal-culation, visualization, and interactions based on keywords can beapplied to the topics. The benefits are significant: since the numberof topics is much less than the number of keywords, the documentsare better clustered; since the topics are at a higher semantic levelthan keywords, it is easier for users to understand the clusters gen-erated (see Section 7.3). For example, interdisciplinary proposalsthat cover multiple topics, which are difficult to be identified in thekeyword-based approach, can be easily detected in the topic basedapproach.
5.3 Dynamic Clustering
The distribution of document particles in the 2D space allows usersto visually identify clusters of documents with similar semantics.However, based on individual particles, it is difficult to conductcluster-level operations, such as selecting all documents in a clusterand examining the semantics of a cluster. To address this prob-lem, STREAMIT automatically discovers clusters from the evolv-ing geometric layouts, so that they can be explicitly presented andoperated through the visual interface. Moreover, the visualizationcan display a text stream in the cluster level to reduce clutter andenhance scalability.
5.3.1 Cluster Generation
At a moment, a group of document particles can be consideredforming a semantic cluster with the following definition:Definition: If particles s and t are in a cluster, there must at leastexist a path between s and t, which connects a sequence of particless, p0, p1, ..., pc, t with pairwise line segment, s → p0, p0 → p1,..., pc → t. The maximum length of all the connected segments issmaller than a predefined threshold ζ .Here we use the single linkage rule in defining clusters, which con-siders connected components (with respect to ζ ) as one cluster. Wediscover such clusters directly from the 2D geometric layout. Inparticular, a typical agglomerative algorithm can be applied to par-tition all particles into clusters: starting with N particles formingN clusters, repeatedly merging two clusters according to the dis-tance between the nearest neighbors of them. This straightforwardapproach has O(N2) complexity and does not utilize the geomet-ric layout of the particles. A drawback of this approach is that theresultant clusters are only represented by individual particles andno topological information is provided. Since an effective visual-ization should show the spatial areas of these clusters distinctly, acomputational geometry method has to be invoked to create a sim-ple polygon from the particles of each cluster. To address this prob-lem, we propose to use Delaunay triangulation and graph cut ingenerating clusters. A similar approach has been used in spatialdata mining [7]. The algorithm is shown in Algorithm 2. The graphcut partitions the particles into disjoint sets (i.e. connected compo-nents) that represent the semantic clusters. Figure 2 illustrates thecluster generation process.
Algorithm 2 Creating Clusters From Triangulation
Step 1: Apply Delaunay triangulation for all particles in the sys-tem;Step 2: In the created graph (i.e., the triangle mesh), cut the edgeswhose length is larger than ζ .
Our method has the complexity of O(NlogN)+O(E) for N par-ticles, with O(NlogN) for Delaunay triangulation and O(E) forbrowsing all E edges in graph cut. Since in Delaunay triangulationthe maximal number of edges is 3N −6, O(E)∼ O(N). Therefore,our method achieves O(NlogN), better than the agglomerative al-gorithm.
5.3.2 Cluster Evolution
The created clusters merge and split over time when new documentsarrive or keyword importance is changed. Such evolution of theclusters are critical for knowledge discovery and should be trackedand visualized. Therefore, we propose a method to track clusterevolution. In particular, each cluster is given a distinct ID value foridentification and each particle carries the ID of its cluster. To man-age the cluster identification in a context-aware way, we compute apreferred ID list for each new cluster. The list ranks the IDs carriedby all the particles inside this cluster before the update, accordingto the number of the particles with the same ID. The largest new
cluster is first assigned the top ID in its list. Then we iterativelychoose a cluster according to the cluster size (i.e., the number ofparticles). Each cluster is given one ID following the order of itspreferred list, if the ID has not been assigned to other clusters. Ifall ID choices are occupied, this cluster is given a new ID that didnot appear in the previous step. In this way, large clusters have thetendency to keep their contextual information from previous time.
Each ID is associated with a color, which is assigned to the clus-ter with that ID (see Section 6). To avoid color clutter, we set athreshold K of the number of significant clusters. The largest Kclusters are considered significant and displayed with backgroundhalos in the colors assigned to them. All the other clusters are dis-played without background halos (see Figure 6).
6 VISUALIZATION AND INTERACTION
6.1 Visualization
STREAMIT has a main window, an animation control panel, a key-word/topic table, and a set of document tables (see Figure 3):Main Window: The main window (top left of Figure 3) visuallypresents the movement of the particles through an animated 2D dis-play. Each document particle is represented by a pie. The similari-ties among the documents are reflected by the closeness of the posi-tions. The pie position dynamically changes to reveal the temporalevolution of the stream. A grey scale is used to indicate the age ofthe documents, namely the older a document is, the darker its color(see Figure 3). The size of pies can be proportionally mapped to anattribute of the documents. Moreover, the size and transparency ofpies can be adjusted to lessen any clutter that might be introducedas the number of documents grows. Keywords of interest are repre-sented by pie sectors and their colors can by assigned by users.
Animation Control Panel: STREAMIT buffers recent documentsfalling into a moving time window (named the buffer window) thatis larger than the moving window of currently displayed documents.Users can playback the animation within the buffer window to ex-amine the temporal and semantic evolution of the buffered streamin detail. Users can change the size of the buffer window to explorea longer or shorter time period. An animation control panel is usedto control the playback (see Figure 3(3)). The users can move theslider to start the animation from any moment and they can pausethe display to examine a moment of the stream or change parame-ters such as keyword importance.Keyword and Topic Tables: STREAMIT provides keyword infor-mation in a keyword table which is updated dynamically (see Figure3(1)). It lists all the keywords characterizing the documents cur-rently displayed, their frequencies, importance, and colors. Userscan sort this table to find frequent and important keywords. Theycan also change the keyword importance or colors. When topicmodeling is used, topics will replace keywords in the table and thesignificant keywords describing each topic will be represented.
Document Tables: Users can click a tab to show one of four doc-ument tables (see Figure 3(2)). They display the titles, authors,and timestamps of the following documents respectively: (1) allbuffered documents; (2) all documents that are displayed in themain window; (3) documents selected by users; and (4) documentclusters generated by the system or created by users. The users cansort the documents by their authors or timestamps. They can alsoclick a title to reach the full text of a document.
6.2 Labeling
Labels revealing semantic contents of a collection are desired intext visualization systems. Titles of the documents contain rich se-mantic information in a condensed manner and thus STREAMITuses titles as labels of the documents. Severe clutter can be gen-erated if titles of all documents are displayed. We develop a novellabeling algorithm to provide the most recent semantic informationwith user-controllable clutter levels. In particular, documents are

Figure 3: STREAMIT interface. The left part is the visualization view of text streams, and the right part includes keyword table, document tablesand parameter controls.
divided into groups according to a dissimilarity threshold. Withineach group, the dissimilarities among the documents are less thanthe threshold. Only one document, namely the most recently ar-rived document, is labeled in each group. By interactively chang-ing the dissimilarity threshold, users can control the label clutter. Anewly arrived document is either assigned to an existing group orforms a new group. Thus no labels will be changed except the labelof the group affected. This is an important feature to keep the tem-poral consistency among adjacent displays. The newest injecteddocument will always be labeled, which is usually desired in textstream visualization. Figure 3 shows the automatic labeling results.The newest injected document and its label are highlighted by red(see Figure3(4)) while the selected documents and their labels arehighlighted by orange (see Figure3(5)).
Labels and particles may overlap when a large number of doc-uments are displayed. STREAMIT displays labels on the top ofparticles and allows users to interactively change the transparencyof their background. An opaque background makes the labels easyto read and semi-transparent background (Figure 3) allows users toexamine particles hidden by the labels. Users can turn off all thelabels and they can also turn on/off an individual label by clickingit.
6.3 Visual Representation of Clusters
After the documents are automatically divided into clusters (Section5.3), their outlines are represented by the triangle meshes. Back-ground halos are displayed in the mesh area for significant clustersin the assigned colors. Figures 6(A)-(B) show how the backgroundhaloes allow users to track the clusters during the dynamic visual-ization. The system also allows users to explore clusters in a lesscluttered spiral view where their temporal trends can be examined[4]. Figure 6(C) shows the spiral view of 12 clusters from a NSFaward collection. Each spiral is a time axis located at the center of
a cluster in the original 2D display. The documents of the cluster,displayed as pie charts, are mapped to the spiral according to theirtime stamps. Users can thus learn the temporal trends of the clusterby observing the distribution of the pie charts on the spiral. In topicmodeling view, pies are colored with two colors (red and yellow inFigure 6(C)) to indicate how documents are related to the generaltopics of the cluster. The ratio between the red area and the yellowarea in a pie indicates the number of the most shared keywords (ortopics) in the cluster a document contains, against other keywords(or topics) in this document.
Users can quickly examine an unknown cluster through a key-word cloud triggered by selecting the cluster. It displays the mostsignificant semantic information of the cluster, namely the titles ofthe most recently arrived documents and the keywords with thehighest TF-IDF (Term Frequency-Inverse Document Frequency)weights. Figures 7(A)-(B) show the keyword clouds of two clusters,respectively. The keywords are displayed below the titles, whosesizes indicate their weights. Users can interactively set the colorsof the background, titles, and keywords. By clicking a keyword ina cloud, users can select all documents with this keyword from thecluster.
6.4 Interaction
STREAMIT allows users to interactively manipulate the visualiza-tion according to varying interests. It also allows users to search,track, and examine documents.
6.4.1 2D Display Manipulation
Adjusting Keyword Importance: Users can adjust the keywordimportance to emphasize particular contents of interest and receiveimmediate response (Figure 4).
Grouping and Tracking Documents: User-selected groups or au-tomatically computed clusters can be highlighted by halos in user

assigned colors, which promotes easy document tracking in the dy-namic display. Figure 3(5) and (6) show two groups in orange andblue, respectively.
Browsing and Tracking Keywords: Users can assign colors tokeywords of interest to track them. A document pie conveys thecolors of traced keywords. The size of a color section is propor-tional to the weight of the keyword in the document. Users caninvestigate keyword and document relations and track the evolutionof relevant topics in this way (Figure 4). The users can also click akeyword of interest in the keyword table. All documents containingthe clicked keywords are highlighted by halos. The users can sweepthe keyword table in this way to find keywords of interest.
Setting Moving Windows: Users can interactively change thelength of the moving window, i.e., investigating period, of currentlydisplayed documents.
6.4.2 Document Selection
Manual Selection: Users can manually select documents from thedocument tables, or use a rubber band selection by dragging themouse. The selected documents will be highlighted by halos (Fig-ure 3). Their information will also be displayed in the selecteddocument table (Figure 3(2)).
Example-based Selection: Users can use the current selection asexamples and select documents that are within a distance range tothem. The range is easily controlled to select similar documents.
Keyword-based Selection: Users can select multiple keywordsfrom the keyword table (see Figure 3(1)), and then the related docu-ments are automatically selected and highlighted (see Figure 3(5)).Cluster-based Selection: Users can click the background halo of acluster or its spiral to select all documents in it. They can also clicka keyword in a keyword cloud to select all documents containingthe keyword in the cluster.
Shoebox: In the dynamic environment, users may want to focus onthe temporal evolution and examine the selected documents later.They can easily send the selected documents into a shoebox, whichcan be examined in full text later.
7 CASE STUDIES
We present three case studies in this section. Documents in pre-recorded collections are sorted by their time stamps and fed intoSTREAMIT with an interval of a few seconds to simulate a fastevolving text stream. Topic modeling and dynamic clustering aredemonstrated in the third case study.
7.1 Exploring Barack Obama News
We explore a text stream of 230 New York Times news aboutBarack Obama reported between Jul. 19 and Sep. 18, 2010. Thekeywords are given tags that come with the news. In each docu-ment, the occurrences of the keywords are assigned to a value ofone. The buffer window covers the whole stream. Keyword im-portance is automatically assigned by the algorithm described inEquation 9.
Figure 4(A) shows the display on Aug.13, 2010, where 136 newsarticles are represented. On Aug.13, 2010, we notice that keywordssuch as “Politics and Government”, “International Relations”, “De-fences Military”, and “Terrorism” have high frequency values ac-cording to the keyword table. We assign them distinct colors totrack the articles characterized by them as shown in Figure 4(A).
We increase the importance of the keyword “International Rela-tions”. Figure 4(B) shows that the articles containing this keywordare attracted closer than in Figure 4(A). We easily select them us-ing a rubber band selection and find in the shoebox that they containkeywords such as “China”, “Terrorism” and “Afghanistan War”.
We want to focus on “Afghanistan War” and “Terrorism” sincemost of these news articles are recently inserted (with lighter dark-ness). We click the keyword “Afghanistan War” to select the re-
Table 1: A table of topics.Topic Descriptive Keywords
Topic 2 data;mine;cluster;graph;biology;analysis;discovery
Topic 6 image; scene; model; recognition; language; shape; speech
Topic 12 biological, protein; genom; search; gene; sequence; patent
Topic 13 video; motion; asl; 3D; camera; sign; dance
Topic 15 image; speech; haptic; display; impair; auditory; graphic
Topic 16 query; database; data; xml; stream; edu
Topic 19 data; workflow; privacy; management; web; metadata
lated articles and create a new group named “war” for them. Wealso highlight the group in pink halos (Figure 4(B-2)). We createanother group for “Terrorism” in the same way and highlight it inorange halos (Figure 4(B-3)). Then we continue to play the anima-tion and track the evolution of these groups. Figure 4(C) shows thevisualization when all the news articles are displayed. We noticethat the cluster shown in Figure 4(B-3) gets much bigger. We alsonotice that there is a recent news article (Figure 4(C-4)) that standsin-between it and the cluster shown in Figure 4(B-2). It is related toboth “Afghanistan War” and “Terrorism” (see Figure 4(C-4)). Weselect this article and read it in full detail by clicking the circle.
7.2 Exploring NSF Award Abstracts
We explore 1000 National Science Foundation (NSF) IIS award ab-stracts funded between Mar. 2000 and Aug. 2003 as a text stream.The time-varying funding behavior is critical in understanding re-search and administrative trends. Each document was automaticallycharacterized by a set of keywords and its corresponding pie size isproportional to the funding amount of the project.
Figure 5 shows several snapshots of the dynamic visualization.Figures 5(A) and (B) show the stream in two adjacent months. Wenotice that multiple large projects started from the second month.We pause the animation, select items of interest, and then examinethem in detail. From the shoebox, we observe that the keywords“Management” and “Database” appear in many of these project ab-stracts. We highlight the keyword “Management” in red and thekeyword “Database” in green. We also increase their importancevalues so that we can observe the relevant abstracts easier (Figure5(B)). Although some abstracts contain both keywords (Figure 5(B-1)), there are many other abstracts that contain only one of them.We pull back the animation to the previous month (Figure 5(A)) toexamine the temporal evolution of these topics. When the streamfurther evolves, we observe that IIS continuously supported projectswith these keywords (Figure 5(C)).
In Figure 5(C), we highlight all projects containing the keyword“sensor” by halos. The node with a halo indicated by the arrow(Figure 5(C-2)) is a potential transformative proposal since it is faraway from the other projects with halos. We examine this abstractin detail and find that it is a project about just-in-time informationretrieval on wearable computers.
7.3 Exploring NSF Award Abstract with Topic Modelingand Dynamic Clustering
We explore the same NSF data with the topic modeling and dy-namic clustering. It reveals how these features significantly in-crease the scalability of STREAMIT. Figure 6(A) can be comparedto Figure 5(B) to demonstrate the difference between the topic-based visualization and keyword-based visualization. They showthe same set of documents at the same month.
It can be seen that a large number of documents that seem notrelated to other documents actually belong to clusters in the highersemantic level. Table 1 shows a list of the involved topics in Figure6(A). Topics 16 (red pie sections in Figure 6(A)) and 19 (green piesections in Figure 6(A)) contain the keywords “Database” (red piesections in Figure 5(B)) and “Management” (green pie sections inFigure 5(B)), respectively. The semantics of the related clusters

Figure 4: Barack Obama news. (A) Aug. 13, 2010, 136 news articles; (B) after increasing importance of “International Relations”; (C) Sep. 18,2010, 230 news articles. Keyword colors: “Politics” - green, “International Relations” - red, “Terrorism” - yellow, and “Defense and Military” - blue.
Figure 5: NSF award collections. (A) Aug. 1, 2000, 95 research projects; (B) Sep. 1, 2000, 172 research projects; (C) Mar. 15, 2002, 672research projects. Keyword colors: “Management” - green, “Database” - red.
is easier to understand in the topic-based visualization than in thekeyword-based visualization.
Figure 6(A)-(B) demonstrate dynamic cluster evolution. In Fig-ure 6(A), we can see a handful of clusters. The cluster (A)-(1)mainly about Topic 15 and the cluster (A)-(2) mainly about Topic6 merge into one larger cluster (B)-(3). In Figure 6(B), we observetwo newly formed clusters: the cluster (B)-(4) mainly about Topic13 and the cluster (B)-(5) mainly about Topic 12. The visual ef-fects help users identify critical data variation. Users can discoversemantic details of the evolving clusters by examining their key-word clouds. Figure 7 shows the keyword clouds for the two newclusters, namely (B)-(4) and (B)-(5), respectively.
Figure 6(C) displays the spiral view of clusters at the same mo-ment with Figure 6(B). Each spiral represents a cluster: (C)-(6)represents (B)-(4) and (C)-(7) represents (B)-(5). Two or three mostsignificant topic names of a cluster are displayed below its spiral.Users can also examine details from the keyword clouds. Each pieon a spiral represents a document. The red area of a pie indicateshow the document is related to this cluster’s major theme. In Figure6(C), we can discover that large pies (i.e., large projects with fund-ing amount over 1 million project) typically have small red area,indicating that they are probably interdisciplinary projects. On thecontrary, small projects usually involve fewer topics and agree more
with the clusters.
8 PERFORMANCE OPTIMIZATION
Algorithm 1 is an O(N2) approach and Algorithm 2 is an O(NlogN)approach. We seek to optimize the performance of our system byapplying parallel computing and similarity grid to improve its scal-ability for large data sets.
8.1 GPU Acceleration
Our computational algorithm is inherently parallel at each simula-tion step. Hence, we accelerate the computation on graphics hard-ware with CUDA implementation similar to an N-body problem 1.N particles execute their force-placement algorithm simultaneouslyas individual threads distributed to a grid of CUDA blocks. Eachthread accesses and updates the particle’s position from the infor-mation of last step loaded into the shared memory of the blocks.
As shown in Table 2, we achieved very good performance on anNVidia NVS 295 GPU with 2GB memory for large scale data sets,compared with an Intel Core2 1.8GHz CPU with 2GB RAM. Weconducted a few experiments using text streams from the New YorkTimes news. For each frame, the simulation ran multiple steps with
1htt p.developer.nvidia.com/GPUGems3/gpugems3 ch31.html
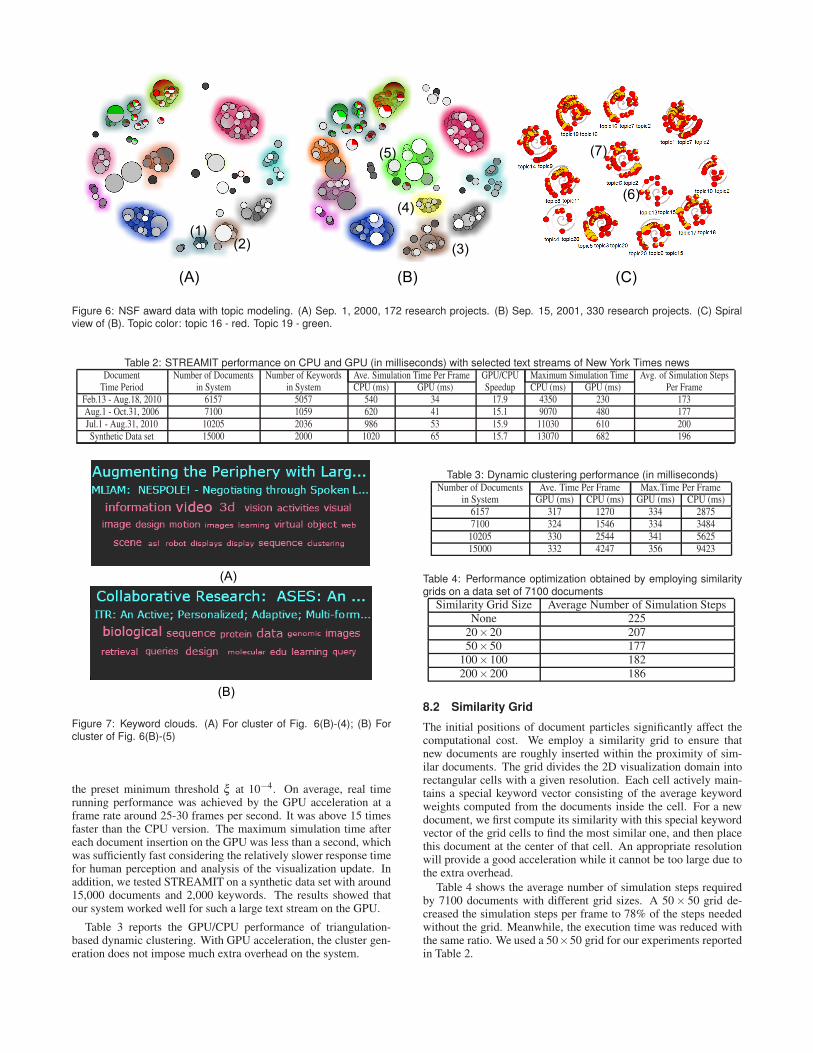
Figure 6: NSF award data with topic modeling. (A) Sep. 1, 2000, 172 research projects. (B) Sep. 15, 2001, 330 research projects. (C) Spiralview of (B). Topic color: topic 16 - red. Topic 19 - green.
Table 2: STREAMIT performance on CPU and GPU (in milliseconds) with selected text streams of New York Times newsDocument Number of Documents Number of Keywords Ave. Simulation Time Per Frame GPU/CPU Maximum Simulation Time Avg. of Simulation Steps
Time Period in System in System CPU (ms) GPU (ms) Speedup CPU (ms) GPU (ms) Per Frame
Feb.13 - Aug.18, 2010 6157 5057 540 34 17.9 4350 230 173
Aug.1 - Oct.31, 2006 7100 1059 620 41 15.1 9070 480 177
Jul.1 - Aug.31, 2010 10205 2036 986 53 15.9 11030 610 200
Synthetic Data set 15000 2000 1020 65 15.7 13070 682 196
Figure 7: Keyword clouds. (A) For cluster of Fig. 6(B)-(4); (B) Forcluster of Fig. 6(B)-(5)
the preset minimum threshold ξ at 10−4. On average, real timerunning performance was achieved by the GPU acceleration at aframe rate around 25-30 frames per second. It was above 15 timesfaster than the CPU version. The maximum simulation time aftereach document insertion on the GPU was less than a second, whichwas sufficiently fast considering the relatively slower response timefor human perception and analysis of the visualization update. Inaddition, we tested STREAMIT on a synthetic data set with around15,000 documents and 2,000 keywords. The results showed thatour system worked well for such a large text stream on the GPU.
Table 3 reports the GPU/CPU performance of triangulation-based dynamic clustering. With GPU acceleration, the cluster gen-eration does not impose much extra overhead on the system.
Table 3: Dynamic clustering performance (in milliseconds)Number of Documents Ave. Time Per Frame Max.Time Per Frame
in System GPU (ms) CPU (ms) GPU (ms) CPU (ms)
6157 317 1270 334 2875
7100 324 1546 334 3484
10205 330 2544 341 5625
15000 332 4247 356 9423
Table 4: Performance optimization obtained by employing similaritygrids on a data set of 7100 documents
Similarity Grid Size Average Number of Simulation Steps
None 225
20×20 207
50×50 177
100×100 182
200×200 186
8.2 Similarity Grid
The initial positions of document particles significantly affect thecomputational cost. We employ a similarity grid to ensure thatnew documents are roughly inserted within the proximity of sim-ilar documents. The grid divides the 2D visualization domain intorectangular cells with a given resolution. Each cell actively main-tains a special keyword vector consisting of the average keywordweights computed from the documents inside the cell. For a newdocument, we first compute its similarity with this special keywordvector of the grid cells to find the most similar one, and then placethis document at the center of that cell. An appropriate resolutionwill provide a good acceleration while it cannot be too large due tothe extra overhead.
Table 4 shows the average number of simulation steps requiredby 7100 documents with different grid sizes. A 50× 50 grid de-creased the simulation steps per frame to 78% of the steps neededwithout the grid. Meanwhile, the execution time was reduced withthe same ratio. We used a 50×50 grid for our experiments reportedin Table 2.
8.3 Discussion
The performance optimization makes our system applicable in amonitoring setting for live streams. The New York Times newsare produced continuously, averaging 3 documents per hour and amaximum of 8 documents per hour at the peak time. The minimuminterval between consecutive arrival is around 1 minutes. A capablereal-time visualization system should handle newly inserted itemsfaster than this minimum interval. From Table 2, the maximumsimulation time of the CPU computing is a few seconds. With GPUacceleration, the handling time is further reduced to less than onesecond. Therefore, our system can be effectively employed for thisnews stream with many thousands of documents accommodated inthe display for analysis. Note that the capability is provided with anordinary consumer PC and graphics card. Our system is being up-graded to handle even larger text streams with advanced GPUs. It isimportant not to overwhelm the users with the flood of information.Our system allows users to manipulate the simulation speed, andusers can pause the system and save clusters/documents for furtherinvestigation. We will also utilize the unbalanced text streamingspeed in future improvement.
9 CONCLUSION
We have presented a new visual exploration system, STREAMIT,for text streams. The system employs a physical framework to clus-ter and dynamically analyze incoming documents. A new DynamicKeywords Importance helps users interactively manipulate the im-portance of keywords for different visualization results. Topic mod-eling is incorporated into our system and a triangulation basedclustering helps better visualization. Furthermore, the system isequipped with powerful interactive tools and accelerated on con-sumer GPUs, consequently providing fast simulation, immediateresponse and convenient control.
In future work, we will integrate STREAMIT with online topicmodeling techniques to visualize text stream with frequently evolv-ing topics. Furthermore, we will conduct user studies to further as-sess the feasibility of the system. We also plan to apply STREAMITto a variety of real life applications.
ACKNOWLEDGMENT
This work is in part supported by NSF grant IIS-0915528, IIS-0916131, NSFDACS10P1309 and Ohio OBR. We thank the anony-mous reviewers for helpful reviews and Zhi Yuan for improving thesystem.
REFERENCES
[1] C. Albrecht-Buehler, B. Watson, and D. Shamma. Visualizing live text
streams using motion and temporal pooling. IEEE Computer Graphics
and Applications, 25(3):52–59, June 2005.
[2] J. Alsakran, Y. Chen, Y. Zhao, J. Yang, and D. Luo. Streamit: Dy-
namic visualization and interactive exploration of text streams. In Pro-
ceedings of IEEE Pacific Visualization Symposium, pages 131–138,
2011.
[3] D. M. Blei, A. Y. Ng, and M. I. Jordan. Latent Dirichlet allocation. J.
Mach. Learn. Res., 3:993–1022, March 2003.
[4] J. Carlis and J. Konstan. Interactive visualization of serial periodic
data. In Proceedings of the 11th annual ACM symposium on User
interface software and technology, pages 29–38, 1998.
[5] T. Fruchterman and E. Reingold. Graph drawing by force-directed
placement. Software - Practice and Experience, 21(11):1129–1164,
Nov. 1991.
[6] E. G. Hetzler, V. L. Crow, D. A. Payne, and A. E. Turner. Turning
the bucket of text into a pipe. In Proceedings of IEEE Symposium
on Information Visualization, page 12, Washington, DC, USA, 2005.
IEEE Computer Society.
[7] I.-S. Kang, T.-w. Kim, and K.-J. Li. A spatial data mining method by
delaunay triangulation. In ACM GIS, pages 35–39, New York, NY,
USA, 1997. ACM.
[8] D. Luo, J. Yang, M. Krstajic, J. Fan, W. Ribarsky, and D. Keim. Even-
triver: An event-based visual analytics approach to exploring large
text collections with a temporal focus. In IEEE Transactions on Visu-
alization and Computer Graphics, To appear.
[9] F. Paulovich and R. Minghim. Hipp: A novel hierarchical point place-
ment strategy and its application to the exploration of document col-
lections. IEEE Transaction on Visualization and Computer Graphics,
16(8):1229–1236, Nov. 2008.
[10] G. Salton and C. Buckley. Term-weighting approaches in automatic
text retrieval. Information Processing and Management, 24(5):513–
523, 1988.
[11] J. A. Wise, J. J. Thomas, K. Pennock, D. Lantrip, M. Pottier, A. Schur,
and V. Crow. Visualizing the non-visual: spatial analysis and interac-
tion with information for text documents. Readings in information
visualization: using vision to think, pages 442–450, 1999.
[12] P. C. Wong, H. Foote, D. Adams, W. Cowley, and J. Thomas. Dy-
namic visualization of transient data streams. IEEE Symposium on
Information Visualization, 0:13, 2003.
Jamal Alsakran is a PhD candidate at the Department of Com-puter Science at Kent State University. His research is focused inmultidimensional and text visualization, and visual analytics.
Yang Chen is a PhD student in the Department of ComputerScience at University of North Carolina at Charlotte. His researchinterests include visual analytics and information visualization.
Dongning Luo is a PhD student in the Department of Com-puter Science at University of North Carolina at Charlotte. Hisresearch interest is information visualization.
Wenwen Dou is a Ph.D. candidate at University of NorthCarolina at Charlotte. Her research is in the areas of visualanalytics and human-computer interaction.
Ye Zhao is an assistant professor in the Department of Com-puter Science at Kent State University. His research interestsinclude natural phenomena modeling, data visualization and visualanalytics. He received a PhD in computer science from StonyBrook University.
Jing Yang is an associate professor in the Computer ScienceDepartment at the University of North Carolina at Charlotte.Her research interests include visual analytics and informationvisualization. She has a PhD in computer science from WorcesterPolytechnic Institute.
Shixia Liu is a lead researcher at Microsoft Research Asia.
Her research interests include visual text analytics and visualsocial network analysis.
![Real-time Visualization of Streaming Text with Force-Based ...€¦ · IN-SPIRE[11] toa dynamic document flow. Whennew documents areadded, theexistingvocabularycontent isadjustedandthevisual](https://img.pdfslide.net/doc/110x75/6045467a9ba799731d35fddb/real-time-visualization-of-streaming-text-with-force-based-in-spire11-toa.jpg)