Embed Size (px)
Citation preview

Reasoning and Sense Making in Data Analysis & Statistics
Beth ChanceHenry KranendonkMike Shaughnessy

NCTM’s Series on Reasoning & Sense Making
The Council has published its official position on the role and importance of focusing on students’ reasoning in the teaching of mathematics in the new publication
Focus in High School Mathematics: Reasoning & Sense Making
(NCTM, 2009)
Focus in High School Mathematics: Reasoning and Sense Making
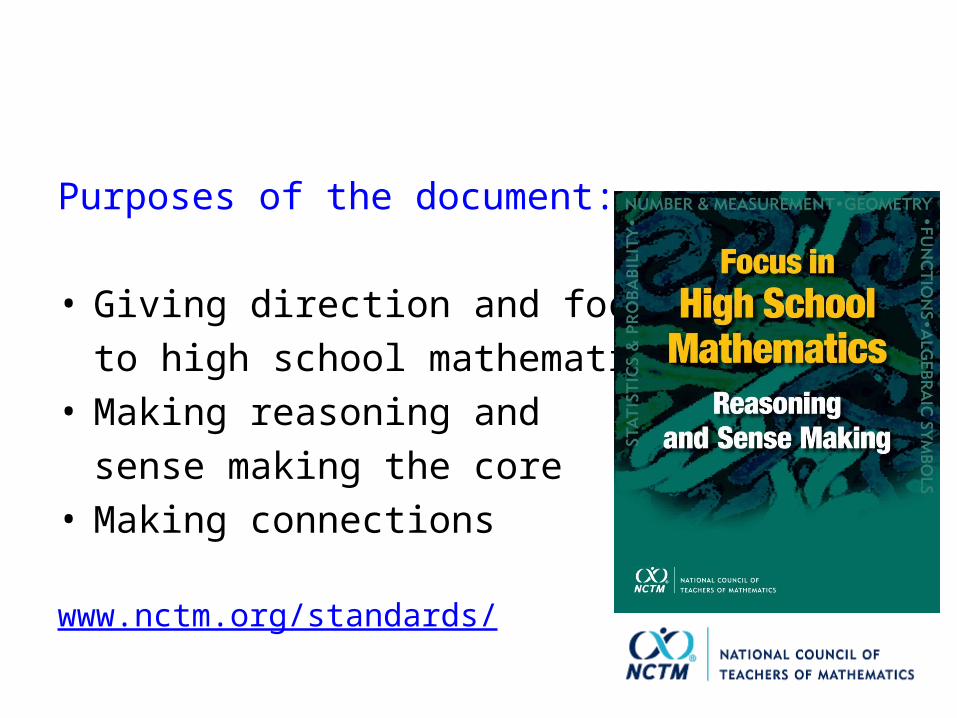
Purposes of the document:
• Giving direction and focusto high school mathematics
• Making reasoning andsense making the core
• Making connections
www.nctm.org/standards/
The Role of RSM in School Mathematics
“Reasoning and sense making should occur in every mathematics classroom every day.
In such an environment, teachers and students ask and answer such questions as ‘What’s going on here?’ and ‘Why do you think that?’”

Critical Need for the Reasoning and Sense Making Effort
Students need opportunities to:• Make conjectures• Share their representations of problems• Question their peers• Justify their reasoning• Pose further questions
Accompanying Series of FRSM Books
Focus in Reasoning and Sense Making in:
• Statistics & Probability (Appeared, Fall 2009)
• Algebra (just out!)• Geometry (next month)• Equity in promoting Reasoning and Sense
Making for ALL students (Fall) • Reasoning with Technology (next spring)
FocusFocus on Statistical Reasoningigh School Mathematics: Reasoning and Sense Making

Core Statistical Concepts Involved in Reasoning and Sense Making
• “Notions such as distribution, center, spread, association, uncertainty, randomness, sampling, and statistical experiments are foundational concepts underlying the development of statistical reasoning.”
(Guidelines for Assessment and Instruction in Statistics Education, GAISE, ASA 2006)
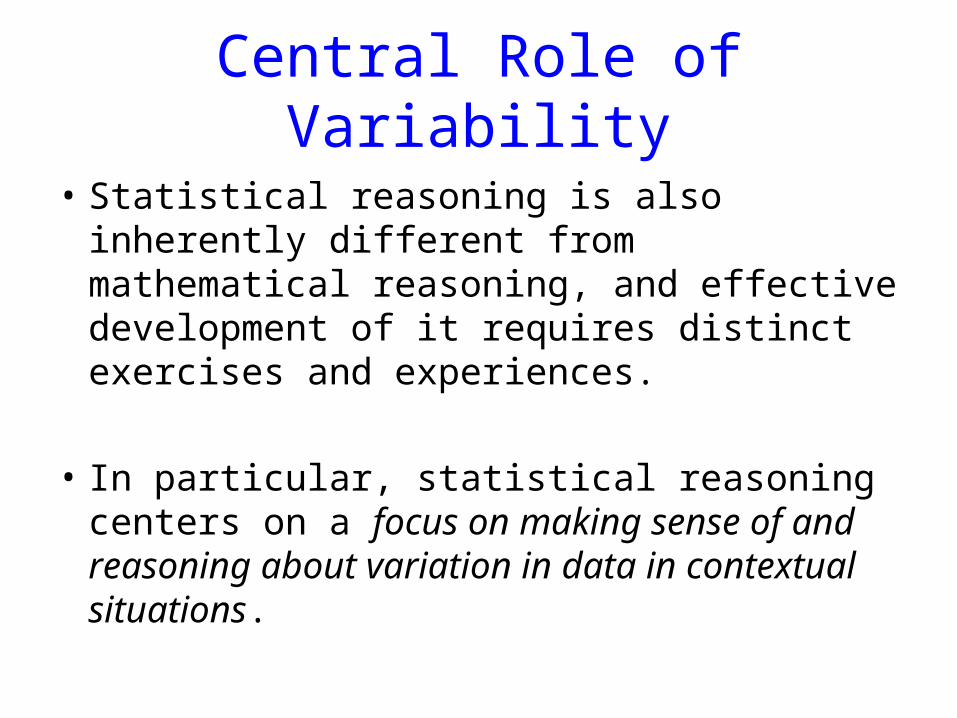
Central Role of Variability
• Statistical reasoning is also inherently different from mathematical reasoning, and effective development of it requires distinct exercises and experiences.
• In particular, statistical reasoning centers on a focus on making sense of and reasoning about variation in data in contextual situations.

Chapters in Reasoning and Sense Making in Statistics
• Country Data—A look at census data• Old Faithful—Becoming a data detective• Will women run faster than men in the
Olympics? –Fitting models to data• Starbucks Customers—Designing an
observational study• Memorizing Words—Is the treatment effect
real?• Soft Drinks and Heart Disease—Critiquing a
statistical study
Our Goals Today
• To give you a ‘mini-experience’ from several of these investigations that enable teachers to tap student reasoning and sense making in statistics
• And, hope that these ‘teasers’ will intrigue you so that you will give them a try yourselves.
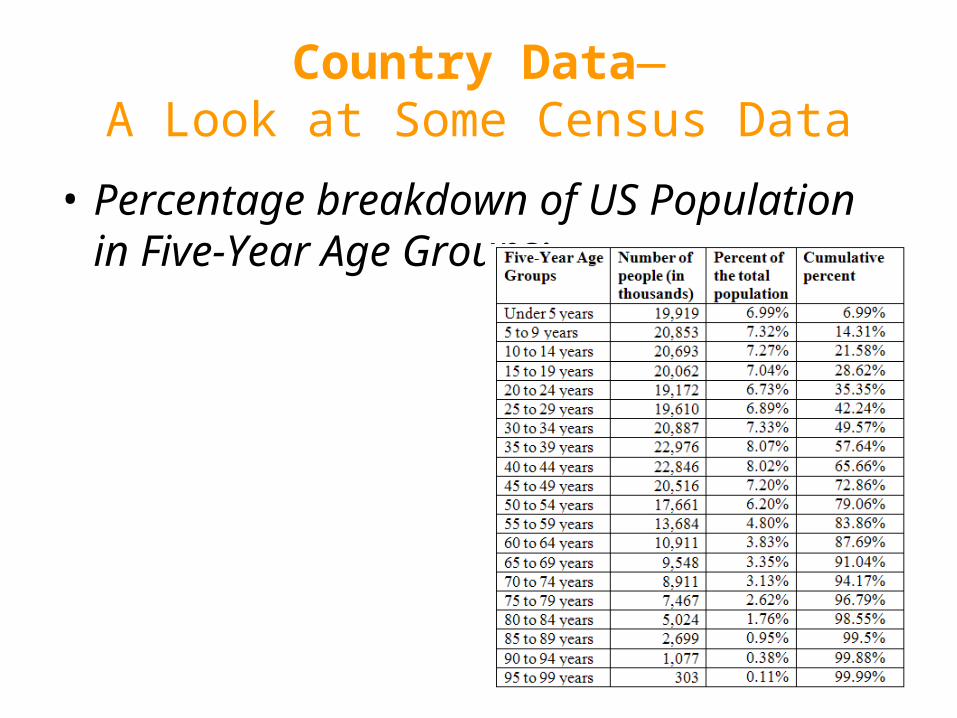
Country Data—A Look at Some Census Data
• Percentage breakdown of US Population in Five-Year Age Groups:

Comparing Countries
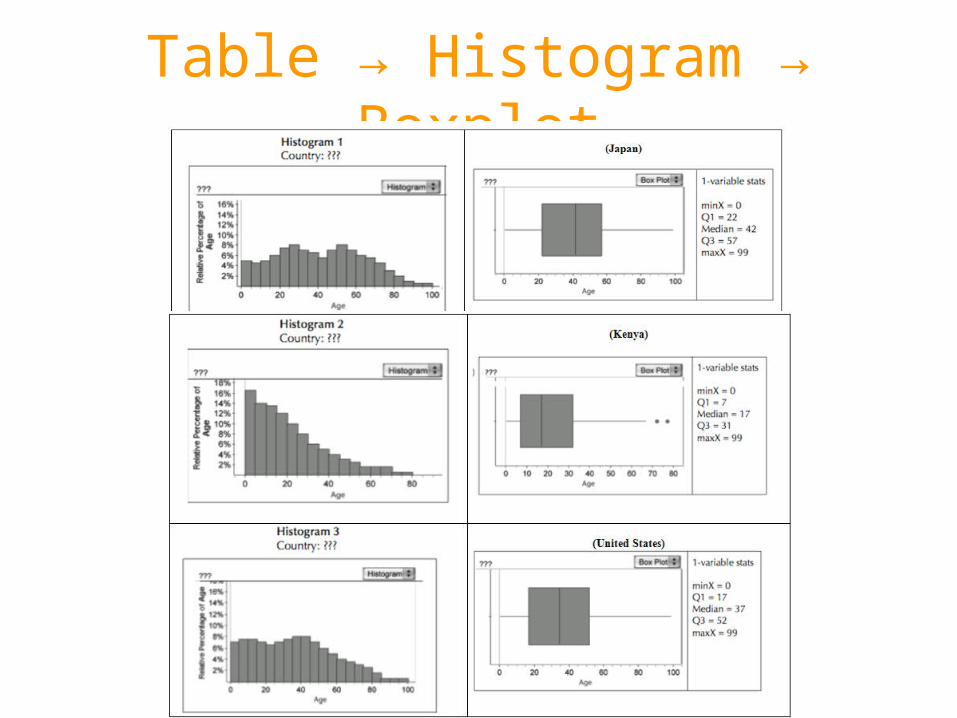
Table → Histogram → Boxplot

Will Women Run Faster Than Men?
• How can we use this data to investigate our research question?

Gap Times
• Female – Male (in sec)
• What does the above mean? How can we use this data to investigate our research question?

Time differences• What trend do we see?
• If women were to run as fast as men, how would that be represented in this graph?
• How would a faster time for women be represented?

Regression Line
• The linear regression represents the gap. Is this line a good summary of what is happening? Why or why not?

Separate Regression Lines
• If women will run as fast or faster than men, how would it be presented in this graph?
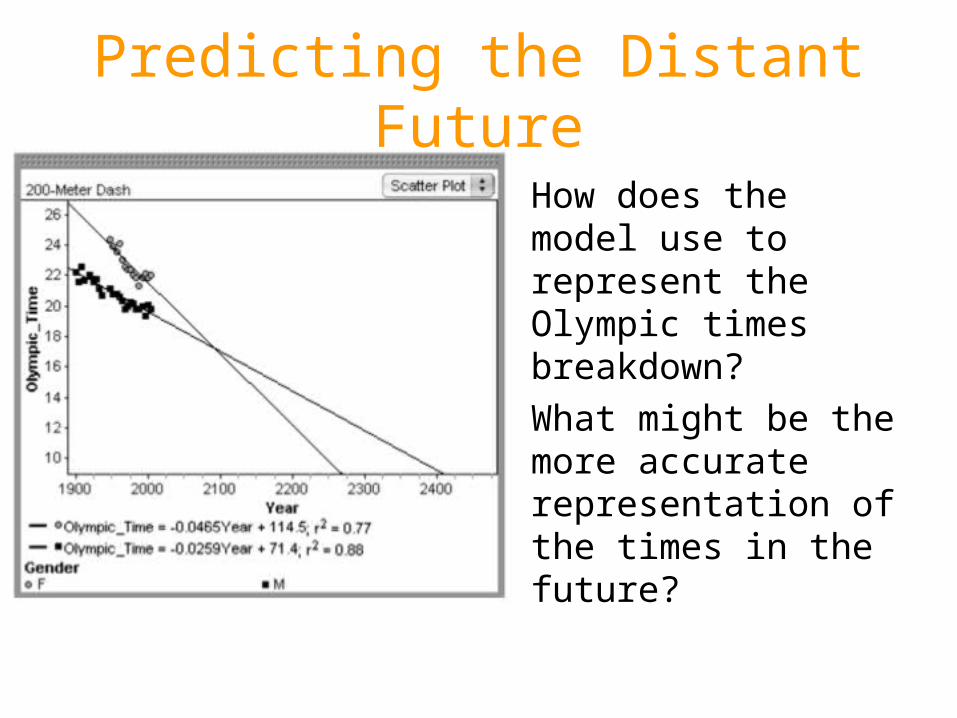
Predicting the Distant Future
• How does the model use to represent the Olympic times breakdown?
• What might be the more accurate representation of the times in the future?
Time = -0.0466Year + 114.8; r2 = 0.77Time = -0.0259Year + 71.4; r2 = 0.88
genderfemale male
10
12
14
16
18
20
22
24
26
Year
1900 2000 2100 2200 2300 2400
200-Meter Dash Scatter Plot
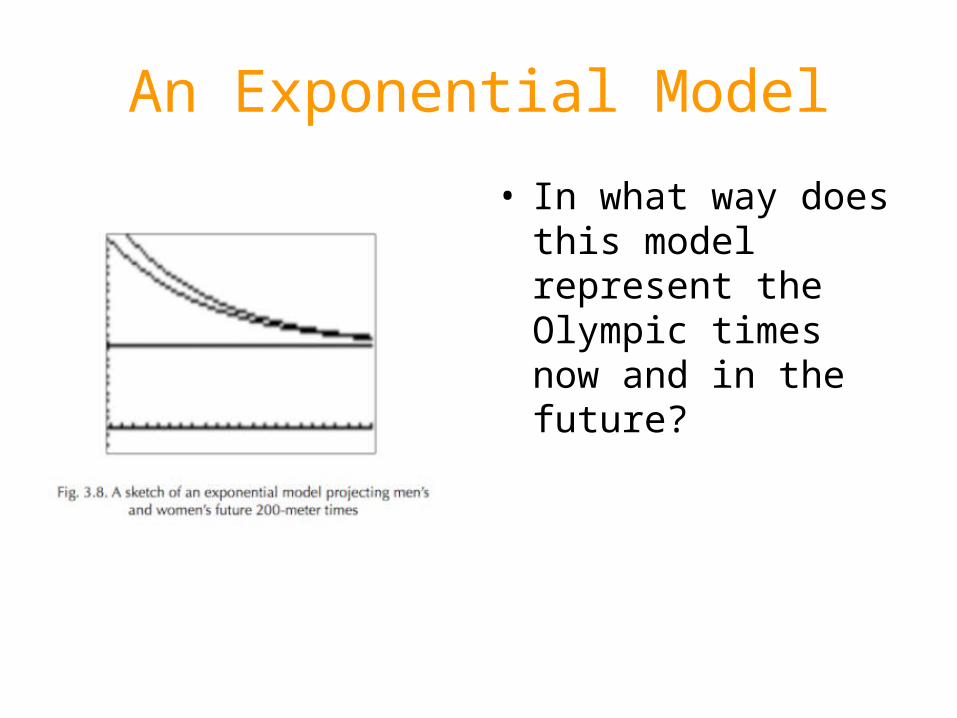
An Exponential Model
• In what way does this model represent the Olympic times now and in the future?
Eruptions of the Old Faithful Geyser—Becoming a Data Detective
• Data on wait times between successive eruptions (blasts) of geysers were first collected by the National Park Service and the U.S. Geological Survey in Yellowstone National Park.
• The data were collected to establish some baseline information that could then be used to track and compare long-term behavior of geysers.
Becoming a Data Detective
• In this investigation, you will put on a ‘data detective’ hat, investigate some data from Old Faithful, and conjecture about the time that someone might expect to wait for Old Faithful to erupt.

Old Faithful --Minutes Between Blasts
• –each row represents about 1 days’ data• 1) 86 71 57 80 75 77 60 86 77 56 81 50 89 54 90 73 60 83 • 2) 65 82 84 54 85 58 79 57 88 68 76 78 74 85 75 65 76 58 • 3) 91 50 87 48 93 54 86 53 78 52 83 60 87 49 80 60 92 43 • 4) 89 60 84 69 74 71 108 50 77 57 80 61 82 48 81 73 62 79 • 5) 54 80 73 81 62 81 71 79 81 74 59 81 66 87 53 80 50 87 • 6) 51 82 58 81 49 92 50 88 62 93 56 89 51 79 58 82 52 88• 7) 52 78 69 75 77 53 80 55 87 53 85 61 93 54 76 80 81 59• 8) 86 78 71 77 76 94 75 50 83 82 72 77 75 65 79 72 78 77 • 9) 79 75 78 64 80 49 88 54 85 51 96 50 80 78 81 72 75 78 • 10) 87 69 55 83 49 82 57 84 57 84 73 78 57 79 57 90 62 87 • 11) 78 52 98 48 78 79 65 84 50 83 60 80 50 88 50 84 74 76• 12) 65 89 49 88 51 78 85 65 75 77 69 92 68 87 61 81 55 93• 13) 53 84 70 73 93 50 87 77 74 72 82 74 80 49 91 53 86 49• 14) 79 89 87 76 59 80 89 45 93 72 71 54 79 74 65 78 57 87• 15) 72 84 47 84 57 87 68 86 75 73 53 82 93 77 54 96 48 89• • • 16) 63 84 76 62 83 50 85 78 78 81 78 76 74 81 66 84 48 93

Task Set Up
• Pick any row of these wait times so that your ‘group’ has a sample of a day of Old Faithful wait times
• Look over the data. Is there anything that you notice, or anything that you wonder about in your sample of data? Jot down some “notices” and “wonders.”
Graphical Representations
• Create at least one type of visual or graphical representation for that row of data to help to visualize any patterns in the wait times.
• On the basis of your data and graphs, make a decision about how long you would expect to wait between blasts of Old Faithful, and your reason why.

Examples of Student Reasoning
• Group A Reasoning: (made a bar graph of individual case values)
“We picked a time more in the middle for our prediction, as some would be higher, some lower, but there were a lot of middle height bars that were around 70, so we think we’d have to wait about 70 minutes. “
Group B Reasoning(on stem & leaf plot)
• “We noticed there was a lot of variation in our data—a very wide spread—so we used the average as a middle point. We calculated the average wait time to be about 68 minutes, so we would predict we’d wait about that long—about an hour. “

Group C Reasoning 1
• “On the basis of our first frequency graph we’d expect to wait about 75 minutes, because it shows most wait times for the eruption in the 75 to 79 minute range.

Group C Graph 1
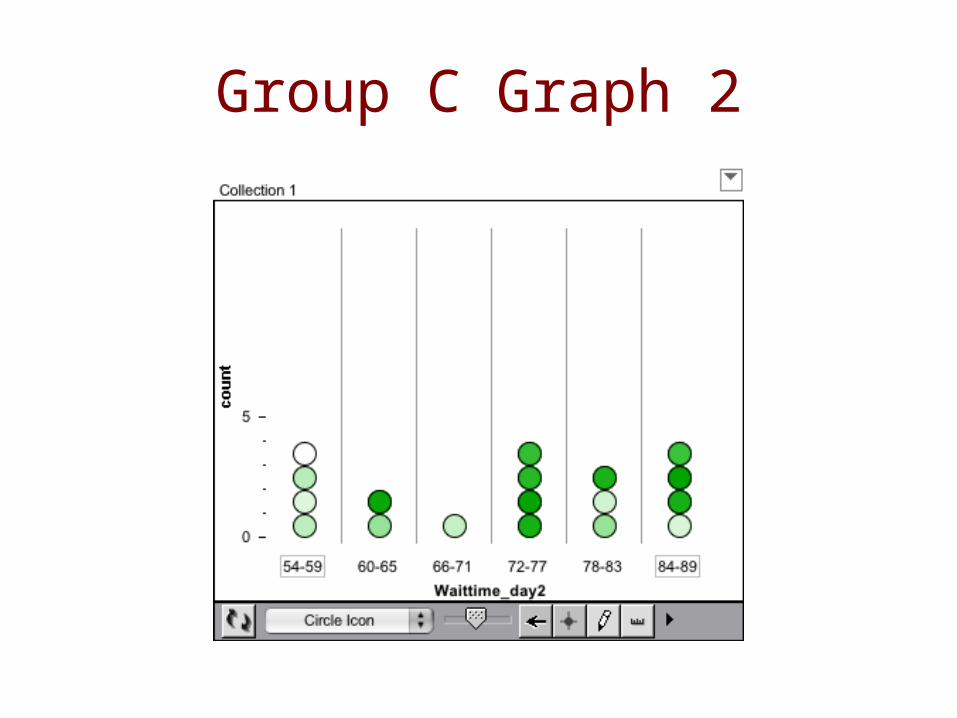
Group C Reasoning 2
• But then we saw that if we chose our intervals in another way we obtained something different. There is no obvious pattern here, and we thought that a person could just as easily wait about 55, or 75, or 85 minutes, because all three of those times were equally frequent in this (second) graph, each occurring 4 times.”
Group C Graph 2

Group D Reasoning
• “The middle 50 percent goes from 65 minutes to 82 minutes for day 2, and from about 53 minutes to 87 minutes for day 3.
• So, overall from the two days combined we concluded that 50 percent of the time you’d probably have to wait at least an hour, and perhaps as much as an hour and 20 minutes.”

Group D Graph

Group E Reasoning
• “We think we see a pattern in the data. There seems to be an up-down pattern in the wait times in day 3. It was easier to see when we connected the dots in our plot.
• Then we did the same thing for day 2, and the up-down pattern in wait times appears there, too. It’s not always perfect, but a long wait time is usually followed by a short time, and a short one by a long one.”
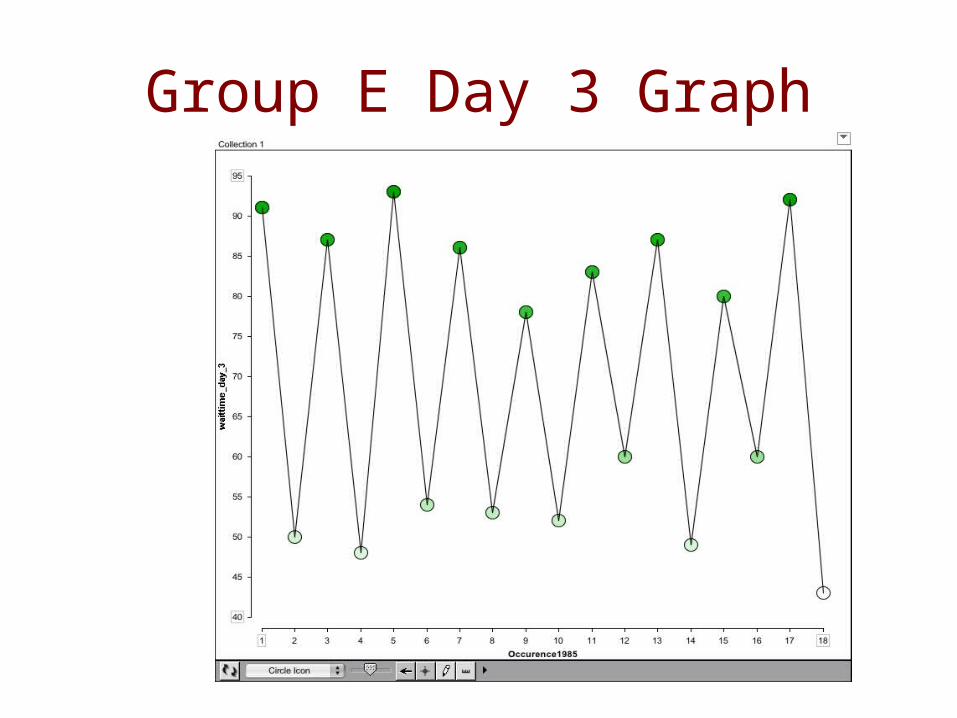
Group E Day 3 Graph
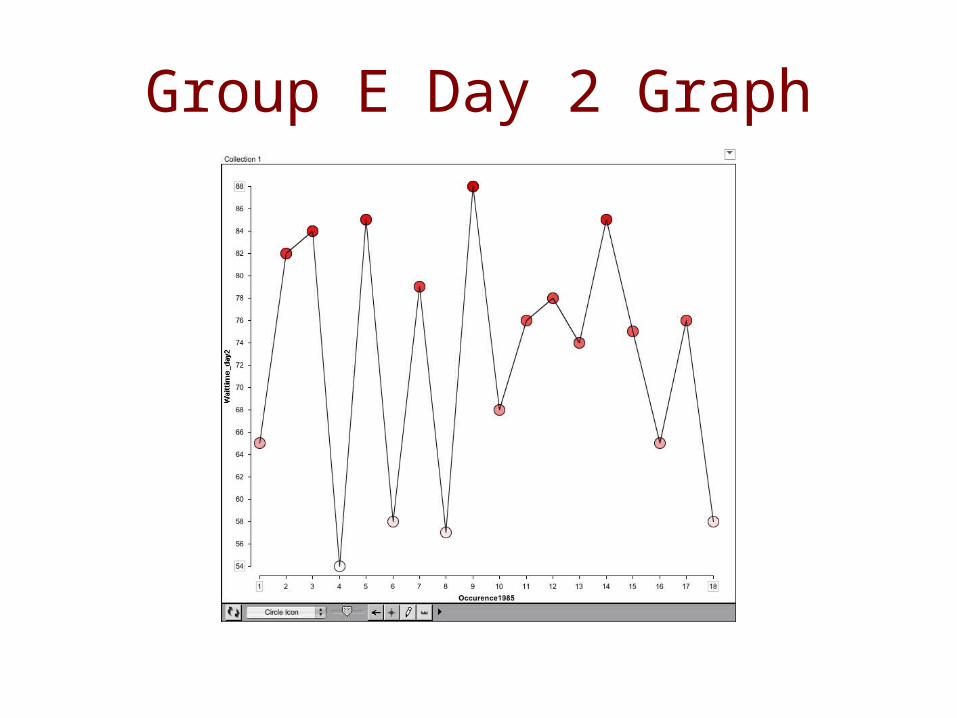
Group E Day 2 Graph
Analyzing the Progression of Student Reasoning in their Graphs
• Case value representations—and clustering• Measures of center—mode, median, mean• Looking at ‘likely range’—a sign of accounting
for variation• Closer look at variation over time—it’s not
totally ‘random’ in this case—special cause variation vs. common cause variation
• Extensions—students pose and investigate new questions

Reasoning Extensions from Students’ “Wonders”
• Graph all the 1985 data for Old Faithful—what do you notice in the graph?
• What if we knew the ‘previous’ wait time? Would that give us extra information?
• What is Old Faithful doing now? Is it still behaving the same way?

Memorizing Words – Is the treatment effect real?
• Two groups of students each given a set of words to memorize– Group 1: Meaningful words– Group 2: Nonsense words
• We want to investigate whether giving students meaningful words increases the number of words they remember
• Question 1: How design such a study?
Examples of Student Reasoning
• Not sufficient detail– Write out a protocol that you could hand to another
student and they could carry out to your exact specifications
• Randomizers– Really focus on what “random” means here, precise
definition vs. everyday usage• Too much detail
– Convince them that random assignment really “works”

Examining the Data
• Group A: 12, 15, 12, 12, 10, 3, 7, 11, 9, 14, 9, 10, 9, 5, 13
• Group B: 4, 6, 6, 5, 7, 5, 4, 7, 9, 10, 4, 8, 7, 3, 2
Mean = 10.07Mean = 5.80
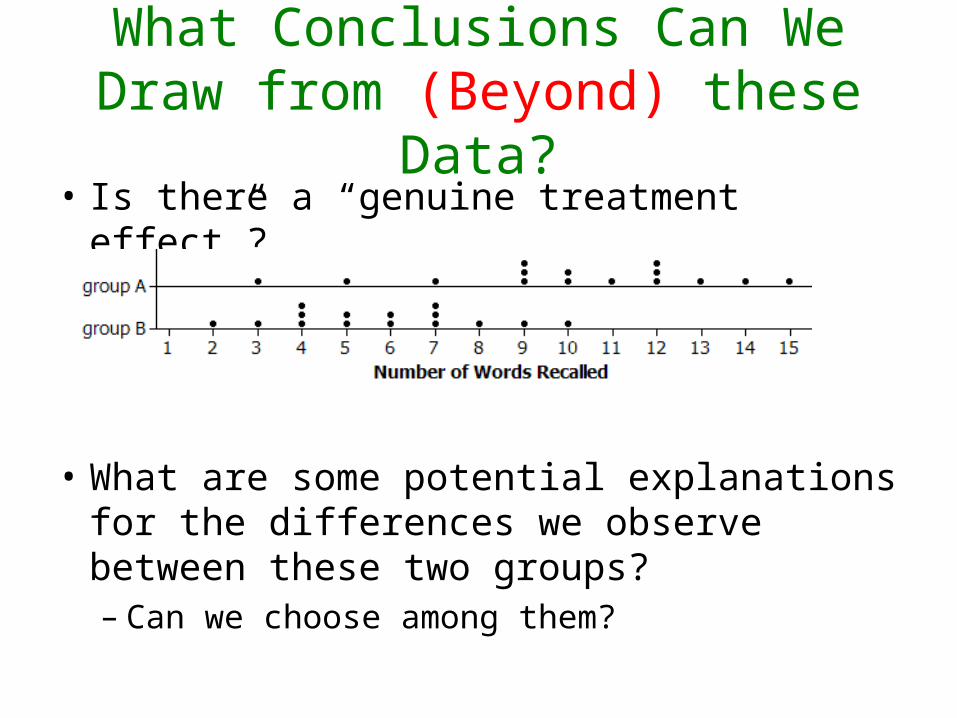
What Conclusions Can We Draw from (Beyond) these Data?
• Is there a “genuine treatment effect”?
• What are some potential explanations for the differences we observe between these two groups?– Can we choose among them?
Dice Rolling

What Conclusions Can We Draw from (Beyond) these Data?
• Is there a “genuine treatment effect”?
• Could we have gotten such results just “by chance alone” from the random assignment process?
Statistical Significance
• Assume no treatment effect, everyone gets their same score no matter which group they were assigned to, can “luck of the draw” produce a difference in means as large as 4.27 in favor of Group A?
• Every score on an index card, shuffle and deal out two groups of 15, determine the difference in means (Group A – Group B)
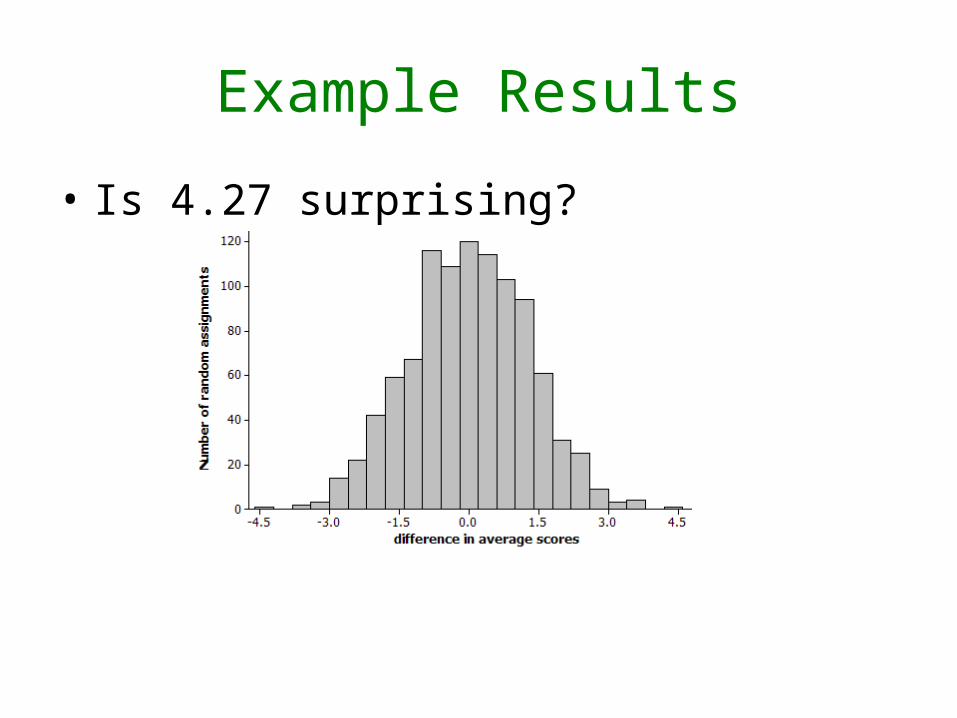
Example Results
• Is 4.27 surprising?

Examples of Student Reasoning
• Not really going beyond the data• Not considering variability• Mistaking randomization distribution for
confirmation of null model– Not using data

Reasoning Extensions
• Difference in Medians• Changes in variability and sample size
– Within group variability– Between group variability

Questions?