Embed Size (px)
Citation preview
Recap of basic SPSS and statistics
5th - 9th December 2011, Rome
Manage the database Import / export file Import variable from another database / merge files Restructure cases to variables
Merging datasets For each level of investigation in a survey, there is
typically a dataset For example if a survey asks questions at the household
level, then measures anthropometry of children under 5 and for women of reproductive age as well as a community level questionnaire, we would expect 4 separate datasets to be created
To do analysis that looks at a case in respect to its context, datasets must be merged
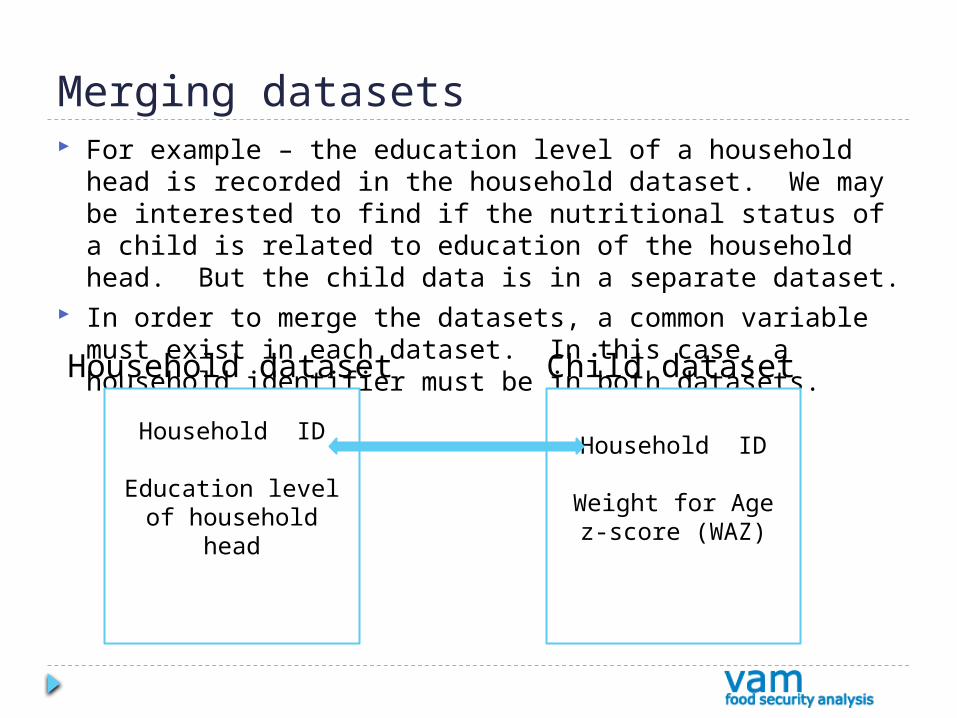
Merging datasets For example – the education level of a household head is recorded in the
household dataset. We may be interested to find if the nutritional status of a child is related to education of the household head. But the child data is in a separate dataset.
In order to merge the datasets, a common variable must exist in each dataset. In this case, a household identifier must be in both datasets.
Household ID
Education level of household head
Household ID
Weight for Age z-score (WAZ)
Household dataset Child dataset
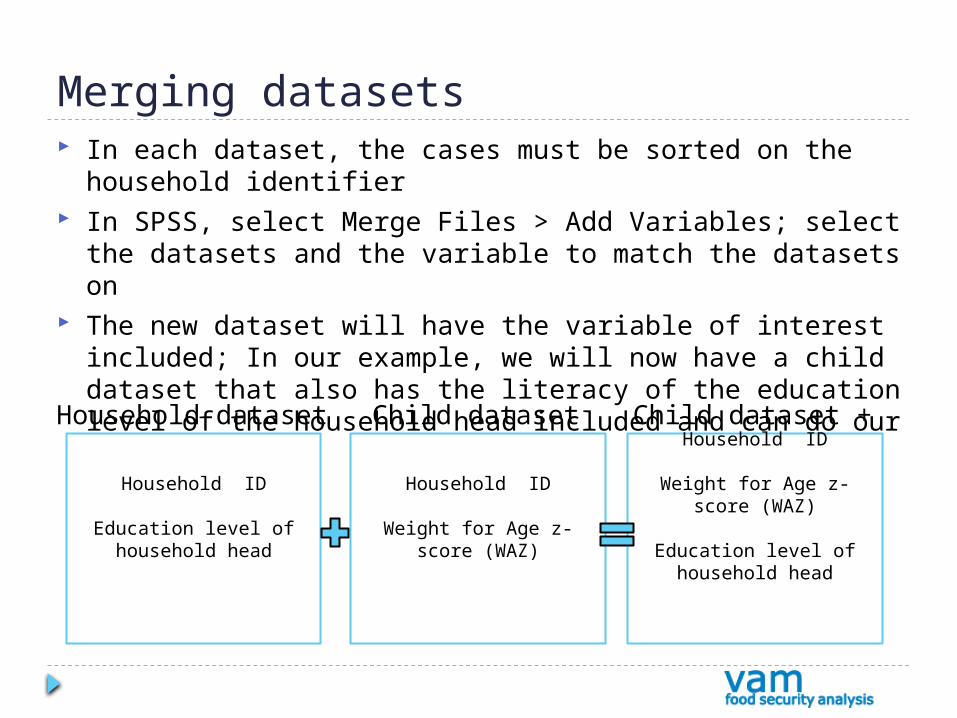
Merging datasets In each dataset, the cases must be sorted on the household identifier In SPSS, select Merge Files > Add Variables; select the datasets and the
variable to match the datasets on The new dataset will have the variable of interest included; In our example,
we will now have a child dataset that also has the literacy of the education level of the household head included and can do our analysis
Household ID
Education level of household head
Household ID
Weight for Age z-score (WAZ)
Household dataset Child datasetHousehold ID
Weight for Age z-score (WAZ)
Education level of household head
Child dataset +
Data cleaning
Unique ID Missing data Define variable properties Scatteplot /histograms Frequency sorting Outliers
Missing values and data cleaning Cleaning data can be a painful process Being systematic about cleaning data from the beginning
of the process can save hours of work later in the analysis There are few key tools to use in SPSS to clean data:
Sorting cases – allows you to quickly see within a variable if there are problematic cases
Indentify duplicate cases – shows cases which have the same unique identifier
Histograms and scatterplots – visually identify problematic variables and cases
Missing values and data cleaning The data cleaning process will also reveal cases where
values are missing for certain variables This is often expected (though in some cases may have
been an error) Handling missing values in SPSS is a simple matter of
telling the software what values to handle as missing in the variable view
Getting ready for analysis Weight file Split file Select cases
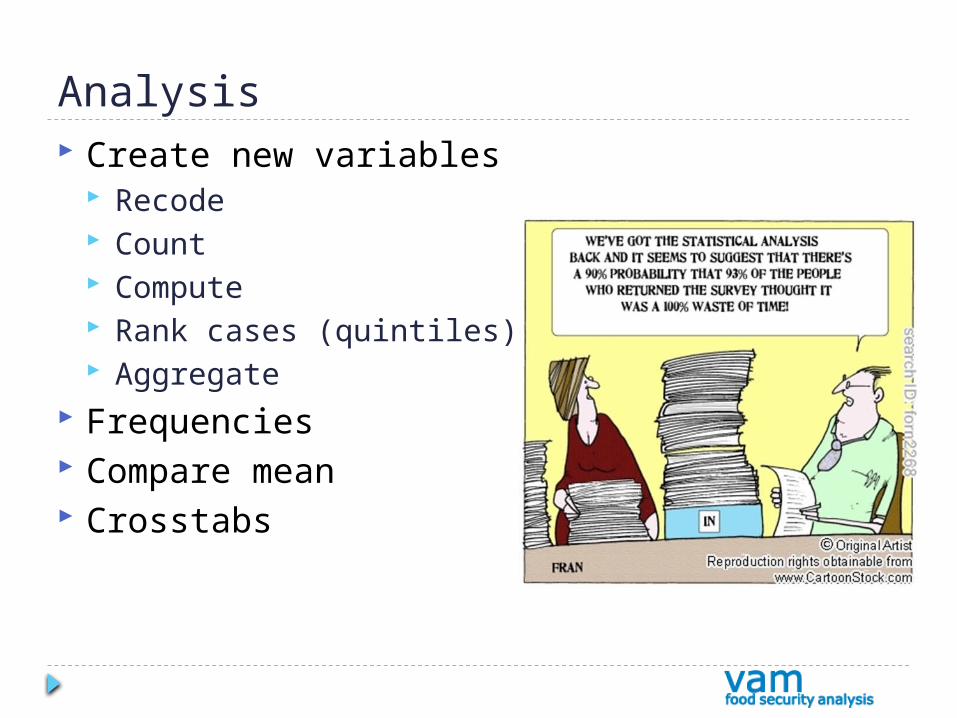
Analysis Create new variables
Recode Count Compute Rank cases (quintiles) Aggregate
Frequencies Compare mean Crosstabs
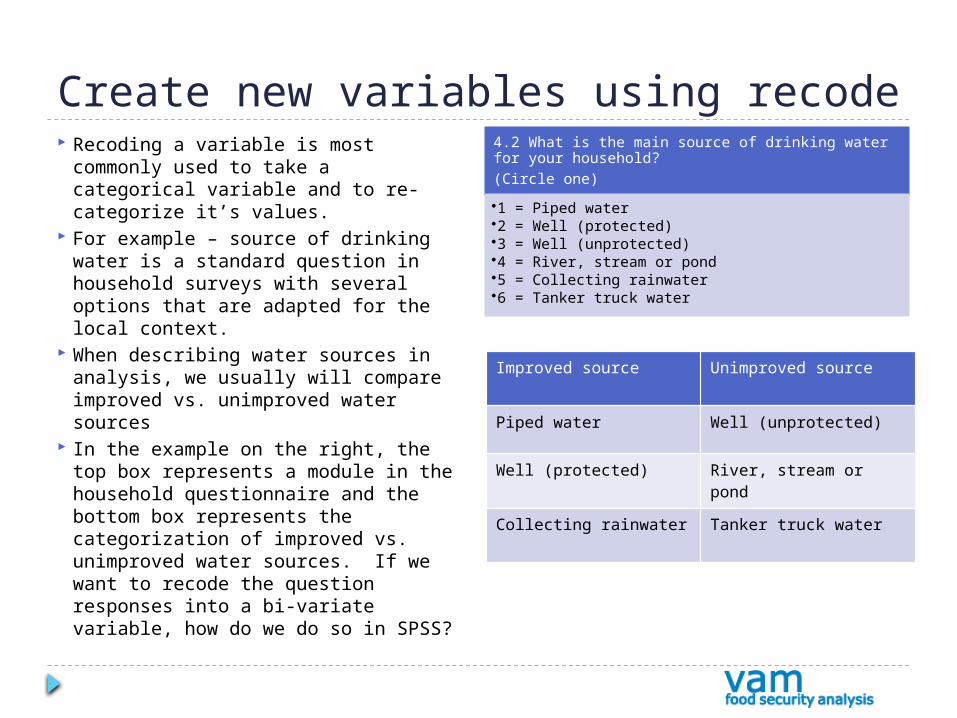
Create new variables using recode Recoding a variable is most commonly
used to take a categorical variable and to re-categorize it’s values.
For example – source of drinking water is a standard question in household surveys with several options that are adapted for the local context.
When describing water sources in analysis, we usually will compare improved vs. unimproved water sources
In the example on the right, the top box represents a module in the household questionnaire and the bottom box represents the categorization of improved vs. unimproved water sources. If we want to recode the question responses into a bi-variate variable, how do we do so in SPSS?
4.2 What is the main source of drinking water for your household? (Circle one)
•1 = Piped water•2 = Well (protected)•3 = Well (unprotected)•4 = River, stream or pond•5 = Collecting rainwater•6 = Tanker truck water
Improved source Unimproved source
Piped water Well (unprotected)
Well (protected) River, stream or pond
Collecting rainwater Tanker truck water
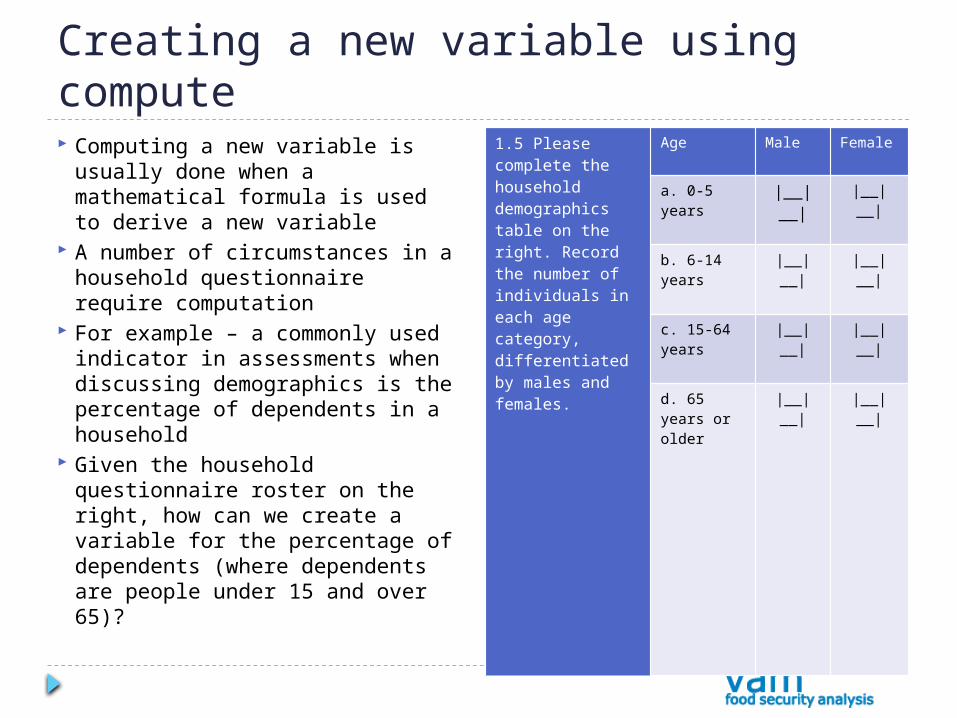
Creating a new variable using compute Computing a new variable is usually
done when a mathematical formula is used to derive a new variable
A number of circumstances in a household questionnaire require computation
For example – a commonly used indicator in assessments when discussing demographics is the percentage of dependents in a household
Given the household questionnaire roster on the right, how can we create a variable for the percentage of dependents (where dependents are people under 15 and over 65)?
1.5 Please complete the household demographics table on the right. Record the number of individuals in each age category, differentiated by males and females.
Age Male Female
a. 0-5 years
|__|__| |__|__|
b. 6-14 years
|__|__| |__|__|
c. 15-64 years
|__|__| |__|__|
d. 65 years or older
|__|__| |__|__|
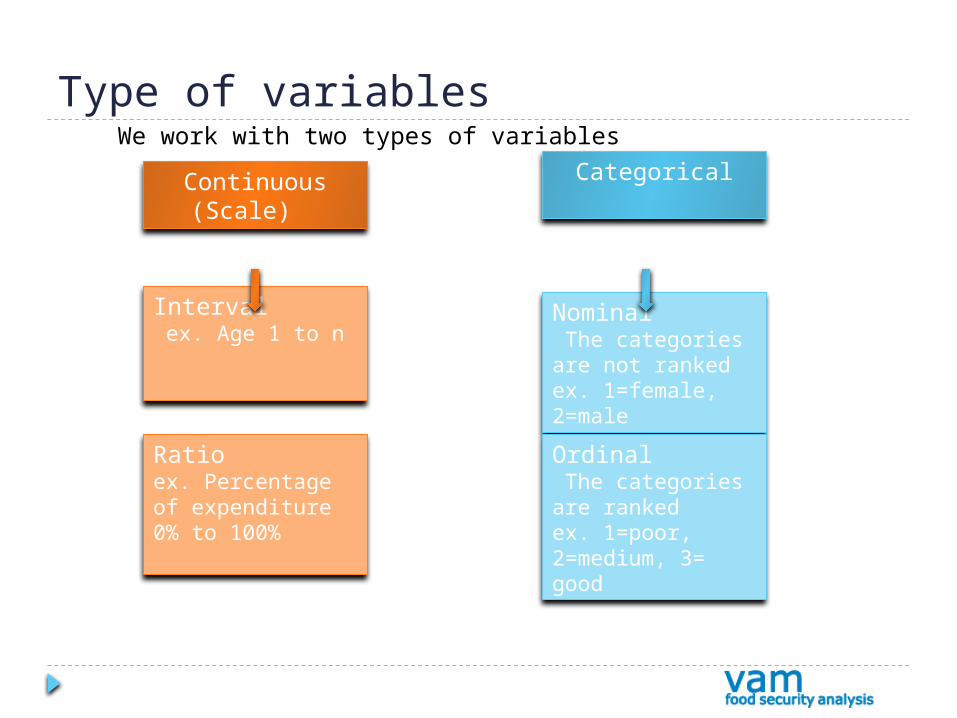
Type of variables
Continuous(Scale)
Categorical
Interval ex. Age 1 to n
Ratioex. Percentage of expenditure 0% to 100%
Nominal The categories are not ranked ex. 1=female, 2=male
Ordinal The categories are ranked ex. 1=poor, 2=medium, 3= good
We work with two types of variables
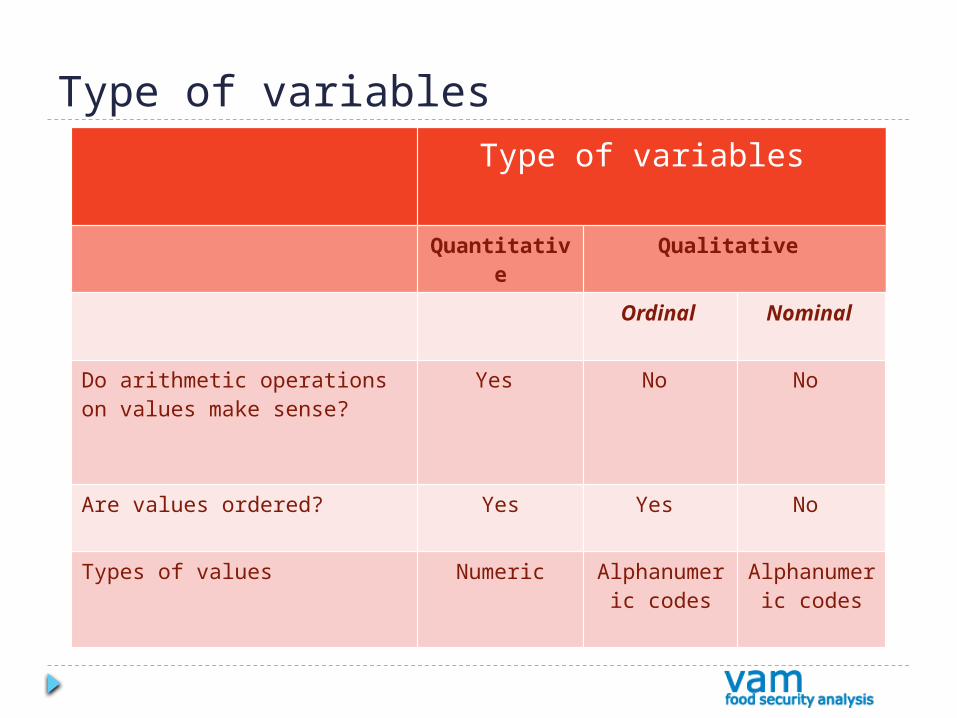
Type of variables Type of variables
Quantitative
Qualitative
Ordinal Nominal
Do arithmetic operations on values make sense?
Yes No No
Are values ordered? Yes Yes No
Types of values Numeric Alphanumeric codes
Alphanumeric codes
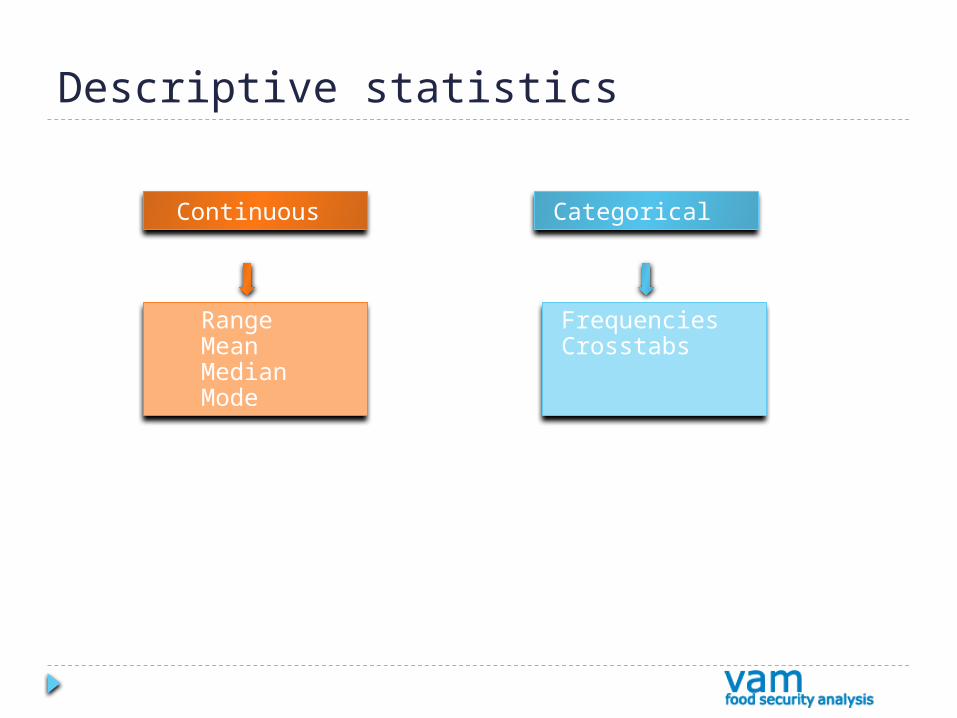
Descriptive statistics
Continuous Categorical
RangeMean Median Mode
FrequenciesCrosstabs
Best practices Using syntax Export files/outputs Data file comments