Embed Size (px)
Citation preview
February 2012
2012 Mizuho Investment Conference
Recent Financial and Economic Environment&
Mizuho’s Group Strategy
1
Definitions3 Banks: Aggregate figures for Mizuho Bank, Mizuho Corporate Bank and Mizuho Trust & Banking on a non-consolidated basis.
The figures before October 1, 2005 are the aggregate figures for these three banks and their financial subsidiaries for corporate revitalizationAbbreviations FG stands for Mizuho Financial Group (holding company), BK for Mizuho Bank, CB for Mizuho Corporate Bank,
TB for Mizuho Trust & Banking, SC for Mizuho Securities, IS for Mizuho Investors Securities
Forward-looking Statements
Unless otherwise specified, the financial figures used in this presentation are based on Japanese GAAP This presentation does not constitute a solicitation of an offer for acquisition or an offer for sale of any securities
Important Notice
This presentation contains statements that constitute forward-looking statements within the meaning of the United States Private Securities Litigation Reform Act of 1995, including estimates, forecasts, targets and plans. Such forward-looking statements do not represent any guarantee by management of future performance. In many cases, but not all, we use such words as “aim,” “anticipate,” “believe,” “endeavor,” “estimate,” “expect,” “intend,” “may,” “plan,” “probability,” “project,”“risk,” “seek,” “should,” “strive,” “target” and similar expressions in relation to us or our management to identify forward-looking statements. You can also identify forward-looking statements by discussions of strategy, plans or intentions. These statements reflect our current views with respect to future events and are subject to risks, uncertainties and assumptions.We may not be successful in implementing our business strategies, and management may fail to achieve its targets, for a wide range of possible reasons, including, without limitation: incurrence of significant credit-related costs; declines in the value of our securities portfolio; changes in interest rates; foreign currency fluctuations; decrease in the market liquidity of our assets; revised assumptions or other changes related to our pension plans; a decline in our deferred tax assets; the effect of financial transactions entered into for hedging and other similar purposes; failure to maintain required capital adequacy ratio levels; downgrades in our credit ratings; our ability to avoid reputational harm; our ability to implement our Medium-term Management Policy, realize the synergy effects of the transformation into ‘one bank,’ and implement other strategic initiatives and measures effectively; the effectiveness of our operational, legal and other risk management policies; the effect of changes in general economic conditions in Japan and elsewhere; and changes to applicable laws and regulations.Further information regarding factors that could affect our financial condition and results of operations is included in “Item 3.D. Key Information—Risk Factors” and “Item 5. Operating and Financial Review and Prospects” in our most recent Form 20-F filed with the U.S. Securities and Exchange Commission (“SEC”) which is available in the Financial Information section of our web page at www.mizuho-fg.co.jp/english/ and also at the SEC’s web site at www.sec.gov.We do not intend to update our forward-looking statements. We are under no obligation, and disclaim any obligation, to update or alter our forward-looking statements, whether as a result of new information, future events or otherwise, except as may be required by the rules of the Tokyo Stock Exchange.
*1
*1: Excluding Non-Recurring Losses *2: On October 1, 2005, each of the financial subsidiaries for corporate revitalization was merged into its own parent bank
*2
2
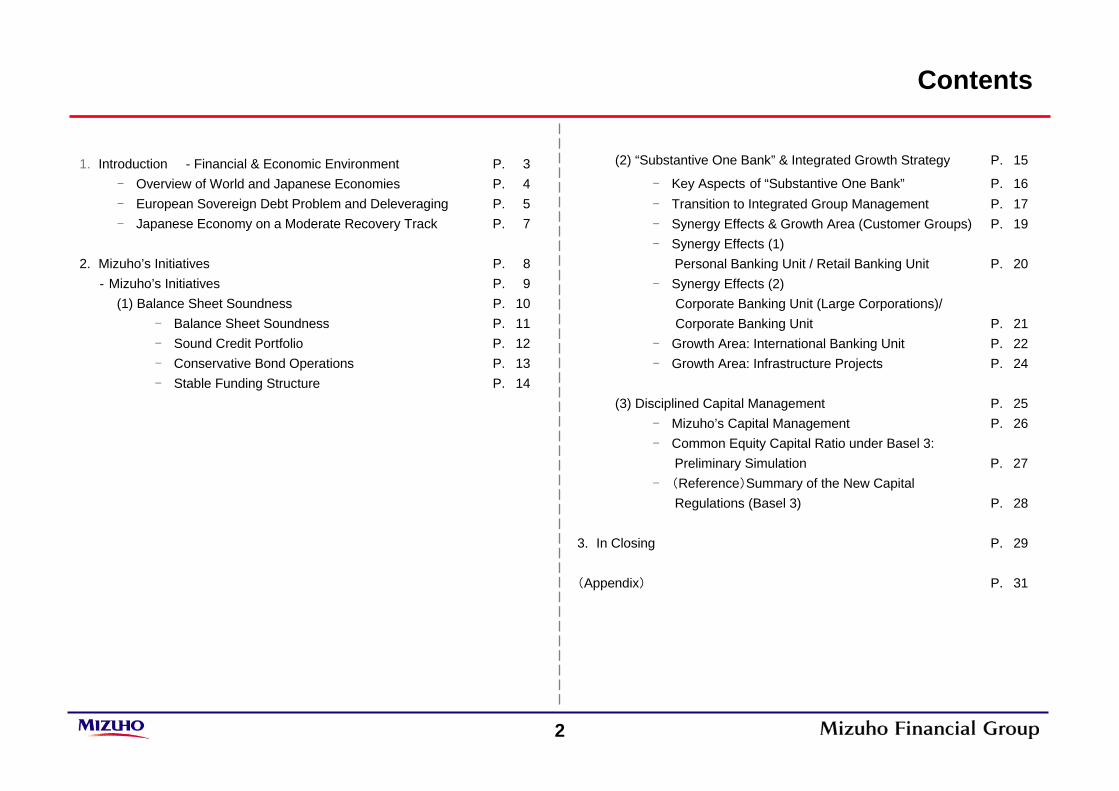
1. Introduction - Financial & Economic Environment P. 3- Overview of World and Japanese Economies P. 4- European Sovereign Debt Problem and Deleveraging P. 5- Japanese Economy on a Moderate Recovery Track P. 7
2. Mizuho’s Initiatives P. 8‐ Mizuho’s Initiatives P. 9
(1) Balance Sheet Soundness P. 10- Balance Sheet Soundness P. 11- Sound Credit Portfolio P. 12 - Conservative Bond Operations P. 13- Stable Funding Structure P. 14
Contents
(2) “Substantive One Bank” & Integrated Growth Strategy P. 15
- Key Aspects of “Substantive One Bank” P. 16- Transition to Integrated Group Management P. 17 - Synergy Effects & Growth Area (Customer Groups) P. 19- Synergy Effects (1)
Personal Banking Unit / Retail Banking Unit P. 20- Synergy Effects (2)
Corporate Banking Unit (Large Corporations)/Corporate Banking Unit P. 21
- Growth Area: International Banking Unit P. 22- Growth Area: Infrastructure Projects P. 24
(3) Disciplined Capital Management P. 25- Mizuho’s Capital Management P. 26- Common Equity Capital Ratio under Basel 3:
Preliminary Simulation P. 27- (Reference)Summary of the New Capital
Regulations (Basel 3) P. 28
3. In Closing P. 29
(Appendix) P. 31
3
2. Mizuho’s Initiatives P.8
(3) Disciplined Capital Management P.25
3. In Closing P.29
1. Introduction - Financial & Economic Environment P.3
(1) Balance Sheet Soundness P.10
(2) “Substantive One Bank” & Integrated Growth Strategy P.15
(Appendix) P.31
4
-5
-4
-3
-2
-1
0
1
2
3
4
FY2007 FY2008 FY2009 FY2010 FY2011 FY2012 FY2013
BOJ Outlook Report, Jan. 2012MHRI Outlook, Feb. 15, 2012
-8-6-4-202468
10121416
2007 2008 2009 2010 2011 2012 2013
China IndiaASEAN 5 JapanU.S. Euro Area
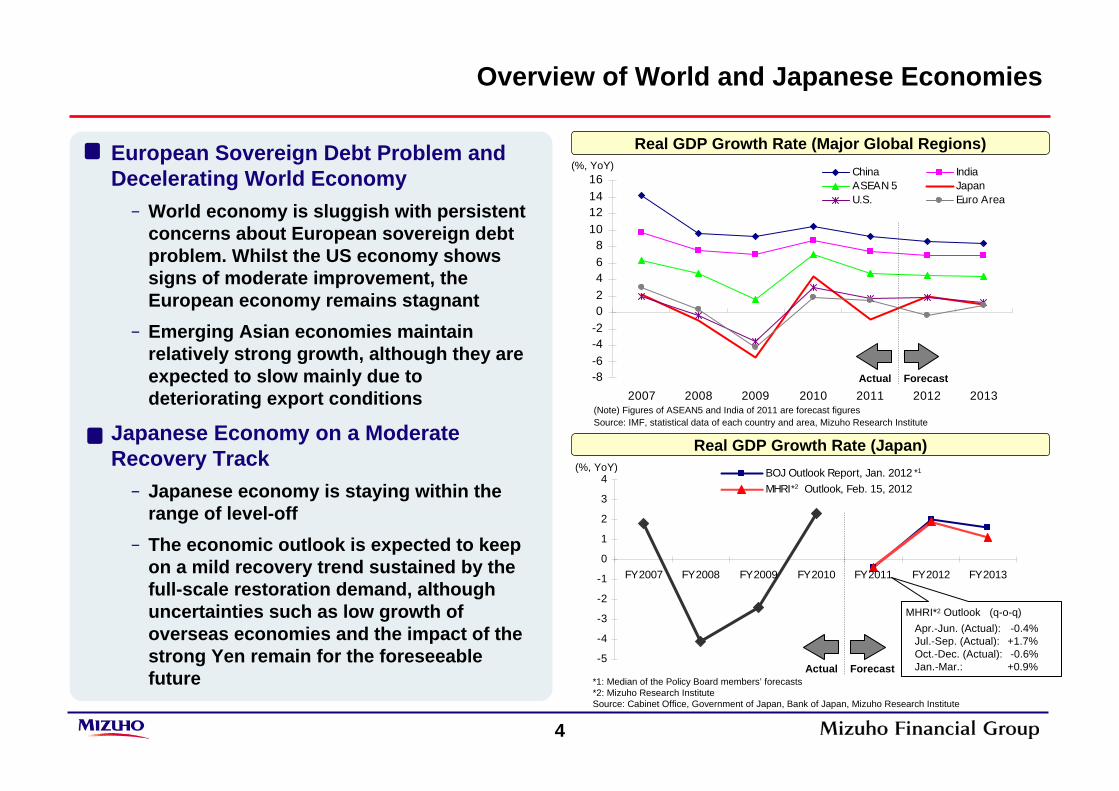
Overview of World and Japanese Economies
European Sovereign Debt Problem and Decelerating World Economy- World economy is sluggish with persistent
concerns about European sovereign debt problem. Whilst the US economy shows signs of moderate improvement, the European economy remains stagnant
- Emerging Asian economies maintain relatively strong growth, although they are expected to slow mainly due to deteriorating export conditions
Japanese Economy on a Moderate Recovery Track - Japanese economy is staying within the
range of level-off- The economic outlook is expected to keep
on a mild recovery trend sustained by the full-scale restoration demand, although uncertainties such as low growth of overseas economies and the impact of the strong Yen remain for the foreseeable future
Real GDP Growth Rate (Major Global Regions)
Real GDP Growth Rate (Japan)
(Note) Figures of ASEAN5 and India of 2011 are forecast figuresSource: IMF, statistical data of each country and area, Mizuho Research Institute
MHRI*2 Outlook (q-o-q)Apr.-Jun. (Actual): -0.4%Jul.-Sep. (Actual): +1.7%Oct.-Dec. (Actual): -0.6%Jan.-Mar.: +0.9%
(%, YoY)
*1: Median of the Policy Board members’ forecasts*2: Mizuho Research InstituteSource: Cabinet Office, Government of Japan, Bank of Japan, Mizuho Research Institute
Actual Forecast
(%, YoY)
Actual Forecast
*2
*1
5
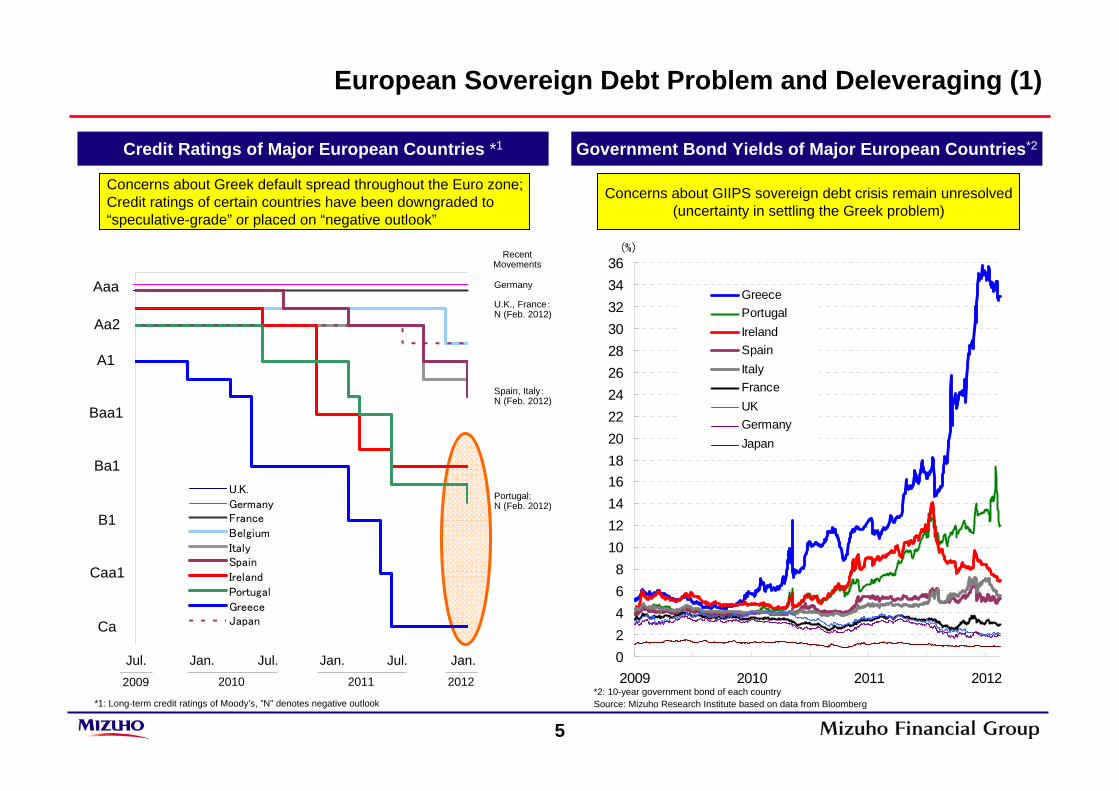
European Sovereign Debt Problem and Deleveraging (1)
Government Bond Yields of Major European Countries*2Credit Ratings of Major European Countries *1
Concerns about Greek default spread throughout the Euro zone;Credit ratings of certain countries have been downgraded to “speculative-grade” or placed on “negative outlook”
Concerns about GIIPS sovereign debt crisis remain unresolved(uncertainty in settling the Greek problem)
*1: Long-term credit ratings of Moody’s, ”N” denotes negative outlook
Germany
Spain, Italy:N (Feb. 2012)
Portugal:N (Feb. 2012)
Recent Movements
U.K., France:N (Feb. 2012)
Aaa
Aa2
A1
Baa1
Ba1
B1
Caa1
Ca
*2: 10-year government bond of each countrySource: Mizuho Research Institute based on data from Bloomberg
09/07 10/01 10/07 11/01 11/07 12/01
U.K.
GermanyFrance
Belgium
ItalySpain
Ireland
Portugal
GreeceJapan
Jul. Jan. Jul. Jan. Jul. Jan.2012201120102009
02468
1012141618202224262830323436
2009 2010 2011 2012
GreecePortugalIrelandSpainItalyFranceUKGermanyJapan
(%)
6
Disposal of
Assets
26%
22%
16%
6% 7%9%
7%
3% 4%
0
5
10
15
20
25
30
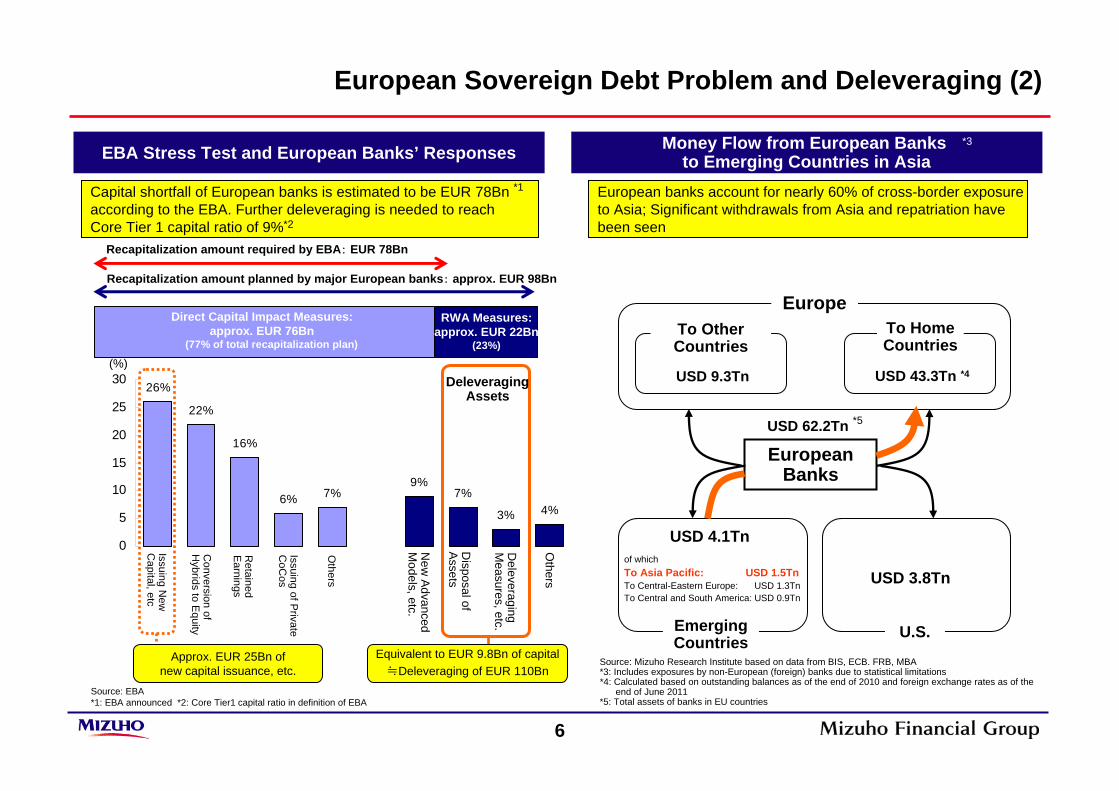
EBA Stress Test and European Banks’ Responses Money Flow from European Banks to Emerging Countries in Asia
European banks account for nearly 60% of cross-border exposure to Asia; Significant withdrawals from Asia and repatriation havebeen seen
Capital shortfall of European banks is estimated to be EUR 78Bn according to the EBA. Further deleveraging is needed to reach Core Tier 1 capital ratio of 9%
Source: EBA
Source: Mizuho Research Institute based on data from BIS, ECB. FRB, MBA*3: Includes exposures by non-European (foreign) banks due to statistical limitations*4: Calculated based on outstanding balances as of the end of 2010 and foreign exchange rates as of the
end of June 2011*5: Total assets of banks in EU countries
Equivalent to EUR 9.8Bn of capital≒Deleveraging of EUR 110Bn
Deleveraging Assets
Recapitalization amount required by EBA: EUR 78Bn
Recapitalization amount planned by major European banks: approx. EUR 98Bn
European Banks
Europe
USD 9.3Tn
To Home Countries
Emerging Countries U.S.
To Other Countries
USD 43.3Tn *4
USD 4.1Tn
USD 3.8Tnof whichTo Asia Pacific: USD 1.5TnTo Central-Eastern Europe: USD 1.3TnTo Central and South America: USD 0.9Tn
European Sovereign Debt Problem and Deleveraging (2)
(%)
Approx. EUR 25Bn of new capital issuance, etc.
Issuing New
C
apital, etc
Conversion of
Hybrids to E
quity
Retained
Earnings
Issuing of Private
CoC
os
Others
New
Advanced M
odels, etc.
Deleveraging
Measures, etc.
Others
Direct Capital Impact Measures: approx. EUR 76Bn
(77% of total recapitalization plan)
RWA Measures: approx. EUR 22Bn
(23%)
USD 62.2Tn
*3
*5
*1: EBA announced *2: Core Tier1 capital ratio in definition of EBA
*1
*2
7
380
385
390
395
400
405
410
415
-3
-2
-1
0
1
2
3
4
5Bank Loan BalanceChange from the Same Month of Previous Year
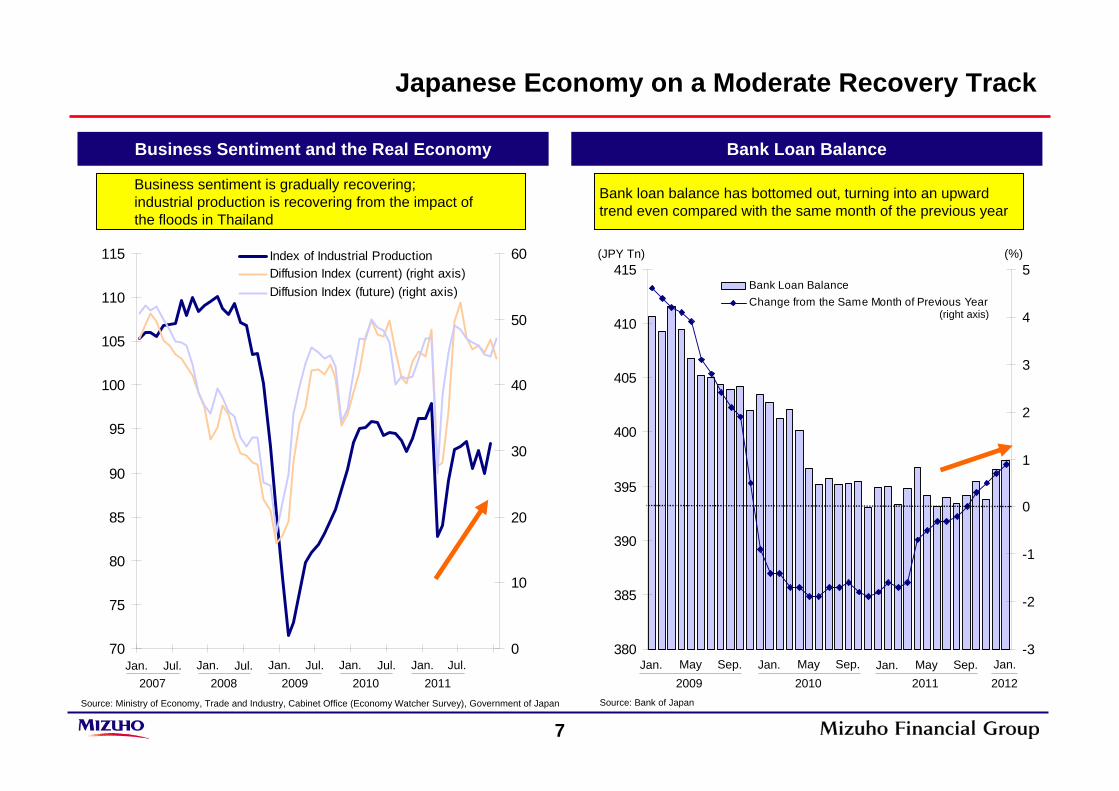
Japanese Economy on a Moderate Recovery Track
Business Sentiment and the Real Economy Bank Loan Balance
Business sentiment is gradually recovering;industrial production is recovering from the impact ofthe floods in Thailand
Bank loan balance has bottomed out, turning into an upward trend even compared with the same month of the previous year
Source: Ministry of Economy, Trade and Industry, Cabinet Office (Economy Watcher Survey), Government of Japan Source: Bank of Japan
70
75
80
85
90
95
100
105
110
115
0
10
20
30
40
50
60Index of Industrial ProductionDiffusion Index (current) (right axis)Diffusion Index (future) (right axis)
Jan. Jul. Jan. Jul. Jan. Jul. Jan. Jul. Jan. Jul. 2007 2008 2009 2010 2011
(JPY Tn) (%)
(right axis)
Jan. May Sep. Jan. May Sep. Jan. May Sep. Jan.2009 2010 2011 2012
8
2. Mizuho’s Initiatives P.8
(3) Disciplined Capital Management P.25
3. In Closing P.29
1. Introduction - Financial & Economic Environment P.3
(1) Balance Sheet Soundness P.10
(2) “Substantive One Bank” & Integrated Growth Strategy P.15
(Appendix) P.31
9
Balance Sheet Soundness Balance Sheet Soundness
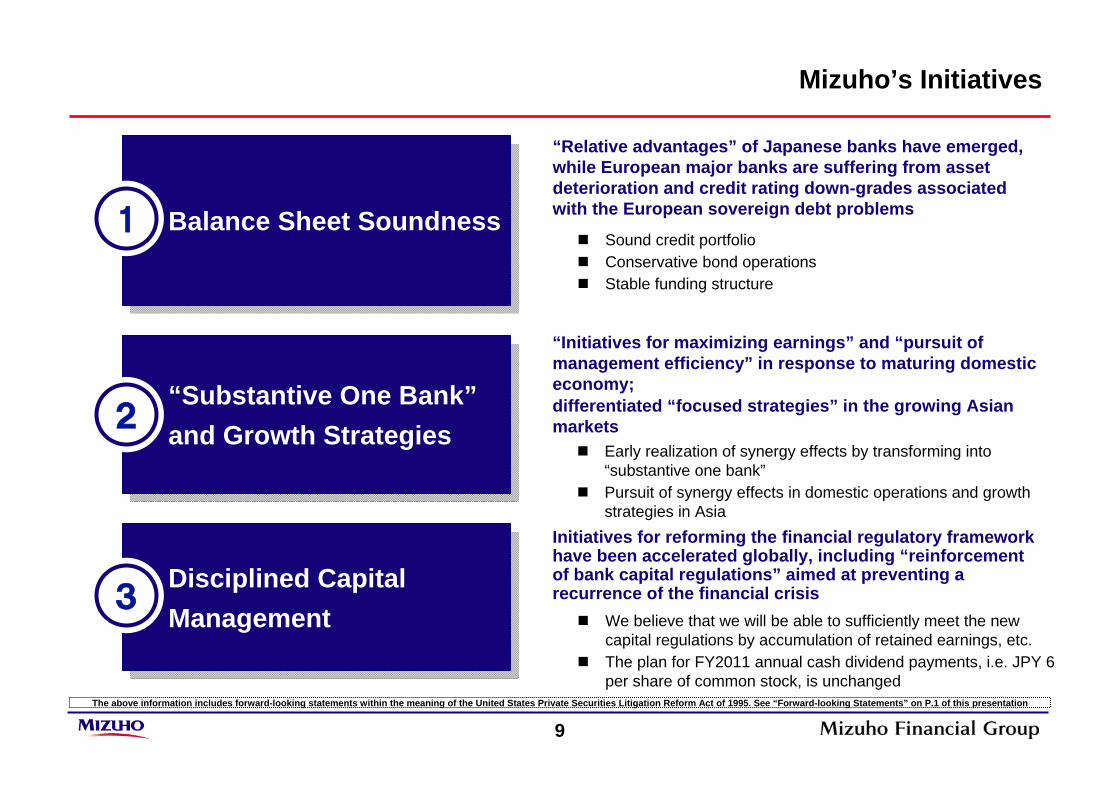
Mizuho’s Initiatives
We believe that we will be able to sufficiently meet the new capital regulations by accumulation of retained earnings, etc.The plan for FY2011 annual cash dividend payments, i.e. JPY 6 per share of common stock, is unchanged
Sound credit portfolioConservative bond operationsStable funding structure
Early realization of synergy effects by transforming into “substantive one bank”Pursuit of synergy effects in domestic operations and growth strategies in Asia
“Initiatives for maximizing earnings” and “pursuit of management efficiency” in response to maturing domestic economy; differentiated “focused strategies” in the growing Asian markets
Initiatives for reforming the financial regulatory framework have been accelerated globally, including “reinforcement of bank capital regulations” aimed at preventing a recurrence of the financial crisis
“Relative advantages” of Japanese banks have emerged, while European major banks are suffering from asset deterioration and credit rating down-grades associated with the European sovereign debt problems
1
“Substantive One Bank”and Growth Strategies
“Substantive One Bank”and Growth Strategies 2
Disciplined Capital Management
Disciplined Capital Management
3
The above information includes forward-looking statements within the meaning of the United States Private Securities Litigation Reform Act of 1995. See “Forward-looking Statements” on P.1 of this presentation
10
2. Mizuho’s Initiatives P.8
(3) Disciplined Capital Management P.25
3. In Closing P.29
1. Introduction - Financial & Economic Environment P.3
(1) Balance Sheet Soundness P.10
(2) “Substantive One Bank” & Integrated Growth Strategy P.15
(Appendix) P.31
11
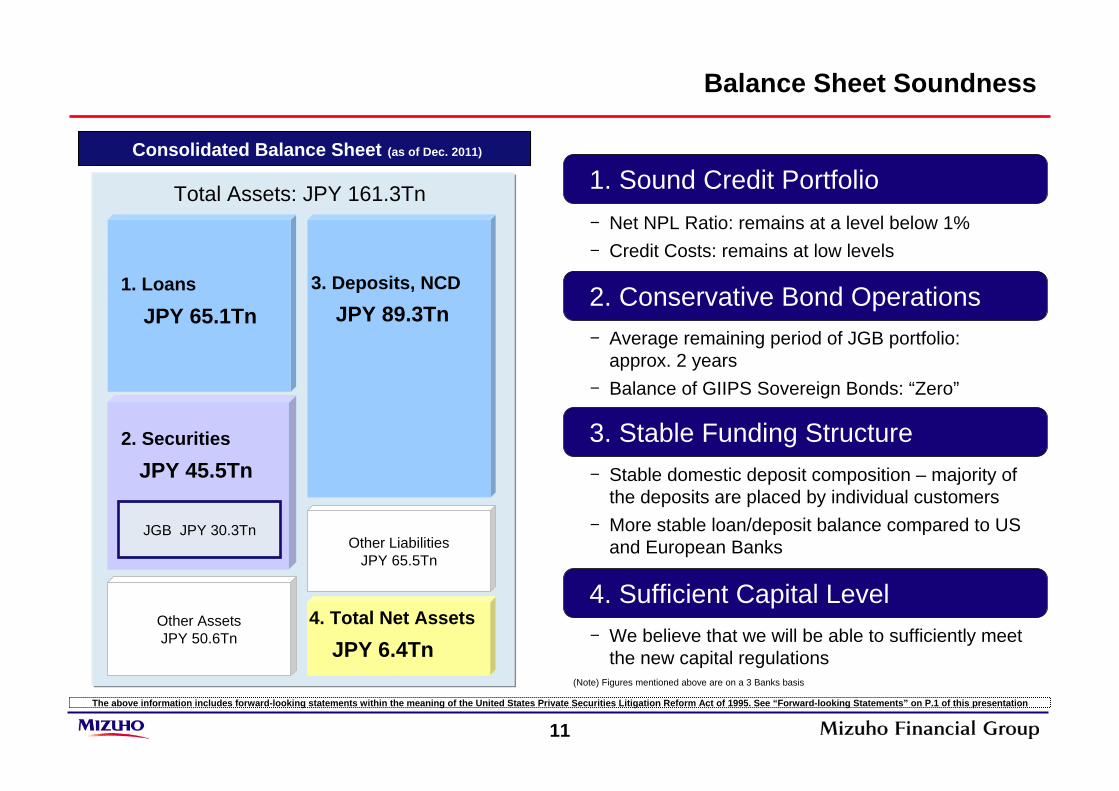
Balance Sheet Soundness
Other AssetsJPY 50.6Tn
Total Assets: JPY 161.3Tn
JGB JPY 30.3Tn
2. Securities
Consolidated Balance Sheet (as of Dec. 2011)
1. Loans 3. Deposits, NCD
1. Sound Credit Portfolio
2. Conservative Bond Operations
3. Stable Funding Structure
Other LiabilitiesJPY 65.5Tn
4. Sufficient Capital Level
- Net NPL Ratio: remains at a level below 1%- Credit Costs: remains at low levels
- Average remaining period of JGB portfolio: approx. 2 years
- Balance of GIIPS Sovereign Bonds: “Zero”
- Stable domestic deposit composition – majority of the deposits are placed by individual customers
- More stable loan/deposit balance compared to US and European Banks
- We believe that we will be able to sufficiently meet the new capital regulations
JPY 89.3TnJPY 65.1Tn
JPY 45.5Tn
JPY 6.4Tn4. Total Net Assets
(Note) Figures mentioned above are on a 3 Banks basis
The above information includes forward-looking statements within the meaning of the United States Private Securities Litigation Reform Act of 1995. See “Forward-looking Statements” on P.1 of this presentation
12
-500
-400
-300
-200
-100
0
100
200
1H FY08 2H FY08 1H FY09 2H FY09 1H FY10 2H FY10 1-3QFY11
-408〈104bps〉
-130〈34bps〉
FY08(JPY Bn)
-539
<69bps>
FY10
+16< reversal>
FY09
-157
<22bps>
-116〈32bps〉
-40〈11bps〉
+ 25 〈reversal〉
-9〈2bps〉
0
1
2
3
4
5
6
Mar.02 Mar.03 Mar.04 Mar.05 Mar.06 Mar.07 Mar.08 Mar.09 Mar.10 Mar.11 Dec.110
1
2
3
4
5(JPY Tn) (%)
1.1
5.5
4.7
3.1
1.4
1.01.2 1.2 1.3 1.3 1.2
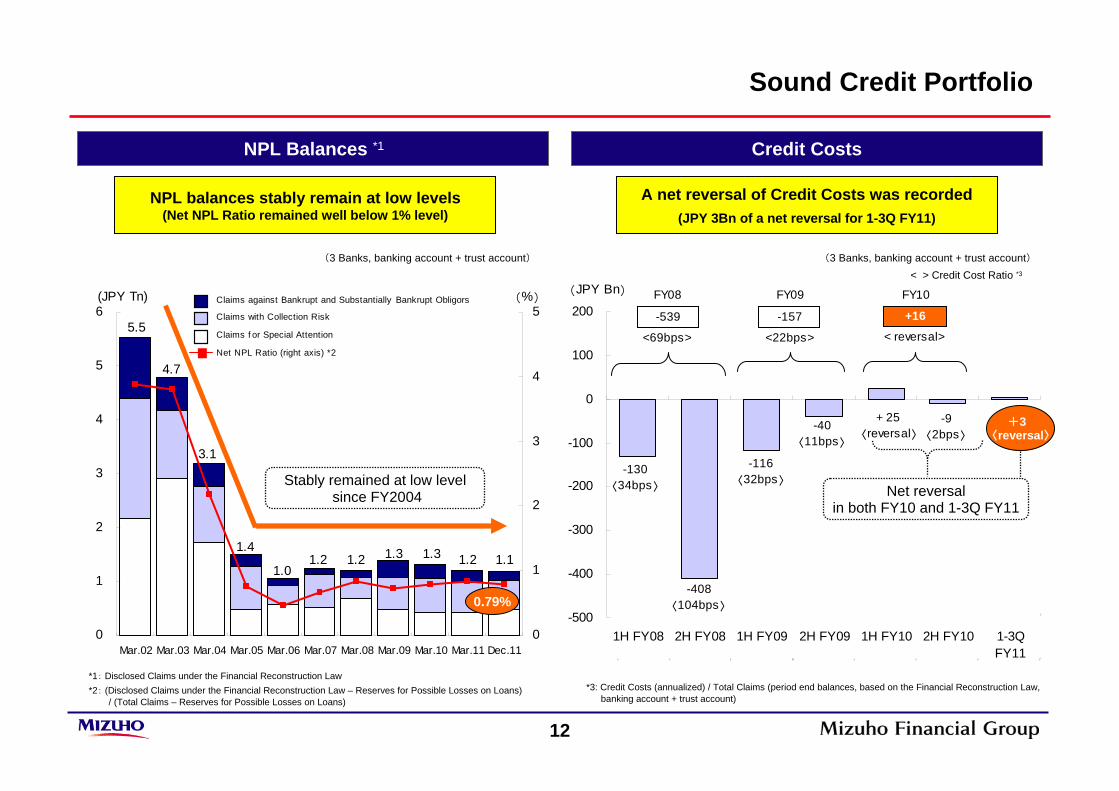
Sound Credit Portfolio
(3 Banks, banking account + trust account)
*1: Disclosed Claims under the Financial Reconstruction Law*2: (Disclosed Claims under the Financial Reconstruction Law – Reserves for Possible Losses on Loans)
/ (Total Claims – Reserves for Possible Losses on Loans)
NPL Balances *1
NPL balances stably remain at low levels(Net NPL Ratio remained well below 1% level)
Credit Costs
A net reversal of Credit Costs was recorded (JPY 3Bn of a net reversal for 1-3Q FY11)
Stably remained at low levelsince FY2004 Net reversal
in both FY10 and 1-3Q FY11
+3〈reversal〉
< > Credit Cost Ratio *3
Claims with Collection Risk
Claims f or Special Attention
Claims against Bankrupt and Substantially Bankrupt Obligors
Net NPL Ratio (right axis) *2
(3 Banks, banking account + trust account)
*3: Credit Costs (annualized) / Total Claims (period end balances, based on the Financial Reconstruction Law,banking account + trust account)
0.79%
13
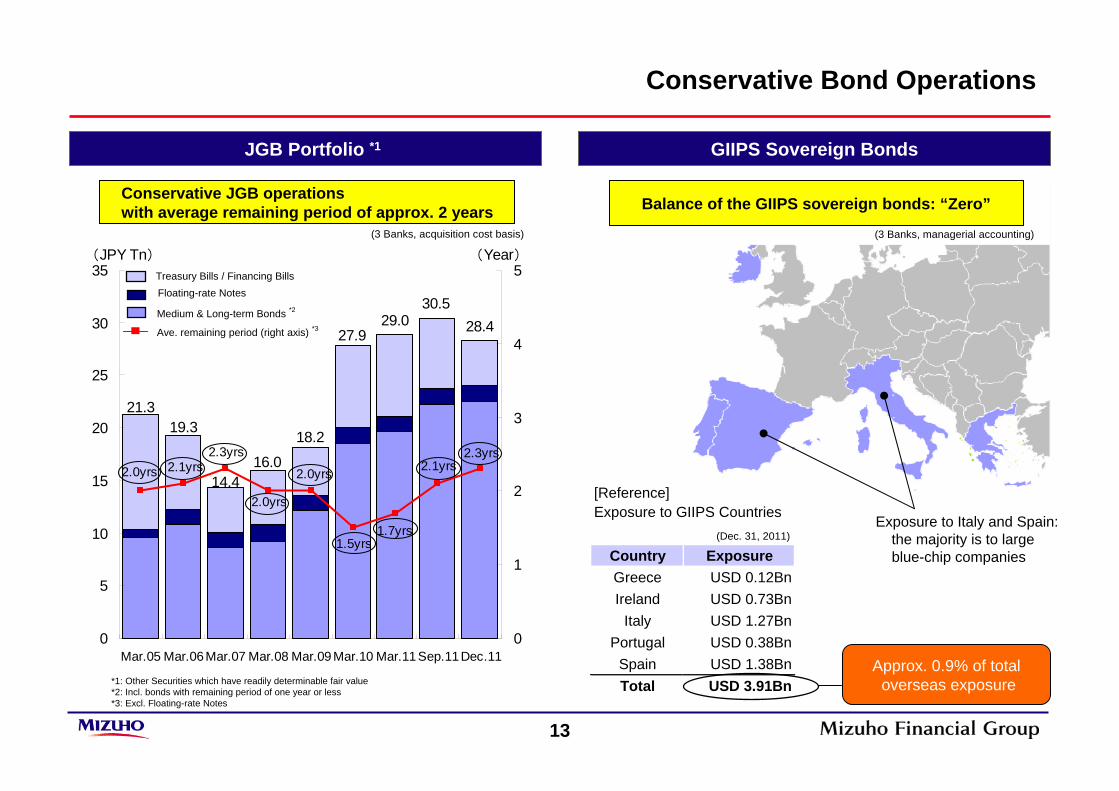
29.027.9 28.4
16.014.4
21.319.3
18.2
30.5
2.3yrs2.0yrs 2.1yrs
2.0yrs
2.3yrs
2.0yrs
1.5yrs1.7yrs
2.1yrs
0
5
10
15
20
25
30
35
Mar.05 Mar.06Mar.07 Mar.08 Mar.09 Mar.10 Mar.11 Sep.11Dec.11
(JPY Tn)
0
1
2
3
4
5(Year)
Country ExposureGreece USD 0.12BnIreland USD 0.73Bn
Italy USD 1.27BnPortugal USD 0.38Bn
Spain USD 1.38BnTotal USD 3.91Bn
Conservative Bond Operations
JGB Portfolio *1
Conservative JGB operationswith average remaining period of approx. 2 years
(Dec. 31, 2011)Exposure to Italy and Spain:
the majority is to large blue-chip companies
[Reference]Exposure to GIIPS Countries
(3 Banks, acquisition cost basis)
*1: Other Securities which have readily determinable fair value*2: Incl. bonds with remaining period of one year or less*3: Excl. Floating-rate Notes
Approx. 0.9% of totaloverseas exposure
Medium & Long-term Bonds *2
Ave. remaining period (right axis) *3
Floating-rate NotesTreasury Bills / Financing Bills
Balance of the GIIPS sovereign bonds: “Zero”
GIIPS Sovereign Bonds
(3 Banks, managerial accounting)
14
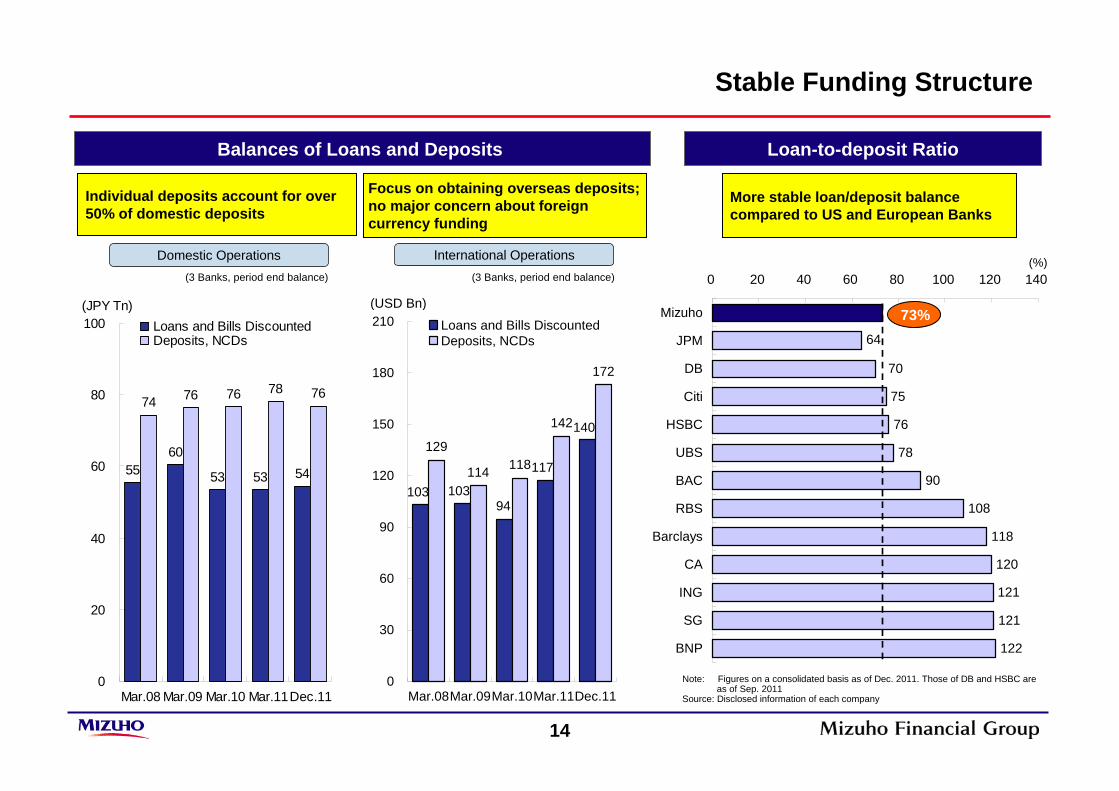
75
76
78
90
108
118
120
121
121
122
64
70
0 20 40 60 80 100 120 140
Mizuho
JPM
DB
Citi
HSBC
UBS
BAC
RBS
Barclays
CA
ING
SG
BNP
(%)
Stable Funding Structure
Balances of Loans and Deposits
Domestic Operations International Operations
Loan-to-deposit Ratio
More stable loan/deposit balance compared to US and European Banks
Individual deposits account for over 50% of domestic deposits
Focus on obtaining overseas deposits;no major concern about foreign currency funding
(3 Banks, period end balance) (3 Banks, period end balance)
129
114
140
117
94103103
172
142
118
0
30
60
90
120
150
180
210
Mar.08Mar.09Mar.10Mar.11Dec.11
Loans and Bills DiscountedDeposits, NCDs
(USD Bn)73%
Note: Figures on a consolidated basis as of Dec. 2011. Those of DB and HSBC are as of Sep. 2011
Source: Disclosed information of each company
5560
53 53 54
74 76 78 7676
0
20
40
60
80
100
Mar.08 Mar.09 Mar.10 Mar.11Dec.11
Loans and Bills DiscountedDeposits, NCDs
(JPY Tn)
15
2. Mizuho’s Initiatives P.8
(3) Disciplined Capital Management P.25
3. In Closing P.29
1. Introduction - Financial & Economic Environment P.3
(1) Balance Sheet Soundness P.10
(2) “Substantive One Bank” & Integrated Growth Strategy P.15
(Appendix) P.31
16
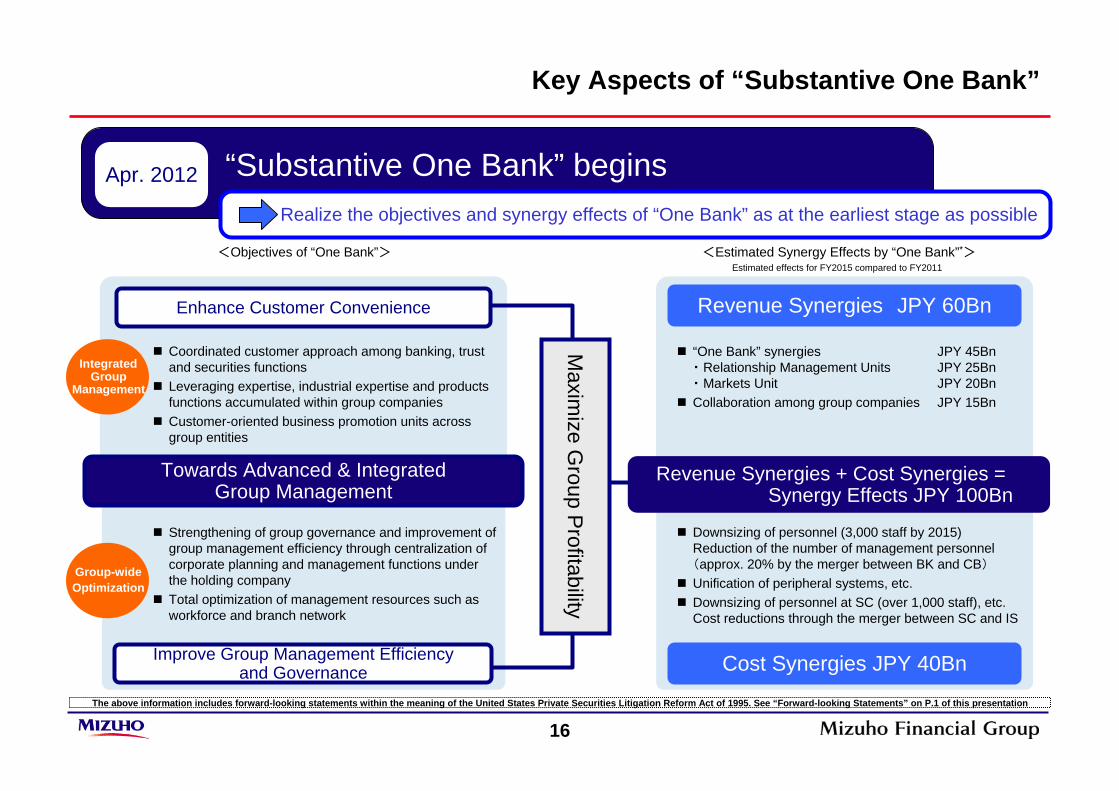
Apr. 2012
Key Aspects of “Substantive One Bank”
“Substantive One Bank” begins
Revenue Synergies + Cost Synergies = Synergy Effects JPY 100Bn
Downsizing of personnel (3,000 staff by 2015)Reduction of the number of management personnel (approx. 20% by the merger between BK and CB)Unification of peripheral systems, etc.Downsizing of personnel at SC (over 1,000 staff), etc.Cost reductions through the merger between SC and IS
“One Bank” synergies JPY 45Bn・ Relationship Management Units JPY 25Bn・ Markets Unit JPY 20BnCollaboration among group companies JPY 15Bn
Revenue Synergies JPY 60Bn
Cost Synergies JPY 40Bn
Towards Advanced & IntegratedGroup Management
Strengthening of group governance and improvement of group management efficiency through centralization of corporate planning and management functions under the holding companyTotal optimization of management resources such as workforce and branch network
Enhance Customer Convenience
Improve Group Management Efficiency and Governance
Coordinated customer approach among banking, trust and securities functions Leveraging expertise, industrial expertise and products functions accumulated within group companies Customer-oriented business promotion units across group entities
Maxim
ize Group P
rofitability
<Objectives of “One Bank”> <Estimated Synergy Effects by “One Bank”*>Estimated effects for FY2015 compared to FY2011
IntegratedGroup
Management
Group-wide Optimization
The above information includes forward-looking statements within the meaning of the United States Private Securities Litigation Reform Act of 1995. See “Forward-looking Statements” on P.1 of this presentation
Realize the objectives and synergy effects of “One Bank” as at the earliest stage as possible
17
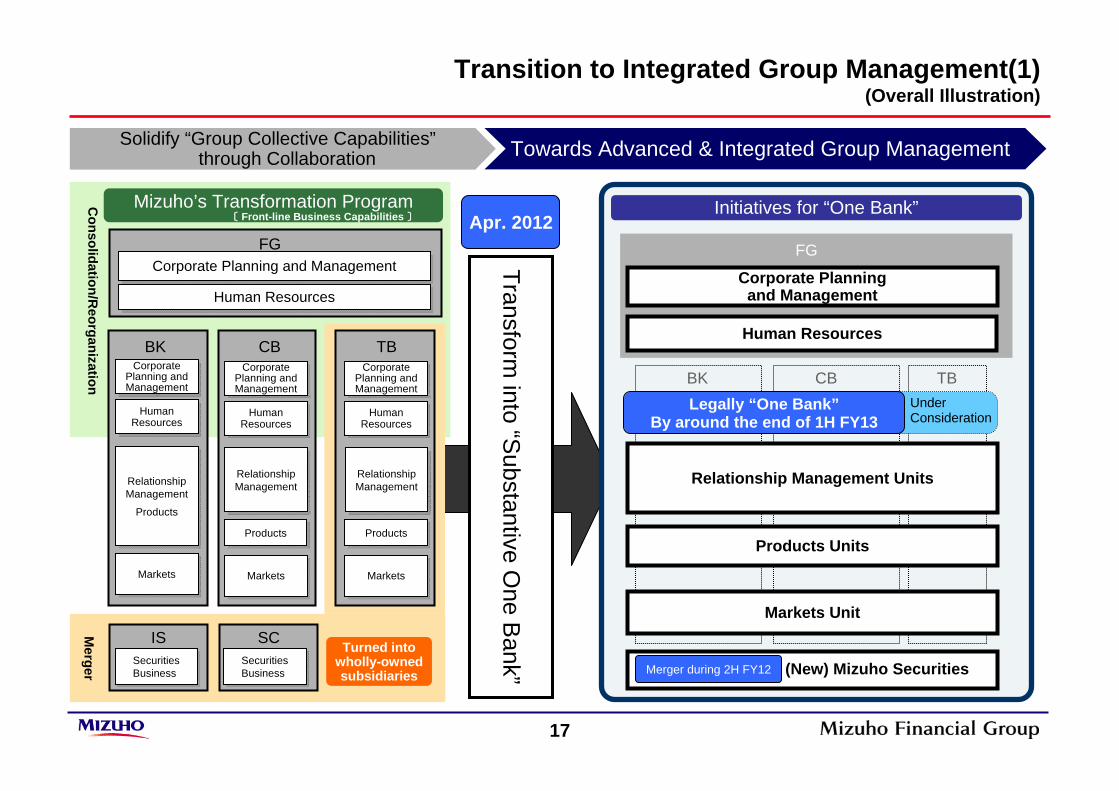
Transition to Integrated Group Management(1) (Overall Illustration)
FG
BK
FG
BK
SCIS
CB
SC
TB
Initiatives for “One Bank”
CB TB
(New) Mizuho Securities
Solidify “Group Collective Capabilities”through Collaboration Towards Advanced & Integrated Group Management
Mizuho’s Transformation Program〔 Front-line Business Capabilities 〕
Corporate Planning and ManagementCorporate Planning and Management
Human ResourcesHuman Resources
Merger
Consolidation/R
eorganization
Corporate Planning and Management
Corporate Planning and Management
Human ResourcesHuman
Resources
RelationshipManagement
Products
RelationshipManagement
Products
MarketsMarkets
Corporate Planning and Management
Corporate Planning and Management
Human ResourcesHuman
Resources
RelationshipManagementRelationshipManagement
MarketsMarkets
Corporate Planning and Management
Corporate Planning and Management
Human ResourcesHuman
Resources
MarketsMarkets
Turned into wholly-owned subsidiaries
Securities Business Securities Business
SecuritiesBusiness SecuritiesBusiness
Corporate Planningand Management
Human Resources
Transform into “S
ubstantive One B
ank”
Apr. 2012
Merger during 2H FY12
ProductsProducts
RelationshipManagementRelationshipManagement
ProductsProducts
Relationship Management Units
Markets Unit
Products Units
Under Consideration
Legally “One Bank”By around the end of 1H FY13
18
BK CB TB
Personal Banking UnitPersonal Banking Unit
International Banking UnitInternational Banking Unit
Large Corporations
Large Corporations
SMEsSMEs
Corporate owners & Land owners
Corporate owners & Land owners
Financial Institutions
& Public Sector
Financial Institutions
& Public Sector
Middle Market Corporations
Middle Market Corporations
Corporate employee & Retired persons,
etc.
Corporate employee & Retired persons,
etc.
Financial Institutions & Public Sector Business
Unit
Financial Institutions & Public Sector Business
Unit
Retail Banking UnitRetail Banking Unit
Corporate Banking UnitCorporate Banking Unit
Corporate Banking Unit(Large Corporations)
Corporate Banking Unit(Large Corporations)
Organizational structurebased on customer characteristics
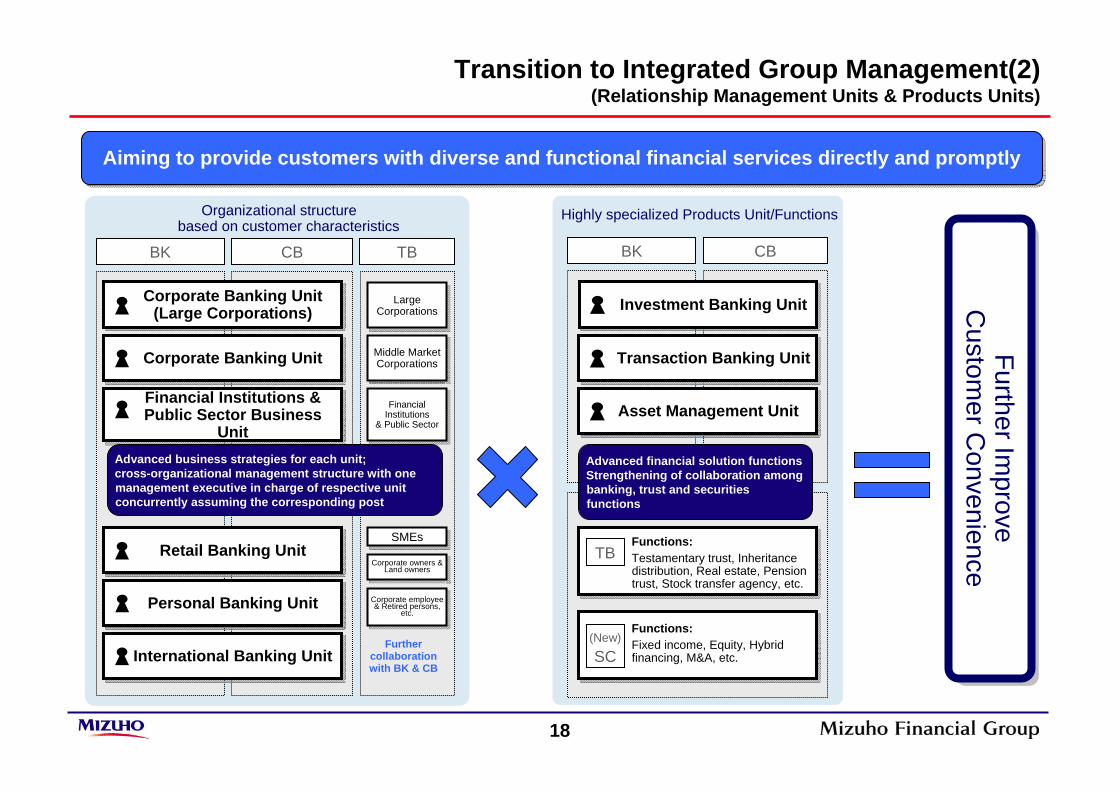
Transition to Integrated Group Management(2) (Relationship Management Units & Products Units)
BK CB
Asset Management Unit Asset Management Unit
Transaction Banking Unit Transaction Banking Unit
Investment Banking UnitInvestment Banking Unit
Highly specialized Products Unit/Functions
Advanced business strategies for each unit;cross-organizational management structure with one management executive in charge of respective unit concurrently assuming the corresponding post
Advanced financial solution functionsStrengthening of collaboration among banking, trust and securities functions
TB
(New)
SC
Further Improve
Custom
er Convenience
Aiming to provide customers with diverse and functional financial services directly and promptlyAiming to provide customers with diverse and functional financial services directly and promptly
Further collaboration with BK & CB
Functions:Testamentary trust, Inheritance distribution, Real estate, Pension trust, Stock transfer agency, etc.
Functions:Fixed income, Equity, Hybrid financing, M&A, etc.
19
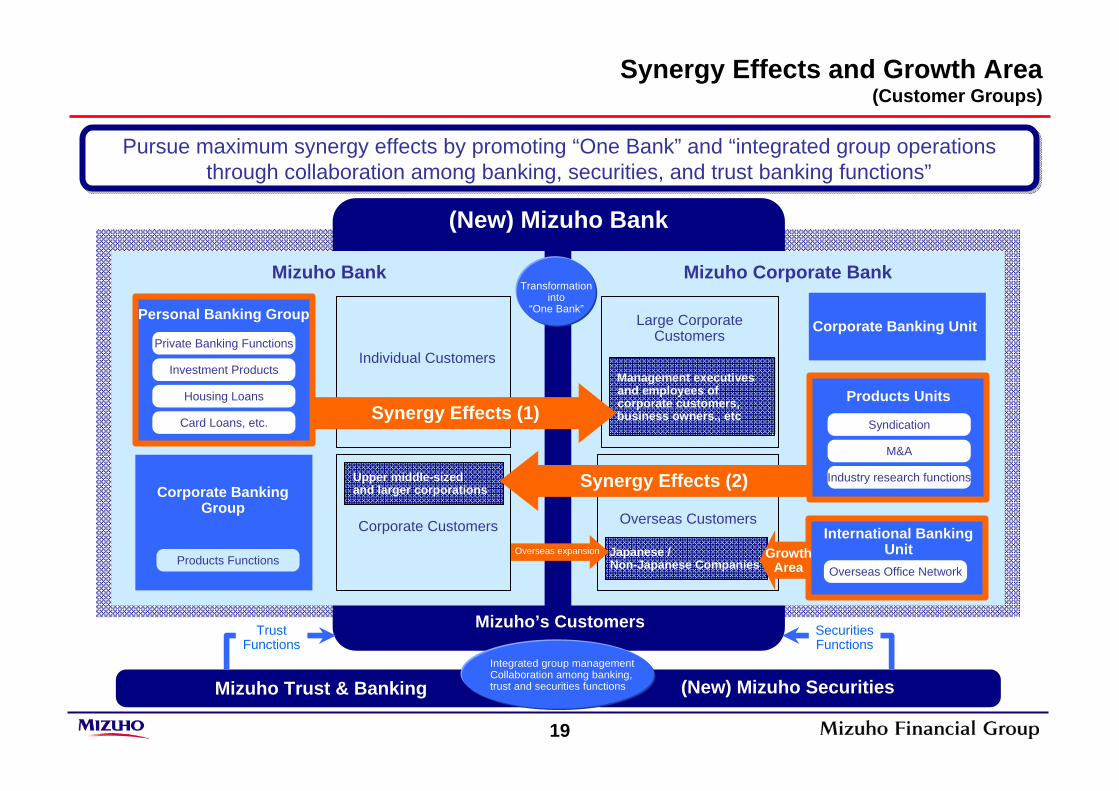
Synergy Effects and Growth Area(Customer Groups)
Pursue maximum synergy effects by promoting “One Bank” and “integrated group operations through collaboration among banking, securities, and trust banking functions”
Pursue maximum synergy effects by promoting “One Bank” and “integrated group operations through collaboration among banking, securities, and trust banking functions”
(New) Mizuho Bank
Mizuho Trust & Banking (New) Mizuho Securities
Mizuho Bank Mizuho Corporate Bank
Personal Banking Group
Corporate BankingGroup
Private Banking Functions
Investment Products
Corporate Banking Unit
International BankingUnit
Products Units
Syndication
M&A
Industry research functions
Overseas Office Network
Housing Loans
Card Loans, etc.
TrustFunctions
SecuritiesFunctions
Management executives and employees of corporate customers,business owners., etc
Large CorporateCustomers
Individual Customers
Corporate Customers
Upper middle-sizedand larger corporations
Overseas Customers
Japanese / Non-Japanese Companies
Synergy Effects (1)
Mizuho’s Customers
GrowthArea
Transformationinto
“One Bank”
Integrated group managementCollaboration among banking, trust and securities functions
Products Functions
Synergy Effects (2)
Overseas expansion
20
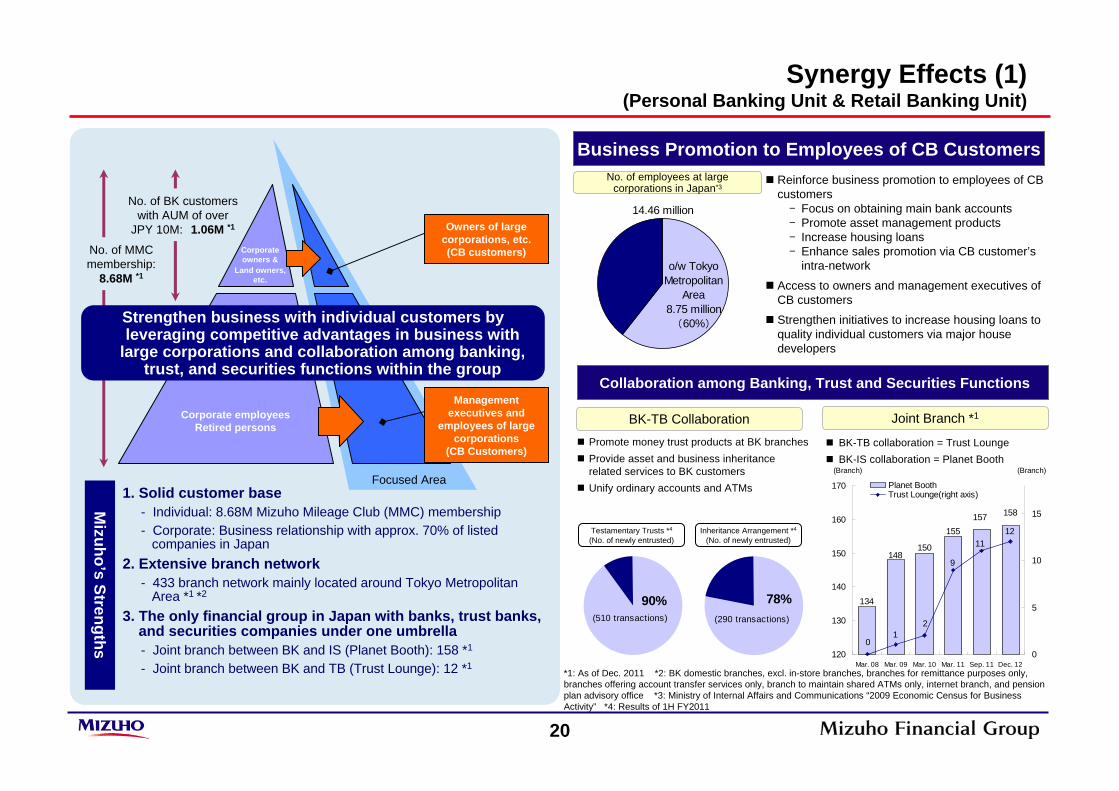
Reinforce business promotion to employees of CB customers- Focus on obtaining main bank accounts- Promote asset management products- Increase housing loans- Enhance sales promotion via CB customer’s
intra-network
Access to owners and management executives of CB customers
Strengthen initiatives to increase housing loans to quality individual customers via major house developers
Corporate employees Retired persons
Synergy Effects (1)(Personal Banking Unit & Retail Banking Unit)
Business Promotion to Employees of CB CustomersNo. of employees at large
corporations in Japan*3
*1: As of Dec. 2011 *2: BK domestic branches, excl. in-store branches, branches for remittance purposes only, branches offering account transfer services only, branch to maintain shared ATMs only, internet branch, and pension plan advisory office *3: Ministry of Internal Affairs and Communications “2009 Economic Census for Business Activity” *4: Results of 1H FY2011
Collaboration among Banking, Trust and Securities Functions
Joint Branch *1BK-TB Collaboration
Testamentary Trusts *4
(No. of newly entrusted)Inheritance Arrangement *4
(No. of newly entrusted)
Promote money trust products at BK branchesProvide asset and business inheritance related services to BK customersUnify ordinary accounts and ATMs
BK-TB collaboration = Trust LoungeBK-IS collaboration = Planet Booth
Owners of large corporations, etc.(CB customers)
Focused Area
Strengthen business with individual customers by leveraging competitive advantages in business with
large corporations and collaboration among banking, trust, and securities functions within the group
No. of MMC membership:
8.68M *1
No. of BK customers with AUM of over
JPY 10M: 1.06M *1
1. Solid customer base- Individual: 8.68M Mizuho Mileage Club (MMC) membership- Corporate: Business relationship with approx. 70% of listed
companies in Japan2. Extensive branch network
- 433 branch network mainly located around Tokyo Metropolitan Area *1 *2
3. The only financial group in Japan with banks, trust banks, and securities companies under one umbrella- Joint branch between BK and IS (Planet Booth): 158 *1
- Joint branch between BK and TB (Trust Lounge): 12 *1
Mizuho’s Strengths
Management executives and
employees of large corporations
(CB Customers)
Corporate owners &
Land owners, etc.
14.46 million
o/w TokyoMetropolitan
Area8.75 million(60%)
90%(510 transactions)
78%(290 transactions)
158157155
148150
134
1211
9
21
0120
130
140
150
160
170
Mar. 08 Mar. 09 Mar. 10 Mar. 11 Sep. 11 Dec. 12
(Branch)
0
5
10
15
(Branch)
Planet BoothTrust Lounge(right axis)
21
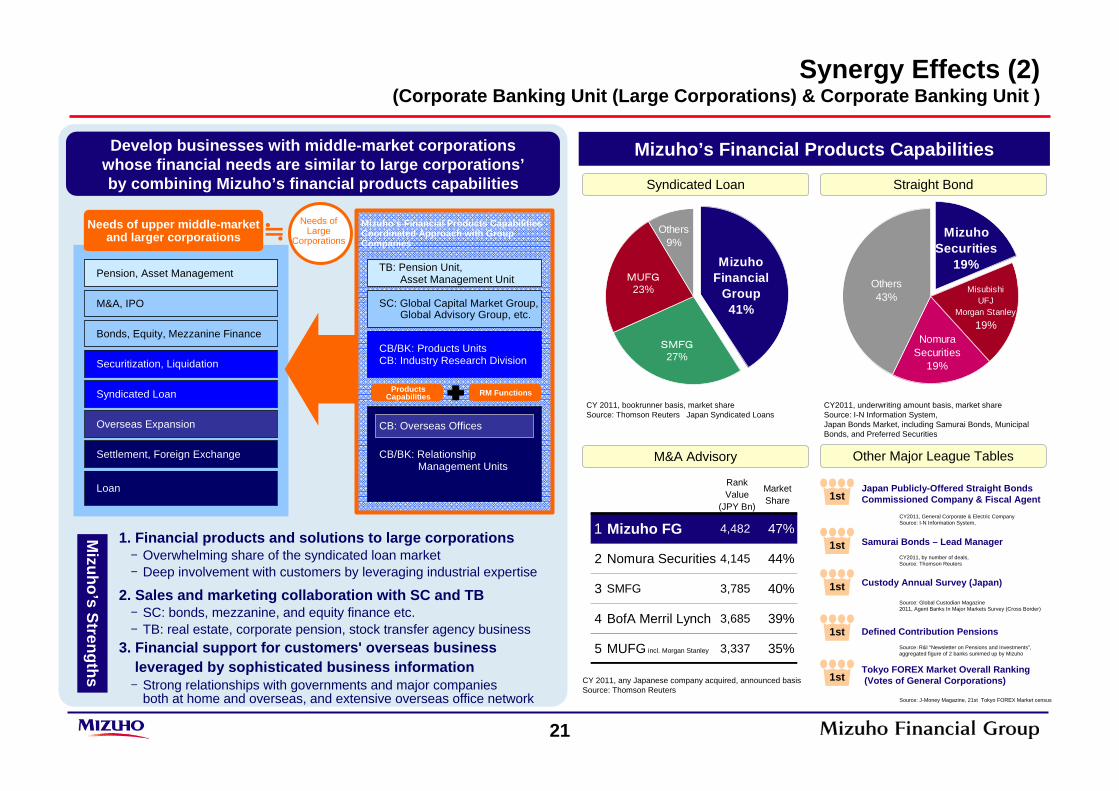
SMFG27%
MUFG23%
Others9%
MizuhoFinancial
Group41%
Synergy Effects (2)(Corporate Banking Unit (Large Corporations) & Corporate Banking Unit )
Mizuho’s Financial Products Capabilities
Syndicated Loan
Other Major League Tables
Straight Bond
1st
M&A Advisory
1st
1st
Samurai Bonds – Lead Manager
Defined Contribution Pensions
Japan Publicly-Offered Straight BondsCommissioned Company & Fiscal Agent
Tokyo FOREX Market Overall Ranking(Votes of General Corporations)1st
CY 2011, bookrunner basis, market shareSource: Thomson Reuters Japan Syndicated Loans
CY2011, underwriting amount basis, market shareSource: I-N Information System, Japan Bonds Market, including Samurai Bonds, Municipal Bonds, and Preferred Securities
CY2011, General Corporate & Electric Company Source: I-N Information System,
CY2011, by number of deals, Source: Thomson Reuters
Source: Global Custodian Magazine2011, Agent Banks In Major Markets Survey (Cross Border)
Source:R&I “Newsletter on Pensions and Investments”, aggregated figure of 2 banks summed up by Mizuho
Source: J-Money Magazine, 21st Tokyo FOREX Market census
1st Custody Annual Survey (Japan)
MisubishiUFJ
Morgan Stanley19%
NomuraSecurities
19%
Others43%
MizuhoSecurities
19%
Mizuho’s Strengths
1. Financial products and solutions to large corporations- Overwhelming share of the syndicated loan market- Deep involvement with customers by leveraging industrial expertise
2. Sales and marketing collaboration with SC and TB- SC: bonds, mezzanine, and equity finance etc.- TB: real estate, corporate pension, stock transfer agency business
3. Financial support for customers' overseas business leveraged by sophisticated business information- Strong relationships with governments and major companies
both at home and overseas, and extensive overseas office network
Develop businesses with middle-market corporations whose financial needs are similar to large corporations’by combining Mizuho’s financial products capabilities
TB: Pension Unit,Asset Management Unit
CB/BK: Products UnitsCB: Industry Research Division
SC: Global Capital Market Group, Global Advisory Group, etc.
CB/BK: Relationship Management Units
Mizuho’s Financial Products CapabilitiesCoordinated Approach with Group Companies
CB: Overseas Offices
Pension, Asset Management
M&A, IPO
Securitization, Liquidation
Syndicated Loan
Overseas Expansion
Bonds, Equity, Mezzanine Finance
Loan
Settlement, Foreign Exchange
Needs of upper middle-market and larger corporations
Needs of Large
Corporations≒
ProductsCapabilities RM Functions
CY 2011, any Japanese company acquired, announced basisSource: Thomson Reuters
RankValue
(JPY Bn)
MarketShare
1 Mizuho FG 4,482 47%
2 Nomura Securities 4,145 44%
3 SMFG 3,785 40%
4 BofA Merril Lynch 3,685 39%
5 MUFG incl. Morgan Stanley 3,337 35%
22
138 150 122 124 150207 229
297
253
214
176
130133142161
37
5358
43
2726
3333
0
100
200
300
400
500
600
1HFY08
2HFY08
1HFY09
2HFY09
1HFY10
2HFY10
1HFY11
3QFY11
0
10
20
30
40
50
60Gross Profits(2Q/4Q)Gross Profits(1Q/3Q)Loan Balance (period-end)right axis
(2Q) (4Q)
(2Q) (4Q)
(2Q)
(4Q)
(2Q)
(1Q) (3Q)(1Q) (3Q)
(1Q)(3Q) (1Q)
(3Q)
3436 36
38 38
25
30
35
40
45
50
Mar.08 Mar.09 Mar.10 Mar.11 Sep.11
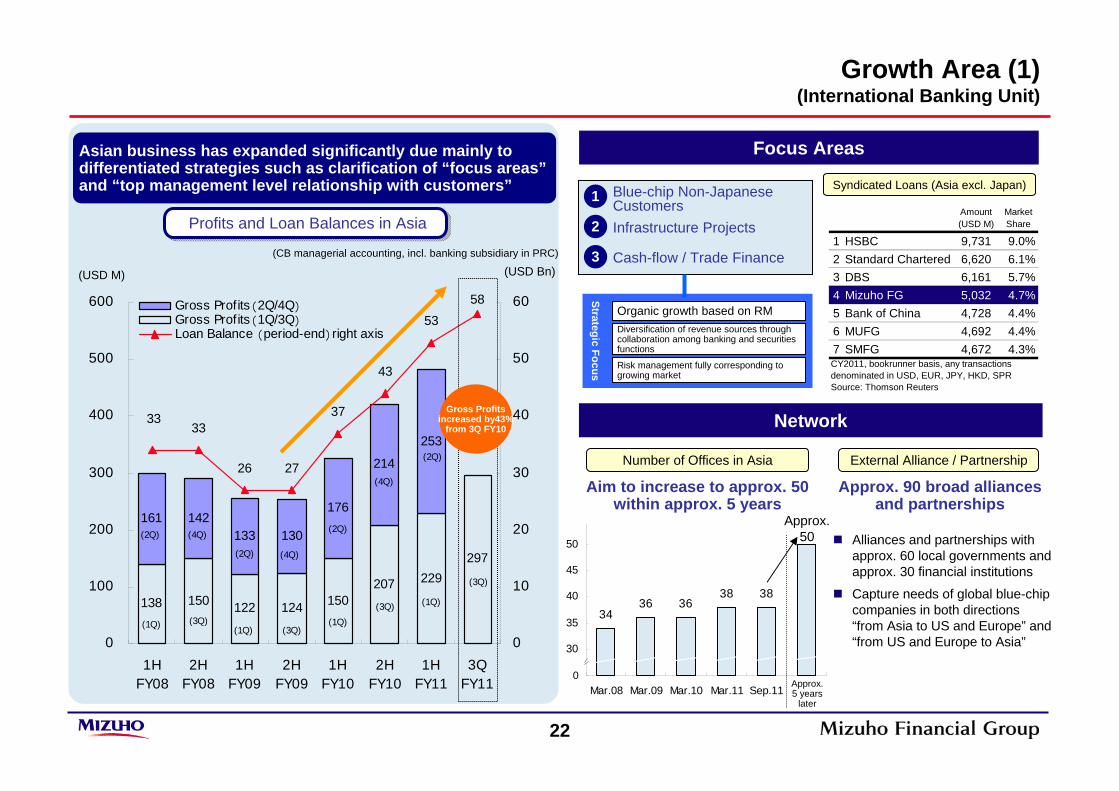
Growth Area (1)(International Banking Unit)
Focus Areas
(USD M) (USD Bn)
Approx. 5 years
later
Network
Number of Offices in Asia
Alliances and partnerships with approx. 60 local governments and approx. 30 financial institutions
Capture needs of global blue-chip companies in both directions “from Asia to US and Europe” and “from US and Europe to Asia”
External Alliance / Partnership
Aim to increase to approx. 50 within approx. 5 years
Asian business has expanded significantly due mainly to differentiated strategies such as clarification of “focus areas”and “top management level relationship with customers”
(CB managerial accounting, incl. banking subsidiary in PRC)
Profits and Loan Balances in AsiaProfits and Loan Balances in Asia
Approx. 90 broad alliances and partnerships
Blue-chip Non-Japanese CustomersInfrastructure Projects
Cash-flow / Trade Finance
1
3
2
Gross Profitsincreased by43%
from 3Q FY10
Organic growth based on RM Diversification of revenue sources through collaboration among banking and securities functions
Risk management fully corresponding to growing market
Syndicated Loans (Asia excl. Japan)
Strategic FocusApprox.
50
Amount(USD M)
MarketShare
1 HSBC 9,731 9.0%2 Standard Chartered 6,620 6.1%3 DBS 6,161 5.7%4 Mizuho FG 5,032 4.7%5 Bank of China 4,728 4.4%6 MUFG 4,692 4.4%7 SMFG 4,672 4.3%CY2011, bookrunner basis, any transactions denominated in USD, EUR, JPY, HKD, SPRSource: Thomson Reuters
0
23
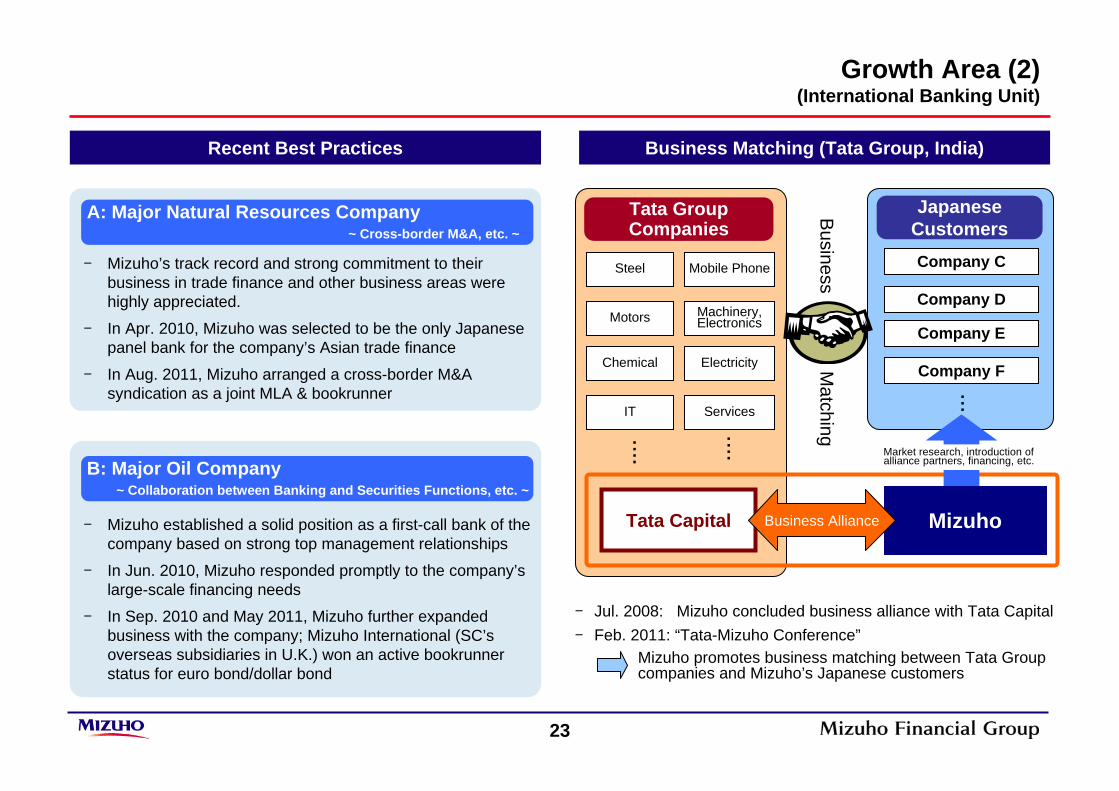
- Mizuho established a solid position as a first-call bank of the company based on strong top management relationships
- In Jun. 2010, Mizuho responded promptly to the company’s large-scale financing needs
- In Sep. 2010 and May 2011, Mizuho further expanded business with the company; Mizuho International (SC’s overseas subsidiaries in U.K.) won an active bookrunner status for euro bond/dollar bond
- Mizuho’s track record and strong commitment to their business in trade finance and other business areas were highly appreciated.
- In Apr. 2010, Mizuho was selected to be the only Japanese panel bank for the company’s Asian trade finance
- In Aug. 2011, Mizuho arranged a cross-border M&A syndication as a joint MLA & bookrunner
Recent Best Practices Business Matching (Tata Group, India)
Mizuho
Steel Mobile Phone
Chemical Electricity
Motors
IT
Machinery, Electronics
Services
Tata Capital Business Alliance
Company C
Company D
Company E
Company F
- Jul. 2008: Mizuho concluded business alliance with Tata Capital- Feb. 2011: “Tata-Mizuho Conference”
Mizuho promotes business matching between Tata Groupcompanies and Mizuho’s Japanese customers
Business
Matching
B: Major Oil Company ~ Collaboration between Banking and Securities Functions, etc. ~
A: Major Natural Resources Company~ Cross-border M&A, etc. ~
Tata GroupCompanies
Japanese Customers
・・・
・・・・
・・・・Market research, introduction of alliance partners, financing, etc.
Growth Area (2)(International Banking Unit)
24
Contribute to economic growthboth in Japan and host countries
Create new business fieldsfor Japanese companies &
Japanese companiesJapanese companiesInfrastructure
exportAttraction of companies
(support overseas expansion)
Finance
Clients base
Industry knowledge
Global network
【 Gateway 】
Mizuho
Consortium
Support
Host country governm
entH
ost country government
Companies of third party countriesCompanies of third party countries
Japanese government
Japanese government
Hostcountry
companies
Hostcountry
companiesCo-Creation
Support
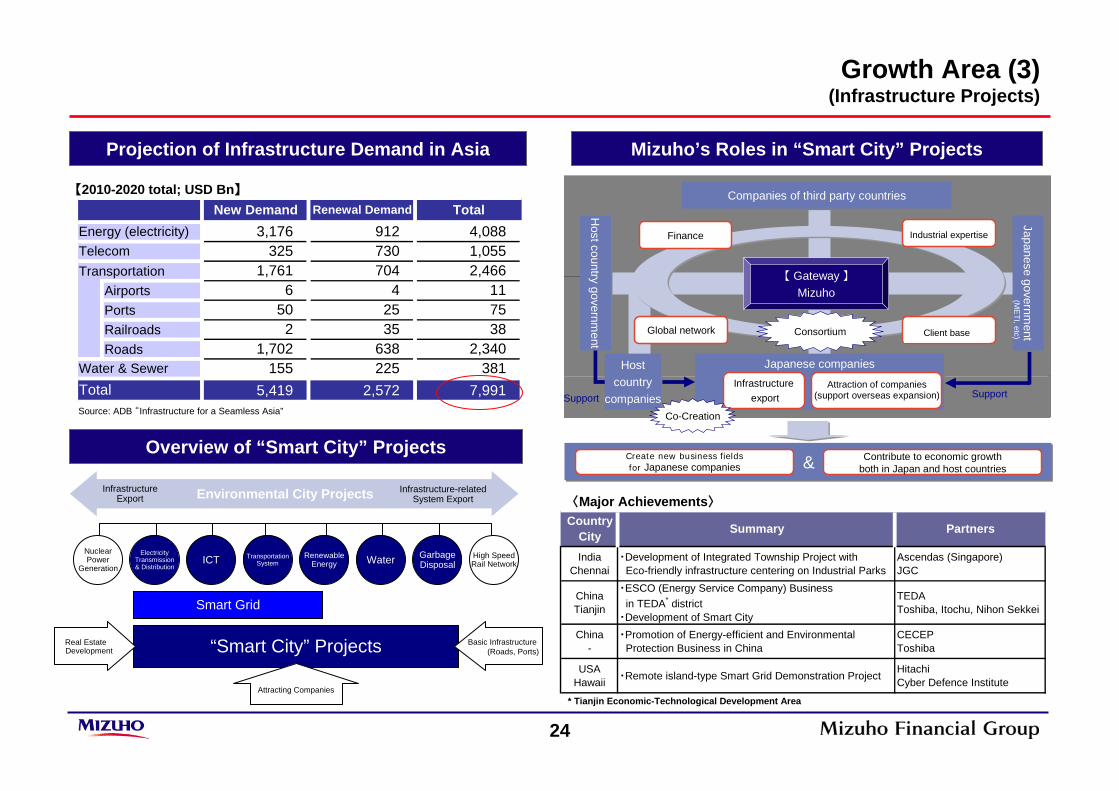
Growth Area (3)(Infrastructure Projects)
Projection of Infrastructure Demand in Asia
Source: ADB “Infrastructure for a Seamless Asia”
Overview of “Smart City” Projects
Mizuho’s Roles in “Smart City” Projects
〈Major Achievements〉
“Smart City” ProjectsReal EstateDevelopment
Basic Infrastructure (Roads, Ports)
Attracting Companies
Smart Grid
NuclearPower
Generation
ElectricityTransmission& Distribution
ICT TransportationSystem
RenewableEnergy Water Garbage
DisposalHigh SpeedRail Network
InfrastructureExport
Infrastructure-related System ExportEnvironmental City Projects
3,176 912 4,088325 730 1,055
Transportation 1,761 704 2,466Airports 6 4 11Ports 50 25 75Railroads 2 35 38Roads 1,702 638 2,340
155 225 3815,419 2,572 7,991
Energy (electricity)Telecom
Water & SewerTotal
New Demand Renewal Demand Total【2010-2020 total; USD Bn】
(ME
TI, etc)
Industrial expertise
Client base
CountryCity Summary Partners
IndiaChennai
・Development of Integrated Township Project with Eco-friendly infrastructure centering on Industrial Parks
Ascendas (Singapore)JGC
ChinaTianjin
・ESCO (Energy Service Company) Business in TEDA* district・Development of Smart City
TEDAToshiba, Itochu, Nihon Sekkei
China-
・Promotion of Energy-efficient and Environmental Protection Business in China
CECEPToshiba
USAHawaii ・Remote island-type Smart Grid Demonstration Project Hitachi
Cyber Defence Institute
* Tianjin Economic-Technological Development Area

25
2. Mizuho’s Initiatives P.8
(3) Disciplined Capital Management P.25
3. In Closing P.29
1. Introduction - Financial & Economic Environment P.3
(1) Balance Sheet Soundness P.10
(2) “Substantive One Bank” & Integrated Growth Strategy P.15
(Appendix) P.31
26
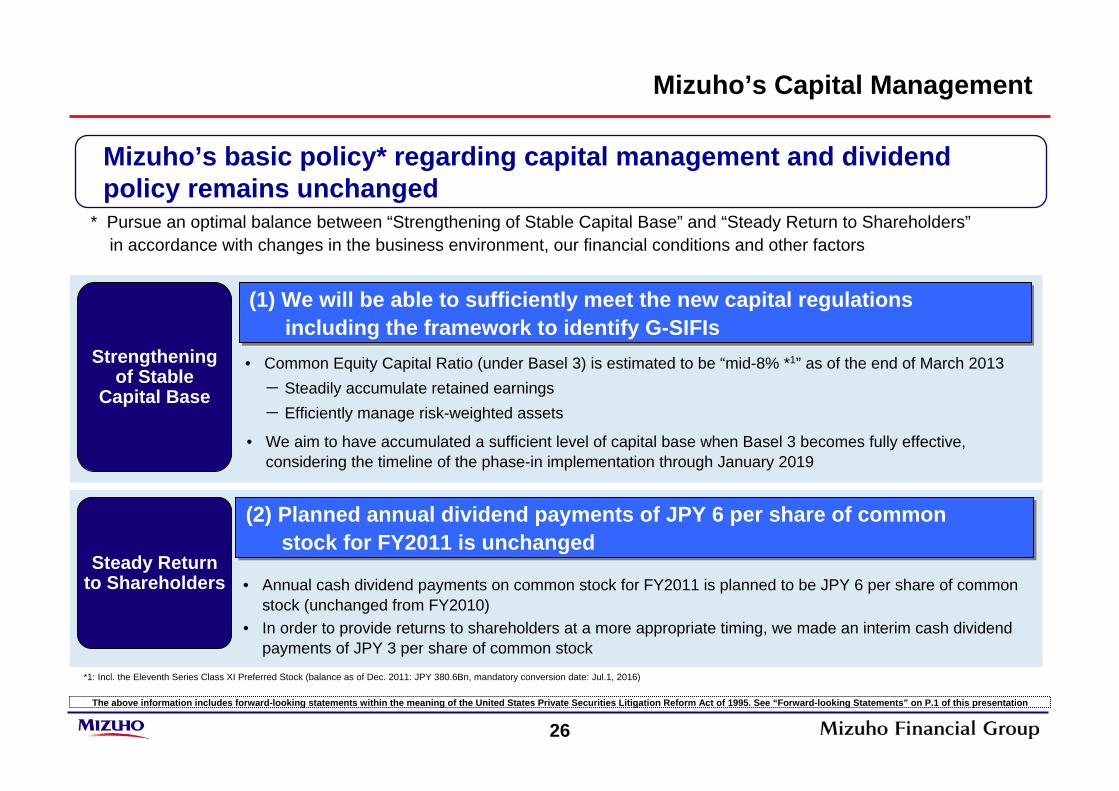
• Common Equity Capital Ratio (under Basel 3) is estimated to be “mid-8% *1” as of the end of March 2013- Steadily accumulate retained earnings- Efficiently manage risk-weighted assets
• Annual cash dividend payments on common stock for FY2011 is planned to be JPY 6 per share of common stock (unchanged from FY2010)
• In order to provide returns to shareholders at a more appropriate timing, we made an interim cash dividend payments of JPY 3 per share of common stock
(1) We will be able to sufficiently meet the new capital regulations including the framework to identify G-SIFIs
(1) We will be able to sufficiently meet the new capital regulations including the framework to identify G-SIFIs
*1: Incl. the Eleventh Series Class XI Preferred Stock (balance as of Dec. 2011: JPY 380.6Bn, mandatory conversion date: Jul.1, 2016)
Mizuho’s Capital Management
Strengthening of Stable
Capital Base
Steady Return to Shareholders
(2) Planned annual dividend payments of JPY 6 per share of common stock for FY2011 is unchanged
(2) Planned annual dividend payments of JPY 6 per share of common stock for FY2011 is unchanged
• We aim to have accumulated a sufficient level of capital base when Basel 3 becomes fully effective, considering the timeline of the phase-in implementation through January 2019
Mizuho’s basic policy* regarding capital management and dividend policy remains unchanged
* Pursue an optimal balance between “Strengthening of Stable Capital Base” and “Steady Return to Shareholders”in accordance with changes in the business environment, our financial conditions and other factors
The above information includes forward-looking statements within the meaning of the United States Private Securities Litigation Reform Act of 1995. See “Forward-looking Statements” on P.1 of this presentation
27
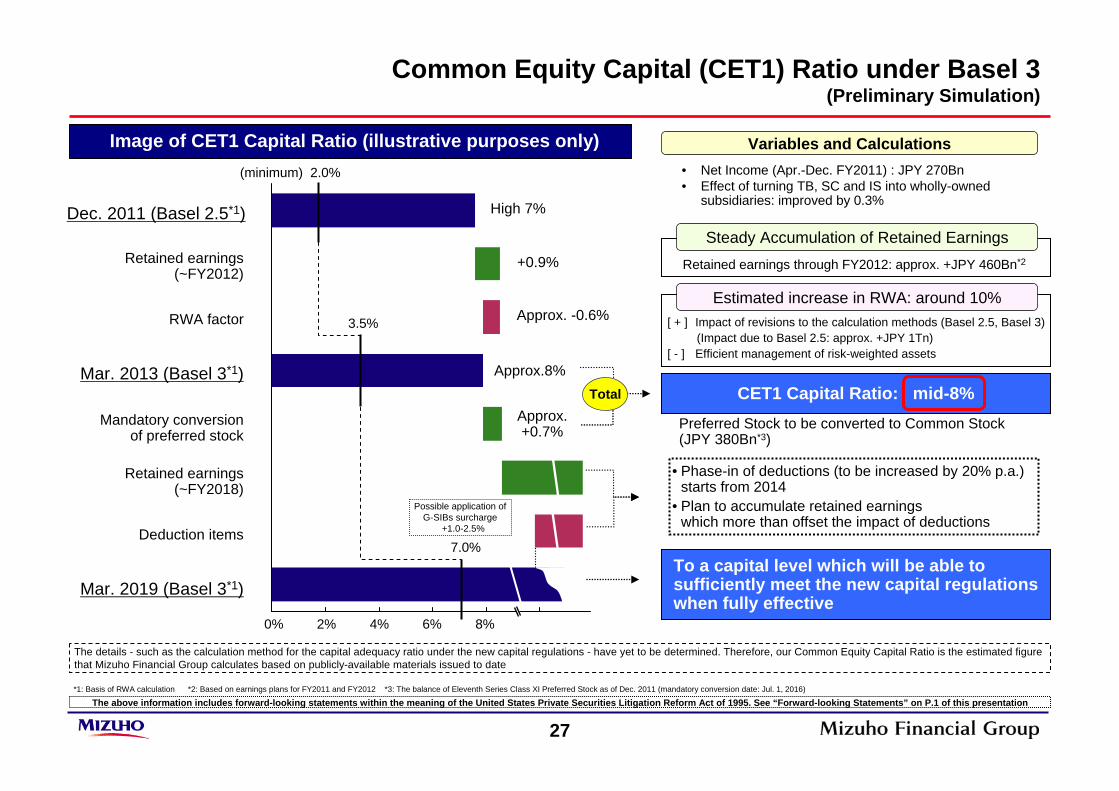
Common Equity Capital (CET1) Ratio under Basel 3 (Preliminary Simulation)
Image of CET1 Capital Ratio (illustrative purposes only) Variables and Calculations
Mar. 2019 (Basel 3*1)
Deduction items
Retained earnings (~FY2018)
Mandatory conversion of preferred stock
RWA factor
Dec. 2011 (Basel 2.5*1)
Mar. 2013 (Basel 3*1)
Retained earnings (~FY2012)
Retained earnings through FY2012: approx. +JPY 460Bn*2
[ + ] Impact of revisions to the calculation methods (Basel 2.5, Basel 3)(Impact due to Basel 2.5: approx. +JPY 1Tn)
[ - ] Efficient management of risk-weighted assets
• Net Income (Apr.-Dec. FY2011) : JPY 270Bn• Effect of turning TB, SC and IS into wholly-owned
subsidiaries: improved by 0.3%
CET1 Capital Ratio: mid-8%Preferred Stock to be converted to Common Stock (JPY 380Bn*3)
To a capital level which will be able to sufficiently meet the new capital regulations when fully effective
• Phase-in of deductions (to be increased by 20% p.a.) starts from 2014
• Plan to accumulate retained earnings which more than offset the impact of deductions
*1: Basis of RWA calculation *2: Based on earnings plans for FY2011 and FY2012 *3: The balance of Eleventh Series Class XI Preferred Stock as of Dec. 2011 (mandatory conversion date: Jul. 1, 2016)
The details - such as the calculation method for the capital adequacy ratio under the new capital regulations - have yet to be determined. Therefore, our Common Equity Capital Ratio is the estimated figure that Mizuho Financial Group calculates based on publicly-available materials issued to date
The above information includes forward-looking statements within the meaning of the United States Private Securities Litigation Reform Act of 1995. See “Forward-looking Statements” on P.1 of this presentation
3.5%
7.0%
2%0% 4% 6% 8%
Possible application of G-SIBs surcharge
+1.0-2.5%
High 7%
Approx. -0.6%
+0.9%
Approx.+0.7%
(minimum) 2.0%
Total
Approx.8%
Steady Accumulation of Retained Earnings
Estimated increase in RWA: around 10%
28
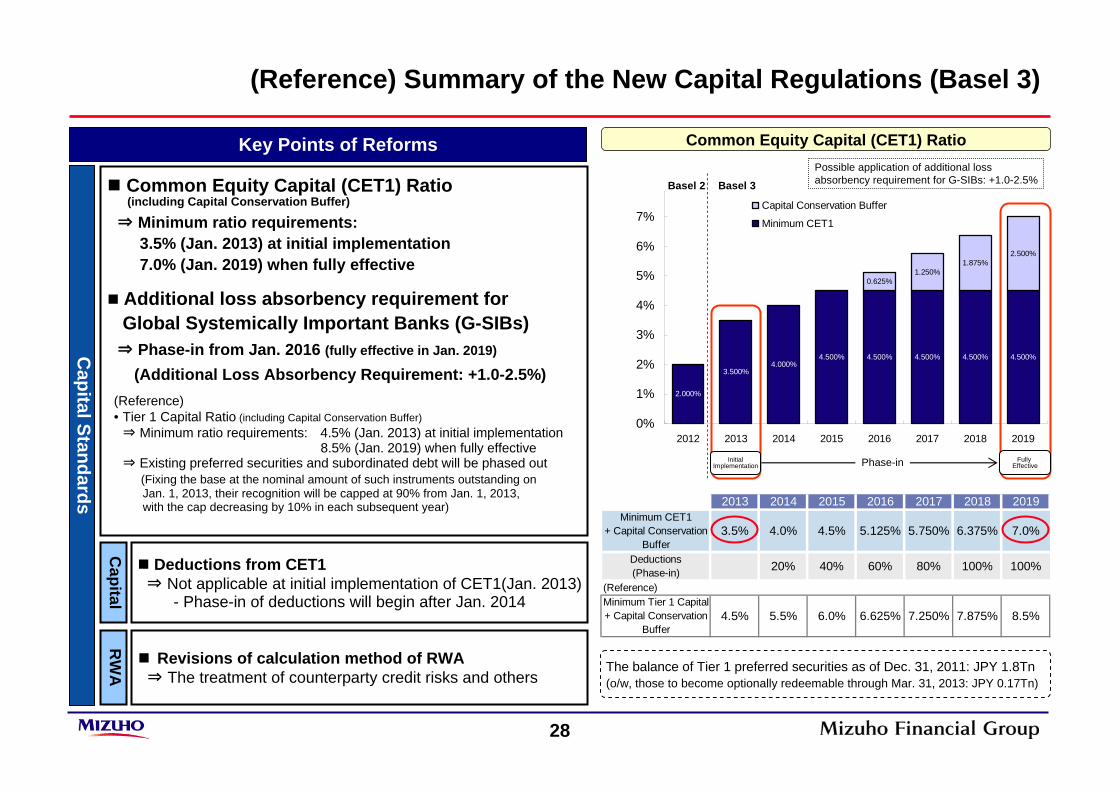
2013 2014 2015 2016 2017 2018 2019Minimum CET1
+ Capital ConservationBuffer
3.5% 4.0% 4.5% 5.125% 5.750% 6.375% 7.0%
Deductions(Phase-in) 20% 40% 60% 80% 100% 100%
(Reference)Minimum Tier 1 Capital+ Capital Conservation
Buffer4.5% 5.5% 6.0% 6.625% 7.250% 7.875% 8.5%
2.000%
3.500%4.000%
4.500% 4.500% 4.500% 4.500% 4.500%
0.625%1.250%
1.875%2.500%
0%
1%
2%
3%
4%
5%
6%
7%
2012 2013 2014 2015 2016 2017 2018 2019
Capital Conservation Buffer
Minimum CET1
Common Equity Capital (CET1) Ratio
(Reference) Summary of the New Capital Regulations (Basel 3)
Phase-in
Basel 2 Basel 3
The balance of Tier 1 preferred securities as of Dec. 31, 2011: JPY 1.8Tn(o/w, those to become optionally redeemable through Mar. 31, 2013: JPY 0.17Tn)
InitialImplementation
Fully Effective
Key Points of Reforms
Capital Standards
Common Equity Capital (CET1) Ratio(including Capital Conservation Buffer)
⇒ Minimum ratio requirements:3.5% (Jan. 2013) at initial implementation7.0% (Jan. 2019) when fully effective
Additional loss absorbency requirement for Global Systemically Important Banks (G-SIBs)⇒ Phase-in from Jan. 2016 (fully effective in Jan. 2019)
(Additional Loss Absorbency Requirement: +1.0-2.5%)
Revisions of calculation method of RWA⇒ The treatment of counterparty credit risks and others
Capital
RW
A
Deductions from CET1⇒ Not applicable at initial implementation of CET1(Jan. 2013)
- Phase-in of deductions will begin after Jan. 2014
(Reference)• Tier 1 Capital Ratio (including Capital Conservation Buffer)⇒ Minimum ratio requirements: 4.5% (Jan. 2013) at initial implementation
8.5% (Jan. 2019) when fully effective⇒ Existing preferred securities and subordinated debt will be phased out
(Fixing the base at the nominal amount of such instruments outstanding onJan. 1, 2013, their recognition will be capped at 90% from Jan. 1, 2013,with the cap decreasing by 10% in each subsequent year)
Possible application of additional loss absorbency requirement for G-SIBs: +1.0-2.5%
29
2. Mizuho’s Initiatives P.8
(3) Disciplined Capital Management P.25
3. In Closing P.29
1. Introduction - Financial & Economic Environment P.3
(1) Balance Sheet Soundness P.10
(2) “Substantive One Bank” & Integrated Growth Strategy P.15
(Appendix) P.31
30
In Closing
31
2. Mizuho’s Initiatives P.8
(3) Disciplined Capital Management P.25
3. In Closing P.29
1. Introduction - Financial & Economic Environment P.3
(1) Balance Sheet Soundness P.10
(2) “Substantive One Bank” & Integrated Growth Strategy P.15
(Appendix) P.31
32
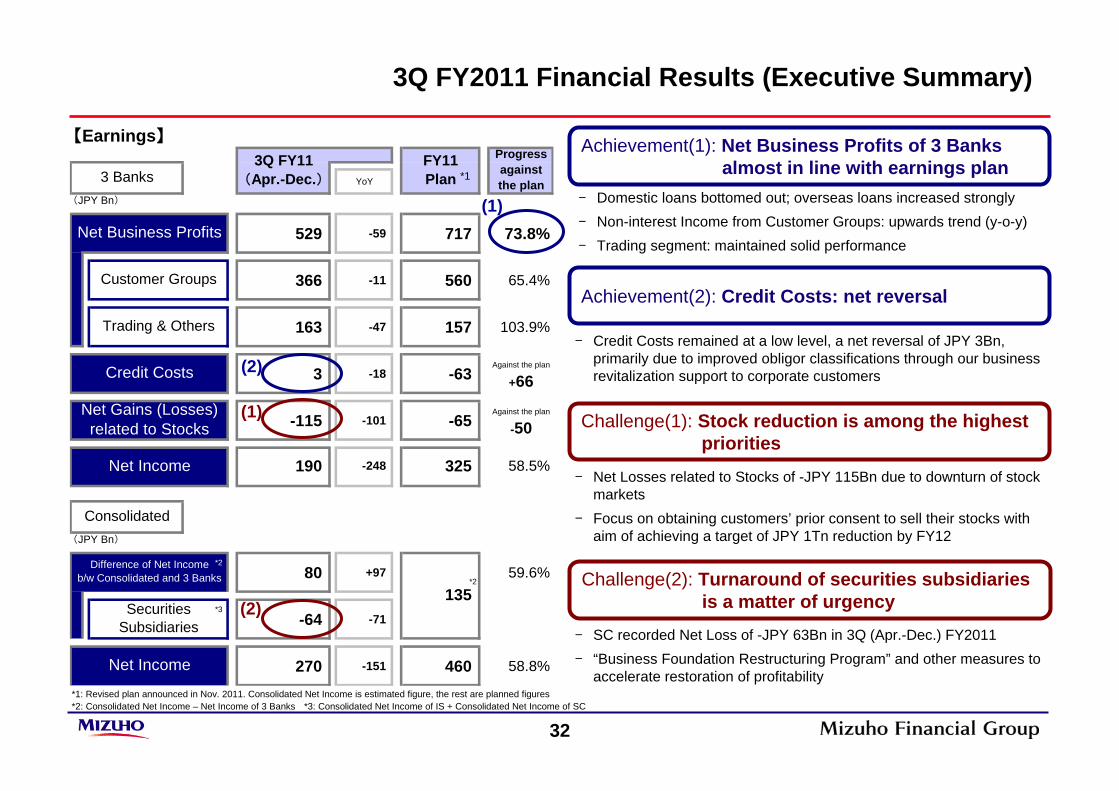
【Earnings】
YoY
(JPY Bn)
529 -59 717 73.8%
366 -11 560 65.4%
163 -47 157 103.9%
3 -18 -63Against the plan
+66
-115 -101 -65Against the plan
-50
(JPY Bn)
80 +97 59.6%
-64 -71
270 -151 460 58.8%
Net Income
3 Banks
Customer Groups
Trading & Others
Net Business Profits
Credit Costs
Net Income
190 325-248
Progressagainstthe plan
58.5%
SecuritiesSubsidiaries
Consolidated
Difference of Net Incomeb/w Consolidated and 3 Banks
3Q FY11(Apr.-Dec.)
FY11Plan
Net Gains (Losses)related to Stocks
135
*2
*3
*1
*2
3Q FY2011 Financial Results (Executive Summary)
*1: Revised plan announced in Nov. 2011. Consolidated Net Income is estimated figure, the rest are planned figures*2: Consolidated Net Income – Net Income of 3 Banks *3: Consolidated Net Income of IS + Consolidated Net Income of SC
- Domestic loans bottomed out; overseas loans increased strongly- Non-interest Income from Customer Groups: upwards trend (y-o-y)- Trading segment: maintained solid performance
- Net Losses related to Stocks of -JPY 115Bn due to downturn of stock markets
- Focus on obtaining customers’ prior consent to sell their stocks with aim of achieving a target of JPY 1Tn reduction by FY12
- Credit Costs remained at a low level, a net reversal of JPY 3Bn,primarily due to improved obligor classifications through our business revitalization support to corporate customers
Achievement(1): Net Business Profits of 3 Banks almost in line with earnings plan
Achievement(2): Credit Costs: net reversal
Challenge(1): Stock reduction is among the highest priorities
Challenge(2): Turnaround of securities subsidiaries is a matter of urgency
- SC recorded Net Loss of -JPY 63Bn in 3Q (Apr.-Dec.) FY2011 - “Business Foundation Restructuring Program” and other measures to
accelerate restoration of profitability
(1)
(2)
(1)
(2)
33
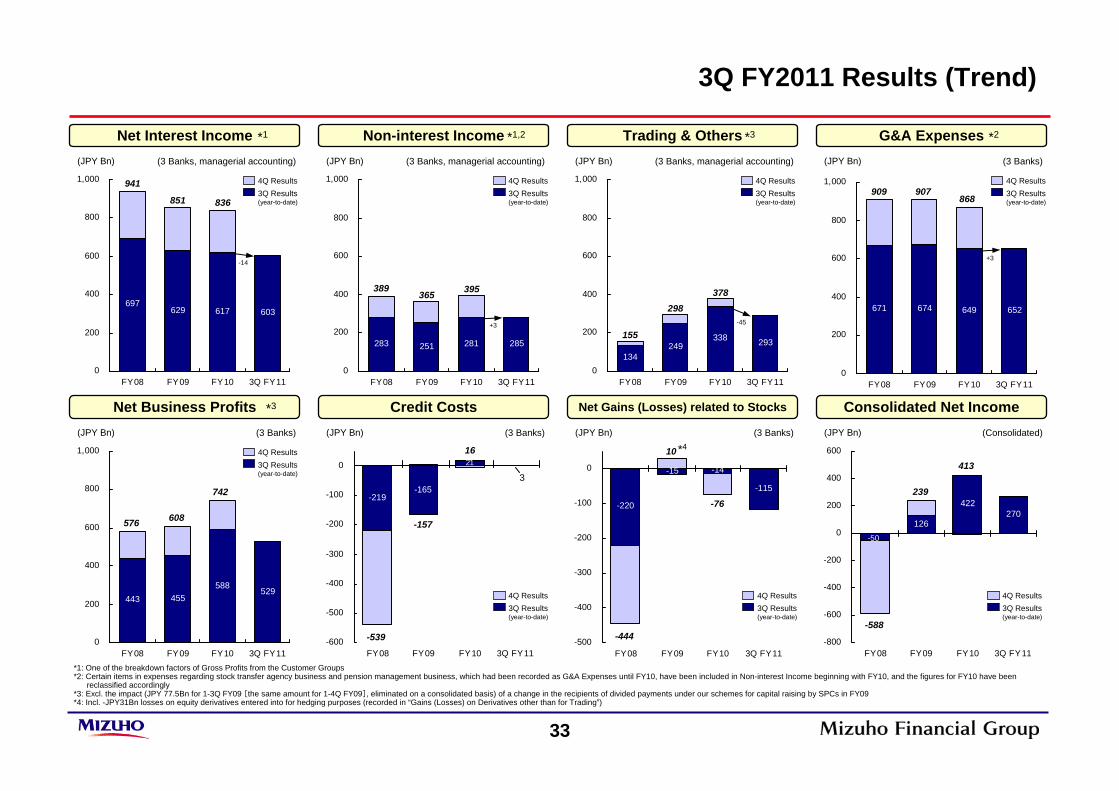
697629 617 603
0
200
400
600
800
1,000
FY08 FY09 FY10 3Q FY11
*1: One of the breakdown factors of Gross Profits from the Customer Groups *2: Certain items in expenses regarding stock transfer agency business and pension management business, which had been recorded as G&A Expenses until FY10, have been included in Non-interest Income beginning with FY10, and the figures for FY10 have been
reclassified accordingly*3: Excl. the impact (JPY 77.5Bn for 1-3Q FY09 [the same amount for 1-4Q FY09], eliminated on a consolidated basis) of a change in the recipients of divided payments under our schemes for capital raising by SPCs in FY09*4: Incl. -JPY31Bn losses on equity derivatives entered into for hedging purposes (recorded in “Gains (Losses) on Derivatives other than for Trading”)
Net Interest Income
941
836851
(JPY Bn) (3 Banks, managerial accounting)
*1
283 251 285281
0
200
400
600
800
1,000
FY08 FY09 FY10 3Q FY11
Non-interest Income
389 395365
(JPY Bn) (3 Banks, managerial accounting)
*1,2
134293338
249
0
200
400
600
800
1,000
FY08 FY09 FY10 3Q FY11
Trading & Others
155
378298
(JPY Bn) (3 Banks, managerial accounting)
*3
671 649674 652
0
200
400
600
800
1,000
FY08 FY09 FY10 3Q FY11
G&A Expenses
909868
907
(JPY Bn) (3 Banks)
*2
443588
529455
0
200
400
600
800
1,000
FY08 FY09 FY10 3Q FY11
Net Business Profits
576
742
608
(JPY Bn) (3 Banks)
*3
21
-165-219
-600
-500
-400
-300
-200
-100
0
FY08 FY09 FY10 3Q FY11
Credit Costs
-539
16
-157
(JPY Bn) (3 Banks)
-115
-14-15
-220
-500
-400
-300
-200
-100
0
FY08 FY09 FY10 3Q FY11
Net Gains (Losses) related to Stocks
-444
10
(JPY Bn) (3 Banks)
126270
422
-800
-600
-400
-200
0
200
400
600
FY08 FY09 FY10 3Q FY11
Consolidated Net Income
-588
413
239
(JPY Bn) (Consolidated)
3Q Results(year-to-date)
4Q Results
-14
+3 -45
+3
-76
3
-50
3Q FY2011 Results (Trend)
3Q Results(year-to-date)
4Q Results 3Q Results(year-to-date)
4Q Results 3Q Results(year-to-date)
4Q Results
3Q Results(year-to-date)
4Q Results
3Q Results(year-to-date)
4Q Results 3Q Results(year-to-date)
4Q Results 3Q Results(year-to-date)
4Q Results
*4
34
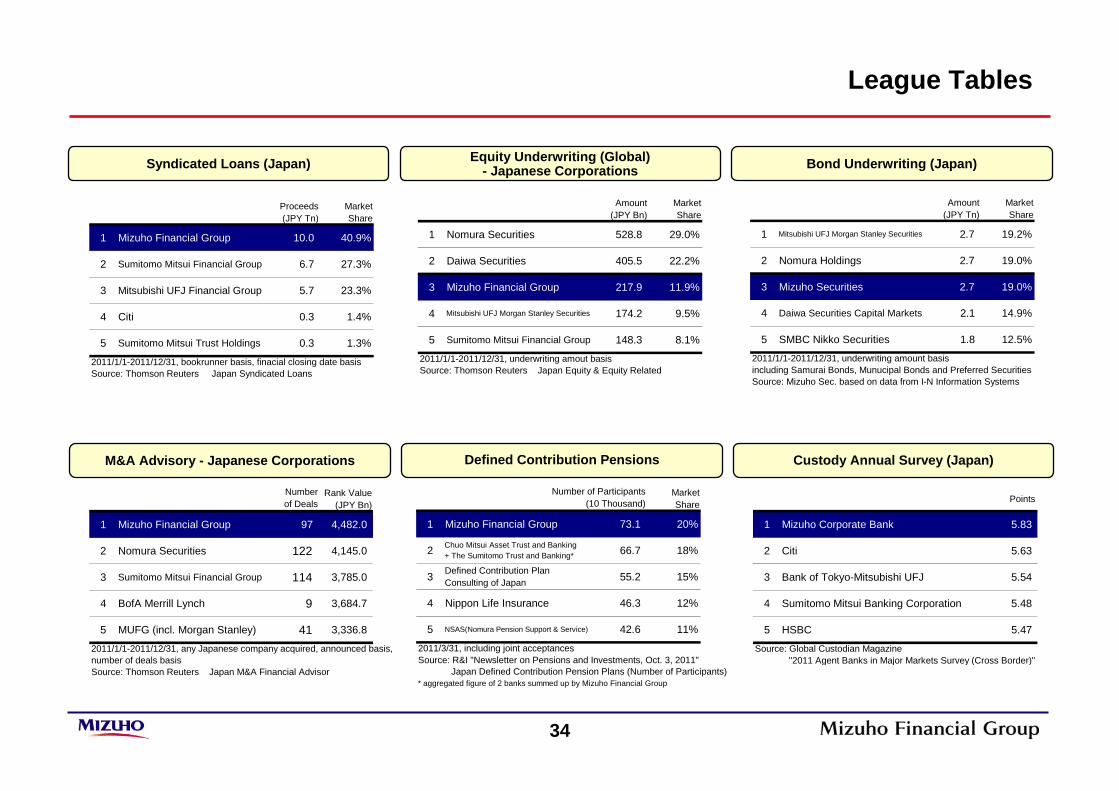
Bond Underwriting (Japan)Syndicated Loans (Japan) Equity Underwriting (Global)- Japanese Corporations
Defined Contribution Pensions Custody Annual Survey (Japan)M&A Advisory - Japanese Corporations
League Tables
Proceeds(JPY Tn)
MarketShare
1 Mizuho Financial Group 10.0 40.9%
2 Sumitomo Mitsui Financial Group 6.7 27.3%
3 Mitsubishi UFJ Financial Group 5.7 23.3%
4 Citi 0.3 1.4%
5 Sumitomo Mitsui Trust Holdings 0.3 1.3%
2011/1/1-2011/12/31, bookrunner basis, finacial closing date basisSource: Thomson Reuters Japan Syndicated Loans
Points
1 Mizuho Corporate Bank 5.83
2 Citi 5.63
3 Bank of Tokyo-Mitsubishi UFJ 5.54
4 Sumitomo Mitsui Banking Corporation 5.48
5 HSBC 5.47
Source: Global Custodian Magazine "2011 Agent Banks in Major Markets Survey (Cross Border)"
Amount(JPY Bn)
MarketShare
1 Nomura Securities 528.8 29.0%
2 Daiwa Securities 405.5 22.2%
3 Mizuho Financial Group 217.9 11.9%
4 Mitsubishi UFJ Morgan Stanley Securities 174.2 9.5%
5 Sumitomo Mitsui Financial Group 148.3 8.1%
2011/1/1-2011/12/31, underwriting amout basisSource: Thomson Reuters Japan Equity & Equity Related
Amount(JPY Tn)
MarketShare
1 Mitsubishi UFJ Morgan Stanley Securities 2.7 19.2%
2 Nomura Holdings 2.7 19.0%
3 Mizuho Securities 2.7 19.0%
4 Daiwa Securities Capital Markets 2.1 14.9%
5 SMBC Nikko Securities 1.8 12.5%
2011/1/1-2011/12/31, underwriting amount basisincluding Samurai Bonds, Munucipal Bonds and Preferred SecuritiesSource: Mizuho Sec. based on data from I-N Information Systems
Rank Value(JPY Bn)
1 Mizuho Financial Group 97 4,482.0
2 Nomura Securities 122 4,145.0
3 Sumitomo Mitsui Financial Group 114 3,785.0
4 BofA Merrill Lynch 9 3,684.7
5 MUFG (incl. Morgan Stanley) 41 3,336.8
2011/1/1-2011/12/31, any Japanese company acquired, announced basis,number of deals basisSource: Thomson Reuters Japan M&A Financial Advisor
Numberof Deals
MarketShare
1 Mizuho Financial Group 73.1 20%
2 Chuo Mitsui Asset Trust and Banking+ The Sumitomo Trust and Banking* 66.7 18%
3 Defined Contribution PlanConsulting of Japan 55.2 15%
4 Nippon Life Insurance 46.3 12%
5 NSAS(Nomura Pension Support & Service) 42.6 11%
2011/3/31, including joint acceptancesSource: R&I "Newsletter on Pensions and Investments, Oct. 3, 2011" Japan Defined Contribution Pension Plans (Number of Participants)* aggregated figure of 2 banks summed up by Mizuho Financial Group
Number of Participants(10 Thousand)
35
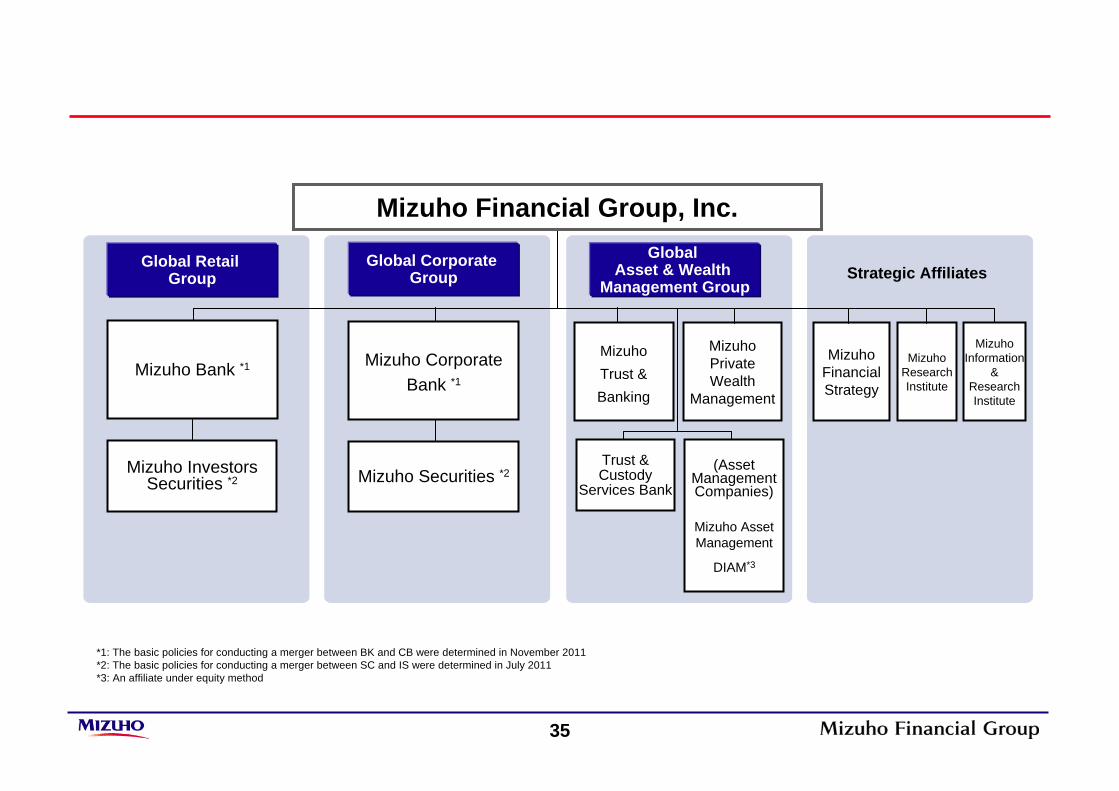
*1: The basic policies for conducting a merger between BK and CB were determined in November 2011*2: The basic policies for conducting a merger between SC and IS were determined in July 2011*3: An affiliate under equity method
Trust & Custody
Services Bank
Mizuho Trust & Banking
Mizuho Private Wealth
Management
Mizuho Financial Strategy
Mizuho Research Institute
Mizuho Information
& Research Institute
Global Corporate Group
Global Retail Group
Mizuho Investors Securities *2
Mizuho Bank *1
(Asset Management Companies)
Global Asset & Wealth
Management GroupStrategic Affiliates
Mizuho Asset Management
DIAM*3
Mizuho Financial Group, Inc.
Mizuho Corporate Bank *1
Mizuho Securities *2
![Level 5 Economics: Theory of the Firm [2] Economic Principles Economic Principles Economic Environment Economic Environment](https://img.pdfslide.net/doc/110x75/5519166655034638428b49a5/level-5-economics-theory-of-the-firm-2-economic-principles-economic-principles-economic-environment-economic-environment.jpg)


![Level 5 Economics: Theory of the Firm [3] Economic Principles Economic Principles Economic Environment Economic Environment Imperfect Competition Imperfect](https://img.pdfslide.net/doc/110x75/56649e755503460f94b76c5f/level-5-economics-theory-of-the-firm-3-economic-principles-economic-principles.jpg)