Embed Size (px)
DESCRIPTION
Recent Improvements Towards Improving the NOAA National Air Quality Forecast Modeling Capability December 21, 2011 NOAA/OAR/ARL and NWS/NCEP/EMC Air Quality Team. Marina Tsidulko - PBL & Chemistry Verification - High Res. Met modeling - PowerPoint PPT Presentation
Citation preview
ARL
1
Recent Improvements Towards Improving the NOAA National Air Quality Forecast
Modeling Capability
April 19, 2023
NOAA/OAR/ARL and NWS/NCEP/EMC
Air Quality Team
ARL
2
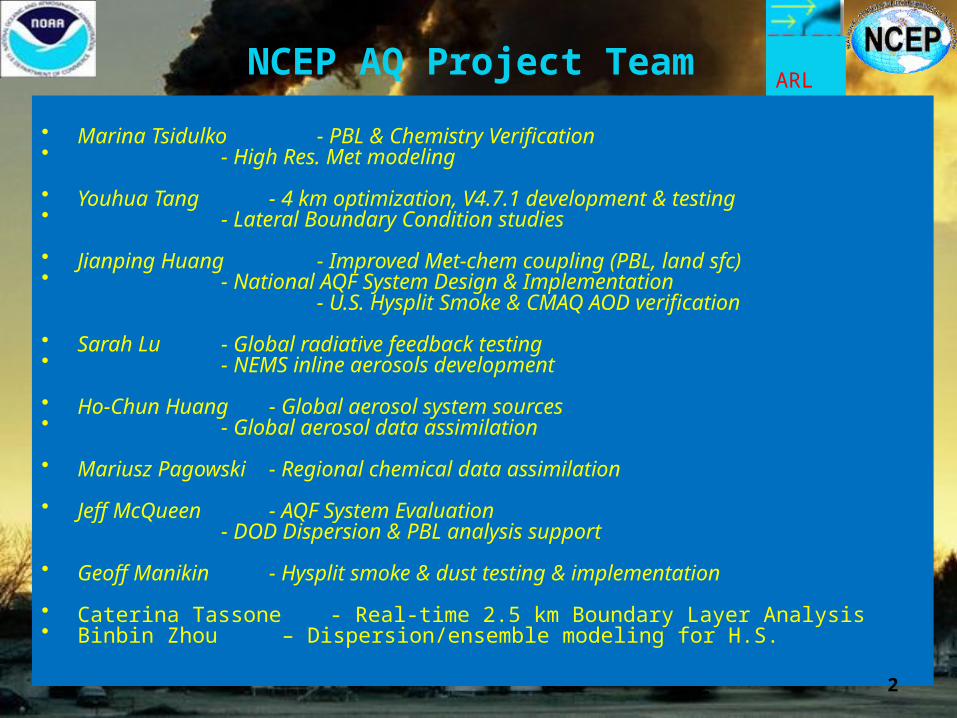
NCEP AQ Project Team
• Marina Tsidulko - PBL & Chemistry Verification• - High Res. Met modeling
• Youhua Tang - 4 km optimization, V4.7.1 development & testing• - Lateral Boundary Condition studies
• Jianping Huang - Improved Met-chem coupling (PBL, land sfc)• - National AQF System Design & Implementation - U.S. Hysplit Smoke & CMAQ AOD verification
• Sarah Lu - Global radiative feedback testing • - NEMS inline aerosols development
• Ho-Chun Huang - Global aerosol system sources• - Global aerosol data assimilation
• Mariusz Pagowski - Regional chemical data assimilation
• Jeff McQueen - AQF System Evaluation- DOD Dispersion & PBL analysis support
• Geoff Manikin - Hysplit smoke & dust testing & implementation
• Caterina Tassone - Real-time 2.5 km Boundary Layer Analysis• Binbin Zhou – Dispersion/ensemble modeling for H.S.
2
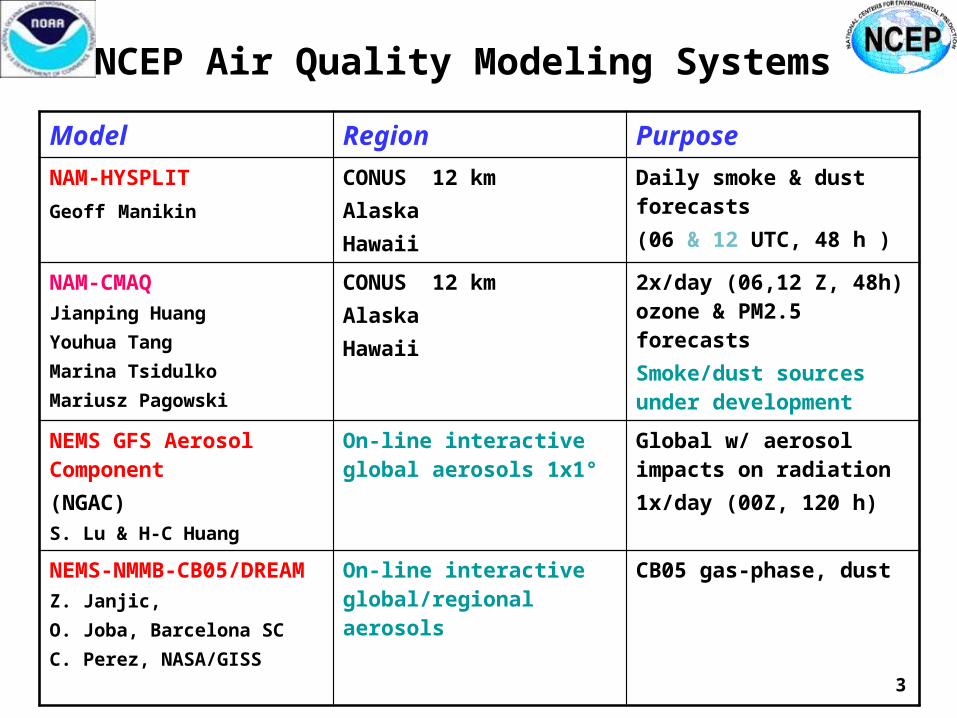
NCEP Air Quality Modeling Systems
Model Region Purpose
NAM-HYSPLIT Geoff Manikin
CONUS 12 kmAlaskaHawaii
Daily smoke & dust forecasts (06 & 12 UTC, 48 h )
NAM-CMAQ Jianping HuangYouhua TangMarina TsidulkoMariusz Pagowski
CONUS 12 kmAlaskaHawaii
2x/day (06,12 Z, 48h) ozone & PM2.5 forecastsSmoke/dust sources under development
NEMS GFS Aerosol Component(NGAC)S. Lu & H-C Huang
On-line interactive global aerosols 1x1°
Global w/ aerosol impacts on radiation 1x/day (00Z, 120 h)
NEMS-NMMB-CB05/DREAMZ. Janjic,O. Joba, Barcelona SC C. Perez, NASA/GISS
On-line interactive global/regional aerosols
CB05 gas-phase, dust
3
4
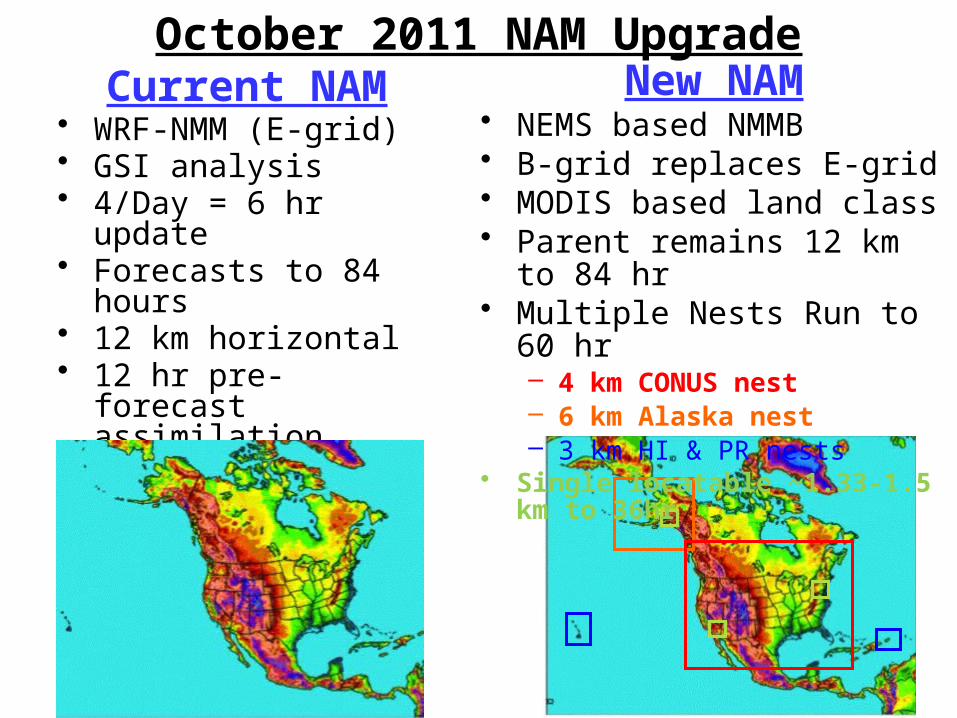
October 2011 NAM UpgradeCurrent NAM
• WRF-NMM (E-grid)• GSI analysis• 4/Day = 6 hr update• Forecasts to 84 hours• 12 km horizontal• 12 hr pre-forecast
assimilation period with 3hr updates (catch-up)
New NAM• NEMS based NMMB• B-grid replaces E-grid• MODIS based land class• Parent remains 12 km to 84 hr• Multiple Nests Run to 60 hr
– 4 km CONUS nest– 6 km Alaska nest– 3 km HI & PR nests
• Single locatable ~1.33-1.5 km to 36hr
142
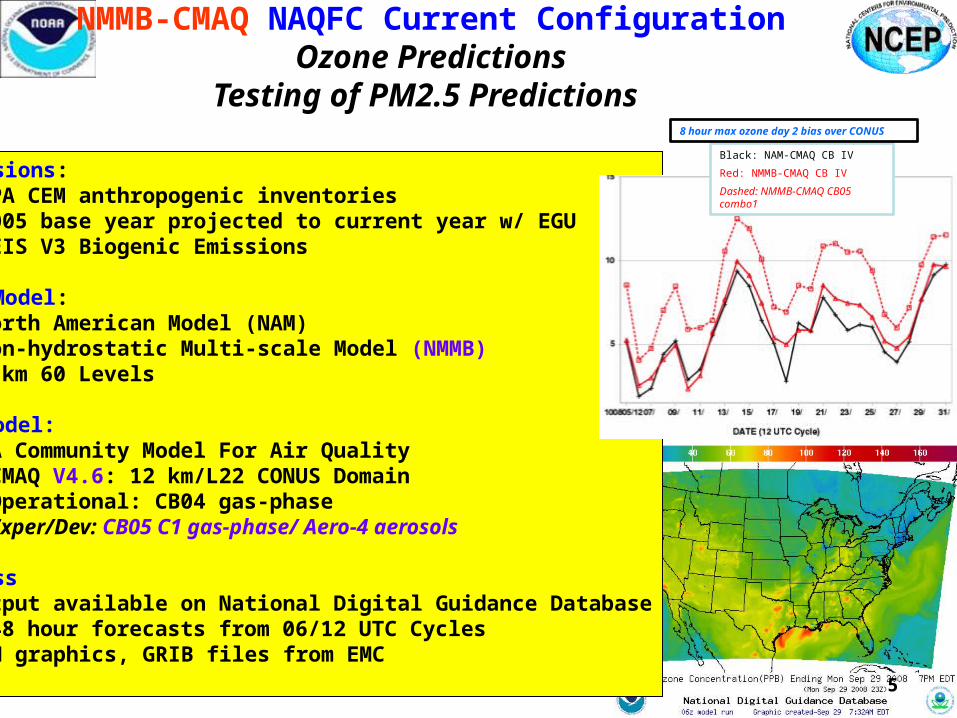
NMMB-CMAQ NAQFC Current ConfigurationOzone Predictions
Testing of PM2.5 Predictions
Emissions:• EPA CEM anthropogenic inventories• 2005 base year projected to current year w/ EGU• BEIS V3 Biogenic Emissions
Met Model: • North American Model (NAM)• Non-hydrostatic Multi-scale Model (NMMB)• 12 km 60 Levels
AQ Model: • EPA Community Model For Air Quality
• CMAQ V4.6: 12 km/L22 CONUS Domain• Operational: CB04 gas-phase• Exper/Dev: CB05 C1 gas-phase/ Aero-4 aerosols
Access • Output available on National Digital Guidance Database
• 48 hour forecasts from 06/12 UTC Cycles• PM graphics, GRIB files from EMC
Black: NAM-CMAQ CB IV
Red: NMMB-CMAQ CB IV
Dashed: NMMB-CMAQ CB05 combo1
8 hour max ozone day 2 bias over CONUS
5
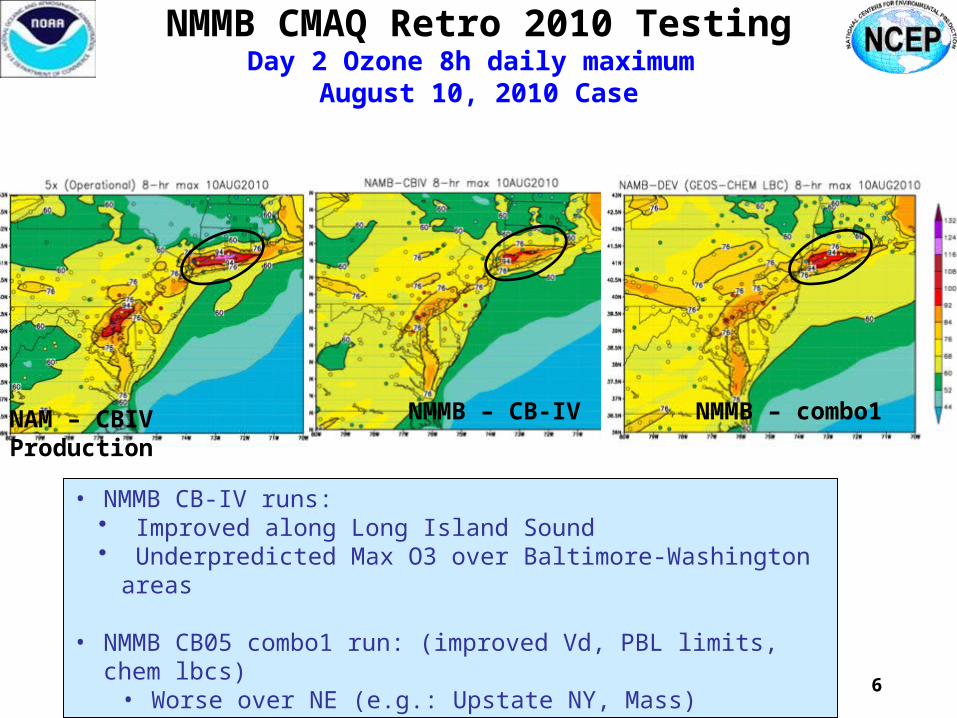
NMMB CMAQ Retro 2010 TestingDay 2 Ozone 8h daily maximum
August 10, 2010 Case
• NMMB CB-IV runs: • Improved along Long Island Sound • Underpredicted Max O3 over Baltimore-Washington areas
• NMMB CB05 combo1 run: (improved Vd, PBL limits, chem lbcs)• Worse over NE (e.g.: Upstate NY, Mass)
NAM – CBIV Production NMMB – CB-IV NMMB – combo1
6
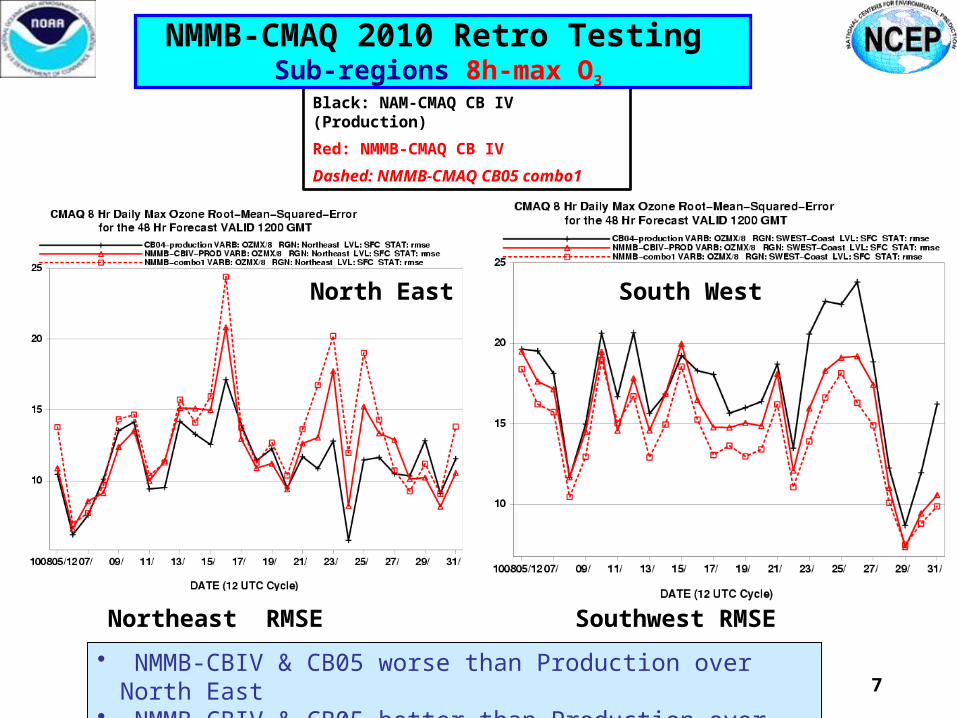
Black: NAM-CMAQ CB IV (Production)
Red: NMMB-CMAQ CB IV
Dashed: NMMB-CMAQ CB05 combo1
NMMB-CMAQ 2010 Retro Testing Sub-regions 8h-max O3
Northeast RMSE Southwest RMSE
• NMMB-CBIV & CB05 worse than Production over North East• NMMB-CBIV & CB05 better than Production over South West 7
North East South West
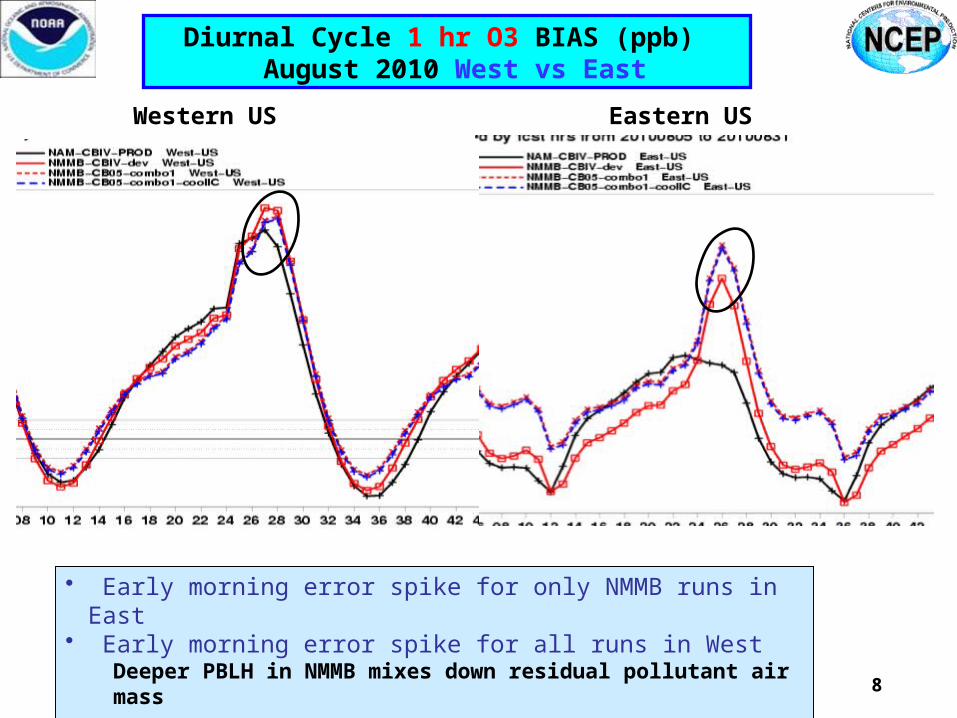
Diurnal Cycle 1 hr O3 BIAS (ppb) August 2010 West vs East
• Early morning error spike for only NMMB runs in East• Early morning error spike for all runs in West
Deeper PBLH in NMMB mixes down residual pollutant air mass
8
Western US Eastern US
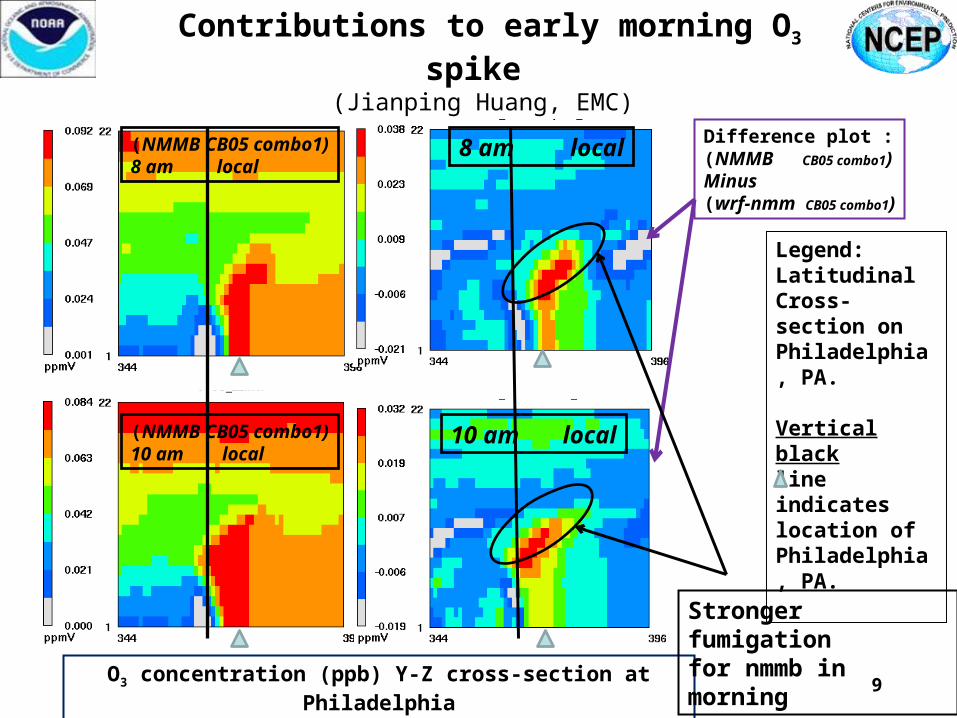
Legend:Latitudinal Cross-section onPhiladelphia, PA.
Vertical blackline indicateslocation of Philadelphia, PA.
O3 concentration (ppb) Y-Z cross-section at Philadelphia traversed W-E 600km on Aug 21, 2010
(NMMB CB05 combo1)8 am local
(NMMB CB05 combo1)10 am local
Difference plot :(NMMB CB05 combo1)Minus(wrf-nmm CB05 combo1)
8 am local
10 am local
Stronger fumigation for nmmb in morning
Contributions to early morning O3 spike (Jianping Huang, EMC)
9
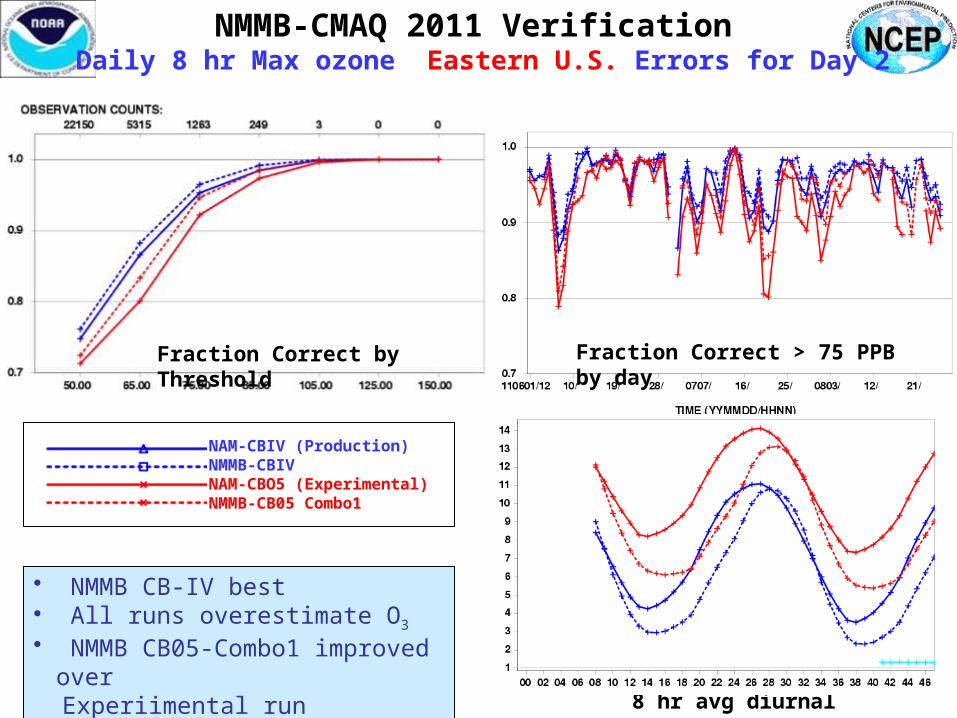
NMMB-CMAQ 2011 Verification Daily 8 hr Max ozone Eastern U.S. Errors for Day 2
• NMMB CB-IV best• All runs overestimate O3
• NMMB CB05-Combo1 improved over
Experiimental run• Largest errors from 7/18 – 7/23/11
Fraction Correct > 75 PPB by dayFraction Correct by Threshold
8 hr avg diurnal error
NAM-CBIV (Production)NMMB-CBIVNAM-CBO5 (Experimental)NMMB-CB05 Combo1
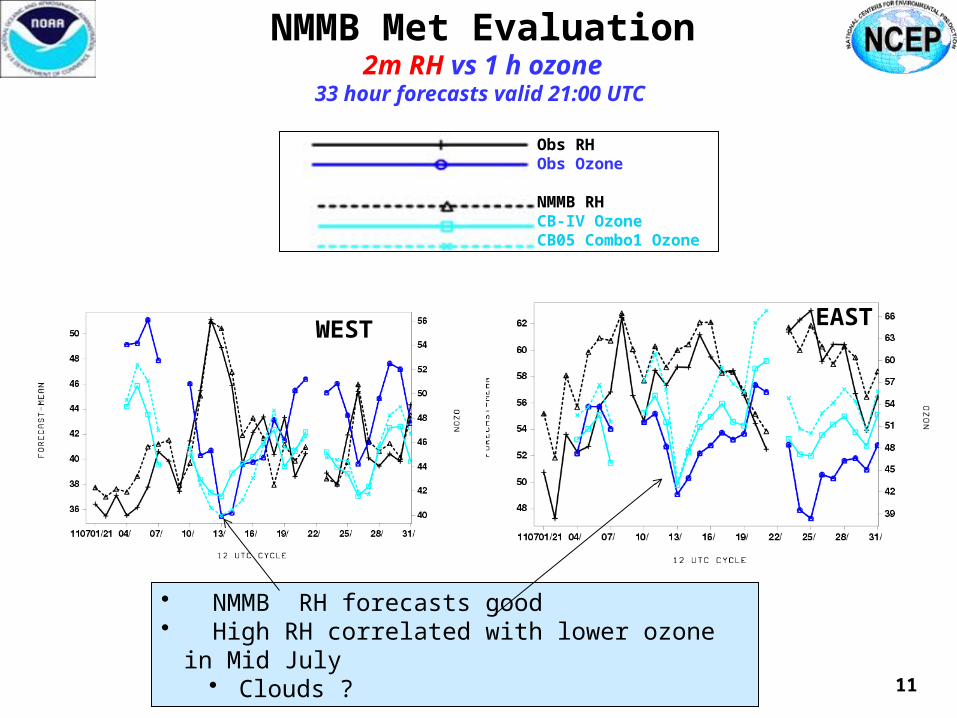
NMMB Met Evaluation2m RH vs 1 h ozone
33 hour forecasts valid 21:00 UTC
• NMMB RH forecasts good• High RH correlated with lower ozone in Mid July
• Clouds ?
EASTWEST
11
Obs RHObs Ozone
NMMB RHCB-IV OzoneCB05 Combo1 Ozone
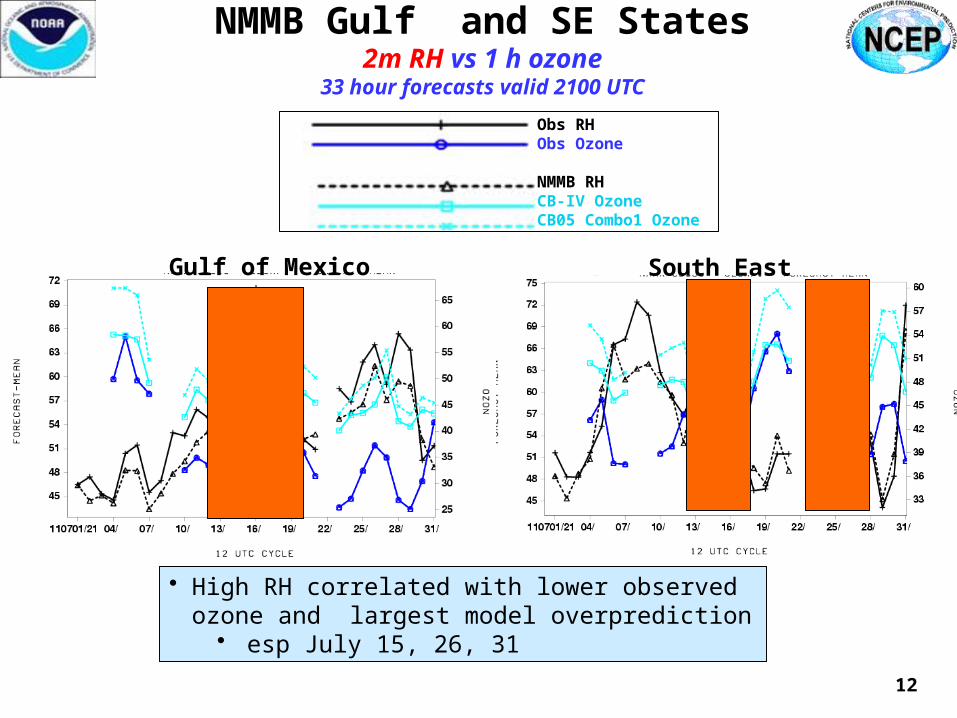
NMMB Gulf and SE States2m RH vs 1 h ozone
33 hour forecasts valid 2100 UTC
• High RH correlated with lower observed ozone and largest model overprediction
• esp July 15, 26, 31
South EastGulf of Mexico
12
Obs RHObs Ozone
NMMB RHCB-IV OzoneCB05 Combo1 Ozone
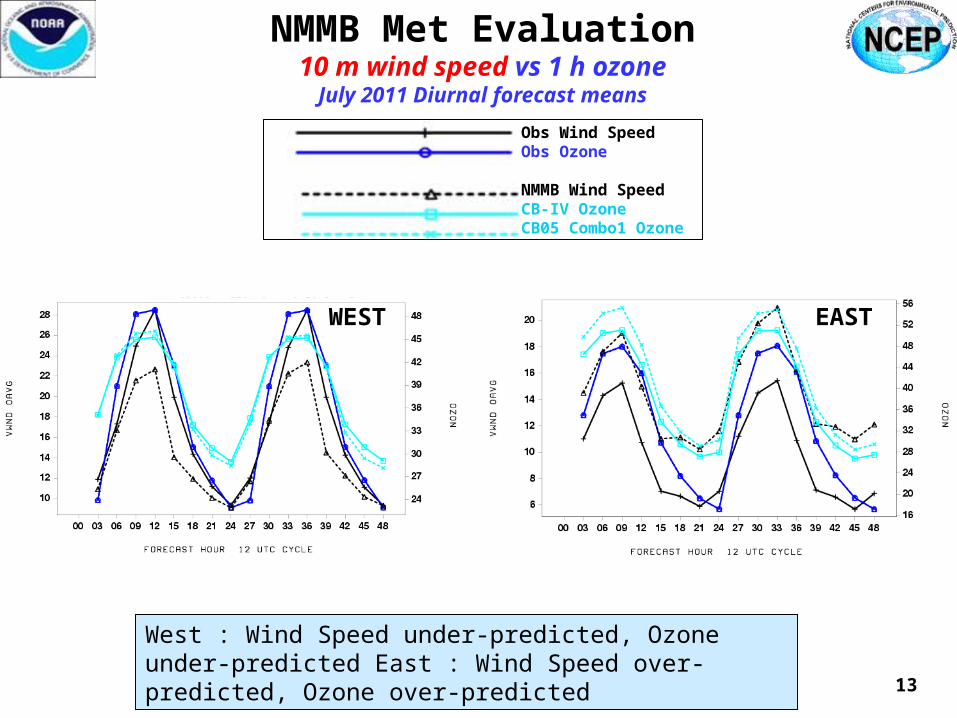
West : Wind Speed under-predicted, Ozone under-predicted East : Wind Speed over-predicted, Ozone over-predicted
EASTWEST
13
Obs Wind SpeedObs Ozone
NMMB Wind SpeedCB-IV OzoneCB05 Combo1 Ozone
NMMB Met Evaluation10 m wind speed vs 1 h ozone
July 2011 Diurnal forecast means
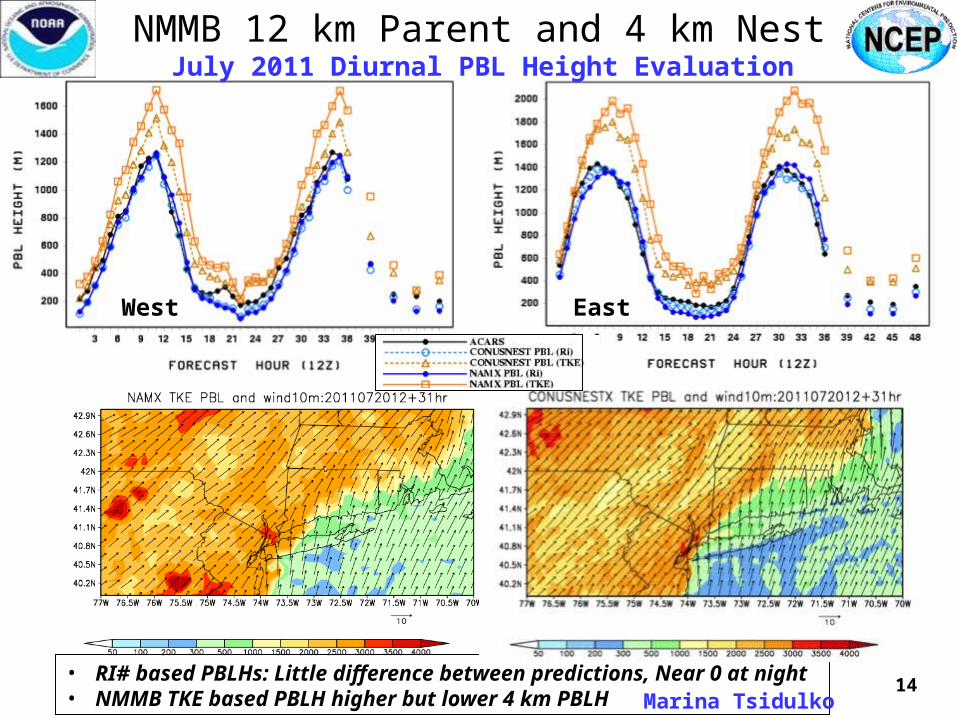
14• RI# based PBLHs: Little difference between predictions, Near 0 at night• NMMB TKE based PBLH higher but lower 4 km PBLH
NMMB 12 km Parent and 4 km Nest July 2011 Diurnal PBL Height Evaluation
West
Marina Tsidulko
East

Evaluation Summary
Met Model Characteristics can have a Large Impact on AQ
NEMS NMMB Behaviors• Improved temperature, Td forecasts• More boundary layer mixing in AM• Improved moisture forecasts in West• East : Moist bias, wind over-prediction• 12 km : Higher daytime PBLH than
NAM & Nest
Met Impacts on AQ• In East, O3 overprediction coincides with
• Over-predicted winds • High RH conditions • Except Gulf region when RHs & Temps are very oppressive
• Liquid Particle conversions ??
Improved metrices – AQME II• FC needed for NAQFC evaluation but is weighted by non-events• Evaluation of Vertical profiles of Meteorology and Air Quality
15
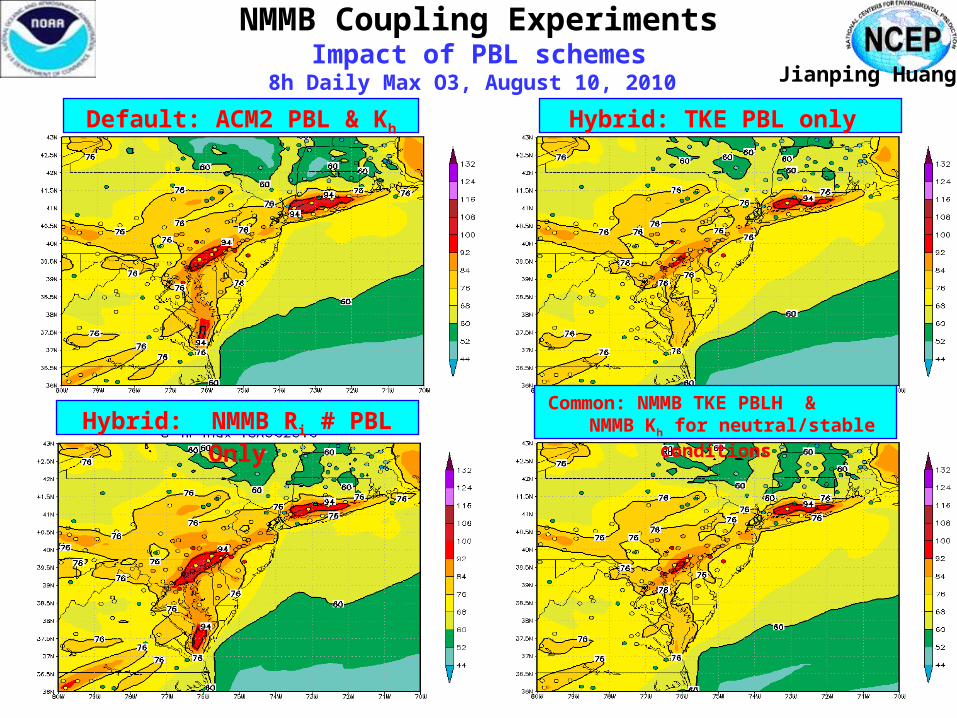
NMMB Coupling ExperimentsImpact of PBL schemes
8h Daily Max O3, August 10, 2010
Default: ACM2 PBL & Kh Hybrid: TKE PBL only
Hybrid: NMMB Ri # PBL OnlyCommon: NMMB TKE PBLH &
NMMB Kh for neutral/stable conditions
Jianping Huang
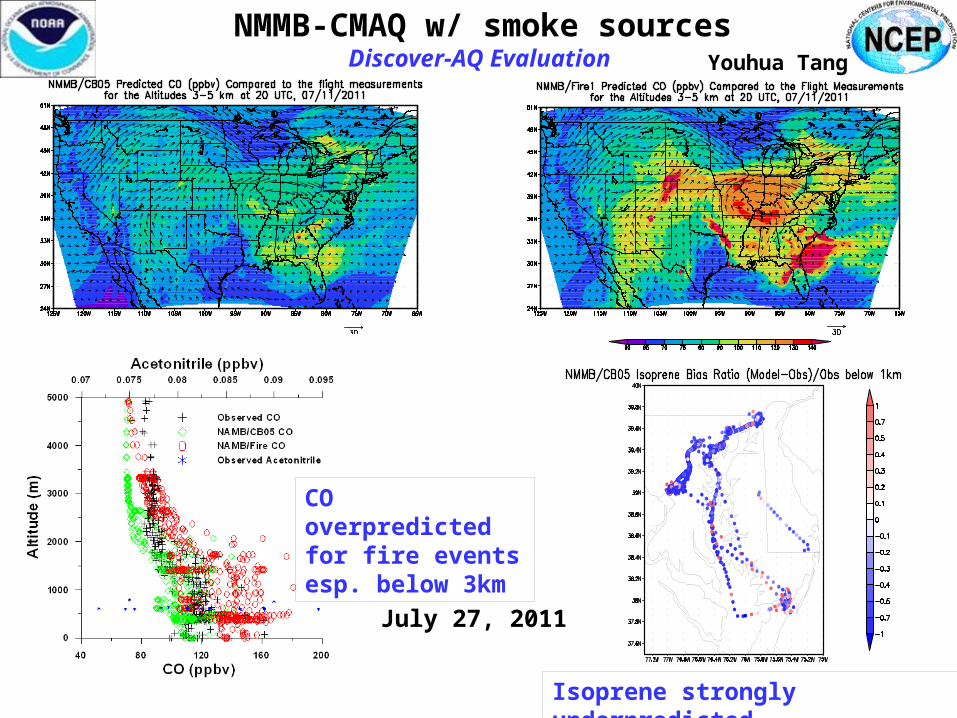
NMMB-CMAQ w/ smoke sourcesDiscover-AQ Evaluation Youhua Tang
CO overpredicted for fire eventsesp. below 3km
Isoprene strongly underpredicted
July 27, 2011

• EMC parallel on NCEP’s CCS (dev)• Executable compiled from NEMS
code repository • 120-hr dust-only forecast once
per day (00Z)• ICs: Aerosols from previous day
forecast and meteorology from
operational GDAS• 3-hourly products: 3d distribution
of dust aerosols (5 bins from
0.1 – 10 µm)• Automatic output archive, post-processing and web update since June 11, 2011
• Same physics and dynamics as operational GFS with the following exceptions:
– Lower resolution (T126 L64)– Use Relaxed Arakawa-Schubert scheme [Moorthi and Suarez, 1999] with
convective transport and tracer scavenging – Turn off aerosol-radiation feedback
Experimental
NRT NGAC configurationSarah Lu
18

Aerosol Lateral Boundary Conditions: 2010 Trans-Atlantic dust transport
Left panel: Dust influx at CMAQ boundaries from NGAC simulations
Right panel: Baseline CMAQ simulation with static LBCs versus experimental CMAQ simulations with dynamic LBCs from NGAC and off-line GFS-GOCART
Youhua Tang, Sarah Lu and Ho-Chun Huang
Verification with AIRNOW surface PM observations shows significant improvements using dynamic LBCs from GFS-GOCART
19

2012 Plans• Improve NMMB – CMAQ O3/PM performance
• Implement V4.7.1 tight vertical coupling by Late March, 2012• Improve Biogenic emissions
• Hybrid PBL Tests, Winter-time PBL behavior• Couple deposition velocity computations w/ NOAH LSM• Retrospective runs vs Discover-AQ period (Isoprene, CO biases)
• Improve Inclusion of smoke, dust sources into CMAQ V4.7.1• Plume rise calibrations, smoke plume vertical mixing• Inclusion of dust• NGAC LBCs
• Ground/satellite data for evaluation & assimilation
• Improve AIRNOW DA in GSI• Add MODIS AOD DA • CALIPSO aerosol backscatter• OMI/TES ozone profiles
• 4 km NAQFC model development• Updated emission sources from ARL/EPA• Integrate IBM optimized code & begin R-T testing• Evaluation of NMMB CONUS nest Met and CMAQ
• Improvements along coasts, in complex terrain ?• More consistent physics, more frequent met updates or avgd met.
20