Embed Size (px)
Citation preview
GUIDELINES AND STANDARDS
Recommendations for Quantification Methods Duringthe Performance of a Pediatric Echocardiogram: AReport From the Pediatric Measurements Writing
Group of the American Society of EchocardiographyPediatric and Congenital Heart Disease Council
Leo Lopez, MD, FASE, Chair, Steven D. Colan, MD, FASE, Peter C. Frommelt, MD, FASE,Gregory J. Ensing, MD, FASE, Kathleen Kendall, RDCS, FASE, Adel K. Younoszai, MD, FASE,
Wyman W. Lai, MD, MPH, FASE, and Tal Geva, MD, FASE, Bronx and New York, New York; Boston,Massachusetts; Milwaukee, Wisconsin; Ann Arbor, Michigan; Houston, Texas; Denver, Colorado
(J Am Soc Echocardiogr 2010;23:465-95.)
Keywords: Pediatric quantification, Measurements, Z scores, Normative database
Accreditation Statement:
The American Society of Echocardiography is accredited by the Accreditation Council
for Continuing Medical Education to provide continuing medical education for physi-
cians.
The American Society of Echocardiography designates this educational activity for
a maximum of 1.5 AMA PRA Category 1 Credits�. Physicians should only claim credit
commensurate with the extent of their participation in the activity.
ARDMS and CCI recognize the ASE’s certificates and have agreed to honor the credit
hours toward their registry requirements for sonographers.
The American Society of Echocardiography is committed to ensuring that its educa-
tional mission and all sponsored educational programs are not influenced by the special
interests of any corporation or individual, and its mandate is to retain only those authors
whose financial interests can be effectively resolved to maintain the goals and educa-
tional integrity of the activity. Although a monetary or professional affiliation with a cor-
poration does not necessarily influence an author’s presentation, the Essential Areas and
policies of the ACCME require that any relationships that could possibly conflict with
the educational value of the activity be resolved prior to publication and disclosed to
the audience. Disclosures of faculty and commercial support relationships, if any,
have been indicated.
Target Audience:
This activity is designed for all cardiovascular physicians and cardiac sonographers with
a primary interest and knowledge base in the field of echocardiography; in addition, res-
idents, researchers, clinicians, intensivists, and other medical professionals with a spe-
cific interest in cardiac ultrasound will find this activity beneficial.
Objectives:
Upon completing the reading of this article, participants will better be able to:
1. Review the techniques for optimizing imaging and quantifying cardiac structures in
the pediatric population.
2. Explain the importance of adjusting measurements of cardiovascular structures for
the effects of body size.
3. Identify the pediatric quantification protocols for the pulmonary veins, systemic
veins, atria and atrioventricular valves.
4. Recognize and apply the recommended echocardiographic methods for the evalua-
tion of left and right ventricular size and systolic function.
5. Define the optimal views and the appropriate anatomic sites for correct measurement
of the proximal ascending, proximal and distal arch, and descending aorta.
6. Employ appropriate transducer position and Doppler technique for the anatomic and
hemodynamic interrogation of the aorta and aortic valve and the pulmonary artery
and the pulmonary valve.
Author Disclosure:
The authors of this article reported no actual or potential conflicts of interest in relation
to this activity.
The ASE staff and ASE ACCME/CME reviewers who were involved in the planning and
development of this activity reported no actual or potential conflicts of interest: Chelsea
Flowers; Rebecca T. Hahn, MD, FASE; Cathy Kerr; Priscilla P. Peters, BA, RDCS, FASE;
Rhonda Price; and Cheryl Williams.
The following members of the ASE Guidelines and Standards Committee, JASE Editorial
staff and ASE Board of Directors reported no actual or potential conflicts of interest in re-
lation to this activity: Deborah A. Agler, RCT, RDCS, FASE; J. Todd Belcik, BS, RDCS, FASE;
Renee L. Bess, BS, RDCS, RVT, FASE; Farooq A. Chaudhry, MD, FASE; Robert T. Eberhardt,
MD; Benjamin W. Eidem, MD, FASE; Gregory J. Ensing, MD, FASE; Tal Geva, MD, FASE;
Kathryn E. Glas, MD, FASE; Sandra Hagen-Ansert, RDCS, RDMS, MS, FASE; Rebecca T.
Hahn, MD, FASE; Jeannie Heirs, RDCS; Shunichi Homma, MD; Sanjiv Kaul, MD, FASE;
Smadar Kort, MD, FASE; Peg Knoll, RDCS, FASE; Wyman Lai, MD, MPH, FASE; Roberto
M. Lang, MD, FASE; Steven Lavine, MD; Steven J. Lester, MD, FASE; Renee Margossian,
MD; Victor Mor-Avi, PhD, FASE; Sherif Nagueh, MD, FASE; Alan S. Pearlman, MD,
FASE; Patricia A. Pellikka, MD, FASE; Miguel Quinones, MD, FASE; Brad Roberts, RCS,
RDCS; Beverly Smulevitz, BS, RDCS, RVS; Kirk T. Spencer, MD, FASE; J. Geoffrey
Stevenson, MD, FASE; Wadea Tarhuni, MD, FASE; James D. Thomas, MD; Neil J.
Weissman, MD, FASE; Timothy Woods, MD; and William A. Zoghbi, MD, FASE.
The following members of the ASE Guidelines and Standards Committee, JASE Editorial
staff and ASE Board of Directors reported a relationship with one or more commercial
interests. According to ACCME policy, the ASE implemented mechanisms to resolve
all conflicts of interest prior to the planning and implementation of this activity.
Theodore Abraham, MD, FASE receives honoraria and research grant support from GE
Healthcare. Patrick D. Coon, RDCS, FASE is on the speaker’s bureau for Philips
Medical. Victor G. Davila-Roman, MD, FASE is a consultant for St. Jude Medical, AGA
Medical, Medtronic, CoreValve, Boston Scientific Corporation, and Sadra Medical.
Elyse Foster, MD receives grant support from Abbott Vascular Structural Heart, EBR
Systems, Inc., and Boston Scientific Corporation. Julius M. Gardin, MD, FASE is a consul-
tant/advisor to Arena Pharmaceuticals. Jeffrey C. Hill, BS, RDCS, FASE receives grant/re-
search support from Toshiba America Medical Systems and Philips; is a consultant to
Medtronic; and is on the speaker’s bureau for Philips. Martin G. Keane, MD, FASE is
a consultant/advisor to Pfizer, Inc. and Otsuka Pharmaceuticals. Gilead I. Lancaster,
MD, FASE owns stock in, and is a consultant/advisor to, Cardiogal. Jonathan R.
Linder, MD, FASE is a consultant/advisor to VisualSonics. Carol C. Mitchell, PhD,
RDMS, RDCS, RVT, RT(R), FASE is a speaker and consultant for GE Healthcare. Marti
McCulloch, MBA, BS, RDCS, FASE is a speaker for Lantheus and advisor/consultant for
From the Children’s Hospital at Montefiore, Bronx, New York (L.L.); Children’s
Hospital Boston/Harvard Medical School, Boston, Massachusetts (S.D.C., T.G.);
Medical College of Wisconsin, Milwaukee, Wisconsin (P.C.F.); the University of
Michigan, Ann Arbor, Michigan (G.J.E.); Texas Children’s Hospital, Houston,
Texas (K.K.); Children’s Hospital/University of Colorado, Denver, Colorado
(A.K.Y.); and Stanley Morgan Children’s Hospital of New York Presbyterian,
New York, New York (W.W.L.).
Reprint requests: American Society of Echocardiography, 2100 Gateway Centre
Boulevard, Suite 310, Morrisville, NC 27560 (Email: [email protected]).
0894-7317/$36.00
Copyright 2010 by the American Society of Echocardiography.
doi:10.1016/j.echo.2010.03.019
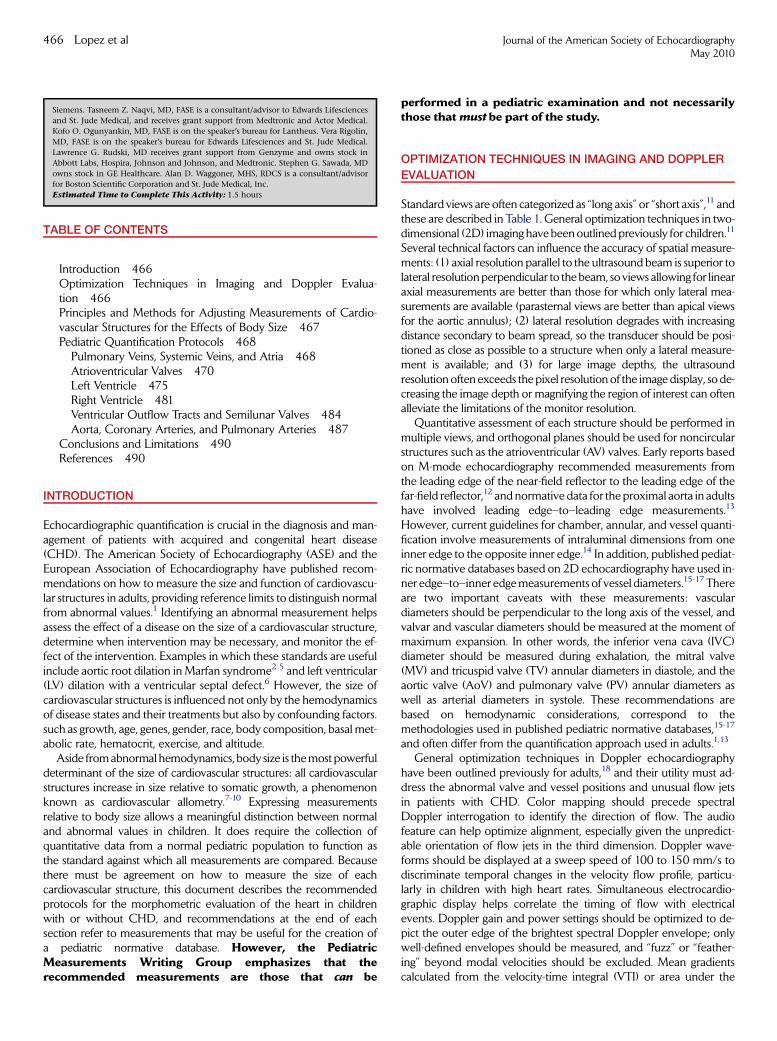
TABLE OF CONTENTS
Introduction 466Optimization Techniques in Imaging and Doppler Evalua-tion 466Principles and Methods for Adjusting Measurements of Cardio-vascular Structures for the Effects of Body Size 467Pediatric Quantification Protocols 468
Pulmonary Veins, Systemic Veins, and Atria 468Atrioventricular Valves 470Left Ventricle 475Right Ventricle 481Ventricular Outflow Tracts and Semilunar Valves 484Aorta, Coronary Arteries, and Pulmonary Arteries 487
Conclusions and Limitations 490References 490
INTRODUCTION
Echocardiographic quantification is crucial in the diagnosis and man-agement of patients with acquired and congenital heart disease(CHD). The American Society of Echocardiography (ASE) and theEuropean Association of Echocardiography have published recom-mendations on how to measure the size and function of cardiovascu-lar structures in adults, providing reference limits to distinguish normalfrom abnormal values.1 Identifying an abnormal measurement helpsassess the effect of a disease on the size of a cardiovascular structure,determine when intervention may be necessary, and monitor the ef-fect of the intervention. Examples in which these standards are usefulinclude aortic root dilation in Marfan syndrome2-5 and left ventricular(LV) dilation with a ventricular septal defect.6 However, the size ofcardiovascular structures is influenced not only by the hemodynamicsof disease states and their treatments but also by confounding factors.such as growth, age, genes, gender, race, body composition, basal met-abolic rate, hematocrit, exercise, and altitude.
Aside from abnormal hemodynamics, body size is the most powerfuldeterminant of the size of cardiovascular structures: all cardiovascularstructures increase in size relative to somatic growth, a phenomenonknown as cardiovascular allometry.7-10 Expressing measurementsrelative to body size allows a meaningful distinction between normaland abnormal values in children. It does require the collection ofquantitative data from a normal pediatric population to function asthe standard against which all measurements are compared. Becausethere must be agreement on how to measure the size of eachcardiovascular structure, this document describes the recommendedprotocols for the morphometric evaluation of the heart in childrenwith or without CHD, and recommendations at the end of eachsection refer to measurements that may be useful for the creation ofa pediatric normative database. However, the PediatricMeasurements Writing Group emphasizes that therecommended measurements are those that can be
performed in a pediatric examination and not necessarilythose that must be part of the study.
OPTIMIZATION TECHNIQUES IN IMAGING AND DOPPLER
EVALUATION
Standard views are often categorized as ‘‘long axis’’ or ‘‘short axis’’,11 andthese are described in Table 1. General optimization techniques in two-dimensional (2D) imaging have been outlined previously for children.11
Several technical factors can influence the accuracy of spatial measure-ments: (1) axial resolution parallel to the ultrasound beam is superior tolateral resolutionperpendicular to the beam, so views allowing for linearaxial measurements are better than those for which only lateral mea-surements are available (parasternal views are better than apical viewsfor the aortic annulus); (2) lateral resolution degrades with increasingdistance secondary to beam spread, so the transducer should be posi-tioned as close as possible to a structure when only a lateral measure-ment is available; and (3) for large image depths, the ultrasoundresolution often exceeds the pixel resolution of the image display, so de-creasing the image depth or magnifying the region of interest can oftenalleviate the limitations of the monitor resolution.
Quantitative assessment of each structure should be performed inmultiple views, and orthogonal planes should be used for noncircularstructures such as the atrioventricular (AV) valves. Early reports basedon M-mode echocardiography recommended measurements fromthe leading edge of the near-field reflector to the leading edge of thefar-field reflector,12 and normative data for the proximal aorta in adultshave involved leading edge–to–leading edge measurements.13
However, current guidelines for chamber, annular, and vessel quanti-fication involve measurements of intraluminal dimensions from oneinner edge to the opposite inner edge.14 In addition, published pediat-ric normative databases based on 2D echocardiography have used in-ner edge–to–inner edge measurements of vessel diameters.15-17 Thereare two important caveats with these measurements: vasculardiameters should be perpendicular to the long axis of the vessel, andvalvar and vascular diameters should be measured at the moment ofmaximum expansion. In other words, the inferior vena cava (IVC)diameter should be measured during exhalation, the mitral valve(MV) and tricuspid valve (TV) annular diameters in diastole, and theaortic valve (AoV) and pulmonary valve (PV) annular diameters aswell as arterial diameters in systole. These recommendations arebased on hemodynamic considerations, correspond to themethodologies used in published pediatric normative databases,15-17
and often differ from the quantification approach used in adults.1,13
General optimization techniques in Doppler echocardiographyhave been outlined previously for adults,18 and their utility must ad-dress the abnormal valve and vessel positions and unusual flow jetsin patients with CHD. Color mapping should precede spectralDoppler interrogation to identify the direction of flow. The audiofeature can help optimize alignment, especially given the unpredict-able orientation of flow jets in the third dimension. Doppler wave-forms should be displayed at a sweep speed of 100 to 150 mm/s todiscriminate temporal changes in the velocity flow profile, particu-larly in children with high heart rates. Simultaneous electrocardio-graphic display helps correlate the timing of flow with electricalevents. Doppler gain and power settings should be optimized to de-pict the outer edge of the brightest spectral Doppler envelope; onlywell-defined envelopes should be measured, and ‘‘fuzz’’ or ‘‘feather-ing’’ beyond modal velocities should be excluded. Mean gradientscalculated from the velocity-time integral (VTI) or area under the
Siemens. Tasneem Z. Naqvi, MD, FASE is a consultant/advisor to Edwards Lifesciences
and St. Jude Medical, and receives grant support from Medtronic and Actor Medical.
Kofo O. Ogunyankin, MD, FASE is on the speaker’s bureau for Lantheus. Vera Rigolin,
MD, FASE is on the speaker’s bureau for Edwards Lifesciences and St. Jude Medical.
Lawrence G. Rudski, MD receives grant support from Genzyme and owns stock in
Abbott Labs, Hospira, Johnson and Johnson, and Medtronic. Stephen G. Sawada, MD
owns stock in GE Healthcare. Alan D. Waggoner, MHS, RDCS is a consultant/advisor
for Boston Scientific Corporation and St. Jude Medical, Inc.
Estimated Time to Complete This Activity: 1.5 hours
466 Lopez et al Journal of the American Society of EchocardiographyMay 2010
velocity curve should be measured from valve opening to closure atthe AV and semilunar valves and throughout the cardiac cyclewithin a blood vessel or at an interatrial communication, incorporat-ing the zero velocity during periods of absent flow. All Dopplermeasurements should be averaged over 3 consecutive cardiac cy-cles to account for respiratory variation.
PRINCIPLES AND METHODS FOR ADJUSTING
MEASUREMENTS OF CARDIOVASCULAR STRUCTURES
FOR THE EFFECTS OF BODY SIZE
The first step in adjusting for body size involves developing a mathe-matical description of the mean behavior of the measurement withina normal pediatric population. Ideally, this is based on physiologicprinciples. Body surface area (BSA) appears to be a better parameterof somatic growth in normal children than height or weight alone.15,19
Published equations to calculate BSA often produce variable results,particularly at lower height and weight values,20-23 and some arederived from data that do not include children.20 The Haycock for-mula21 (BSA [m2] = 0.024265 � weight [kg]0.5378 � height[cm ]0.3964) appears to provide the best correlation between BSAand the size of cardiovascular structures (compared with the formulasof DuBois and DuBois,20 Dreyer and Ray,22 and Boyd23) and is rec-ommended for calculating BSA.15 Because of the linear relationshipbetween cardiac output and BSA24 and the mostly linear relationshipbetween cardiac output and the size of cardiovascular structures,15
‘‘indexing’’ the size of structures to BSA has become a fairly commonpractice.25-28 However, assuming that BSA is linearly related tolength, area, and volume measurements is mathematicallyimpossible. In addition, BSA-adjusted measurements often manifesta persistent dependence on BSA: the mean value of the BSA-adjusted measurement and the distribution of values around themean change with increasing BSA (a phenomenon of changing ornonconstant variance known as heteroscedasticity).10,29
Once the mathematical relationship between a measurement andBSA has been determined, the next step involves the confidence inter-vals and the problem of heteroscedasticity. One approach to finda mathematical descriptor that maintains a stable and constant varianceacross the range of body sizes might involve transformation of the mea-surements and/or BSA within a linear or nonlinear regression equa-tion.15,17,19 For example, physiologic principles suggest that distancescan be adjusted or normalized to the square root of BSA, areas toBSA, and volumes to BSA1.5.30 This approach results in a mostly linearrelationship between the measurement and the transformed BSA,15 butit does not eliminate the problem of heteroscedasticity; variance con-tinues to be affected by changes in body size. Another example involvesperforming a logarithmic transformation of the measurements to mini-mize the problem of heteroscedasticity.17 However, this method doesnot effectively describe the population at minimum and maximumBSA values, nor does it fully eliminate heteroscedasticity. There is alsono fundamental physiologic explanation for this approach.
An increasingly popular approach in pediatric cardiology to accountfor the effects of body size andage has been the use ofZ scores.15-17,31-36
Calculation of Z scores involves assessment of the distribution ofmeasurement values (by determining the confidence intervals) acrossa range of body sizes in the normal population. The Z score ofa measurement is the number of standard deviations of that valuefrom the mean value at a particular BSA. In other words, a Z score ofzero corresponds to a measurement equal to the population meanfor that particular BSA. A Z score of +2 or �2 corresponds to
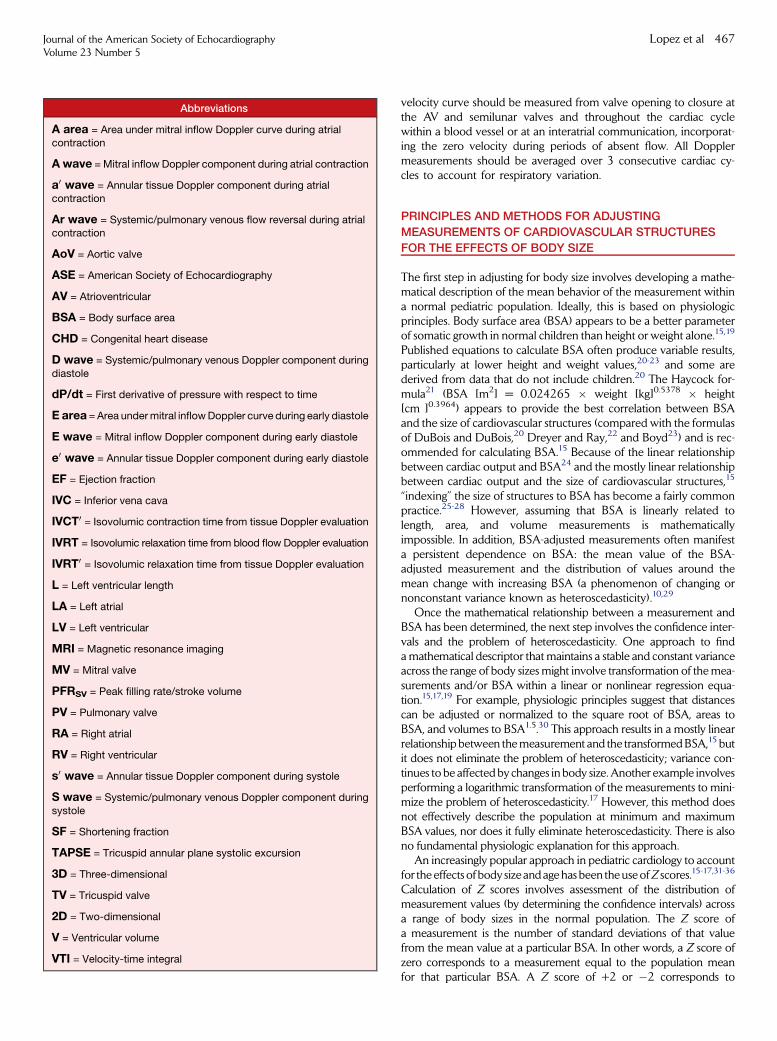
Abbreviations
A area = Area under mitral inflow Doppler curve during atrialcontraction
A wave = Mitral inflow Doppler component during atrial contraction
a0 wave = Annular tissue Doppler component during atrialcontraction
Ar wave = Systemic/pulmonary venous flow reversal during atrialcontraction
AoV = Aortic valve
ASE = American Society of Echocardiography
AV = Atrioventricular
BSA = Body surface area
CHD = Congenital heart disease
D wave = Systemic/pulmonary venous Doppler component during
diastole
dP/dt = First derivative of pressure with respect to time
E area = Area under mitral inflow Doppler curve during early diastole
E wave = Mitral inflow Doppler component during early diastole
e0 wave = Annular tissue Doppler component during early diastole
EF = Ejection fraction
IVC = Inferior vena cava
IVCT0 = Isovolumic contraction time from tissue Doppler evaluation
IVRT = Isovolumic relaxation time from blood flow Doppler evaluation
IVRT0 = Isovolumic relaxation time from tissue Doppler evaluation
L = Left ventricular length
LA = Left atrial
LV = Left ventricular
MRI = Magnetic resonance imaging
MV = Mitral valve
PFRSV = Peak filling rate/stroke volume
PV = Pulmonary valve
RA = Right atrial
RV = Right ventricular
s0 wave = Annular tissue Doppler component during systole
S wave = Systemic/pulmonary venous Doppler component during
systole
SF = Shortening fraction
TAPSE = Tricuspid annular plane systolic excursion
3D = Three-dimensional
TV = Tricuspid valve
2D = Two-dimensional
V = Ventricular volume
VTI = Velocity-time integral
Journal of the American Society of EchocardiographyVolume 23 Number 5
Lopez et al 467
a measurement that is 2 standard deviations above or below the meanfor that particular BSA, thresholds that usually represent the upper orlower limits of normal. Z scores can be converted to percentiles,though the magnitude of an abnormality is much easier to appreciatewith Z scores than with percentiles (for example, a Z score of +4corresponds to the 99.8th percentile, and Z score of +10 correspondsto the 99.9th percentile). The major advantage of using Z scores hasbeen the absence of any reliance on a predetermined relationshipbetween the size of a structure and BSA. In addition, there is noassumption that a constant variance exists across the range of bodysizes within the pediatric population. However, the utility of somepublished Z-score approaches has been limited by the fact thata ‘‘normal’’ population is frequently identified as those individualswith normal results on echocardiography, a truly self-referential defini-tion. Second, the approach does not always account for such con-founders as gender and race. Last, the methodologies for performingmeasurements and calculating BSA are often inconsistent across the en-tire population being evaluated.
Recommendations: When normative data are available,the measurements of cardiovascular structures should beexpressed as Z scores using the Haycock formula21 to calcu-late BSA.
PEDIATRIC QUANTIFICATION PROTOCOLS
Pulmonary Veins, Systemic Veins, and Atria
Morphometric Evaluation. The pulmonary veins are usually bestevaluated in a high left parasternal or suprasternal short-axis view(‘‘crab’’ view) displaying drainage of the right and left pulmonaryveins into the left atrium. Dual display without and with low-scalecolor mapping helps identify the individual pulmonary veins, andthe diameter of each pulmonary vein before it connects to the leftatrium can be measured from the 2D image. The left atrial (LA) ap-pendage should not be mistakenly identified as the left upper pulmo-nary vein, and the right middle pulmonary vein should not be
mistakenly identified as the right upper pulmonary vein (subxiphoidshort-axis or right parasternal views are usually better at displayingthe right upper pulmonary vein). The superior vena cava is not rou-tinely measured in clinical practice, and normative data have notbeen established. IVC size can be measured above its junctionwith the hepatic veins just below the diaphragm in subxiphoidshort-axis views (displaying the IVC long axis), and this may helpassess hydration status.37,38 The IVC diameter varies withrespiration, and the collapsibility index (the percentage decrease inIVC diameter with inspiration) appears to correlate with right atrial(RA) pressures in adults.1,39,40 Neither the IVC diameter nor thecollapsibility index, however, appears to correlate with age or BSAin adult patients,39 and the utility of the collapsibility index in chil-dren has not been evaluated.
LA size can be assessed by M-mode and 2D measurements of thedistance from the posterior aortic wall to the posterior LA wall,41
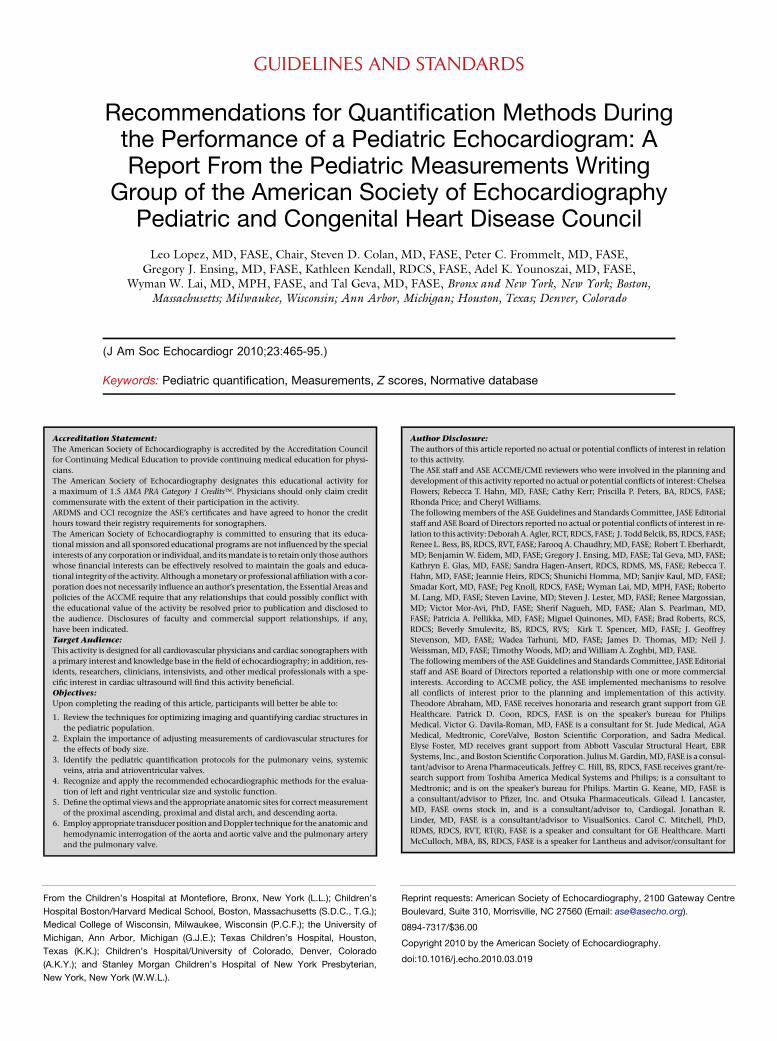
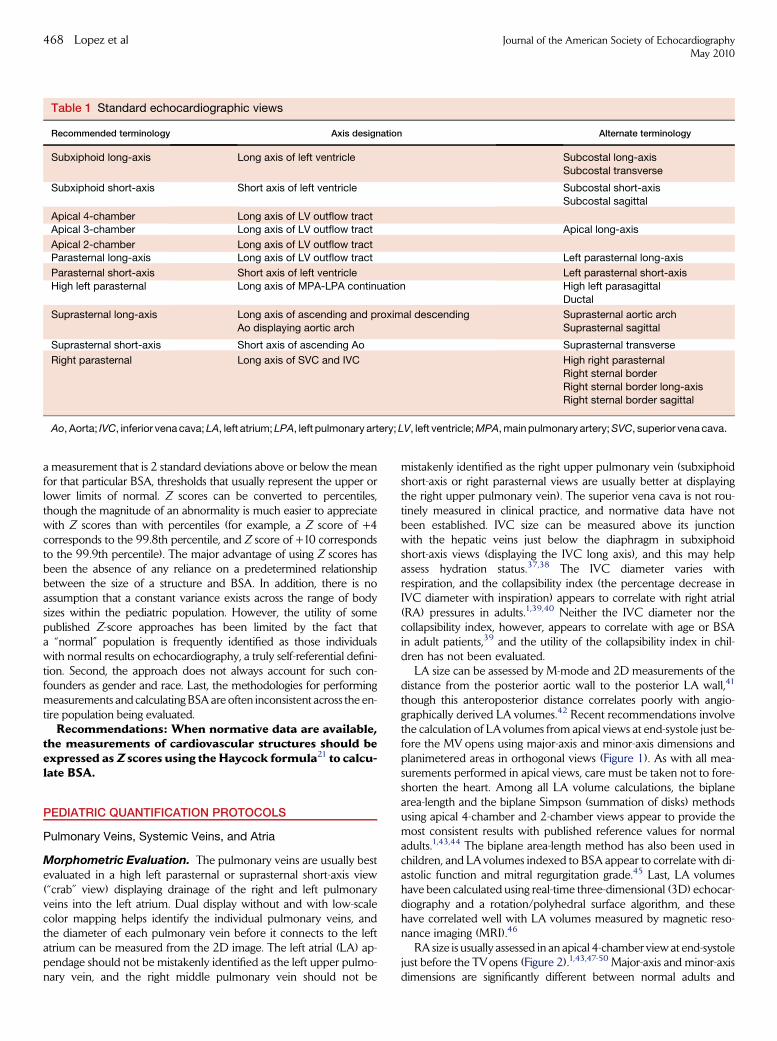
though this anteroposterior distance correlates poorly with angio-graphically derived LA volumes.42 Recent recommendations involvethe calculation of LA volumes from apical views at end-systole just be-fore the MV opens using major-axis and minor-axis dimensions andplanimetered areas in orthogonal views (Figure 1). As with all mea-surements performed in apical views, care must be taken not to fore-shorten the heart. Among all LA volume calculations, the biplanearea-length and the biplane Simpson (summation of disks) methodsusing apical 4-chamber and 2-chamber views appear to provide themost consistent results with published reference values for normaladults.1,43,44 The biplane area-length method has also been used inchildren, and LA volumes indexed to BSA appear to correlate with di-astolic function and mitral regurgitation grade.45 Last, LA volumeshave been calculated using real-time three-dimensional (3D) echocar-diography and a rotation/polyhedral surface algorithm, and thesehave correlated well with LA volumes measured by magnetic reso-nance imaging (MRI).46
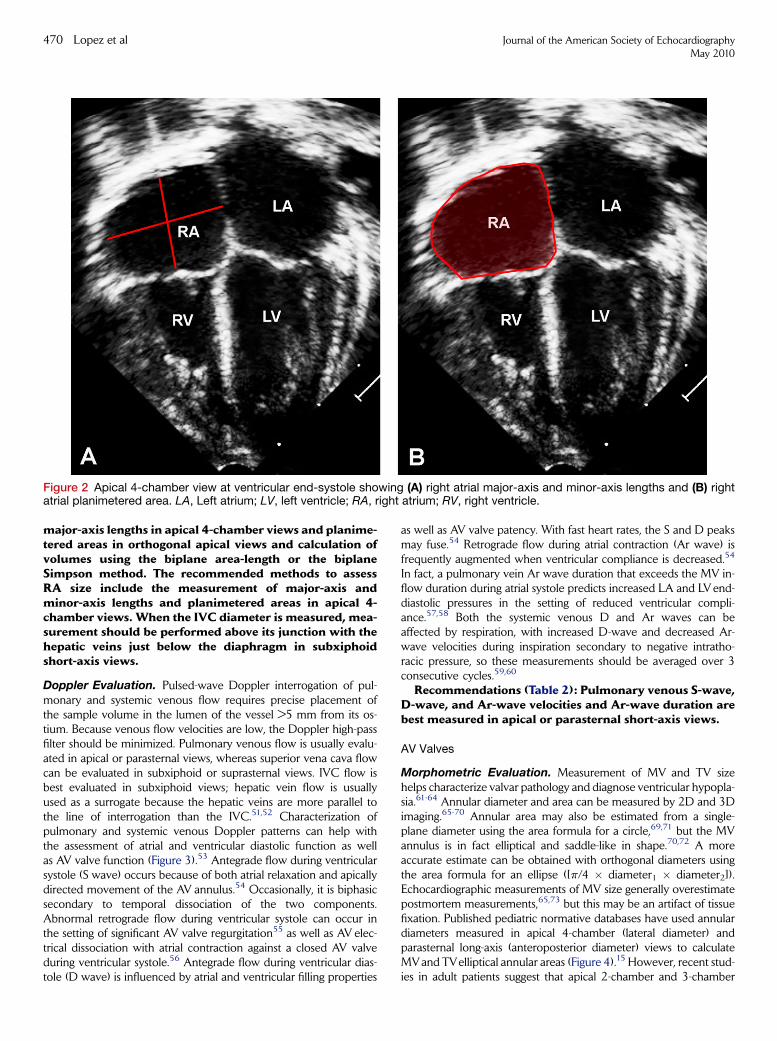
RA size is usually assessed in an apical 4-chamber view at end-systolejust before the TVopens (Figure 2).1,43,47-50 Major-axis and minor-axisdimensions are significantly different between normal adults and
Table 1 Standard echocardiographic views
Recommended terminology Axis designation Alternate terminology
Subxiphoid long-axis Long axis of left ventricle Subcostal long-axis
Subcostal transverse
Subxiphoid short-axis Short axis of left ventricle Subcostal short-axis
Subcostal sagittal
Apical 4-chamber Long axis of LV outflow tractApical 3-chamber Long axis of LV outflow tract Apical long-axis
Apical 2-chamber Long axis of LV outflow tractParasternal long-axis Long axis of LV outflow tract Left parasternal long-axis
Parasternal short-axis Short axis of left ventricle Left parasternal short-axis
High left parasternal Long axis of MPA-LPA continuation High left parasagittal
Ductal
Suprasternal long-axis Long axis of ascending and proximal descending
Ao displaying aortic arch
Suprasternal aortic arch
Suprasternal sagittal
Suprasternal short-axis Short axis of ascending Ao Suprasternal transverse
Right parasternal Long axis of SVC and IVC High right parasternal
Right sternal border
Right sternal border long-axis
Right sternal border sagittal
Ao, Aorta; IVC, inferior vena cava; LA, left atrium; LPA, left pulmonary artery; LV, left ventricle; MPA, main pulmonary artery; SVC, superior vena cava.
468 Lopez et al Journal of the American Society of EchocardiographyMay 2010
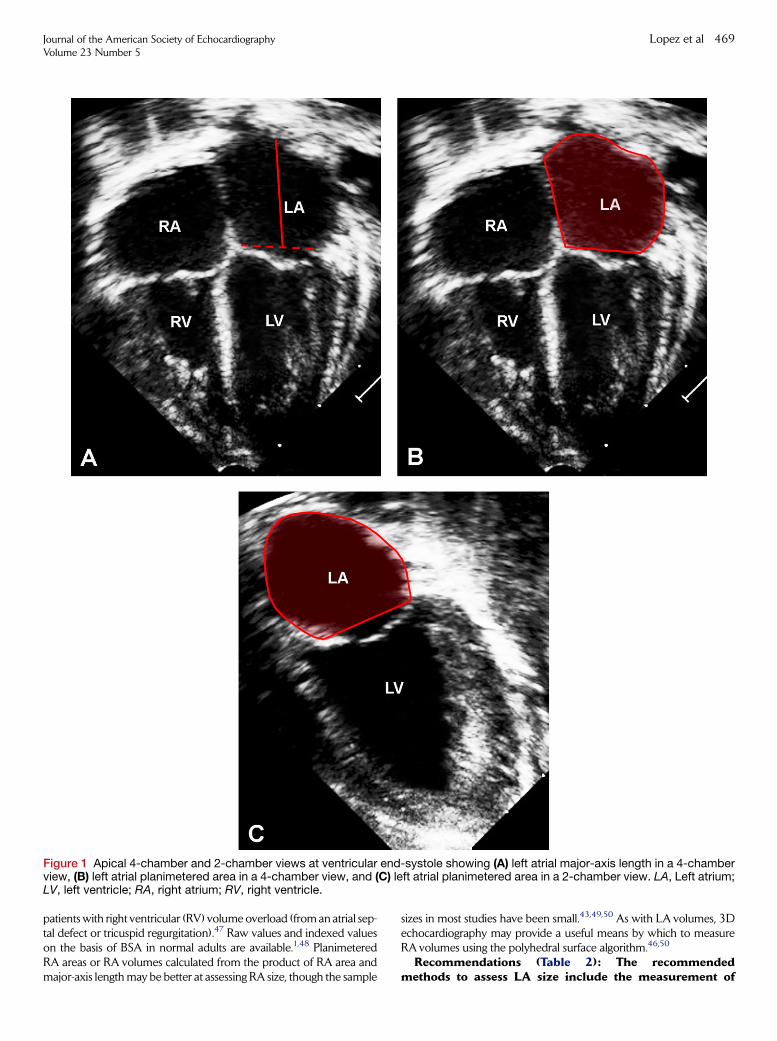
patients with right ventricular (RV) volume overload (from an atrial sep-tal defect or tricuspid regurgitation).47 Raw values and indexed valueson the basis of BSA in normal adults are available.1,48 PlanimeteredRA areas or RA volumes calculated from the product of RA area andmajor-axis length may be better at assessing RA size, though the sample
sizes in most studies have been small.43,49,50 As with LA volumes, 3Dechocardiography may provide a useful means by which to measureRA volumes using the polyhedral surface algorithm.46,50
Recommendations (Table 2): The recommendedmethods to assess LA size include the measurement of
Figure 1 Apical 4-chamber and 2-chamber views at ventricular end-systole showing (A) left atrial major-axis length in a 4-chamberview, (B) left atrial planimetered area in a 4-chamber view, and (C) left atrial planimetered area in a 2-chamber view. LA, Left atrium;LV, left ventricle; RA, right atrium; RV, right ventricle.
Journal of the American Society of EchocardiographyVolume 23 Number 5
Lopez et al 469
major-axis lengths in apical 4-chamber views and planime-tered areas in orthogonal apical views and calculation ofvolumes using the biplane area-length or the biplaneSimpson method. The recommended methods to assessRA size include the measurement of major-axis andminor-axis lengths and planimetered areas in apical 4-chamber views. When the IVC diameter is measured, mea-surement should be performed above its junction with thehepatic veins just below the diaphragm in subxiphoidshort-axis views.
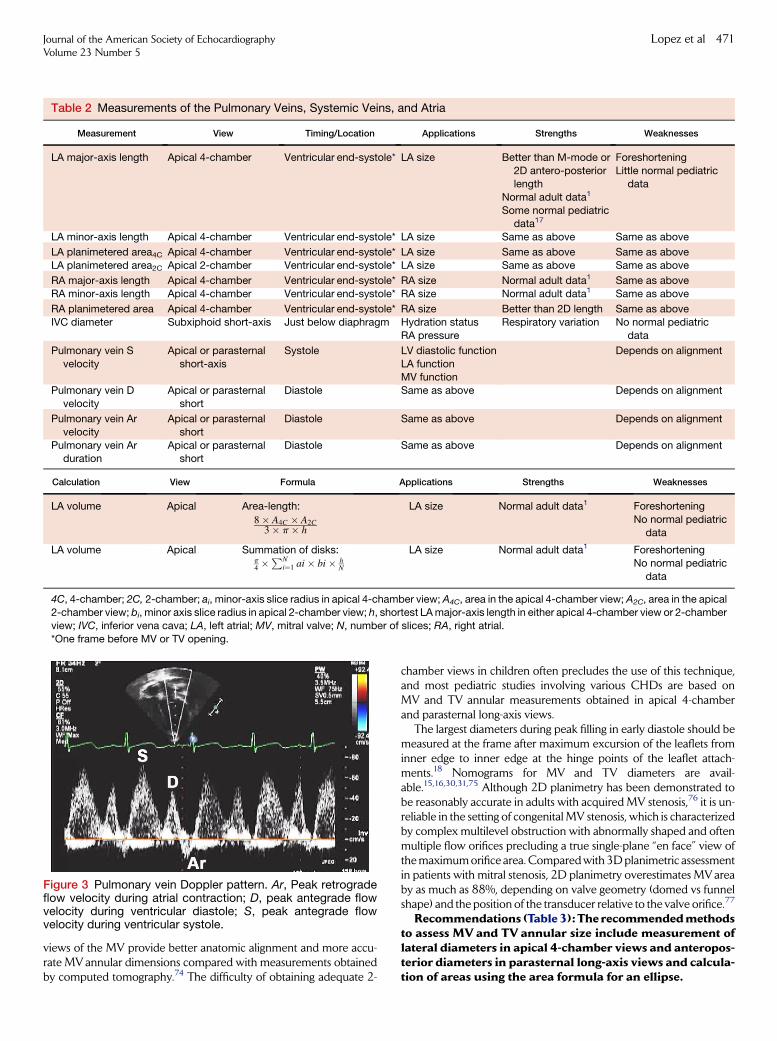
Doppler Evaluation. Pulsed-wave Doppler interrogation of pul-monary and systemic venous flow requires precise placement ofthe sample volume in the lumen of the vessel >5 mm from its os-tium. Because venous flow velocities are low, the Doppler high-passfilter should be minimized. Pulmonary venous flow is usually evalu-ated in apical or parasternal views, whereas superior vena cava flowcan be evaluated in subxiphoid or suprasternal views. IVC flow isbest evaluated in subxiphoid views; hepatic vein flow is usuallyused as a surrogate because the hepatic veins are more parallel tothe line of interrogation than the IVC.51,52 Characterization ofpulmonary and systemic venous Doppler patterns can help withthe assessment of atrial and ventricular diastolic function as wellas AV valve function (Figure 3).53 Antegrade flow during ventricularsystole (S wave) occurs because of both atrial relaxation and apicallydirected movement of the AV annulus.54 Occasionally, it is biphasicsecondary to temporal dissociation of the two components.Abnormal retrograde flow during ventricular systole can occur inthe setting of significant AV valve regurgitation55 as well as AV elec-trical dissociation with atrial contraction against a closed AV valveduring ventricular systole.56 Antegrade flow during ventricular dias-tole (D wave) is influenced by atrial and ventricular filling properties
as well as AV valve patency. With fast heart rates, the S and D peaksmay fuse.54 Retrograde flow during atrial contraction (Ar wave) isfrequently augmented when ventricular compliance is decreased.54
In fact, a pulmonary vein Ar wave duration that exceeds the MV in-flow duration during atrial systole predicts increased LA and LVend-diastolic pressures in the setting of reduced ventricular compli-ance.57,58 Both the systemic venous D and Ar waves can beaffected by respiration, with increased D-wave and decreased Ar-wave velocities during inspiration secondary to negative intratho-racic pressure, so these measurements should be averaged over 3consecutive cycles.59,60
Recommendations (Table 2): Pulmonary venous S-wave,D-wave, and Ar-wave velocities and Ar-wave duration arebest measured in apical or parasternal short-axis views.
AV Valves
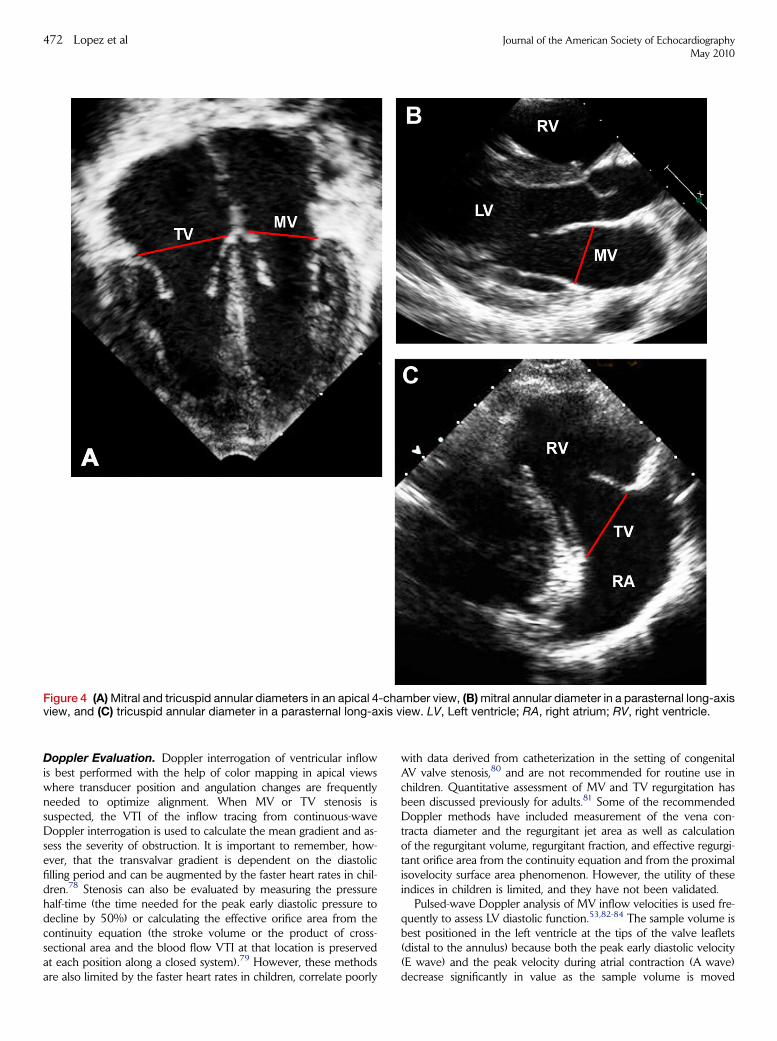
Morphometric Evaluation. Measurement of MV and TV sizehelps characterize valvar pathology and diagnose ventricular hypopla-sia.61-64 Annular diameter and area can be measured by 2D and 3Dimaging.65-70 Annular area may also be estimated from a single-plane diameter using the area formula for a circle,69,71 but the MVannulus is in fact elliptical and saddle-like in shape.70,72 A moreaccurate estimate can be obtained with orthogonal diameters usingthe area formula for an ellipse ([p/4 � diameter1 � diameter2]).Echocardiographic measurements of MV size generally overestimatepostmortem measurements,65,73 but this may be an artifact of tissuefixation. Published pediatric normative databases have used annulardiameters measured in apical 4-chamber (lateral diameter) andparasternal long-axis (anteroposterior diameter) views to calculateMVand TVelliptical annular areas (Figure 4).15 However, recent stud-ies in adult patients suggest that apical 2-chamber and 3-chamber
Figure 2 Apical 4-chamber view at ventricular end-systole showing (A) right atrial major-axis and minor-axis lengths and (B) rightatrial planimetered area. LA, Left atrium; LV, left ventricle; RA, right atrium; RV, right ventricle.
470 Lopez et al Journal of the American Society of EchocardiographyMay 2010
views of the MV provide better anatomic alignment and more accu-rate MV annular dimensions compared with measurements obtainedby computed tomography.74 The difficulty of obtaining adequate 2-
chamber views in children often precludes the use of this technique,and most pediatric studies involving various CHDs are based onMV and TV annular measurements obtained in apical 4-chamberand parasternal long-axis views.
The largest diameters during peak filling in early diastole should bemeasured at the frame after maximum excursion of the leaflets frominner edge to inner edge at the hinge points of the leaflet attach-ments.18 Nomograms for MV and TV diameters are avail-able.15,16,30,31,75 Although 2D planimetry has been demonstrated tobe reasonably accurate in adults with acquired MV stenosis,76 it is un-reliable in the setting of congenital MV stenosis, which is characterizedby complex multilevel obstruction with abnormally shaped and oftenmultiple flow orifices precluding a true single-plane ‘‘en face’’ view ofthe maximum orifice area. Compared with 3D planimetric assessmentin patients with mitral stenosis, 2D planimetry overestimates MVareaby as much as 88%, depending on valve geometry (domed vs funnelshape) and the position of the transducer relative to the valve orifice.77
Recommendations (Table 3): The recommended methodsto assess MV and TV annular size include measurement oflateral diameters in apical 4-chamber views and anteropos-terior diameters in parasternal long-axis views and calcula-tion of areas using the area formula for an ellipse.
Table 2 Measurements of the Pulmonary Veins, Systemic Veins, and Atria
Measurement View Timing/Location Applications Strengths Weaknesses
LA major-axis length Apical 4-chamber Ventricular end-systole* LA size Better than M-mode or
2D antero-posteriorlength
Normal adult data1
Some normal pediatricdata17
Foreshortening
Little normal pediatricdata
LA minor-axis length Apical 4-chamber Ventricular end-systole* LA size Same as above Same as above
LA planimetered area4C Apical 4-chamber Ventricular end-systole* LA size Same as above Same as above
LA planimetered area2C Apical 2-chamber Ventricular end-systole* LA size Same as above Same as above
RA major-axis length Apical 4-chamber Ventricular end-systole* RA size Normal adult data1 Same as above
RA minor-axis length Apical 4-chamber Ventricular end-systole* RA size Normal adult data1 Same as above
RA planimetered area Apical 4-chamber Ventricular end-systole* RA size Better than 2D length Same as above
IVC diameter Subxiphoid short-axis Just below diaphragm Hydration status
RA pressure
Respiratory variation No normal pediatric
data
Pulmonary vein S
velocity
Apical or parasternal
short-axis
Systole LV diastolic function
LA functionMV function
Depends on alignment
Pulmonary vein D
velocity
Apical or parasternal
short
Diastole Same as above Depends on alignment
Pulmonary vein Ar
velocity
Apical or parasternal
short
Diastole Same as above Depends on alignment
Pulmonary vein Arduration
Apical or parasternalshort
Diastole Same as above Depends on alignment
Calculation View Formula Applications Strengths Weaknesses
LA volume Apical Area-length:
8� A4C � A2C3� p� h
LA size Normal adult data1 Foreshortening
No normal pediatric
data
LA volume Apical Summation of disks:p4 �
PNi¼1 ai� bi� h
N
LA size Normal adult data1 Foreshortening
No normal pediatricdata
4C, 4-chamber; 2C, 2-chamber; ai, minor-axis slice radius in apical 4-chamber view; A4C, area in the apical 4-chamber view; A2C, area in the apical2-chamber view; bi, minor axis slice radius in apical 2-chamber view; h, shortest LA major-axis length in either apical 4-chamber view or 2-chamber
view; IVC, inferior vena cava; LA, left atrial; MV, mitral valve; N, number of slices; RA, right atrial.
*One frame before MV or TV opening.
Figure 3 Pulmonary vein Doppler pattern. Ar, Peak retrogradeflow velocity during atrial contraction; D, peak antegrade flowvelocity during ventricular diastole; S, peak antegrade flowvelocity during ventricular systole.
Journal of the American Society of EchocardiographyVolume 23 Number 5
Lopez et al 471
Doppler Evaluation. Doppler interrogation of ventricular inflowis best performed with the help of color mapping in apical viewswhere transducer position and angulation changes are frequentlyneeded to optimize alignment. When MV or TV stenosis issuspected, the VTI of the inflow tracing from continuous-waveDoppler interrogation is used to calculate the mean gradient and as-sess the severity of obstruction. It is important to remember, how-ever, that the transvalvar gradient is dependent on the diastolicfilling period and can be augmented by the faster heart rates in chil-dren.78 Stenosis can also be evaluated by measuring the pressurehalf-time (the time needed for the peak early diastolic pressure todecline by 50%) or calculating the effective orifice area from thecontinuity equation (the stroke volume or the product of cross-sectional area and the blood flow VTI at that location is preservedat each position along a closed system).79 However, these methodsare also limited by the faster heart rates in children, correlate poorly
with data derived from catheterization in the setting of congenitalAV valve stenosis,80 and are not recommended for routine use inchildren. Quantitative assessment of MV and TV regurgitation hasbeen discussed previously for adults.81 Some of the recommendedDoppler methods have included measurement of the vena con-tracta diameter and the regurgitant jet area as well as calculationof the regurgitant volume, regurgitant fraction, and effective regurgi-tant orifice area from the continuity equation and from the proximalisovelocity surface area phenomenon. However, the utility of theseindices in children is limited, and they have not been validated.
Pulsed-wave Doppler analysis of MV inflow velocities is used fre-quently to assess LV diastolic function.53,82-84 The sample volume isbest positioned in the left ventricle at the tips of the valve leaflets(distal to the annulus) because both the peak early diastolic velocity(E wave) and the peak velocity during atrial contraction (A wave)decrease significantly in value as the sample volume is moved
Figure 4 (A) Mitral and tricuspid annular diameters in an apical 4-chamber view, (B) mitral annular diameter in a parasternal long-axisview, and (C) tricuspid annular diameter in a parasternal long-axis view. LV, Left ventricle; RA, right atrium; RV, right ventricle.
472 Lopez et al Journal of the American Society of EchocardiographyMay 2010
toward the atrium (Figure 5A).85 The isovolumic relaxation time(IVRT), representing the time from AoV closure to MV opening,can be measured from the aortic component of the second heartsound using a phonocardiogram to the onset of diastolic flow in theMV Doppler tracing or by using simultaneous continuous-waveDoppler interrogation of LV inflow and outflow in an apical 3-cham-ber view (Figure 5B). The deceleration time from the peak E-wave ve-
locity to its return to baseline in mid-diastole is another parameter ofdiastolic function that is sensitive to ventricular relaxation and compli-ance as well as atrial pressure (Figure 5C). However, deceleration timeand other diastolic indices based on the E and A waves are limited bytheir dependence on loading conditions, and their utility in children isoften precluded by fusion of the E and A waves resulting from rapidheart rates.
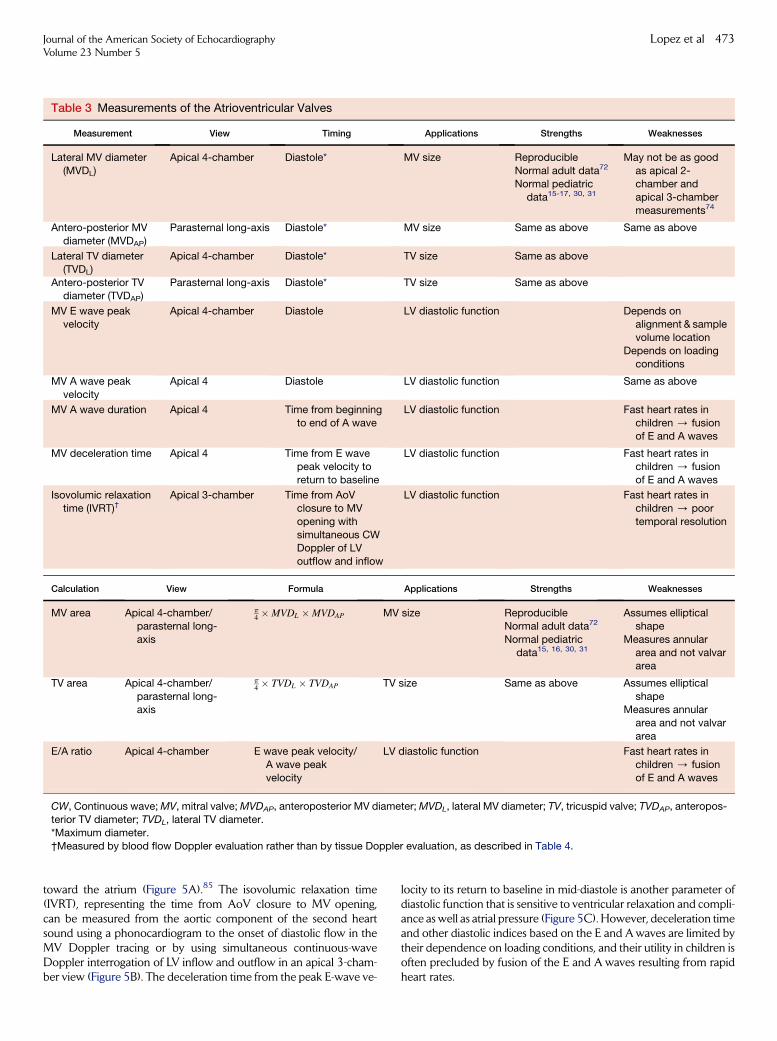
Table 3 Measurements of the Atrioventricular Valves
Measurement View Timing Applications Strengths Weaknesses
Lateral MV diameter
(MVDL)
Apical 4-chamber Diastole* MV size Reproducible
Normal adult data72
Normal pediatric
data15-17, 30, 31
May not be as good
as apical 2-chamber and
apical 3-chamber
measurements74
Antero-posterior MV
diameter (MVDAP)
Parasternal long-axis Diastole* MV size Same as above Same as above
Lateral TV diameter
(TVDL)
Apical 4-chamber Diastole* TV size Same as above
Antero-posterior TVdiameter (TVDAP)
Parasternal long-axis Diastole* TV size Same as above
MV E wave peakvelocity
Apical 4-chamber Diastole LV diastolic function Depends onalignment & sample
volume location
Depends on loadingconditions
MV A wave peak
velocity
Apical 4 Diastole LV diastolic function Same as above
MV A wave duration Apical 4 Time from beginning
to end of A wave
LV diastolic function Fast heart rates in
children / fusionof E and A waves
MV deceleration time Apical 4 Time from E wavepeak velocity to
return to baseline
LV diastolic function Fast heart rates inchildren / fusion
of E and A waves
Isovolumic relaxation
time (IVRT)†Apical 3-chamber Time from AoV
closure to MV
opening with
simultaneous CWDoppler of LV
outflow and inflow
LV diastolic function Fast heart rates in
children / poor
temporal resolution
Calculation View Formula Applications Strengths Weaknesses
MV area Apical 4-chamber/parasternal long-
axis
p4 �MVDL �MVDAP MV size Reproducible
Normal adult data72
Normal pediatric
data15, 16, 30, 31
Assumes ellipticalshape
Measures annular
area and not valvararea
TV area Apical 4-chamber/
parasternal long-axis
p4 � TVDL � TVDAP TV size Same as above Assumes elliptical
shapeMeasures annular
area and not valvar
area
E/A ratio Apical 4-chamber E wave peak velocity/
A wave peak
velocity
LV diastolic function Fast heart rates in
children / fusion
of E and A waves
CW, Continuous wave; MV, mitral valve; MVDAP, anteroposterior MV diameter; MVDL, lateral MV diameter; TV, tricuspid valve; TVDAP, anteropos-
terior TV diameter; TVDL, lateral TV diameter.
*Maximum diameter.
†Measured by blood flow Doppler evaluation rather than by tissue Doppler evaluation, as described in Table 4.
Journal of the American Society of EchocardiographyVolume 23 Number 5
Lopez et al 473
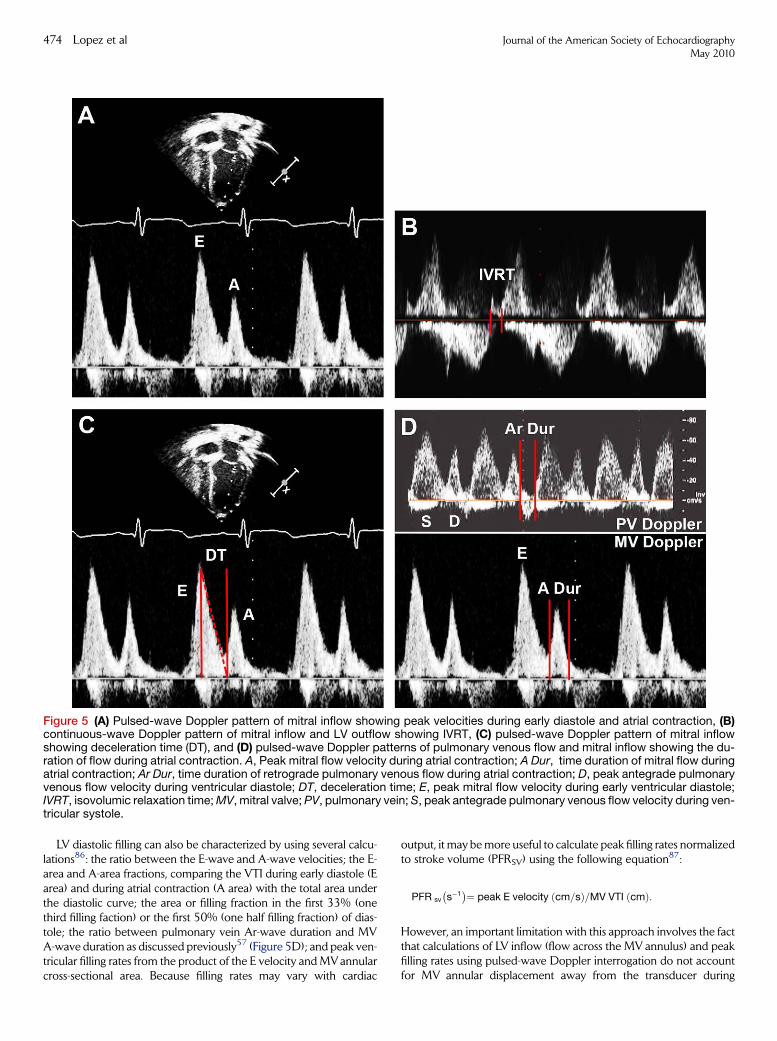
LV diastolic filling can also be characterized by using several calcu-lations86: the ratio between the E-wave and A-wave velocities; the E-area and A-area fractions, comparing the VTI during early diastole (Earea) and during atrial contraction (A area) with the total area underthe diastolic curve; the area or filling fraction in the first 33% (onethird filling faction) or the first 50% (one half filling fraction) of dias-tole; the ratio between pulmonary vein Ar-wave duration and MVA-wave duration as discussed previously57 (Figure 5D); and peak ven-tricular filling rates from the product of the E velocity and MVannularcross-sectional area. Because filling rates may vary with cardiac
output, it may be more useful to calculate peak filling rates normalizedto stroke volume (PFRSV) using the following equation87:
PFR sv
�s�1�¼ peak E velocity ðcm=sÞ=MV VTI ðcmÞ:
However, an important limitation with this approach involves the factthat calculations of LV inflow (flow across the MV annulus) and peakfilling rates using pulsed-wave Doppler interrogation do not accountfor MV annular displacement away from the transducer during
Figure 5 (A) Pulsed-wave Doppler pattern of mitral inflow showing peak velocities during early diastole and atrial contraction, (B)continuous-wave Doppler pattern of mitral inflow and LV outflow showing IVRT, (C) pulsed-wave Doppler pattern of mitral inflowshowing deceleration time (DT), and (D) pulsed-wave Doppler patterns of pulmonary venous flow and mitral inflow showing the du-ration of flow during atrial contraction. A, Peak mitral flow velocity during atrial contraction; A Dur, time duration of mitral flow duringatrial contraction; Ar Dur, time duration of retrograde pulmonary venous flow during atrial contraction; D, peak antegrade pulmonaryvenous flow velocity during ventricular diastole; DT, deceleration time; E, peak mitral flow velocity during early ventricular diastole;IVRT, isovolumic relaxation time; MV, mitral valve; PV, pulmonary vein; S, peak antegrade pulmonary venous flow velocity during ven-tricular systole.
474 Lopez et al Journal of the American Society of EchocardiographyMay 2010
diastole; hence, the Doppler profiles used in these calculations actuallyrepresent flow toward the transducer rather than true flow across theMV annulus.
Recommendations (Table 3): The recommended methodsto assess MV inflow include measurements of E-wave andA-wave velocities, A-wave duration, deceleration time,and IVRTand calculation of the E/A ratio.
Left Ventricle
Morphometric Evaluation. Measurements of LV size and func-tion are essential in the assessment of patients with congenital and ac-quired heart diseases.11 Although qualitative visual inspection mightbe adequate, it can be misleading, is prone to interobserver and inter-study variability, and relies on the skill of the interpreter.88 Given theimpact of quantitative data on diagnosis and management,89,90 theimportance of accurate, reproducible LV measurements cannot beoverstated. Although published ASE recommendations for chamberquantification in adults1 have been used extensively in children,data on the accuracy and reproducibility of these measurements inpediatrics are scant. In addition, there are limitations to the publishedmethods adjusting for body size in adults as discussed previously.15
Several linear and volumetric methods to assess LV size have been de-scribed and integrated into routine clinical practice, each with distinctadvantages and weaknesses, and these are discussed in this section.
In general, LV size should be measured during both diastole and sys-tole, defining end-diastole as the frame with the maximum chamber in-traluminal area and end-systole as the frame with the minimum area.However, these definitions are problematic because they rely on visualestimates of areas rather than a quantitative frame-by-frame analysis. Inaddition, the minimum area occurs at different times in short-axis andlong-axis views. During isovolumic contraction, the long axis firstshortens and then elongates (the reverse process occurs during isovolu-mic relaxation). In contrast, the short-axis area first increases and thendecreases progressively during isovolumic contraction. Given these lim-itations, end-diastole can be defined as the frame at which the MVcloses and end-systole as the frame preceding MVopening.
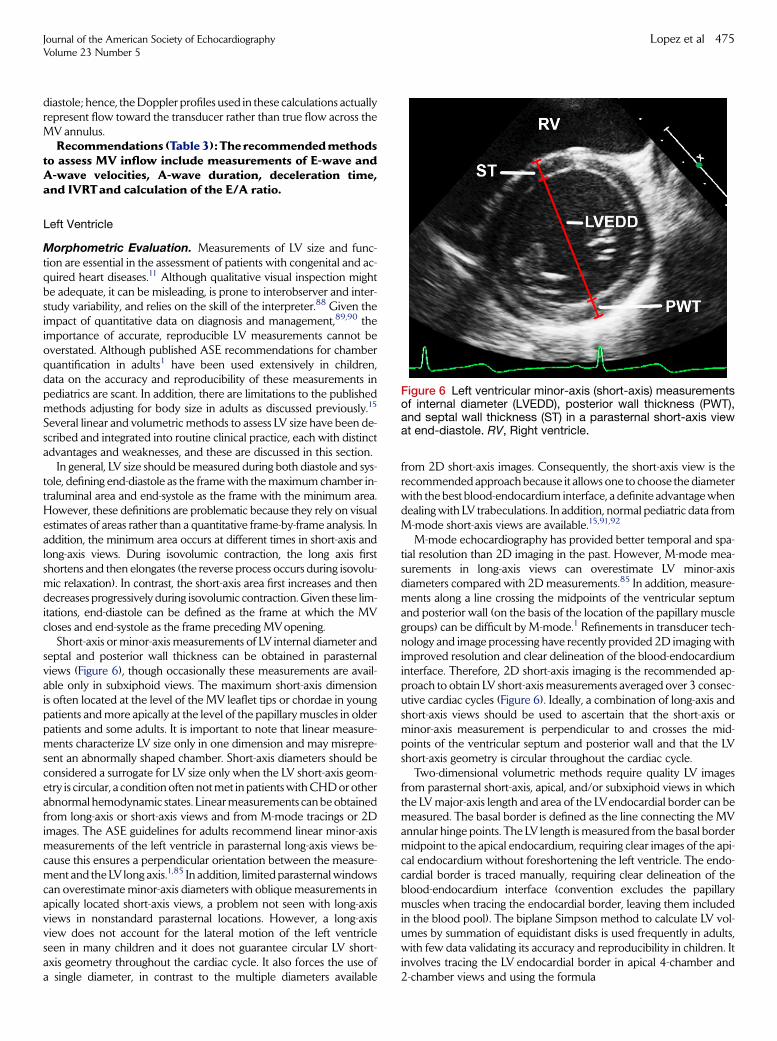
Short-axis or minor-axis measurements of LV internal diameter andseptal and posterior wall thickness can be obtained in parasternalviews (Figure 6), though occasionally these measurements are avail-able only in subxiphoid views. The maximum short-axis dimensionis often located at the level of the MV leaflet tips or chordae in youngpatients and more apically at the level of the papillary muscles in olderpatients and some adults. It is important to note that linear measure-ments characterize LV size only in one dimension and may misrepre-sent an abnormally shaped chamber. Short-axis diameters should beconsidered a surrogate for LV size only when the LV short-axis geom-etry is circular, a condition often not met in patients with CHD or otherabnormal hemodynamic states. Linear measurements can be obtainedfrom long-axis or short-axis views and from M-mode tracings or 2Dimages. The ASE guidelines for adults recommend linear minor-axismeasurements of the left ventricle in parasternal long-axis views be-cause this ensures a perpendicular orientation between the measure-ment and the LV long axis.1,85 In addition, limited parasternal windowscan overestimate minor-axis diameters with oblique measurements inapically located short-axis views, a problem not seen with long-axisviews in nonstandard parasternal locations. However, a long-axisview does not account for the lateral motion of the left ventricleseen in many children and it does not guarantee circular LV short-axis geometry throughout the cardiac cycle. It also forces the use ofa single diameter, in contrast to the multiple diameters available
from 2D short-axis images. Consequently, the short-axis view is therecommended approach because it allows one to choose the diameterwith the best blood-endocardium interface, a definite advantage whendealing with LV trabeculations. In addition, normal pediatric data fromM-mode short-axis views are available.15,91,92
M-mode echocardiography has provided better temporal and spa-tial resolution than 2D imaging in the past. However, M-mode mea-surements in long-axis views can overestimate LV minor-axisdiameters compared with 2D measurements.85 In addition, measure-ments along a line crossing the midpoints of the ventricular septumand posterior wall (on the basis of the location of the papillary musclegroups) can be difficult by M-mode.1 Refinements in transducer tech-nology and image processing have recently provided 2D imaging withimproved resolution and clear delineation of the blood-endocardiuminterface. Therefore, 2D short-axis imaging is the recommended ap-proach to obtain LV short-axis measurements averaged over 3 consec-utive cardiac cycles (Figure 6). Ideally, a combination of long-axis andshort-axis views should be used to ascertain that the short-axis orminor-axis measurement is perpendicular to and crosses the mid-points of the ventricular septum and posterior wall and that the LVshort-axis geometry is circular throughout the cardiac cycle.
Two-dimensional volumetric methods require quality LV imagesfrom parasternal short-axis, apical, and/or subxiphoid views in whichthe LV major-axis length and area of the LVendocardial border can bemeasured. The basal border is defined as the line connecting the MVannular hinge points. The LV length is measured from the basal bordermidpoint to the apical endocardium, requiring clear images of the api-cal endocardium without foreshortening the left ventricle. The endo-cardial border is traced manually, requiring clear delineation of theblood-endocardium interface (convention excludes the papillarymuscles when tracing the endocardial border, leaving them includedin the blood pool). The biplane Simpson method to calculate LV vol-umes by summation of equidistant disks is used frequently in adults,with few data validating its accuracy and reproducibility in children. Itinvolves tracing the LV endocardial border in apical 4-chamber and2-chamber views and using the formula
Figure 6 Left ventricular minor-axis (short-axis) measurementsof internal diameter (LVEDD), posterior wall thickness (PWT),and septal wall thickness (ST) in a parasternal short-axis viewat end-diastole. RV, Right ventricle.
Journal of the American Society of EchocardiographyVolume 23 Number 5
Lopez et al 475
V ¼ p
4�XN
i¼1
ai � bi �L
N;
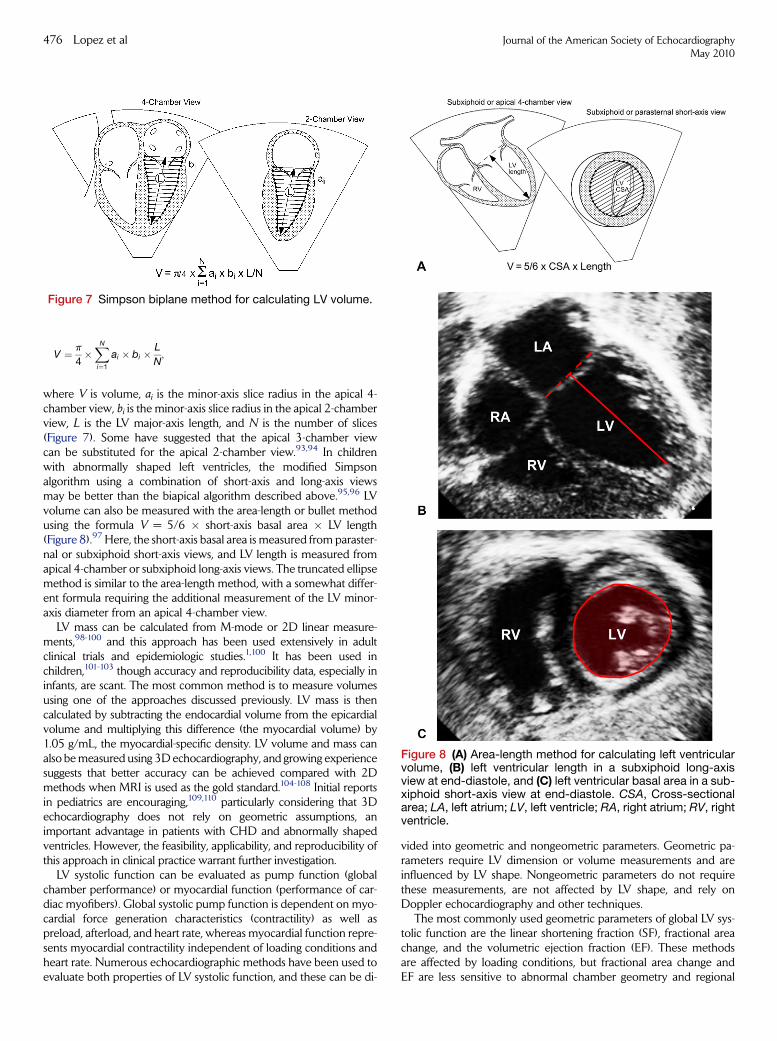
where V is volume, ai is the minor-axis slice radius in the apical 4-chamber view, bi is the minor-axis slice radius in the apical 2-chamberview, L is the LV major-axis length, and N is the number of slices(Figure 7). Some have suggested that the apical 3-chamber viewcan be substituted for the apical 2-chamber view.93,94 In childrenwith abnormally shaped left ventricles, the modified Simpsonalgorithm using a combination of short-axis and long-axis viewsmay be better than the biapical algorithm described above.95,96 LVvolume can also be measured with the area-length or bullet methodusing the formula V = 5/6 � short-axis basal area � LV length(Figure 8).97 Here, the short-axis basal area is measured from paraster-nal or subxiphoid short-axis views, and LV length is measured fromapical 4-chamber or subxiphoid long-axis views. The truncated ellipsemethod is similar to the area-length method, with a somewhat differ-ent formula requiring the additional measurement of the LV minor-axis diameter from an apical 4-chamber view.
LV mass can be calculated from M-mode or 2D linear measure-ments,98-100 and this approach has been used extensively in adultclinical trials and epidemiologic studies.1,100 It has been used inchildren,101-103 though accuracy and reproducibility data, especially ininfants, are scant. The most common method is to measure volumesusing one of the approaches discussed previously. LV mass is thencalculated by subtracting the endocardial volume from the epicardialvolume and multiplying this difference (the myocardial volume) by1.05 g/mL, the myocardial-specific density. LV volume and mass canalso be measured using 3D echocardiography, and growing experiencesuggests that better accuracy can be achieved compared with 2Dmethods when MRI is used as the gold standard.104-108 Initial reportsin pediatrics are encouraging,109,110 particularly considering that 3Dechocardiography does not rely on geometric assumptions, animportant advantage in patients with CHD and abnormally shapedventricles. However, the feasibility, applicability, and reproducibility ofthis approach in clinical practice warrant further investigation.
LV systolic function can be evaluated as pump function (globalchamber performance) or myocardial function (performance of car-diac myofibers). Global systolic pump function is dependent on myo-cardial force generation characteristics (contractility) as well aspreload, afterload, and heart rate, whereas myocardial function repre-sents myocardial contractility independent of loading conditions andheart rate. Numerous echocardiographic methods have been used toevaluate both properties of LV systolic function, and these can be di-
vided into geometric and nongeometric parameters. Geometric pa-rameters require LV dimension or volume measurements and areinfluenced by LV shape. Nongeometric parameters do not requirethese measurements, are not affected by LV shape, and rely onDoppler echocardiography and other techniques.
The most commonly used geometric parameters of global LV sys-tolic function are the linear shortening fraction (SF), fractional areachange, and the volumetric ejection fraction (EF). These methodsare affected by loading conditions, but fractional area change andEF are less sensitive to abnormal chamber geometry and regional
Figure 7 Simpson biplane method for calculating LV volume.
Figure 8 (A) Area-length method for calculating left ventricularvolume, (B) left ventricular length in a subxiphoid long-axisview at end-diastole, and (C) left ventricular basal area in a sub-xiphoid short-axis view at end-diastole. CSA, Cross-sectionalarea; LA, left atrium; LV, left ventricle; RA, right atrium; RV, rightventricle.
476 Lopez et al Journal of the American Society of EchocardiographyMay 2010
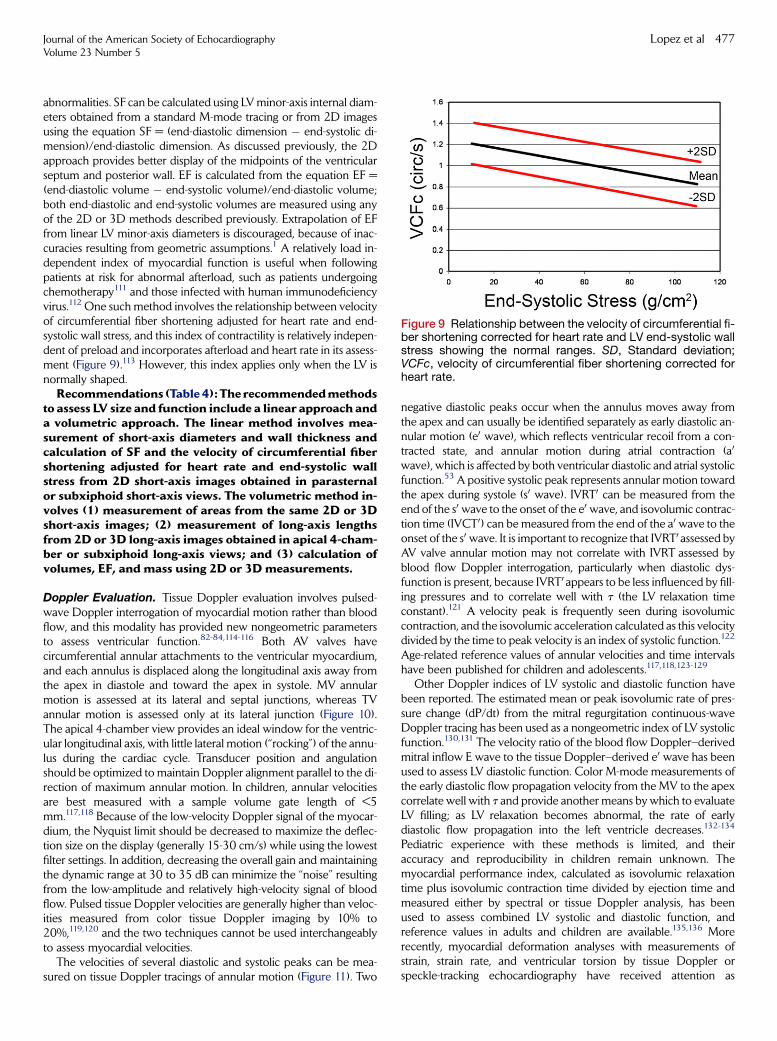
abnormalities. SF can be calculated using LV minor-axis internal diam-eters obtained from a standard M-mode tracing or from 2D imagesusing the equation SF = (end-diastolic dimension � end-systolic di-mension)/end-diastolic dimension. As discussed previously, the 2Dapproach provides better display of the midpoints of the ventricularseptum and posterior wall. EF is calculated from the equation EF =(end-diastolic volume � end-systolic volume)/end-diastolic volume;both end-diastolic and end-systolic volumes are measured using anyof the 2D or 3D methods described previously. Extrapolation of EFfrom linear LV minor-axis diameters is discouraged, because of inac-curacies resulting from geometric assumptions.1 A relatively load in-dependent index of myocardial function is useful when followingpatients at risk for abnormal afterload, such as patients undergoingchemotherapy111 and those infected with human immunodeficiencyvirus.112 One such method involves the relationship between velocityof circumferential fiber shortening adjusted for heart rate and end-systolic wall stress, and this index of contractility is relatively indepen-dent of preload and incorporates afterload and heart rate in its assess-ment (Figure 9).113 However, this index applies only when the LV isnormally shaped.
Recommendations (Table 4): The recommended methodsto assess LV size and function include a linear approach anda volumetric approach. The linear method involves mea-surement of short-axis diameters and wall thickness andcalculation of SF and the velocity of circumferential fibershortening adjusted for heart rate and end-systolic wallstress from 2D short-axis images obtained in parasternalor subxiphoid short-axis views. The volumetric method in-volves (1) measurement of areas from the same 2D or 3Dshort-axis images; (2) measurement of long-axis lengthsfrom 2D or 3D long-axis images obtained in apical 4-cham-ber or subxiphoid long-axis views; and (3) calculation ofvolumes, EF, and mass using 2D or 3D measurements.
Doppler Evaluation. Tissue Doppler evaluation involves pulsed-wave Doppler interrogation of myocardial motion rather than bloodflow, and this modality has provided new nongeometric parametersto assess ventricular function.82-84,114-116 Both AV valves havecircumferential annular attachments to the ventricular myocardium,and each annulus is displaced along the longitudinal axis away fromthe apex in diastole and toward the apex in systole. MV annularmotion is assessed at its lateral and septal junctions, whereas TVannular motion is assessed only at its lateral junction (Figure 10).The apical 4-chamber view provides an ideal window for the ventric-ular longitudinal axis, with little lateral motion (‘‘rocking’’) of the annu-lus during the cardiac cycle. Transducer position and angulationshould be optimized to maintain Doppler alignment parallel to the di-rection of maximum annular motion. In children, annular velocitiesare best measured with a sample volume gate length of <5mm.117,118 Because of the low-velocity Doppler signal of the myocar-dium, the Nyquist limit should be decreased to maximize the deflec-tion size on the display (generally 15-30 cm/s) while using the lowestfilter settings. In addition, decreasing the overall gain and maintainingthe dynamic range at 30 to 35 dB can minimize the ‘‘noise’’ resultingfrom the low-amplitude and relatively high-velocity signal of bloodflow. Pulsed tissue Doppler velocities are generally higher than veloc-ities measured from color tissue Doppler imaging by 10% to20%,119,120 and the two techniques cannot be used interchangeablyto assess myocardial velocities.
The velocities of several diastolic and systolic peaks can be mea-sured on tissue Doppler tracings of annular motion (Figure 11). Two
negative diastolic peaks occur when the annulus moves away fromthe apex and can usually be identified separately as early diastolic an-nular motion (e0 wave), which reflects ventricular recoil from a con-tracted state, and annular motion during atrial contraction (a0
wave), which is affected by both ventricular diastolic and atrial systolicfunction.53 A positive systolic peak represents annular motion towardthe apex during systole (s0 wave). IVRT0 can be measured from theend of the s0 wave to the onset of the e0 wave, and isovolumic contrac-tion time (IVCT0) can be measured from the end of the a0 wave to theonset of the s0 wave. It is important to recognize that IVRT0 assessed byAV valve annular motion may not correlate with IVRT assessed byblood flow Doppler interrogation, particularly when diastolic dys-function is present, because IVRT0 appears to be less influenced by fill-ing pressures and to correlate well with t (the LV relaxation timeconstant).121 A velocity peak is frequently seen during isovolumiccontraction, and the isovolumic acceleration calculated as this velocitydivided by the time to peak velocity is an index of systolic function.122
Age-related reference values of annular velocities and time intervalshave been published for children and adolescents.117,118,123-129
Other Doppler indices of LV systolic and diastolic function havebeen reported. The estimated mean or peak isovolumic rate of pres-sure change (dP/dt) from the mitral regurgitation continuous-waveDoppler tracing has been used as a nongeometric index of LV systolicfunction.130,131 The velocity ratio of the blood flow Doppler–derivedmitral inflow E wave to the tissue Doppler–derived e0 wave has beenused to assess LV diastolic function. Color M-mode measurements ofthe early diastolic flow propagation velocity from the MV to the apexcorrelate well with t and provide another means by which to evaluateLV filling; as LV relaxation becomes abnormal, the rate of earlydiastolic flow propagation into the left ventricle decreases.132-134
Pediatric experience with these methods is limited, and theiraccuracy and reproducibility in children remain unknown. Themyocardial performance index, calculated as isovolumic relaxationtime plus isovolumic contraction time divided by ejection time andmeasured either by spectral or tissue Doppler analysis, has beenused to assess combined LV systolic and diastolic function, andreference values in adults and children are available.135,136 Morerecently, myocardial deformation analyses with measurements ofstrain, strain rate, and ventricular torsion by tissue Doppler orspeckle-tracking echocardiography have received attention as
Figure 9 Relationship between the velocity of circumferential fi-ber shortening corrected for heart rate and LV end-systolic wallstress showing the normal ranges. SD, Standard deviation;VCFc, velocity of circumferential fiber shortening corrected forheart rate.
Journal of the American Society of EchocardiographyVolume 23 Number 5
Lopez et al 477
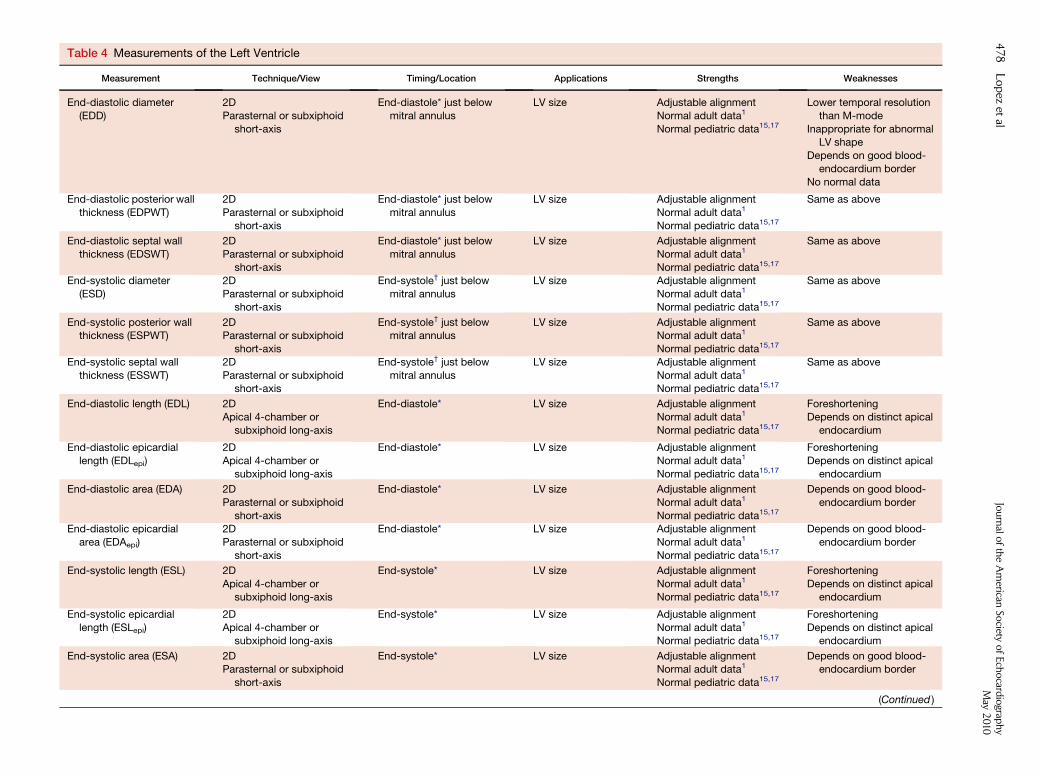
Table 4 Measurements of the Left Ventricle
Measurement Technique/View Timing/Location Applications Strengths Weaknesses
End-diastolic diameter
(EDD)
2D
Parasternal or subxiphoid
short-axis
End-diastole* just below
mitral annulus
LV size Adjustable alignment
Normal adult data1
Normal pediatric data15,17
Lower temporal resolution
than M-mode
Inappropriate for abnormalLV shape
Depends on good blood-
endocardium border
No normal data
End-diastolic posterior wall
thickness (EDPWT)
2D
Parasternal or subxiphoid
short-axis
End-diastole* just below
mitral annulus
LV size Adjustable alignment
Normal adult data1
Normal pediatric data15,17
Same as above
End-diastolic septal wall
thickness (EDSWT)
2D
Parasternal or subxiphoidshort-axis
End-diastole* just below
mitral annulus
LV size Adjustable alignment
Normal adult data1
Normal pediatric data15,17
Same as above
End-systolic diameter
(ESD)
2D
Parasternal or subxiphoidshort-axis
End-systole† just below
mitral annulus
LV size Adjustable alignment
Normal adult data1
Normal pediatric data15,17
Same as above
End-systolic posterior wallthickness (ESPWT)
2DParasternal or subxiphoid
short-axis
End-systole† just belowmitral annulus
LV size Adjustable alignmentNormal adult data1
Normal pediatric data15,17
Same as above
End-systolic septal wall
thickness (ESSWT)
2D
Parasternal or subxiphoidshort-axis
End-systole† just below
mitral annulus
LV size Adjustable alignment
Normal adult data1
Normal pediatric data15,17
Same as above
End-diastolic length (EDL) 2DApical 4-chamber or
subxiphoid long-axis
End-diastole* LV size Adjustable alignmentNormal adult data1
Normal pediatric data15,17
ForeshorteningDepends on distinct apical
endocardium
End-diastolic epicardial
length (EDLepi)
2D
Apical 4-chamber or
subxiphoid long-axis
End-diastole* LV size Adjustable alignment
Normal adult data1
Normal pediatric data15,17
Foreshortening
Depends on distinct apical
endocardium
End-diastolic area (EDA) 2D
Parasternal or subxiphoid
short-axis
End-diastole* LV size Adjustable alignment
Normal adult data1
Normal pediatric data15,17
Depends on good blood-
endocardium border
End-diastolic epicardial
area (EDAepi)
2D
Parasternal or subxiphoid
short-axis
End-diastole* LV size Adjustable alignment
Normal adult data1
Normal pediatric data15,17
Depends on good blood-
endocardium border
End-systolic length (ESL) 2D
Apical 4-chamber orsubxiphoid long-axis
End-systole* LV size Adjustable alignment
Normal adult data1
Normal pediatric data15,17
Foreshortening
Depends on distinct apicalendocardium
End-systolic epicardial
length (ESLepi)
2D
Apical 4-chamber orsubxiphoid long-axis
End-systole* LV size Adjustable alignment
Normal adult data1
Normal pediatric data15,17
Foreshortening
Depends on distinct apicalendocardium
End-systolic area (ESA) 2DParasternal or subxiphoid
short-axis
End-systole* LV size Adjustable alignmentNormal adult data1
Normal pediatric data15,17
Depends on good blood-endocardium border
(Continued )
478
Lopez
etal
Journ
alofth
eA
merican
Society
ofEch
ocard
iograp
hy
May
2010
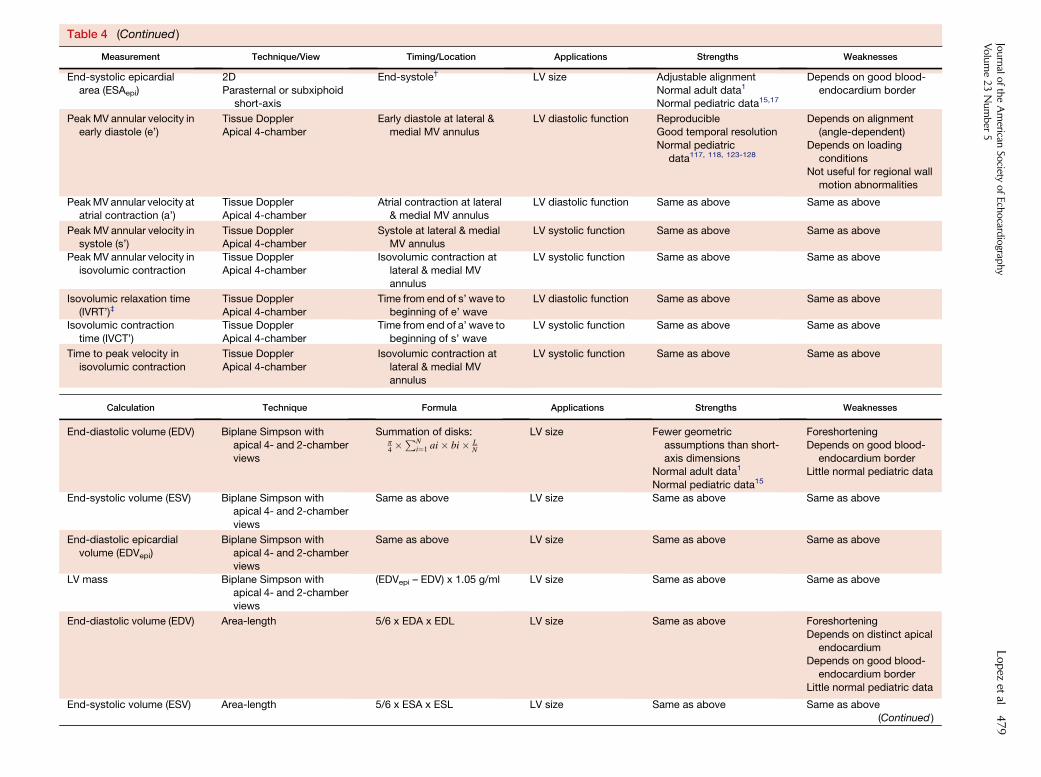
Table 4 (Continued )
Measurement Technique/View Timing/Location Applications Strengths Weaknesses
End-systolic epicardial
area (ESAepi)
2D
Parasternal or subxiphoidshort-axis
End-systole† LV size Adjustable alignment
Normal adult data1
Normal pediatric data15,17
Depends on good blood-
endocardium border
Peak MV annular velocity inearly diastole (e’)
Tissue DopplerApical 4-chamber
Early diastole at lateral &medial MV annulus
LV diastolic function ReproducibleGood temporal resolution
Normal pediatric
data117, 118, 123-128
Depends on alignment(angle-dependent)
Depends on loading
conditionsNot useful for regional wall
motion abnormalities
Peak MV annular velocity atatrial contraction (a’)
Tissue DopplerApical 4-chamber
Atrial contraction at lateral& medial MV annulus
LV diastolic function Same as above Same as above
Peak MV annular velocity insystole (s’)
Tissue DopplerApical 4-chamber
Systole at lateral & medialMV annulus
LV systolic function Same as above Same as above
Peak MV annular velocity in
isovolumic contraction
Tissue Doppler
Apical 4-chamber
Isovolumic contraction at
lateral & medial MV
annulus
LV systolic function Same as above Same as above
Isovolumic relaxation time(IVRT’)‡
Tissue DopplerApical 4-chamber
Time from end of s’ wave tobeginning of e’ wave
LV diastolic function Same as above Same as above
Isovolumic contraction
time (IVCT’)
Tissue Doppler
Apical 4-chamber
Time from end of a’ wave to
beginning of s’ wave
LV systolic function Same as above Same as above
Time to peak velocity in
isovolumic contraction
Tissue Doppler
Apical 4-chamber
Isovolumic contraction at
lateral & medial MV
annulus
LV systolic function Same as above Same as above
Calculation Technique Formula Applications Strengths Weaknesses
End-diastolic volume (EDV) Biplane Simpson with
apical 4- and 2-chamber
views
Summation of disks:p4 �
PNi¼1 ai� bi� L
N
LV size Fewer geometric
assumptions than short-
axis dimensionsNormal adult data1
Normal pediatric data15
Foreshortening
Depends on good blood-
endocardium borderLittle normal pediatric data
End-systolic volume (ESV) Biplane Simpson withapical 4- and 2-chamber
views
Same as above LV size Same as above Same as above
End-diastolic epicardial
volume (EDVepi)
Biplane Simpson with
apical 4- and 2-chamber
views
Same as above LV size Same as above Same as above
LV mass Biplane Simpson withapical 4- and 2-chamber
views
(EDVepi – EDV) x 1.05 g/ml LV size Same as above Same as above
End-diastolic volume (EDV) Area-length 5/6 x EDA x EDL LV size Same as above Foreshortening
Depends on distinct apical
endocardiumDepends on good blood-
endocardium border
Little normal pediatric data
End-systolic volume (ESV) Area-length 5/6 x ESA x ESL LV size Same as above Same as above
(Continued )
Journ
alofth
eA
merican
Society
ofEch
ocard
iograp
hy
Volu
me
23
Num
ber5
Lopez
etal
479