Embed Size (px)
Citation preview
German Environment Agency
Strengthening of environmental protection requirements for the
rehabilitation of areas devastated by coal-mining in Mongolia
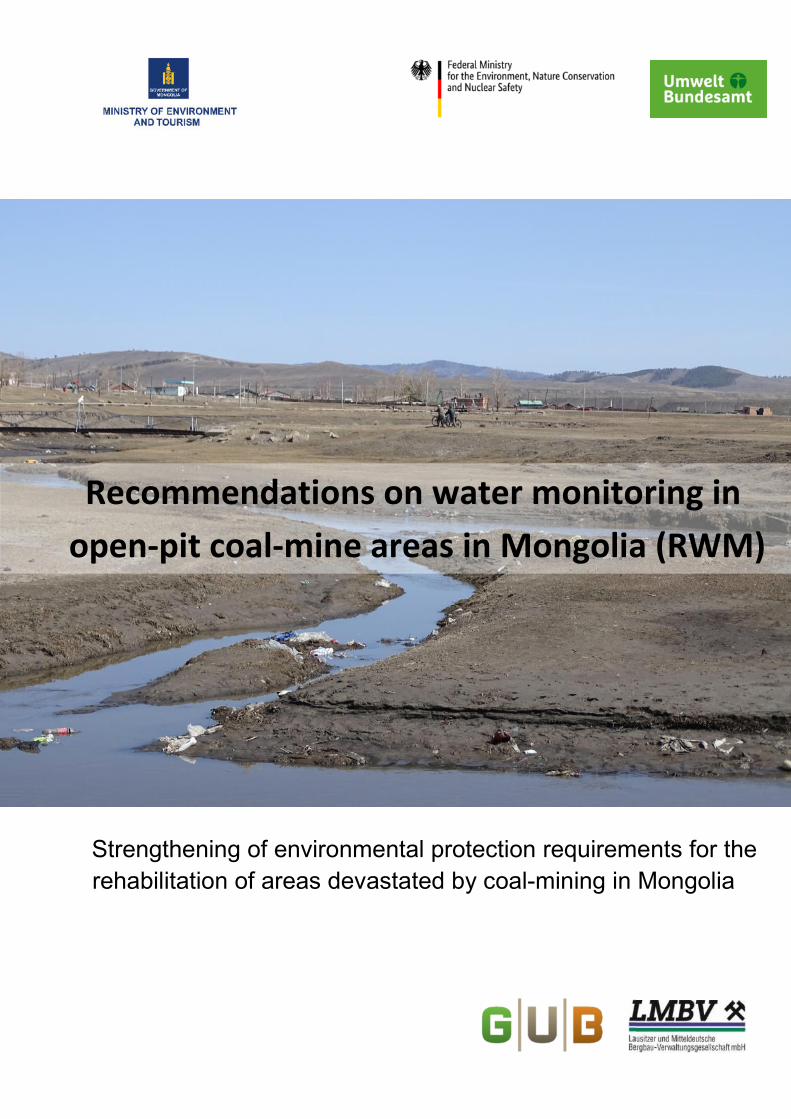
Recommendations on water monitoring in
open-pit coal-mine areas in Mongolia (RWM)
ADVISORY ASSISTANCE PROGRAMME (AAP)
of
the Federal Ministry for the Environment Nature
Conservation and Nuclear Safety
Project No 90148
Project Strengthening of environmental protection
requirements for the rehabilitation of areas devastated
by coal-mining in Mongolia
Recommendations on water monitoring in open-pit coal-mine areas in Mongolia (RWM)
by
GUB Ingenieur AG
Niederlassung Freiberg
Halsbruumlcker Straszlige 34
09599 Freiberg
Telephone 0049 3731 69228-0
E-Mail infogub-freibergde
Internet wwwgub-ingde
and
Lausitzer und Mitteldeutsche
Bergbauverwaltungsgesellschaft mbH (LMBV mbH)
Knappenstraszlige 1
01968 Senftenberg
On behalf of the German Environment Agency
Report completed in November 2019
This project was financed by the German Federal Environment Ministryrsquos Advisory Assistance
Programme (AAP) for environmental protection in the countries of Central and Eastern Europe the
Caucasus and Central Asia and other countries neighboring the EU It was supervised by the German
Environment Agency
The responsibility for the content of this publication and the photos lies with the authors
Image on the front page Open-pit coal-mine Sharyn Gol (Ch Konrad 2018)
Recommendations on water monitoring in open-pit coal-mine areas in Mongolia (RWM)
5
Abstract Recommendations on Water Monitoring in Open-pit Coal Mine Areas
Monitoring and understanding the local water system provides a basis for a more sustainable and efficient water management
This document gives recommendations concerning the planning and technical realization of water monitoring system for open-pit coal-mines while providing focus on the interpretation documentation and reporting of monitoring results These recommendations are based on site visits to Mongolian open-pits mines as well as experiences from water monitoring in lignite mining in Germany which have been adapted by considering the current conditions in Mongolia
These recommendations are intended for managers at the operational level but they may also be useful for environmental officials competent authorities non-government organizations students and people with a general interest in the best practices associated with monitoring the quality and quantity of ground and surface waters in and around open-pit coal-mines The goal of this work is to improve the mining industryrsquos environmental performance
Kurzbeschreibung Empfehlungen zum Wassermonitoring fuumlr Gebiete des Kohlentagebaus
Grundlagen fuumlr eine nachhaltige und wirkungsvolle Wasserwirtschaft sind das Systemverstaumlndnis und die messtechnische Erfassung des lokalen Wasserhaushaltes
Mit dem vorliegenden Dokument sollen Empfehlungen zur Planung und technischen Realisation fuumlr das Wassermonitoring in Kohlentagebauen gegeben werden wobei der Schwerpunkt auf der Interpretration Auswertung und der Erarbeitung von entsprechenden Bereichten liegt Diese Empfehluingen basieren auf Befahrungen mongolischer Tagebau und Erfahrungen zum Wassermonitoring die im Braunkohlentagebau in Deutschland gemacht worden sind wobei letztere auf die gegenwaumlrtigen mongolischen Verhaumlltnisse angepasst worden
Die vorgelegten Hinweise sind fuumlr Tagebautreibende genauso wie fuumlr Umweltinspektoren Behoumlrdenvertreter NGOs Studenten und Interessenten bewaumlhrter Praxis des Monitoring von Grund- und Oberflaumlchenwasser hinsichtlich Menge und Beschaffenheit in und um Kohlentagebaue gerichtet Ziel dieser Arbeit ist die Umweltvertraumlglichkeit des Bergbaus zu verbessern
Recommendations on water monitoring in open-pit coal-mine areas in Mongolia (RWM)
6
Table of Contents
List of Figures 8
List of Tables 9
Summary 10
1 Forward 11
2 Introduction 12
Mining and Water 12
Goals and Outputs of Water Monitoring in Mining Areas 12
Legal Framework and Standards 14
Processes and Outputs of Water Monitoring 15
Preliminary Characterization of the System 16
3 Definition of Monitoring Objects 19
4 Groundwater 21
Use of Existing Groundwater SamplingMeasurement Points 21
Planning of Positions for (New) Groundwater Observation Wells 22
Construction of New Groundwater Monitoring Wells 23
Monitoring Program 25
Groundwater Sampling 26
5 Surface Water 30
Objects of Surface Water Monitoring 30
Monitoring Program 30
Water Level Measurement 31
Flow Rate Measurement 31
Surface Water Sampling 34
6 Data Management 36
7 Interpretation and Analysis of Monitoring Results 39
Validity Check Visualization and Interpretation of Water Level Measurements 39
Hydrographs 39
Validity Check Visualization and Interpretation of Water Quality Measurements 43
Chemical Characterization of Groundwater 45
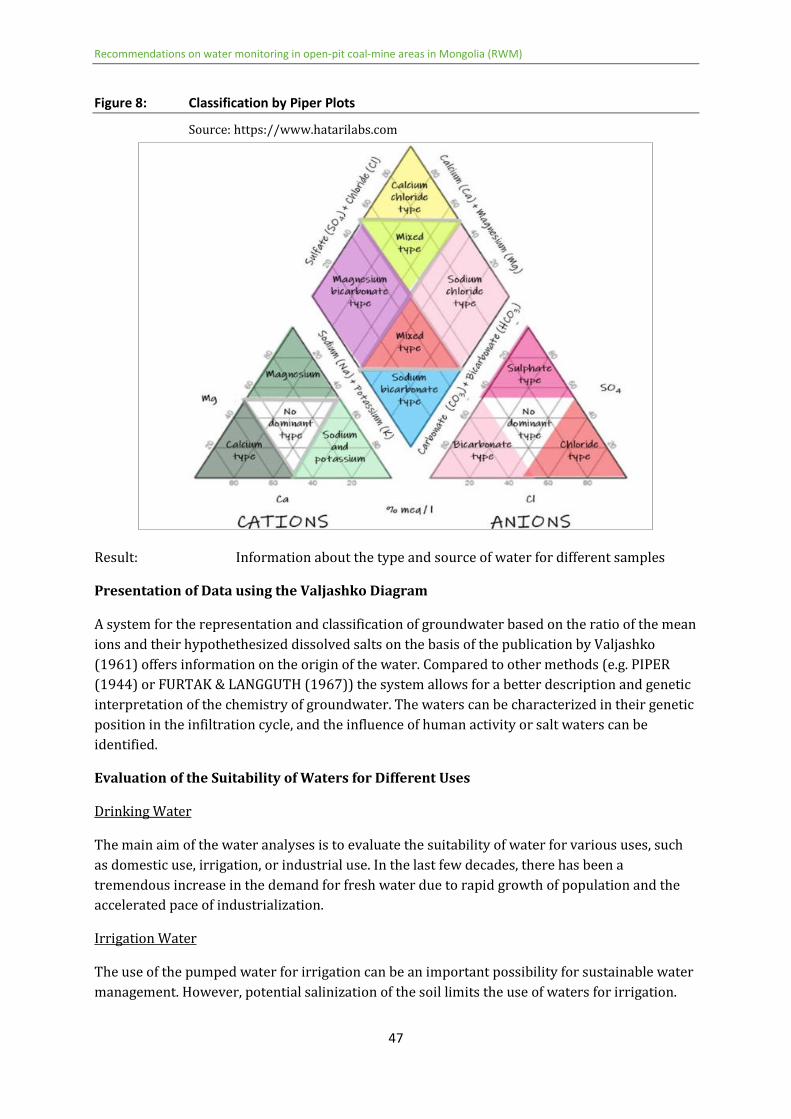
Evaluation of the Suitability of Waters for Different Uses 47
8 Reporting 49
9 Implementation of Monitoring Results into a Numerical Flow Model 52
Conception of a Numerical Model 52
Recommendations on water monitoring in open-pit coal-mine areas in Mongolia (RWM)
7
Basics 52
Goals of the Numerical Flow Model 52
Choosing the Method Solver and Software 53
Extent of the Model (Temporal and Spatial) 54
Implementation of Boundary Conditions 55
Implementation of Monitoring Results 55
Evaluation of Model Results 56
Reporting of Numerical Models 57
10 Audit Evaluation and Optimization of Monitoring 59
Specific Glossary 60
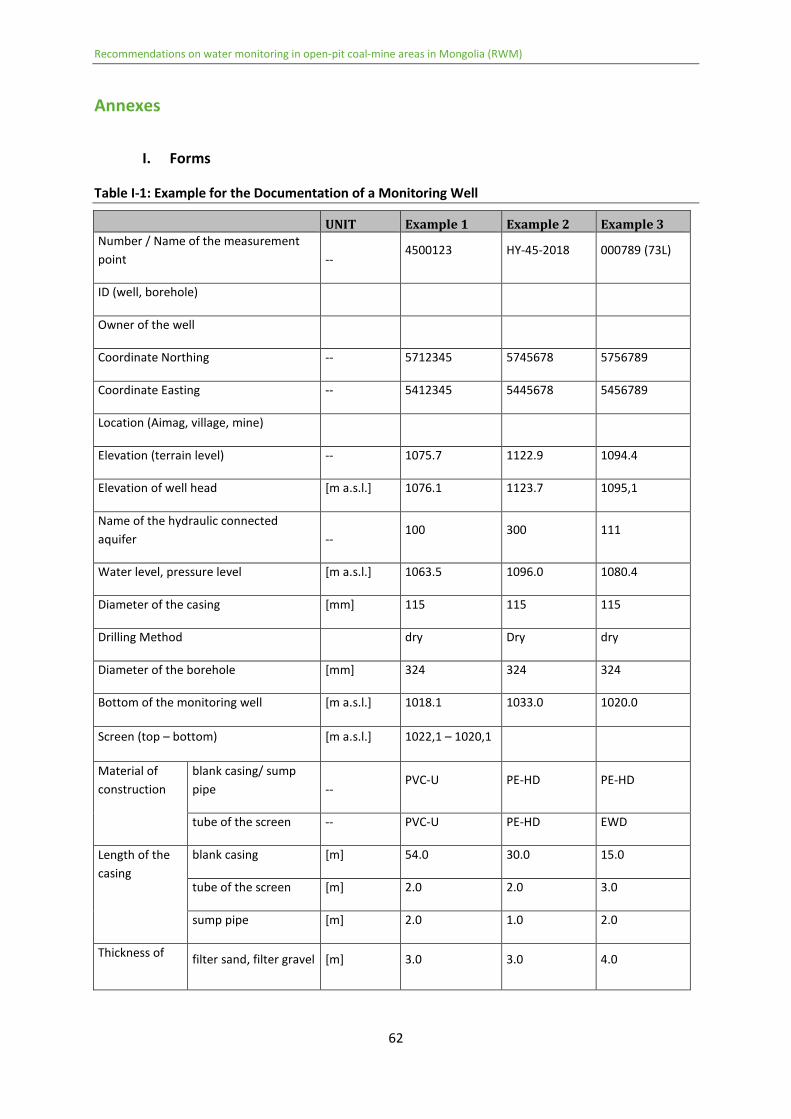
Annexes 62
I Forms 62
II Technical Details 66
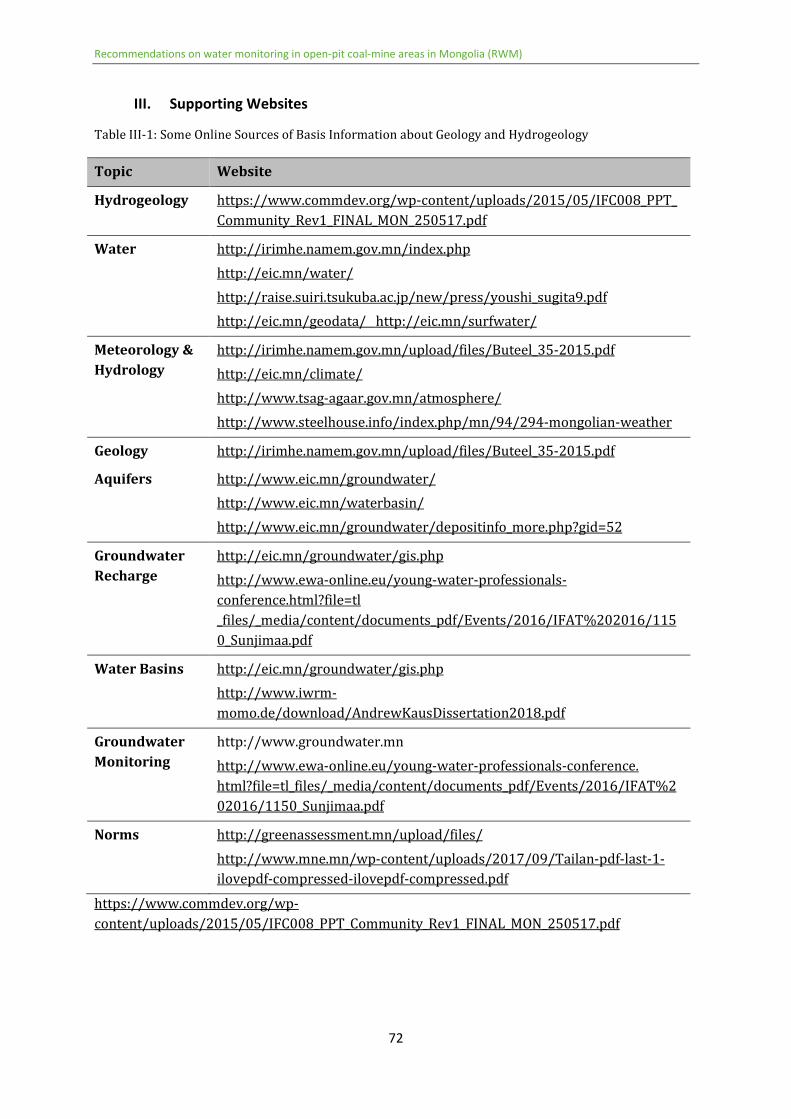
III Supporting Websites 72
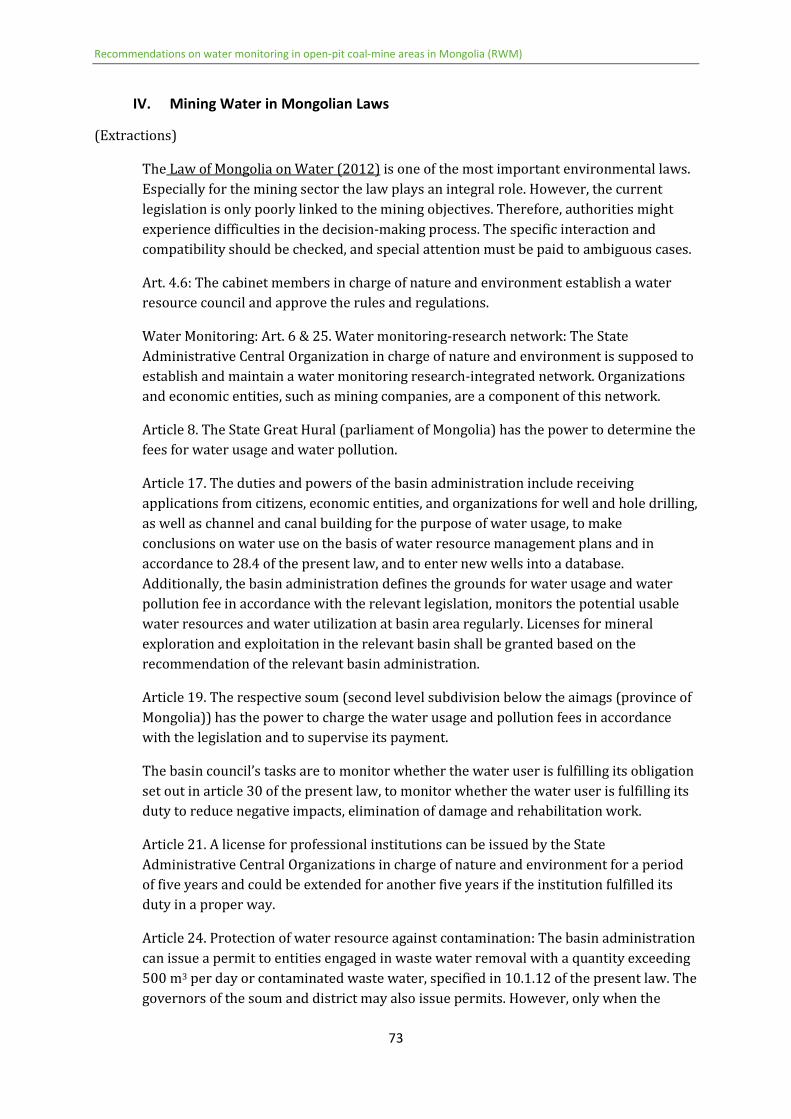
IV Mining Water in Mongolian Laws 73
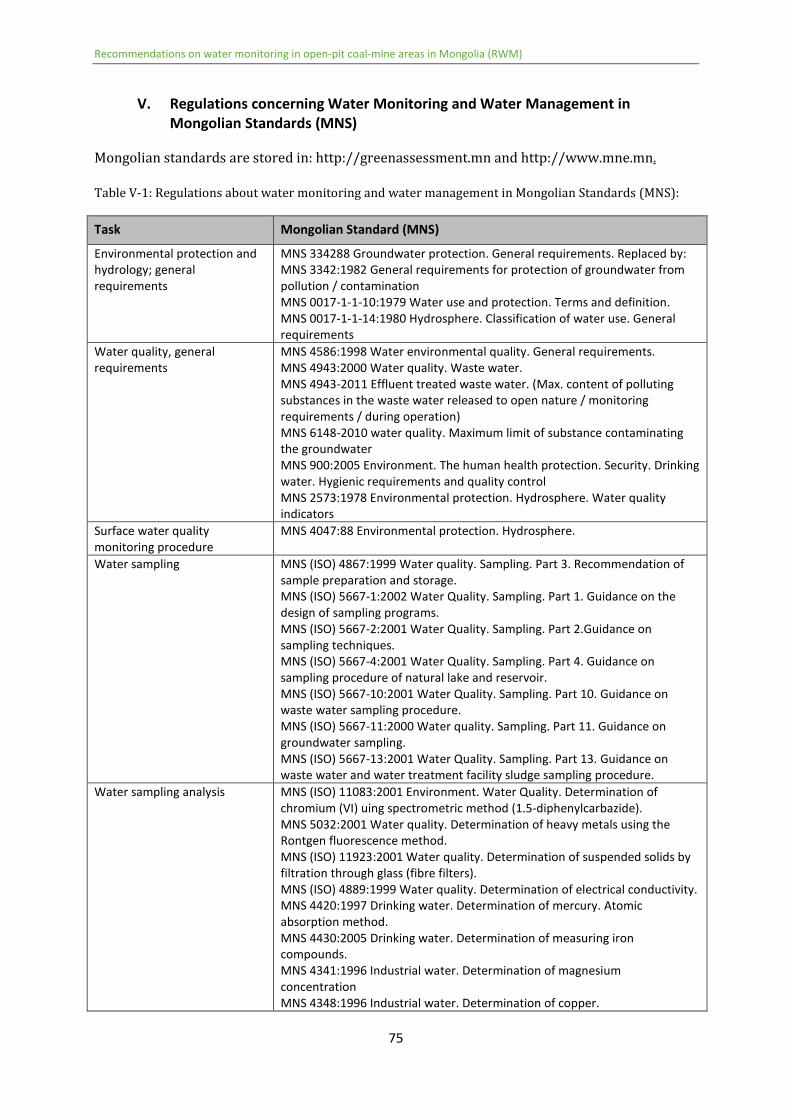
V Regulations concerning Water Monitoring and Water Management in Mongolian
Standards (MNS) 75
Recommendations on water monitoring in open-pit coal-mine areas in Mongolia (RWM)
8
List of Figures
Figure 1 Major Laws Related to Minerals and Mining in Mongolia
Concerning the Environment 14
Figure 2 Hydrological Triangle and the Construction of Water Level
Lines 23
Figure 3 Different Types of Monitoring Wells 24
Figure 4 Examples of Water Level Gauges for Surface Water 31
Figure 5 Velocity Measurement 32
Figure 6 Example of a Triangular Weir 32
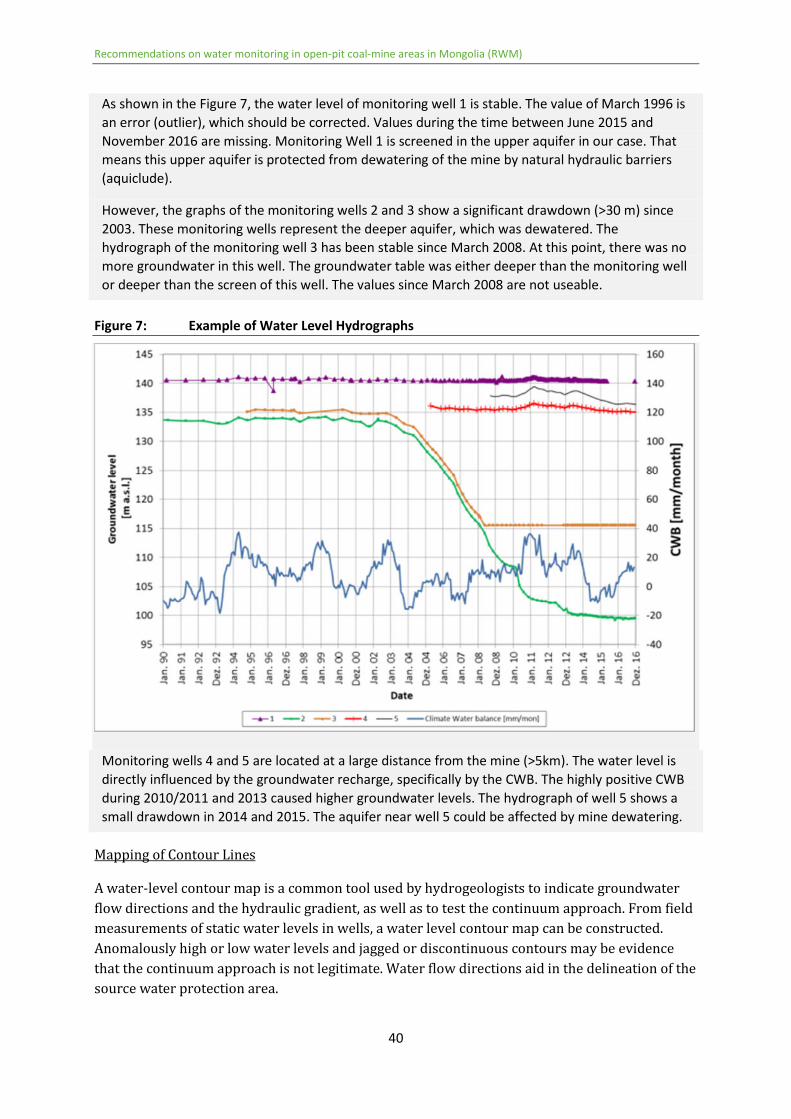
Figure 7 Example of Water Level Hydrographs 40
Figure 8 Classification by Piper Plots 47
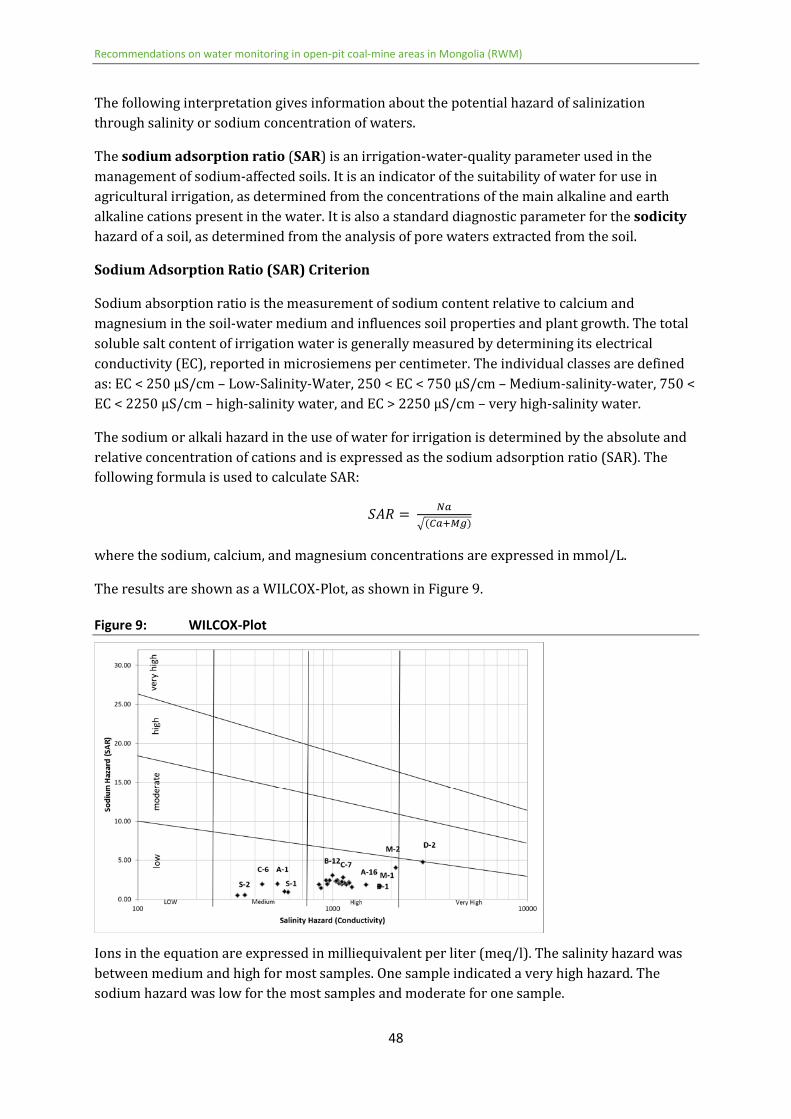
Figure 9 WILCOX-Plot 48
Recommendations on water monitoring in open-pit coal-mine areas in Mongolia (RWM)
9
List of Tables
Table 1 Characteristics of the Aquifer System per Zone 17
Table 2 Characteristics and Hydraulic Boundary Conditions of the
Aquifer System per Zone 18
Table 3 Short Description of Different Types of Monitoring Wells 23
Table 4 Example for the Documentation of the Measurement of
Groundwater Levels 36
Table 5 Example of a Documentation of measurement point for the
Flow Rate of Surface Water 36
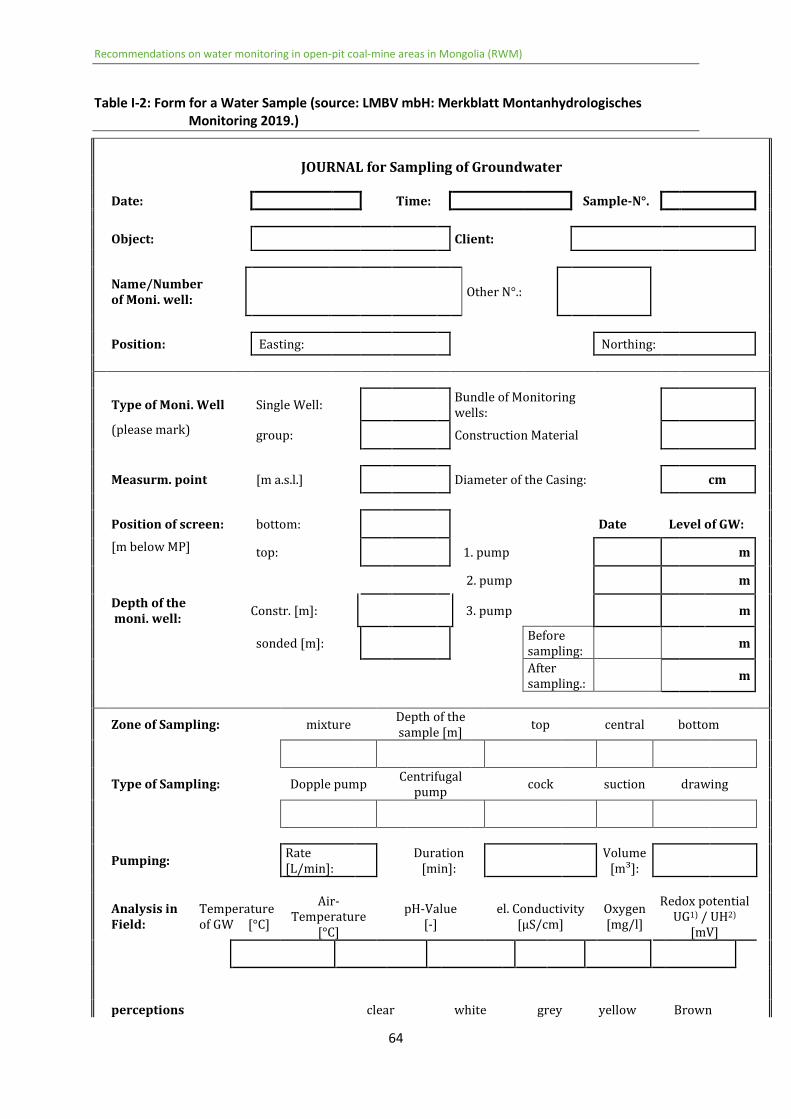
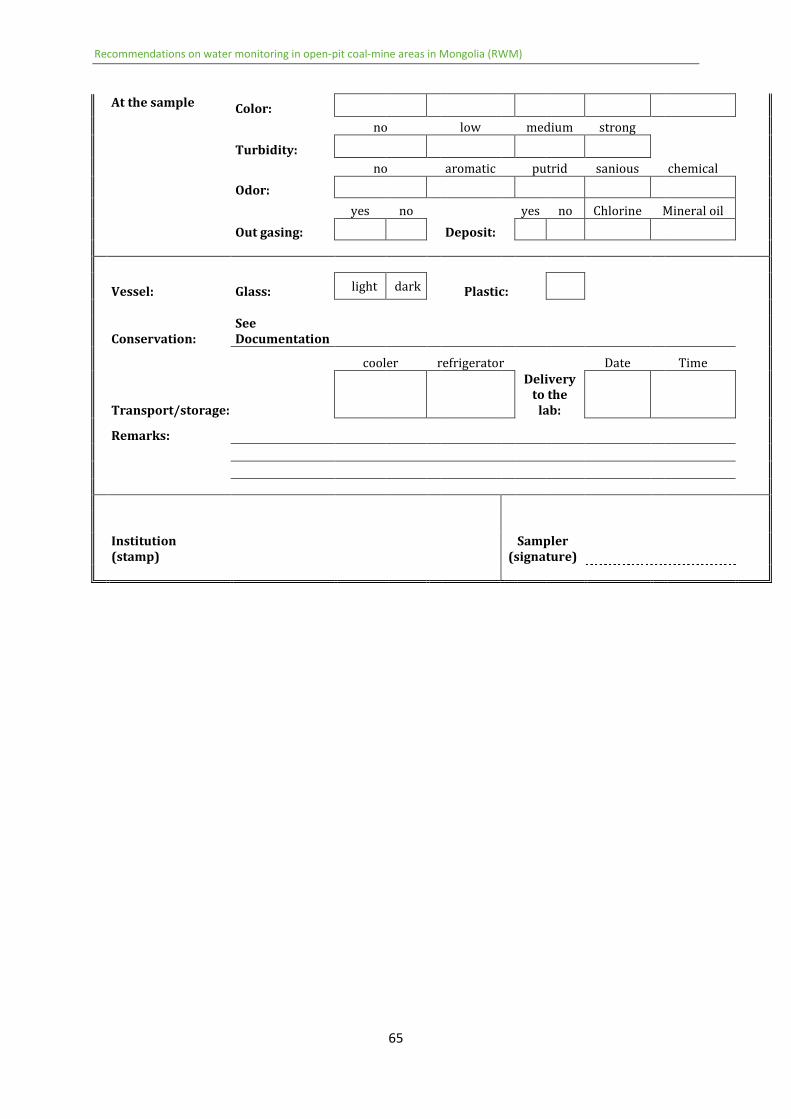
Table 6 Example for the documentation of the Water Sampling 37
Table 7 Overview of Hydraulic Conditions 42
Table 8 Conductivity for Different Types of Water 45
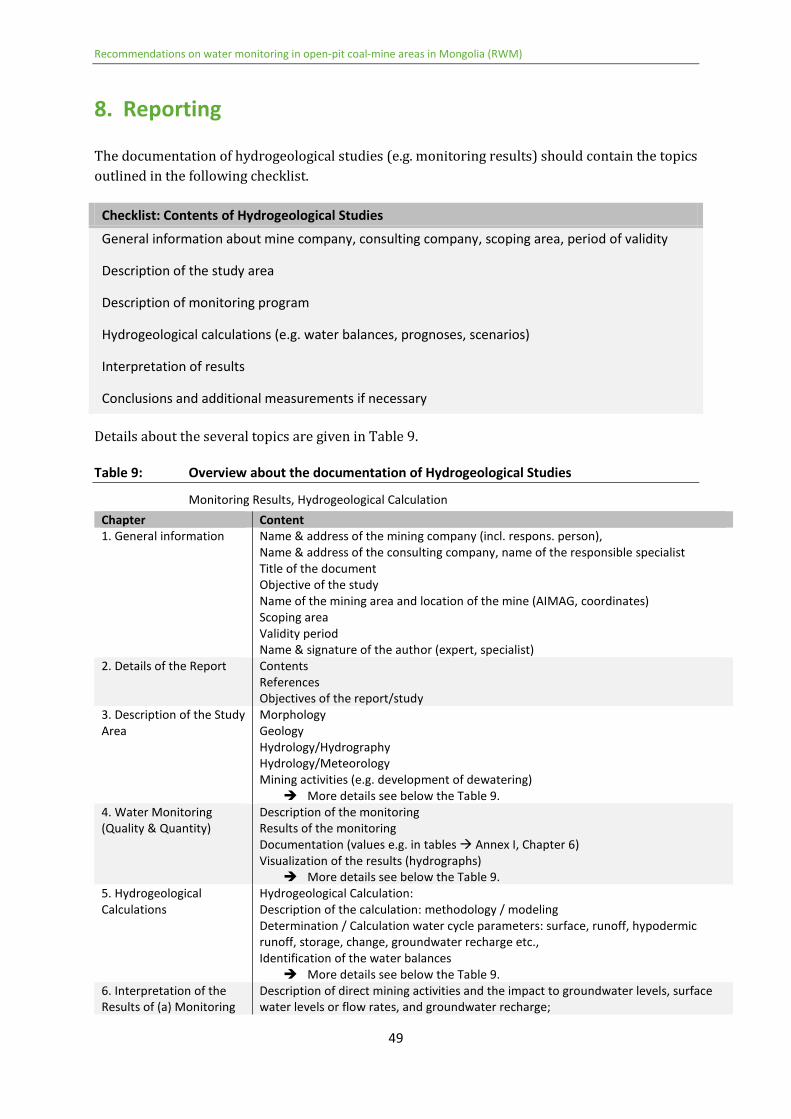
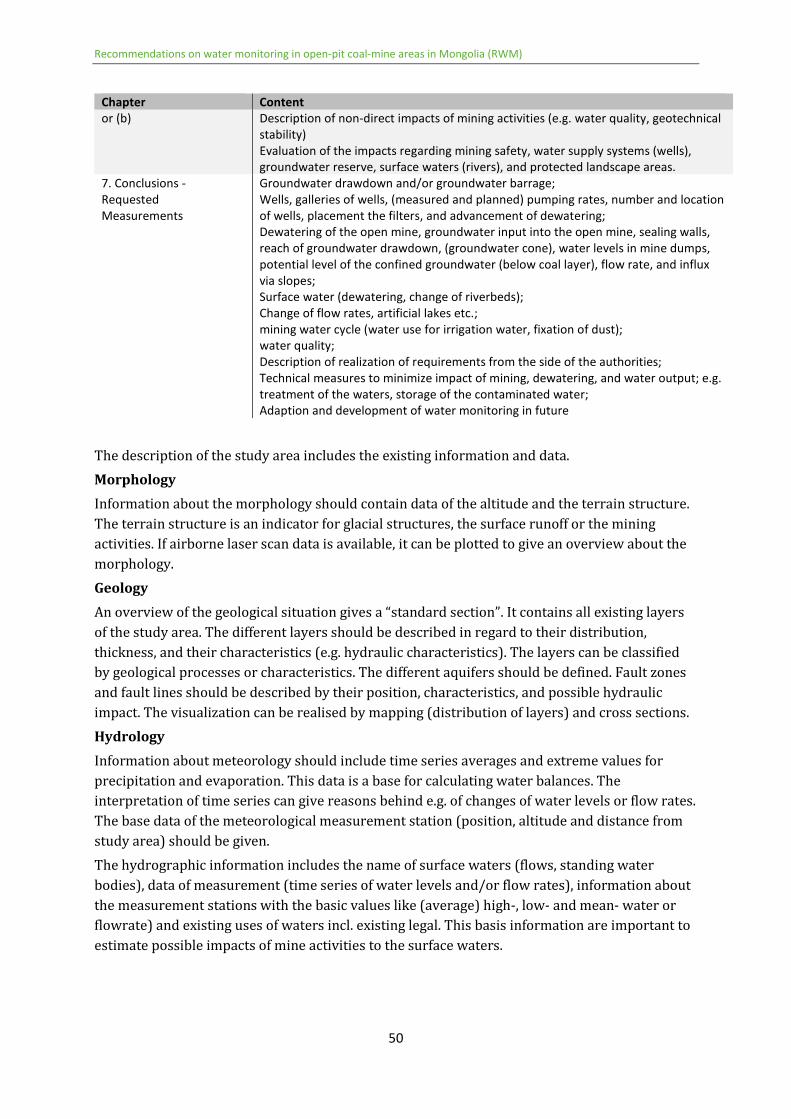
Table 9 Overview about the documentation of Hydrogeological Studies 49
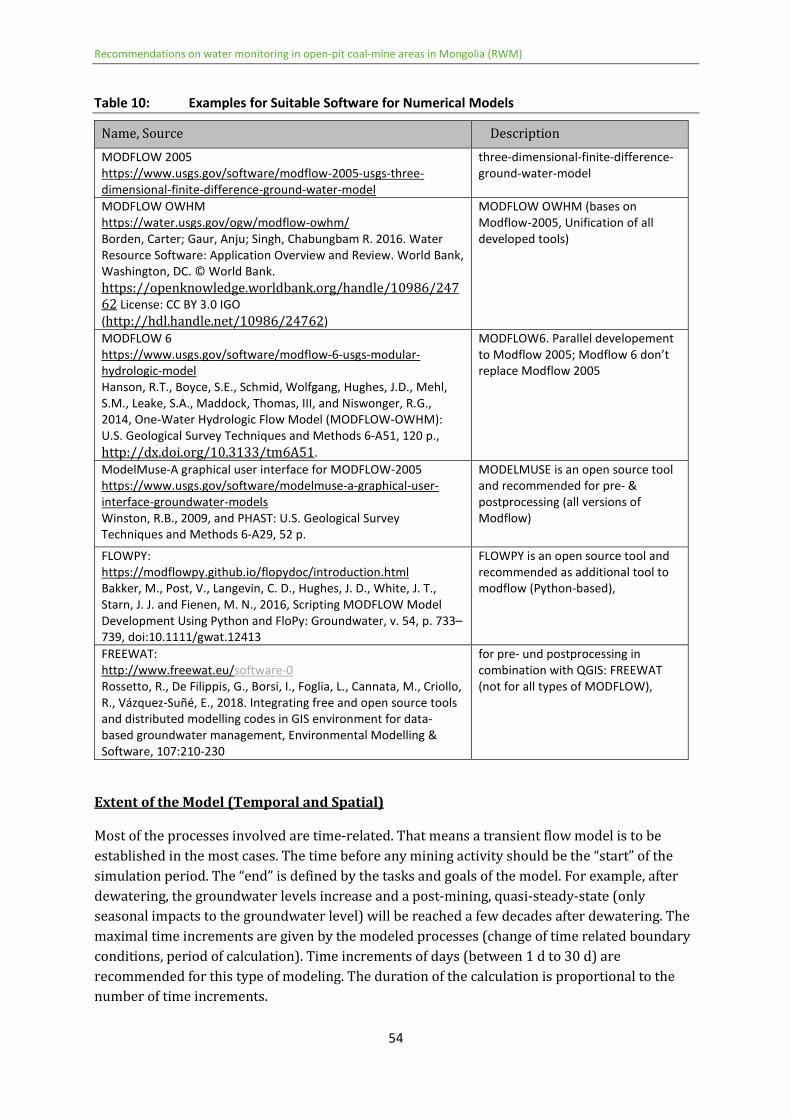
Table 10 Examples for Suitable Software for Numerical Models 54
Recommendations on water monitoring in open-pit coal-mine areas in Mongolia (RWM)
10
Summary
Coal mining is a growing part of the Mongolian mining industry and supplies Mongolias most
prevalent energy source Therefore thorough longterm planning of mining projects is crucial
because of their impacts on the economic social and natural environment Additionally existing
coal mining practices are in need of practical recommendations for minimizing negative impacts
on the environment and for optimizing operating expenditures to fulfill legal commitments
The majority of coal-mining activities impact the water balances andor the quality of local
waters Dewatering the deposit is a requirement for mining in many cases which in the case of
open-pit coal mines draws down the groundwater level within a large area Furthermore
hydrochemical reactions and the use of water for operational processes can change chemical
characteristics of water The limitation of water resources in Mongolia requires that this
resource be protected As the effects of mining on water resources is unavoidable the
government of Mongolia is aware of these impacts and regulates the mining activities on
different levels Their aim is to minimize the negative environmental impacts of mining which
includes obligating mining companies to conduct sustainable water management
Monitoring and understanding the local water system provides a basis for a more sustainable
and efficient water management Mining companies are therefore required by law to integrate
water monitoring into their operations Numerous legal regulations partially based on
international standards exist However because detailed comprehensive specifications for the
interpretation documentation and reporting of monitoring results are not available at present
it is difficult for water authorities to audit and evaluate monitoring reports Furthermore mining
companies are unlikely to profit directly from improving their dewatering methods There are
however numerous benefits that can be realized through improvements and optimizations in
dewatering management which can be achieved through the evaluation of monitoring results
This document gives recommendations concerning the planning and technical realization of
water monitoring systems for open-pit coal mines while providing particular focus on the
interpretation documentation and reporting of monitoring results These recommendations are
based on the site visits to Mongolian open-pits mines as well as experiences from water
monitoring in lignite mining in Germany which have been adapted by considering the current
conditions in Mongolia
These recommendations are intended for managers at the operational level but they may also
be useful for environmental officials competent authorities non-government organizations
students and people with a general interest in the best practices associated with monitoring the
quality and quantity of ground and surface waters in and around open-pit coal mines The goal
of this work is to improve the mining industryrsquos environmental performance
Recommendations on water monitoring in open-pit coal-mine areas in Mongolia (RWM)
11
1 Forward
Water is one of the environmental resources that in addition to air and soil are impacted by
mining activities Mining activities can affect water quantity andor quality and can pose a risk
to water resources In many cases mining operations change the hydrological hydrogeological
and topographical characteristics of the mining areas Changes in surface runoff soil moisture
groundwater dynamic water quality and evapotranspiration can also persist long into the post-
mining phase
Sound management practices are a fundamental component of mining operations for mitigating
the impact on water balances and water quality for both surface and groundwater resources in a
responsible manner These practices are to be carried out throughout the life cycle of a mine as
well as post-closure on both a local and regional scale Water monitoring is a legal requirement
(see Fig 1) and is a part of negotiations with authorities for a mining permit
An accurate and reliable database is an essential component of many environmental
management plans The objectives of water monitoring programs include
Documentation of the base line situation for the mining project
Monitoring the water usage within the site This also provides companies with
opportunities for internal cost controlling and optimization regarding water reuse
Identification of sources and extent of pollution Actions to mitigate these risks may include
implementing a water treatment technology or further process control
Assessment of the impact of water reuse and management as well as the impact of the
mining activities on the regional water balance
Calibration and verification of numerical groundwater models against measured data for
improved prediction and assessment of future states
Improved planning for decommissioning and closure procedures regarding required actions
and financial provisions based on the numerical groundwater models
Establishment of environmental and water management plans based on impact and incident
monitoring for the mine and the surrounding region These plans facilitate decision making
and serve as an early warning system for indicating necessary preventive and remedial
measures in certain areas
Auditing of compliance with set standards and legislation and evaluation of the success of
implemented management actions
In this document water monitoring is defined as the recording documentation and
interpretation of water quantity and quality of surface and groundwater by mining companies
These recommendations do not go deep into the theoretical background of hydrology and
hydrogeology rather they are focused on the design implementation and operating procedures
of monitoring as well as the documentation and interpretation of data and conclusions for the
water management Particular emphasis is put on data interpretation
Recommendations on water monitoring in open-pit coal-mine areas in Mongolia (RWM)
12
2 Introduction
Mining and Water
The following recommendations are in regard to groundwater necessary groundwater drainage
in open pit coal mining and groundwater contact with surface waters
Classically the water table is lowered using preliminary drainage reducing the volume of the
groundwater body Changes in the groundwater composition such as an increase in the salt or
fluorine concentrations may result Dewatering of the pit itself follows which captures the
diffuse groundwater and precipitating water influx The pumped water is partially used as clean
process water such as in dust collection or as water for plants in re-cultivation areas and is
directed either into an artificial lake or into receiving waters In a few cases the receiving waters
need to be relocated in order to secure the open-pit
In the rear end of the open-pit mine as well as in post mining conditions another increase of the
groundwater table follows The interim introduction of air to the underground area causes
geochemical processes to be activated which result in mostly negative consequences for
groundwater quality
Goals and Outputs of Water Monitoring in Mining Areas
The objectives of the monitoring are
Monitoring the safety of the mining operations with regard to water
A priority of the mining operations is also to secure the safety of the mining employees An
influx of water can endanger the geotechnical stability of the pit Data for the groundwater
level and incoming water flow is the most important prerequisite for the implementation of
water drainage measures and their monitoring The behaviour of the ground and surface
water can be derived from the water monitoring Through the appropriate water drainage
measures the safety of the mine should be ensured
Provide necessary basics for the planning monitoring control and optimization of water
drainage measures
The mining of resources (coal) in open pits is only possible if the water table is lowered
From the results of the water monitoring conclusions can be drawn about how the
dewatering process can be carried out In most cases the inflowing water stream varies
with time for example with seasonal changes in such a way that the water drainage is
controlled For this control the results from monitoring are required Drainage is very cost-
intensive however with the analysis of the water monitoring data the drainage process can
be optimized so that the accompanying costs can be greatly reduced
The impacts of mining operations on the evironment are to be minimized as much as possible
That means that avoiding and minimizing consumption are the highest priorities The
contamination of water is to be prevented or minimized by implementing necessary
management measures or strategies One strategy is to reclaim and reuse contaminated water in
cases where total pollution prevention is not possible Treating water that cannot be reused is
Recommendations on water monitoring in open-pit coal-mine areas in Mongolia (RWM)
13
another example of a strategy for contamination prevention The discharge or disposal of water
is the lowest priority The implementation of these measures may accompany the monitoring
phase or may be carried out after reliable results are obtained
Fundamentally the following requirements should be fulfilled
A basis for sharing transparent information to the public exists including warnings for
health risks caused by water quality
Mining companies should be held responsible for the realization of water protection
directives
Authorities need to have confidence that the mining companies will work responsibly
The public and NGOs should have confidence in the work of authorities overseeing the
mining companies
Compliance with set standards and legislation such as Integrated Water Use licenses and
Environmental Management Plans etc is audited
The impacts of the mining operations and activities on the receiving water balance are
assessed
Various hydrogeological models for prediction and assessment are to be verified and
calibrated This includes planning the financial provisions and required actions
fordecommissioning and closure
The following details regarding water quantity are to be recorded for the understanding
determination and documentation of the hydraulic system groundwater levels flow direction
trends climate water balance water users infiltration into groundwater input into surface
water groundwater catchment and the interaction between ground and surface water Within
the framework of water balances the climatic water balance the quantity inflowing and
outflowing waters and an estimation of the influence of dewatering are to be taken into
consideration for the extraction of the impact of mining activity After the mining efforts are
complete a steady self-regulated water balance should be established and managed for the
purpose of minimizing water deficits that could arise through the evaporation of surface water
Within the topic of water quality the following key points are to be addressed
Qunatitative description of the original water quality before the influence of mining
activities
Quantitative estimation of the impact of mining on the quality of waters (ie the change in
water quality)
Understanding of the limits and standards for water discharge quantities and
concentrations as well as the establishment of accurate records for actual discharge values
in comparison to these limits
Determination of any existing local contaminations which were not caused by the current
mining activities
Estimation of hydrochemical processes both natural and those caused by mining and
Recommendations on water monitoring in open-pit coal-mine areas in Mongolia (RWM)
14
Quantitative estimation of the future changes and developments to the water quality
Legal Framework and Standards
In addition to applying for a water license the mine developers should include a proposal for the
monitoring program describing the scope of measurement points chemical analyses reporting
time intervals etc This proposal might be subject for approval and modification by the licensing
authority The final water license states the requirements for monitoring to be carried out
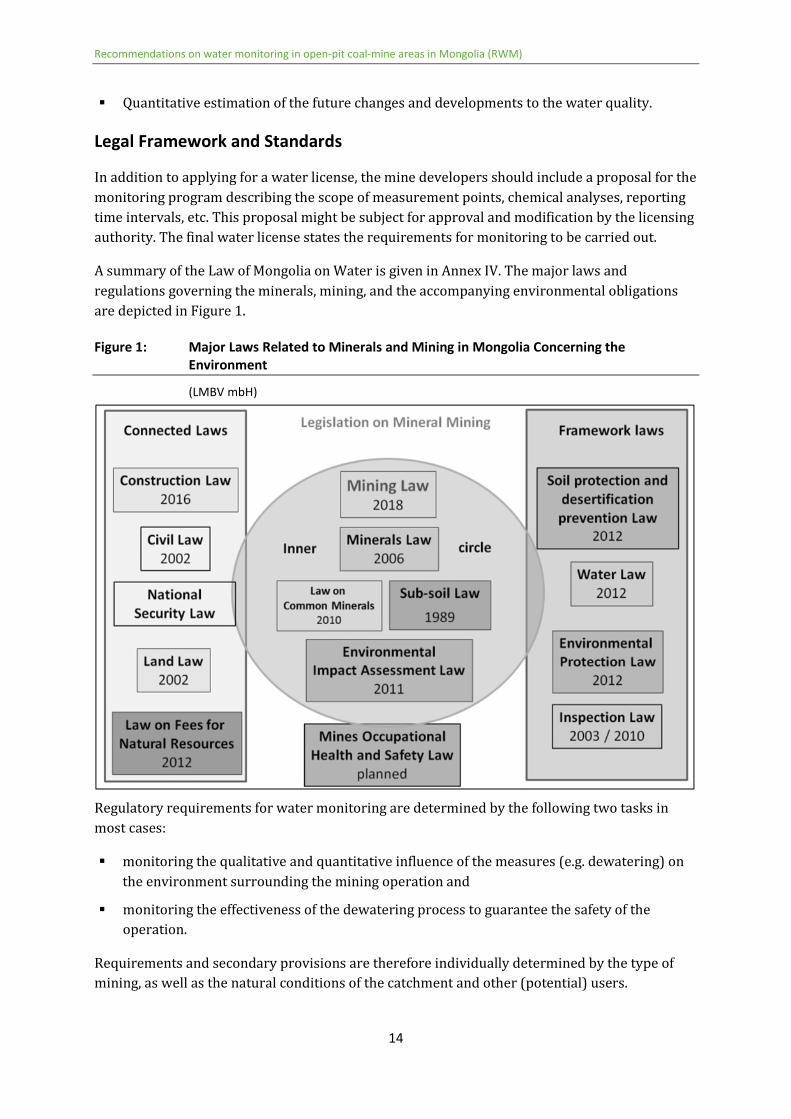
A summary of the Law of Mongolia on Water is given in Annex IV The major laws and
regulations governing the minerals mining and the accompanying environmental obligations
are depicted in Figure 1
Figure 1 Major Laws Related to Minerals and Mining in Mongolia Concerning the
Environment
(LMBV mbH)
Regulatory requirements for water monitoring are determined by the following two tasks in
most cases
monitoring the qualitative and quantitative influence of the measures (eg dewatering) on
the environment surrounding the mining operation and
monitoring the effectiveness of the dewatering process to guarantee the safety of the
operation
Requirements and secondary provisions are therefore individually determined by the type of
mining as well as the natural conditions of the catchment and other (potential) users
Recommendations on water monitoring in open-pit coal-mine areas in Mongolia (RWM)
15
Regulations and standards concerning water monitoring and water management are listed in
Annex V
Processes and Outputs of Water Monitoring
Water monitoring is to be conducted throughout the entire mining cycle which comprises the
following phases
Feasibility Study and Planning Phase including exploration (I)
Operational Phase (II)
Closure Phase Post-Mining Phase (III)
Post-Operation Phase (after rehabilitation hydraulic steady state) (IV)
The engineering and consulting services which are to be developed for water monitoring and
integrated water management during the mine cycle are listed below
Feasibility and Planning Phase (Before Mining)
An exact description of the initial unmodified state of the hydrological and hydrogeological
conditions is an integral component of monitoring This description should include
groundwater dynamic characteristics groundwater flow direction flow gradient seasonal
changes of groundwater levels
a full quanititative analysis of groundwater quality
surface water characteristics water levels flow rates seasonal variations and
a full quanititative analysis of surface water quality
Because it is impossible to reproduce the data describing the original state after mining has
commenced special attention needs to be devoted to gathering this invaluable information
beforehand The pre-mining monitoring phase should be cover 3 ndash 5 years to capture data over
varying weather and climate conditions The goal is to establish a local (unmodified) water
balance
Water management practices in this phase consist of
evaluation of different process designs in order to optimize the overall water balance in the
affected area including reuse and recovery strategies
identification of potential water sources
determination of water quantity and quality requirements based on the different process
designs
investigation of opportunities for water reuse and recovery
development of a strategic plan and measurable performance targets and
the combination of all points above into an integrated water management plan
Recommendations on water monitoring in open-pit coal-mine areas in Mongolia (RWM)
16
Here ldquoprocess designrdquo refers to the mining companiesrsquo individual proposed plans for
monitoring drainage water use and mining activities
Operational Phase
During the operational phase the impact of dewatering on the groundwater dynamic is to be
monitored This entails monitoring the scope of groundwater extraction the dimensions of the
catchment area and the drop in the water level (potential level) in the mine and the surrounding
areas and for example at drinking water wells nearby The flow rates and water levels of
surface waters may also be affected by dewatering procedures One possible outcome is that a
higher surface water flowrate into the aquifer causes the surface water levels or flow rates to
decrease Continuous measurement of all water input and output rates is therefore obligatory
The water balances are to be calculated for the operational phase taking different scenarios
with varying extraction rates into account
Changes of the water quality (eg acid mine drainage) may be caused by aeration of the
overburden due to the extraction of waters the infiltration of extracted waters into ground- or
surface waters Continuous sampling and analysis are important in detecting possible changes in
the water quality
Closure Phase and Post-Mining
The post-mining phase can be divided into two sub-phases the transient phase and the quasi-
steady-state phase The groundwater level (potential level) will rise after dewatering processes
are terminated While a stable water level has not yet been established in this transient phase
continuous measurements of ground- and surface water levels are necessary for monitoring
changes and planning required measures accordingly In the quasi-steady-state phase a stable
water table has again been established and depends therefore only on climate conditions
which affect the groundwater recharge rate The frequency and extent of water quantity
measurements may be successively reduced throughout the transient phase if the data shows
little to no fluctuation over time
In many cases changes in water quality after mining as well as after dewatering can be
observed This can often be attributed to chemical reactions between aerated tailings material
and water which might cause acid mine drainage in cases where sulfur-rich material is involved
Dissolution of minerals ie salt may also have an effect Special attention needs to be paid to
identifying potential reactions such as these in order to prevent or mitigate negative long-term
effects
Preliminary Characterization of the System
A first estimation of the geological hydrological and hydrogeological state provides a necessary
foundation for the conception of a water monitoring plan This first estimation relies on
generally available data mostly on the internet and existing studies or expert opinions over the
area being studied
Basic information about geology hydrology and hydrogeology exist for nearly each region of the
world While the spatial solution may be very large it is possible to obtain an overview of
important background knowledge such as sedimentary or hard rock aquifers existing surface
Recommendations on water monitoring in open-pit coal-mine areas in Mongolia (RWM)
17
waters and climate conditions without any exploration results in most cases The study of this
background information is important for the planning of further geological hydrological or
hydrogeological investigations The websites found in Annex III Table III-1 contain such
background information
In other cases results of former investigationsmdashsuch as for draining water wells former mines
or the exploration of other resources may exist The first step is searching for this information If
a mine already exists any available results reports or data should be analysed and interpreted
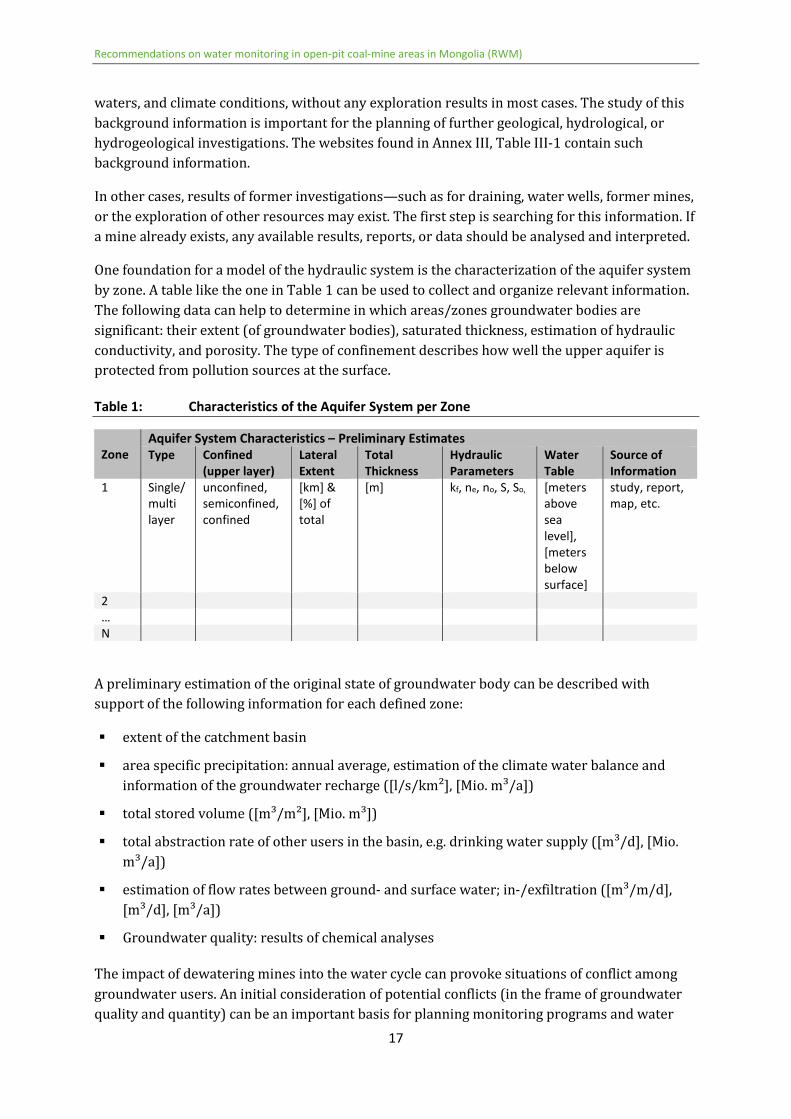
One foundation for a model of the hydraulic system is the characterization of the aquifer system
by zone A table like the one in Table 1 can be used to collect and organize relevant information
The following data can help to determine in which areaszones groundwater bodies are
significant their extent (of groundwater bodies) saturated thickness estimation of hydraulic
conductivity and porosity The type of confinement describes how well the upper aquifer is
protected from pollution sources at the surface
Table 1 Characteristics of the Aquifer System per Zone
A preliminary estimation of the original state of groundwater body can be described with
support of the following information for each defined zone
extent of the catchment basin
area specific precipitation annual average estimation of the climate water balance and
information of the groundwater recharge ([lskmsup2] [Mio msup3a])
total stored volume ([msup3msup2] [Mio msup3])
total abstraction rate of other users in the basin eg drinking water supply ([msup3d] [Mio
msup3a])
estimation of flow rates between ground- and surface water in-exfiltration ([msup3md]
[msup3d] [msup3a])
Groundwater quality results of chemical analyses
The impact of dewatering mines into the water cycle can provoke situations of conflict among
groundwater users An initial consideration of potential conflicts (in the frame of groundwater
quality and quantity) can be an important basis for planning monitoring programs and water
Zone
Aquifer System Characteristics ndash Preliminary Estimates
Type Confined
(upper layer)
Lateral
Extent
Total
Thickness
Hydraulic
Parameters
Water
Table
Source of
Information
1 Single
multi
layer
unconfined
semiconfined
confined
[km] amp
[] of
total
[m] kf ne no S So [meters
above
sea
level]
[meters
below
surface]
study report
map etc
2
hellip
N
Recommendations on water monitoring in open-pit coal-mine areas in Mongolia (RWM)
18
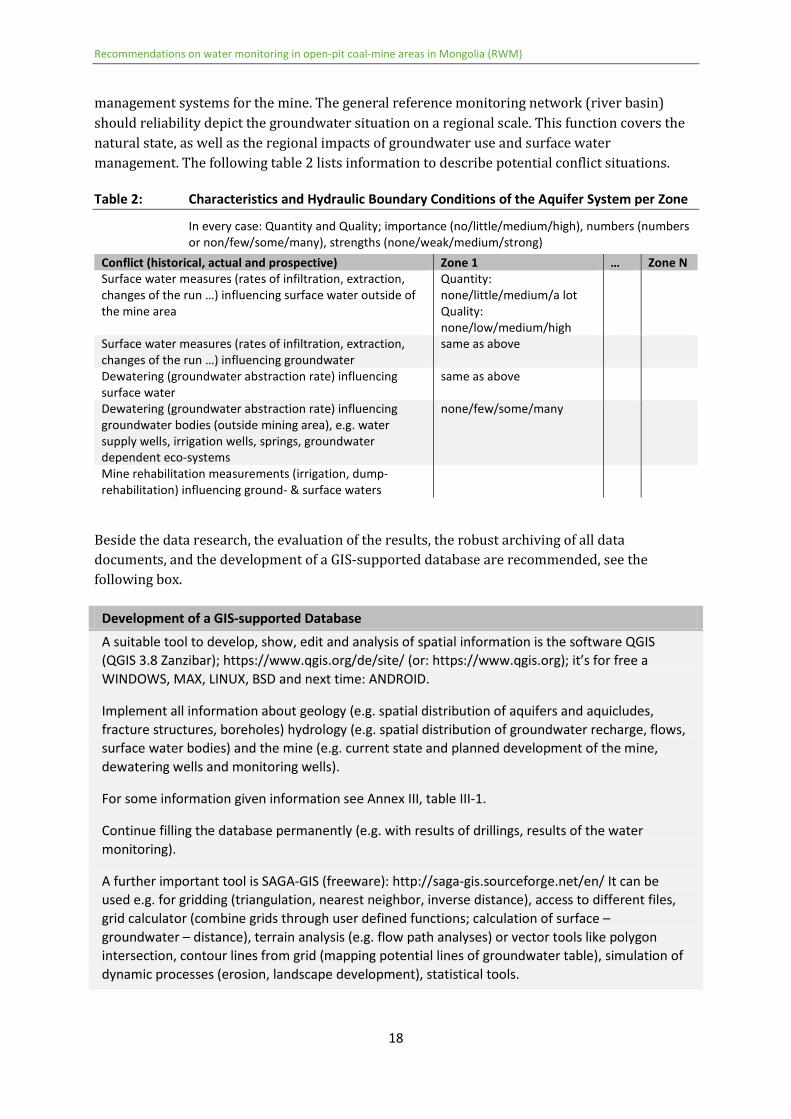
management systems for the mine The general reference monitoring network (river basin)
should reliability depict the groundwater situation on a regional scale This function covers the
natural state as well as the regional impacts of groundwater use and surface water
management The following table 2 lists information to describe potential conflict situations
Table 2 Characteristics and Hydraulic Boundary Conditions of the Aquifer System per Zone
In every case Quantity and Quality importance (nolittlemediumhigh) numbers (numbers
or nonfewsomemany) strengths (noneweakmediumstrong)
Conflict (historical actual and prospective) Zone 1 hellip Zone N
Surface water measures (rates of infiltration extraction
changes of the run hellip) influencing surface water outside of
the mine area
Quantity
nonelittlemediuma lot
Quality
nonelowmediumhigh
Surface water measures (rates of infiltration extraction
changes of the run hellip) influencing groundwater
same as above
Dewatering (groundwater abstraction rate) influencing
surface water
same as above
Dewatering (groundwater abstraction rate) influencing
groundwater bodies (outside mining area) eg water
supply wells irrigation wells springs groundwater
dependent eco-systems
nonefewsomemany
Mine rehabilitation measurements (irrigation dump-
rehabilitation) influencing ground- amp surface waters
Beside the data research the evaluation of the results the robust archiving of all data
documents and the development of a GIS-supported database are recommended see the
following box
Development of a GIS-supported Database
A suitable tool to develop show edit and analysis of spatial information is the software QGIS
(QGIS 38 Zanzibar) httpswwwqgisorgdesite (or httpswwwqgisorg) itrsquos for free a
WINDOWS MAX LINUX BSD and next time ANDROID
Implement all information about geology (eg spatial distribution of aquifers and aquicludes
fracture structures boreholes) hydrology (eg spatial distribution of groundwater recharge flows
surface water bodies) and the mine (eg current state and planned development of the mine
dewatering wells and monitoring wells)
For some information given information see Annex III table III-1
Continue filling the database permanently (eg with results of drillings results of the water
monitoring)
A further important tool is SAGA-GIS (freeware) httpsaga-gissourceforgeneten It can be
used eg for gridding (triangulation nearest neighbor inverse distance) access to different files
grid calculator (combine grids through user defined functions calculation of surface ndash
groundwater ndash distance) terrain analysis (eg flow path analyses) or vector tools like polygon
intersection contour lines from grid (mapping potential lines of groundwater table) simulation of
dynamic processes (erosion landscape development) statistical tools
Recommendations on water monitoring in open-pit coal-mine areas in Mongolia (RWM)
19
3 Definition of Monitoring Objects
The diversity of climates ecosystems land uses different water users and topography
influences the design of a monitoring program Thus the resulting monitoring program should
be tailored to meet a specific set of needs and expectations of the site and will need to consider
regional physical and social factors
Each of the management actions has unique objectives and monitoring requirements These
objectives should be clearly defined measurable and implementable The development of
environmental and water management plans identification of sources of pollution and
assessment of compliance with set standards are examples of typical management actions that
require the results of a monitoring program
Examples of items to be monitored are groundwater soil water surface waters or other
parameters of the water cycle like precipitation evapotranspiration and groundwater recharge
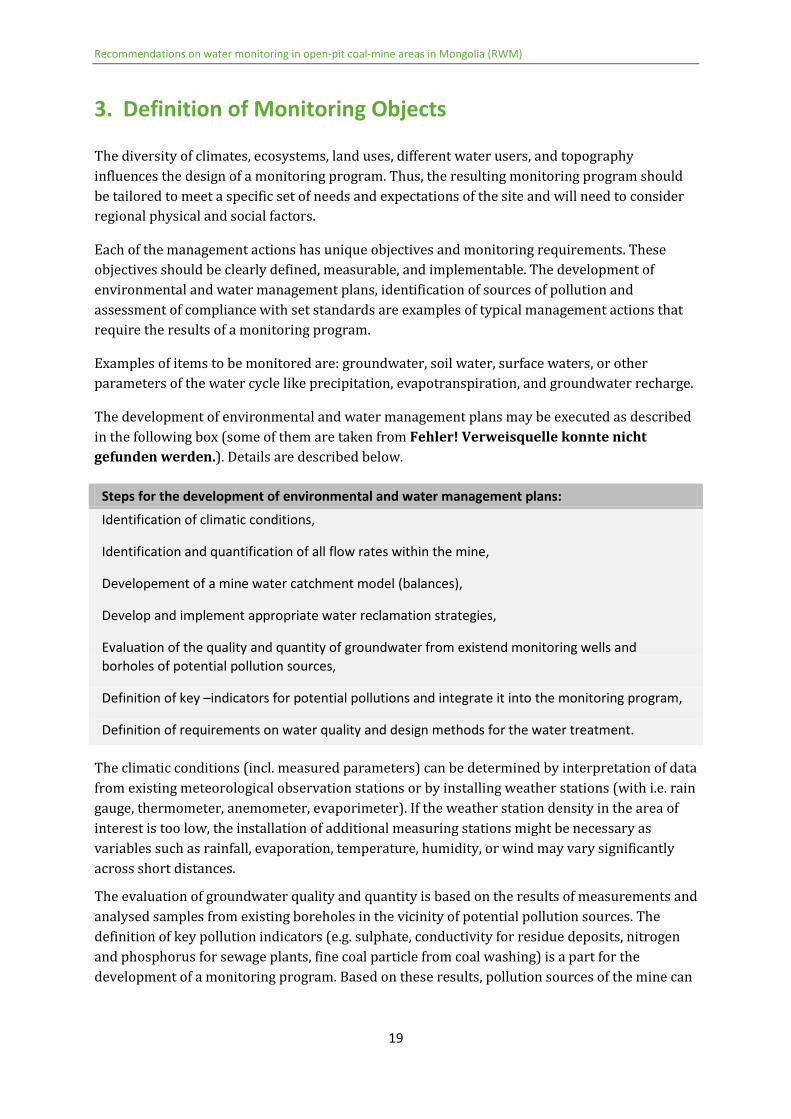
The development of environmental and water management plans may be executed as described
in the following box (some of them are taken from Fehler Verweisquelle konnte nicht
gefunden werden) Details are described below
Steps for the development of environmental and water management plans
Identification of climatic conditions
Identification and quantification of all flow rates within the mine
Developement of a mine water catchment model (balances)
Develop and implement appropriate water reclamation strategies
Evaluation of the quality and quantity of groundwater from existend monitoring wells and
borholes of potential pollution sources
Definition of key ndashindicators for potential pollutions and integrate it into the monitoring program
Definition of requirements on water quality and design methods for the water treatment
The climatic conditions (incl measured parameters) can be determined by interpretation of data
from existing meteorological observation stations or by installing weather stations (with ie rain
gauge thermometer anemometer evaporimeter) If the weather station density in the area of
interest is too low the installation of additional measuring stations might be necessary as
variables such as rainfall evaporation temperature humidity or wind may vary significantly
across short distances
The evaluation of groundwater quality and quantity is based on the results of measurements and
analysed samples from existing boreholes in the vicinity of potential pollution sources The
definition of key pollution indicators (eg sulphate conductivity for residue deposits nitrogen
and phosphorus for sewage plants fine coal particle from coal washing) is a part for the
development of a monitoring program Based on these results pollution sources of the mine can
Recommendations on water monitoring in open-pit coal-mine areas in Mongolia (RWM)
20
be identified (eg residue deposits domestic waste landfill point discharges sewage treatment
plants processing plants mine shaft area)
The identification and quantification of all (relevant) water flow rates within the mine is an
essential part of water monitoring This includes the extraction (pumping) rates discharge rates
and infiltration rates Knowledge of water sources and sinks (eg drinking water wells)
including rates outside the mine are a basis for understanding the hydraulic system
The identification of current and future water uses and determination of their water quality and
quantity requirements are parts of planning strategies Critical water qualityquantity
parameters for all considered water treatment options (in terms of absolute values and
variability) are to be defined Upon evaluation of monitored water quality and quantity
parameters the need for water treatment may be indicated
Recommendations on water monitoring in open-pit coal-mine areas in Mongolia (RWM)
21
4 Groundwater
Use of Existing Groundwater SamplingMeasurement Points
Existing groundwater measurement points should be integrated into the monitoring program
but first they need to be tested for their functionality For the initial evaluation of an existing
measuring point the following steps are to be followed as described in [24]
Research and Compilation of the Existing Base Data (coordinates elevation and construction
details) The following data are to be sourced andor measured bore log construction drawing
depth location of the filter section diameter drilling method and drilling year and results of
measurements and sampling
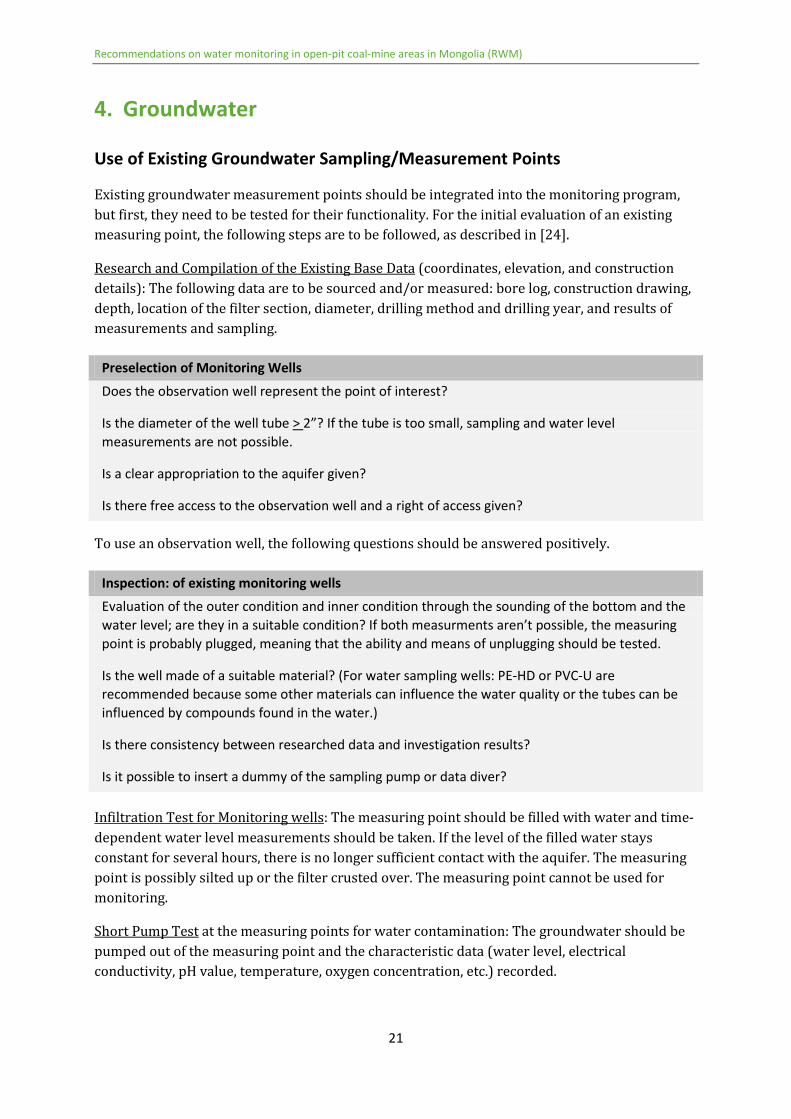
Preselection of Monitoring Wells
Does the observation well represent the point of interest
Is the diameter of the well tube gt 2rdquo If the tube is too small sampling and water level
measurements are not possible
Is a clear appropriation to the aquifer given
Is there free access to the observation well and a right of access given
To use an observation well the following questions should be answered positively
Inspection of existing monitoring wells
Evaluation of the outer condition and inner condition through the sounding of the bottom and the
water level are they in a suitable condition If both measurments arenrsquot possible the measuring
point is probably plugged meaning that the ability and means of unplugging should be tested
Is the well made of a suitable material (For water sampling wells PE-HD or PVC-U are
recommended because some other materials can influence the water quality or the tubes can be
influenced by compounds found in the water)
Is there consistency between researched data and investigation results
Is it possible to insert a dummy of the sampling pump or data diver
Infiltration Test for Monitoring wells The measuring point should be filled with water and time-
dependent water level measurements should be taken If the level of the filled water stays
constant for several hours there is no longer sufficient contact with the aquifer The measuring
point is possibly silted up or the filter crusted over The measuring point cannot be used for
monitoring
Short Pump Test at the measuring points for water contamination The groundwater should be
pumped out of the measuring point and the characteristic data (water level electrical
conductivity pH value temperature oxygen concentration etc) recorded
Recommendations on water monitoring in open-pit coal-mine areas in Mongolia (RWM)
22
Other criteria for the usability of the monitoring points are location and accessibility standard-
conforming installation as well as general physical condition installation and age of the
measuring point
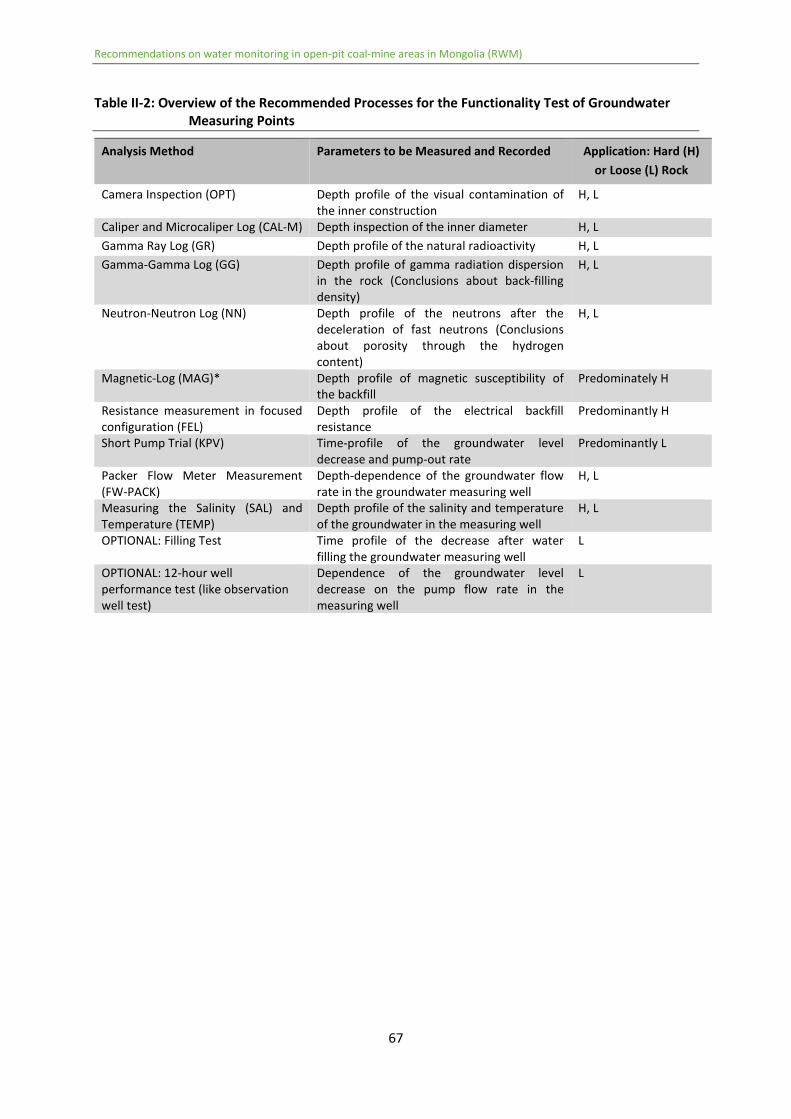
For a comprehensive functionality test the processes listed in Annex II table II-2 is suggested
Planning of Positions for (New) Groundwater Observation Wells
The monitoring boreholes cannot be randomly located but should be placed at the most suitable
location to accurately collect the required data The groundwater flow directions vertical limits
of different aquifers depth of the groundwater table pollution source locations pollution
plumes etc all need to be considered If the measuring points are positioned at the wrong or
poorly established (eg too shallow) location the resulting data may lead to incorrect
interpretation and therefore to wrong decisions
The exact location of the monitoring points should be clearly marked on a map in such a way
that it can be found by an external party This may be achieved by GPS referencing or by using
GIS-software to produce a reliable map with suitable background information such as
topography infrastructure rivers or buildings
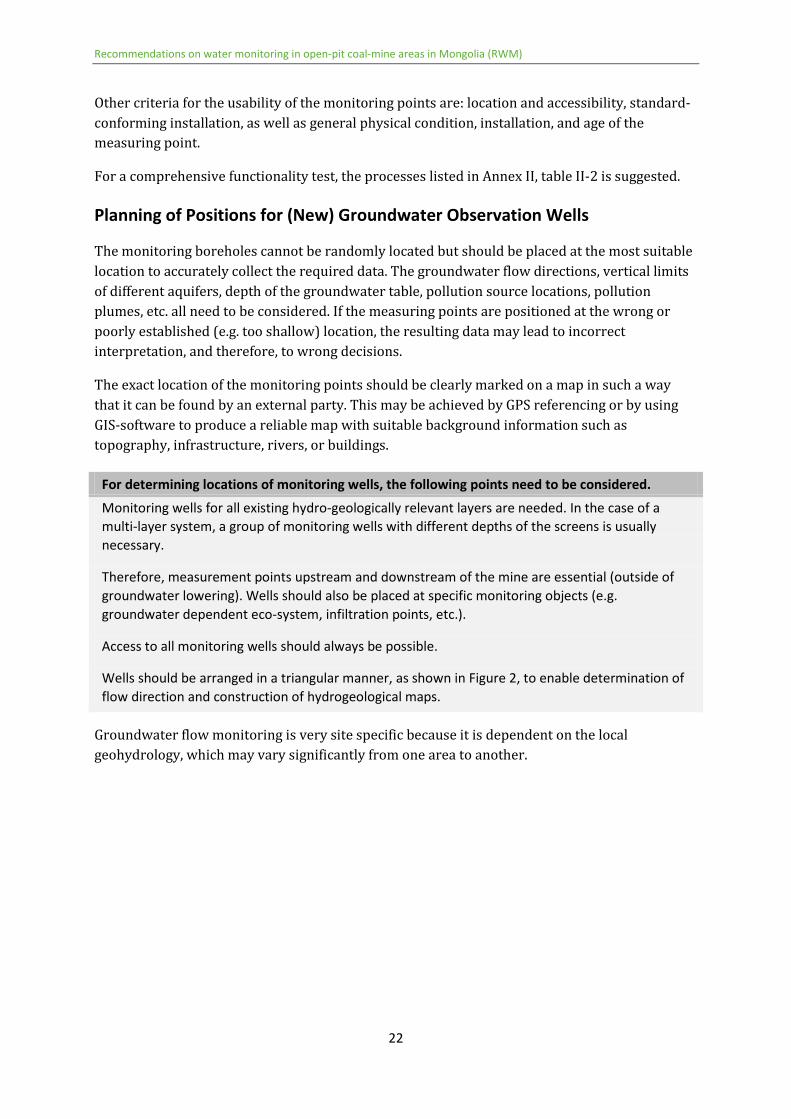
For determining locations of monitoring wells the following points need to be considered
Monitoring wells for all existing hydro-geologically relevant layers are needed In the case of a
multi-layer system a group of monitoring wells with different depths of the screens is usually
necessary
Therefore measurement points upstream and downstream of the mine are essential (outside of
groundwater lowering) Wells should also be placed at specific monitoring objects (eg
groundwater dependent eco-system infiltration points etc)
Access to all monitoring wells should always be possible
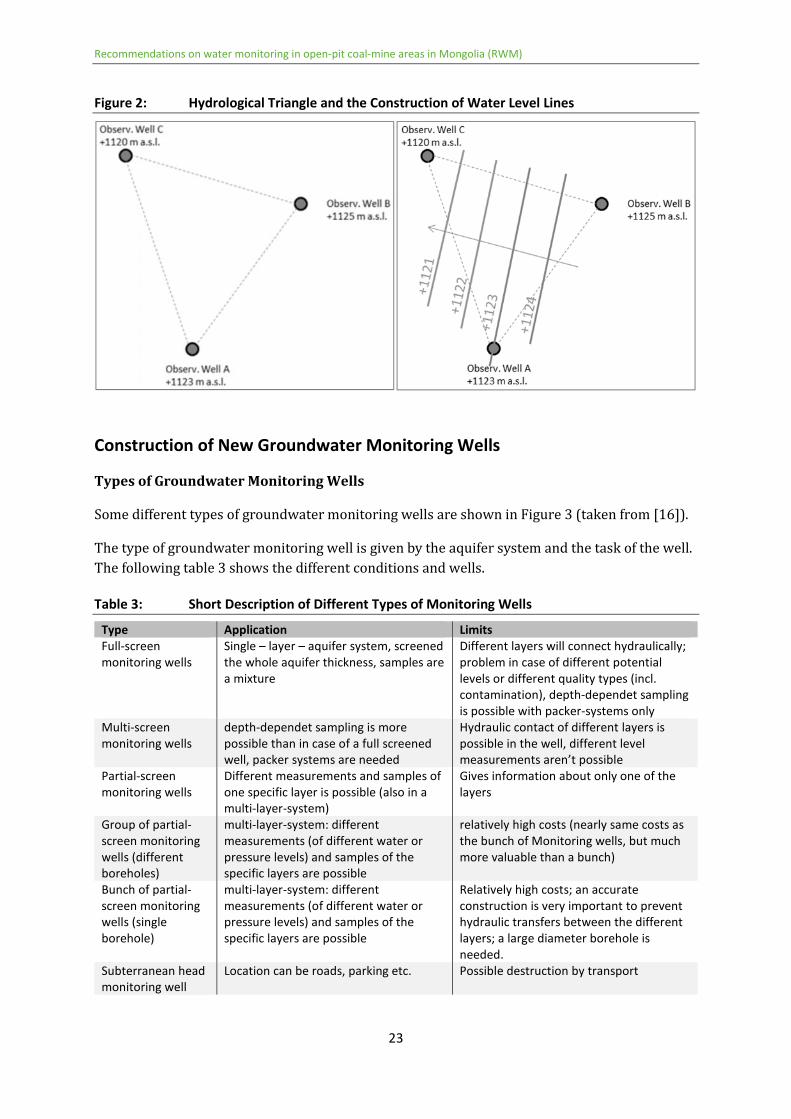
Wells should be arranged in a triangular manner as shown in Figure 2 to enable determination of
flow direction and construction of hydrogeological maps
Groundwater flow monitoring is very site specific because it is dependent on the local
geohydrology which may vary significantly from one area to another
Recommendations on water monitoring in open-pit coal-mine areas in Mongolia (RWM)
23
Figure 2 Hydrological Triangle and the Construction of Water Level Lines
Construction of New Groundwater Monitoring Wells
Types of Groundwater Monitoring Wells
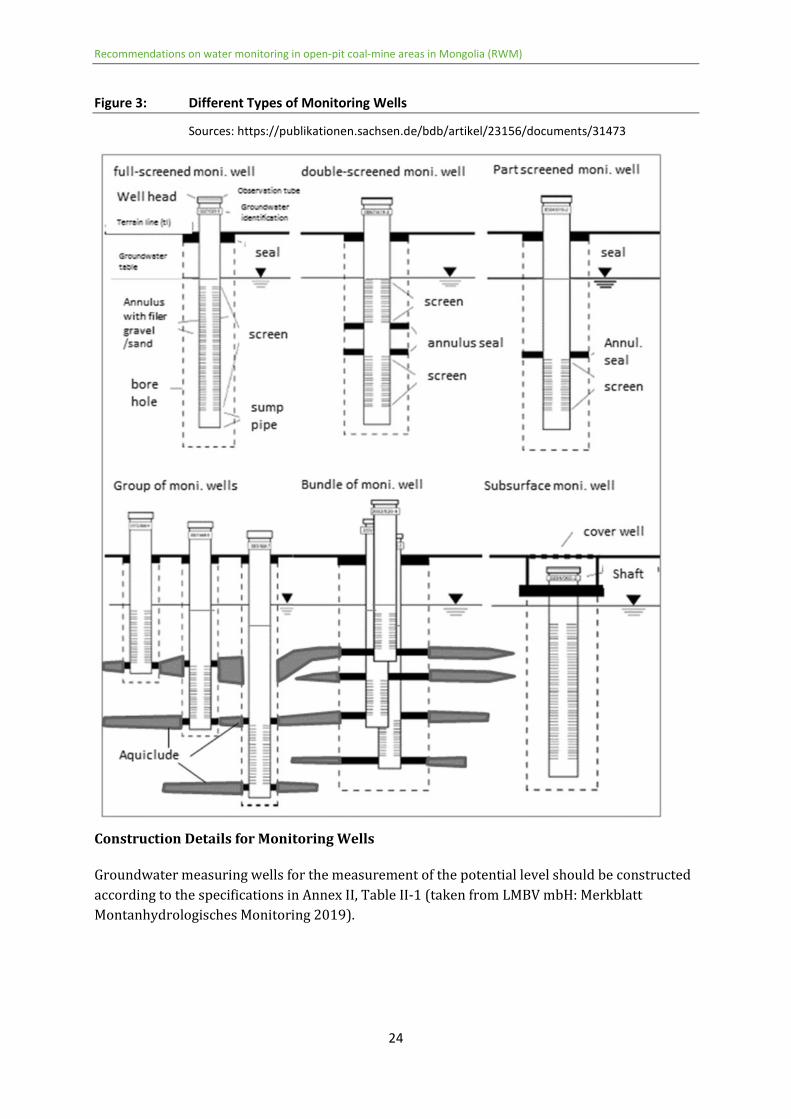
Some different types of groundwater monitoring wells are shown in Figure 3 (taken from [16])
The type of groundwater monitoring well is given by the aquifer system and the task of the well
The following table 3 shows the different conditions and wells
Table 3 Short Description of Different Types of Monitoring Wells
Type Application Limits
Full-screen
monitoring wells
Single ndash layer ndash aquifer system screened
the whole aquifer thickness samples are
a mixture
Different layers will connect hydraulically
problem in case of different potential
levels or different quality types (incl
contamination) depth-dependet sampling
is possible with packer-systems only
Multi-screen
monitoring wells
depth-dependet sampling is more
possible than in case of a full screened
well packer systems are needed
Hydraulic contact of different layers is
possible in the well different level
measurements arenrsquot possible
Partial-screen
monitoring wells
Different measurements and samples of
one specific layer is possible (also in a
multi-layer-system)
Gives information about only one of the
layers
Group of partial-
screen monitoring
wells (different
boreholes)
multi-layer-system different
measurements (of different water or
pressure levels) and samples of the
specific layers are possible
relatively high costs (nearly same costs as
the bunch of Monitoring wells but much
more valuable than a bunch)
Bunch of partial-
screen monitoring
wells (single
borehole)
multi-layer-system different
measurements (of different water or
pressure levels) and samples of the
specific layers are possible
Relatively high costs an accurate
construction is very important to prevent
hydraulic transfers between the different
layers a large diameter borehole is
needed
Subterranean head
monitoring well
Location can be roads parking etc Possible destruction by transport
Recommendations on water monitoring in open-pit coal-mine areas in Mongolia (RWM)
24
Figure 3 Different Types of Monitoring Wells
Sources httpspublikationensachsendebdbartikel23156documents31473
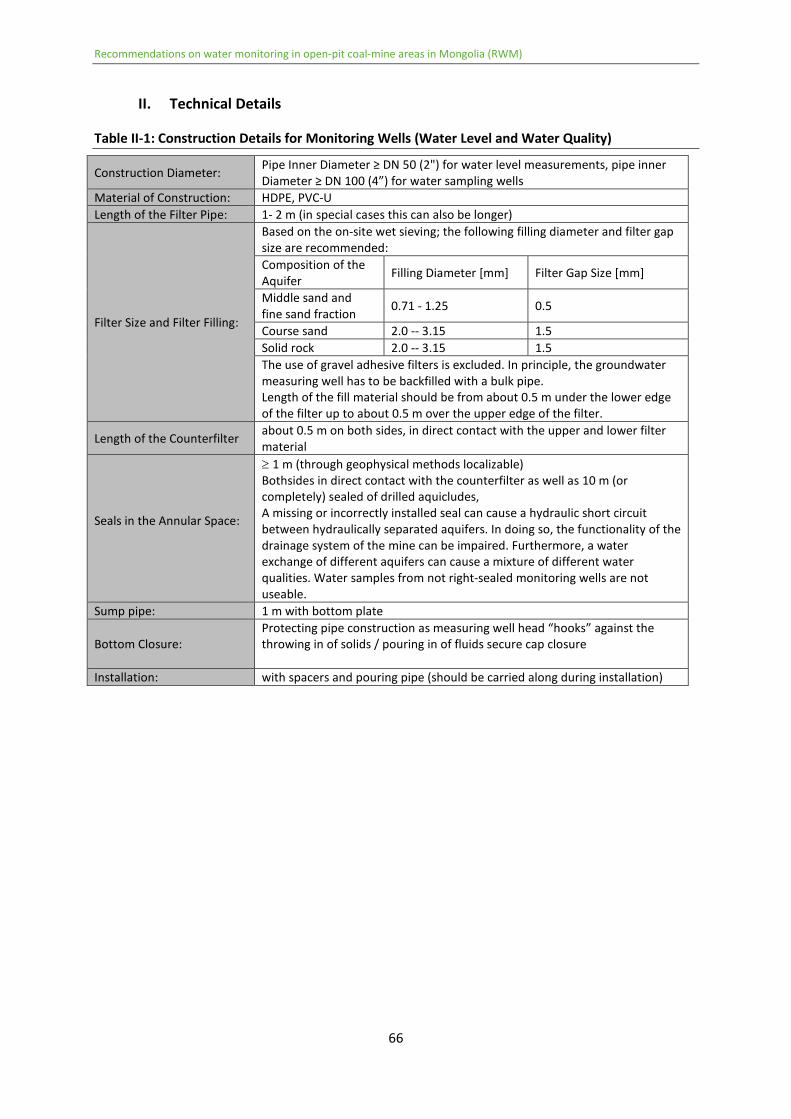
Construction Details for Monitoring Wells
Groundwater measuring wells for the measurement of the potential level should be constructed
according to the specifications in Annex II Table II-1 (taken from LMBV mbH Merkblatt
Montanhydrologisches Monitoring 2019)
Recommendations on water monitoring in open-pit coal-mine areas in Mongolia (RWM)
25
Recommendation for a Multi-Layer System
Groundwater levels and water quality should be measured for each aquifer seperately in the case
of a multi-layer system
The different aquifers must not be connected eg at the construction of monitoring wells
Aquitards (aquicludes) should be sealed in boreholes by hydraulic barriers like clay seals
Contaminations of the water can be dispersed throughout different aquifers in the case of
connected layers The conditions of flow and pressure can be changed by connecting aquifers
Unregulated water outputs and chemical reactions between water and the rock matrix can be a
consequence of connected aquifers
The construction of measuring point bundles makes an effective hydraulic seal difficult In the case
of different aquifers the construction of a group of monitoring wells is recommended
Monitoring Program
Measuring borehole depths and the water levels in them should be a standard part of a
groundwater monitoring program Groundwater levels can be measured using electrical contact
tape float mechanism or pressure transducer The following factors must be considered in
groundwater flow topography streams stream flow fountains dams geology and excavations
The usual measurement frequency of the groundwater level and pressure is once per quarter
which allows seasonal changes to be detected However the frequency of required observation
can be different among sites or monitoring wells (eg depending on the dewatering wells) The
frequency of measurements depends on the type and position of the aquifer the groundwater
dynamic aquifer development and climate conditions
Frequency of measurement should be
Denser for shallow unconfined aquifers because the seasonal change of water level is higher than
for deeper and confined aquifers
Denser for rapid groundwater flow (high hydraulic gradient) than for slow groundwater flow
Denser for more intensive groundwater drawdown (eg short distance to the dewatering system)
than for less withdrawal and small drawdown (higher distance to dewatering wells)
Denser for more variable climatic conditions (incl high groundwater recharge) than for less
variable conditions (eg small seasonal changes)
The frequency should be adapted with respect to these conditions and interpretation of the
monitoring results
Measuring groundwater level is a technical procedure that should be undertaken by a suitably
qualified person The forms found in Annex I Table I-2 should be used for the documentation of
the measurements The sampling interval should be once per year (MarchApril) at a minimum
If two samplings per year are possible the months MarchApril (1st) and SeptemberOctober
(2nd) are recommended
Recommendations on water monitoring in open-pit coal-mine areas in Mongolia (RWM)
26
Groundwater Sampling
The MNS (ISO) 5667-X consisting of several parts is a guideline for taking water samples The
following text doesnrsquot replace this guideline but it should give some additional practical tips
Preparation of Sampling
The technical functionality should be checked according to the device-specific requirements The
calibration of all measuring tools is necessary before every monitoring campaign and during the
campaigns in the case of different water qualities This is very important because the
differences between the true value and the measured values are often surprisingly high
when non-calibrated gauges are used The calibration and handling are to be carried out
according to the manufacturer specifications before each use Calibration buffers are to be
checked regularly and if necessary are to be replaced as they have a limited shelf life The
calibration value also is to be corrected according to the temperature dependency of the buffer
solution used
Check-list for the suitability of the equipment
Is the pump-system complete This includes a motor-pump with control unit an electric power-
source (eg diesel generator) and stand pipes (tubes andor flexible tubes)
Are all measuring tools calibrated
Is the pump power (pumping head) sufficient
Are the hoses and the light cable long enough
Do the devices meet the quality requirements (purity cleanliness) of the sampling (also applies for
individual sampling)
Do the necessary filtration units comply with the Equipment Standard requirements
Are hoses and connectors reagents andor tools suitable for the task in proper working
condition
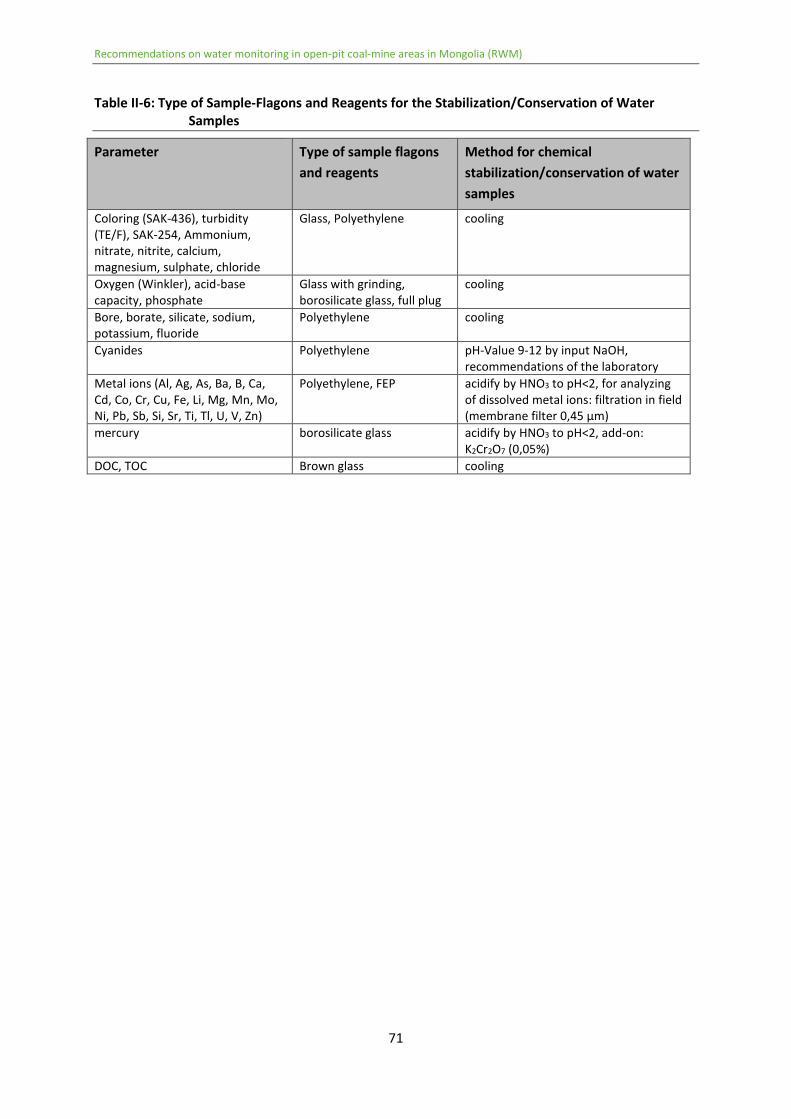
Are the flagons prepared Are necessary reagents for sample stabilization andor necessary
cooling elements available in sufficient numbers see Annex II Table II-6
Are the bottles individually labelled with sample number the monitoring well name or number
sampling date and sampling campaign name or number Important additional information should
be recorded the name of the sampler and the name the laboratory as well as the parameters to
analyse and type of chemical stabilization
Are the necessary cameras GPS master data sheets sampling protocols and cleaning equipment
on site and ready for service
Recommendations on water monitoring in open-pit coal-mine areas in Mongolia (RWM)
27
Sampling
The following steps are carried out during a groundwater sampling
(1) Well monitoring
Samples for water analyses can also be taken from the same groundwater measuring points
used for quantity monitoring Important is that the pipe can be navigated with a motor
pump Classic sampling motor pumps can be installed in measuring points with two-inch
inner diameters (ID) In case of very deep monitoring wells the pipes can become
misaligned in such a way that the pump can get stuck and break off Before installing a
pump at least one test with a light cable or a dummy should be completed
(2) Local Findings Observations at the Sampling Point and the Surrounding Vicinity
Check of the information on the master data sheet for completeness
Check the condition and serviceability of the sampling point for visible damage safety
(closeability) cleanliness corrosion of metal parts and other changes
Check for and document any deposits and incrustations eg precipitations biota (algae
mold animals) sediment etc
Check and document any mixed waters mixture of water of different origin inflow of
foreign water overflows
In principle gross deficiencies in drinking water supply systems (also in the case of
drinking water purposes used house wells) should be communicated to the operator
Document changes since the last sampling eg agricultural activities earthwork or
construction sedimentation conspicuous surface use visible contamination sources
Record any other abnormalities eg weathering during sampling air temperature
precipitation degree of cloudiness or sun exposure nuisance dust
(3) Measurement of Groundwater Level before Pumping
The groundwater level describes a part of the actual hydraulic situation The results of the
sample analyses should be interpreted with respect to the hydraulic situation (eg high or
low groundwater level) The measurement should continue during the whole pumping
duration
(4) Installation of the Pump
The pump should be installed more than one meter above the screen of the monitoring well
(5) Pumping and Purging
For pumping it is important to maintain a continuous moderate pumping rate
Discontinuous pumping can provoke turbulence in the water column of the monitoring well
and if the pumping rate is too high solid substances outside from screen can enter into the
monitoring well The pumping rate can also be optimized by adapting to the yield of the
well A continuous water level should also be maintained since the water level must not
Recommendations on water monitoring in open-pit coal-mine areas in Mongolia (RWM)
28
decrease below the pump and should be at least 1 m above the screen The inflow of oxygen
is to be avoided
Purging is the process of removing stagnant water from a well immediately prior to
sampling causing its replacement by groundwater which is representative of actual aquifer
conditions from adjacent formations To determine when a well has been adequately
purged field investigators should monitor (at a minimum) the temperature the pH specific
conductance and the turbidity of the groundwater removed during purging In the case of
permanent monitoring wells they should observe and record the volume of water removed
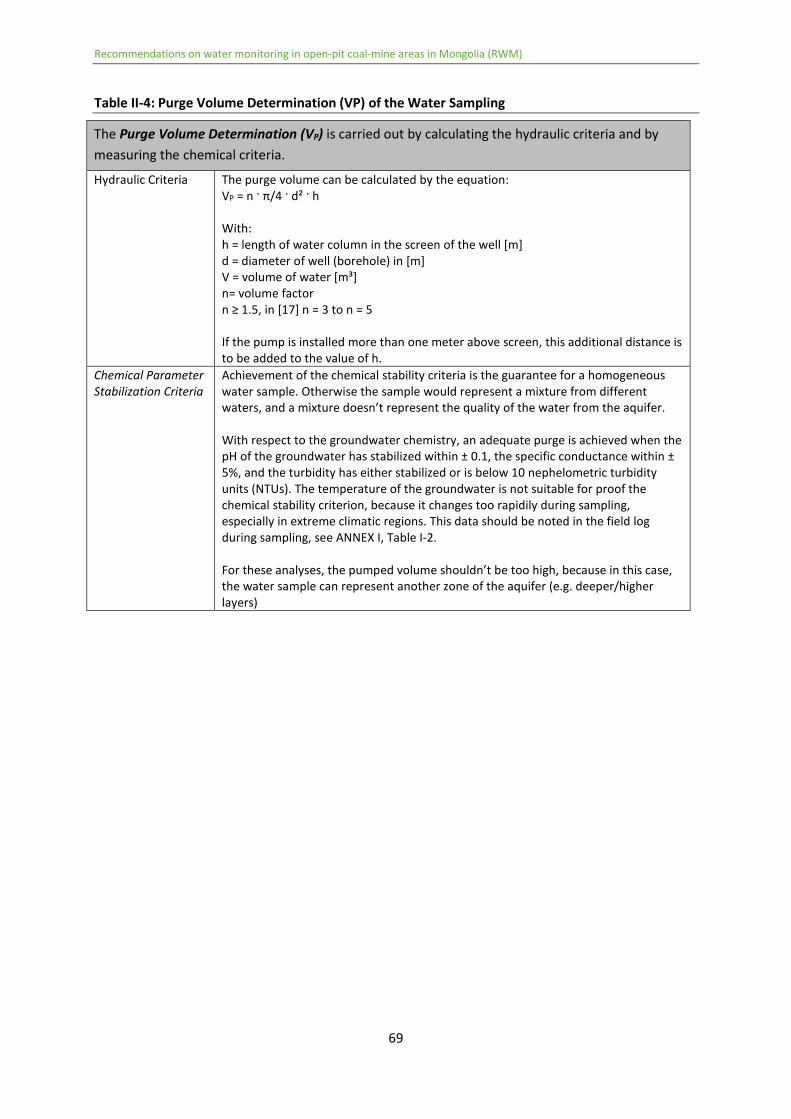
The Purge Volume Determination (VP) is carried out by calculating the hydraulic criteria
and by measuring the chemical criteria see Annex II Table II-4
The water should then be released a long distance away of the monitoring well (minimum
five meters) after pumping
(6) On-site Parameter Measuring
Organoleptic (sensory) data include the qualitative recording of color turbidity smell and
sediment The tests should be carried out in a transparent vessel with a volume of at least
one liter against a white and black background Abnormalities of the groundwater can
already be detected through the optical or odoriferous findings This data can therefore
also be used to assess the measuring point or quality of sampling Dregs from another
monitoring well in a pore aquifer can indicate damage to the measuring point
The parameters water temperature electric conductivity (in μScm) dissolved oxygen
reduction-oxidation potential and pH-value are measured by gauges The use of multi cells
is recommended Otherwise the use of vessels is possible The sensors should not be used
in the same vessel The volume of the vessels should be greater than one liter The measured
value must first be read and logged if the display remains stable
(7) Sampling
It is particularly important that wells be sampled as soon as possible after purging If
adequate volume is available upon completion of purging the well is to be sampled
immediately If not sampling should occur as soon as adequate water volume has
recovered
(i) Charging the Sample Flagons see also Annex II Table II-6
When sampling with a medium or large mobile pump a bypass with adjustable flow off of
the sampling line can be used to fill the sample vessels The bypass should be installed in
front of the on-line measuring instrument and the line should be purged briefly to remove
fluid standing in the line before the sample is taken
When filling the sample bottles are to be completely and appropriately labeled All sample
containers not pre-filled with stabilizing reagent are to be rinsed out at least twice before
filling This is done by filling the container approximately 25 with sample water placing
on the lid shaking vigorously and emptying Before closing the sample containers the
closures are also to be rinsed thoroughly Filling of the water samples must be completed
Recommendations on water monitoring in open-pit coal-mine areas in Mongolia (RWM)
29
without bubbles and avoiding turbulence To achieve this the filling tube should be kept
submersed in the sample Fill the bottles completely and let them overflow several times
before closing the bottle The groundwater sample thus enters the sample vessel without
contact with the atmosphere
For vessels containing stabilizers the hose must not come into contact with the contents of
the bottle and with the stabilizer The filling process is to be interrupted at about two-thirds
of the bottle volume in order to distribute the stabilizing agent homogeneously throughout
the sample by gently swirling the closed vessel Then the bottle can be completely filled
(ii) Filtration of Samples
For most parameters analyses are taken using unfiltrated samples However some
parameters like DOC or metal concentration first require filtration of the water sample If
the samples are to be filtered disposable filters with a pore size of 045 μm and disposable
syringes are used The filters should be rinsed with at least 20 ml of sample water A
membrane filtration device can also be used on site Filtration is to completed before
conservationcooling in every case
(8) Conservation and Storage of the Samples
Information as to the conservation and storage of samples is given in Table 9 Without
stabilization the concentration of some dissolved elements can change during storage or
transportation (eg precipitation of Fe-II as FE-III) causing errors in the laboratory
analyses of the solutes
(9) Transport and Storage of Samples
The temperature during transport and storage should be kept between 2degC and 5degC A cooling
box with cool pads can be used while freezing of samples is to be avoided
InfoBox Water Sampling
Failures in and carelessness during sampling conservation storage and transport of a water
sample can change the quality of a sample and change the analysed results An (expensive) water
analysis becomes useless because of this
The parameters temperature electrical conductivity pH value dissolved oxygen content and
redox potential as well as organoleptic parameters must be measured or recorded and
documented on site Results of these measurements in the laboratory do not represent the
original water quality
Proof of compliance with hydraulic and quality criteria should be part of the sampling
documentation
The original documentation of the analysis results should be stored securely and long-lasting
For additional information see
httpswwwepagovsitesproductionfiles2015-06documentsGroundwater-Samplingpdf
Recommendations on water monitoring in open-pit coal-mine areas in Mongolia (RWM)
30
5 Surface Water
Objects of Surface Water Monitoring
Surface water monitoring includes measurements of volumic flow rates and water levels in the
mine and the surrounding area This is necessary to determine the interaction between surface
and groundwater
Surface water monitoring includes the important water flow rates in the mine and the
distribution of pumped water (eg dusk fixation irrigation re-infiltration or output)
In the area directly surrounding the mine the following measurements are part of the surface
water monitoring
Delivery rate of a spring comparing the delivery rate and dewatering of the mine can
give information about the impact of mine dewatering to the groundwater and local
water balances
Water levels of artificial and natural lakes hydrographs of the lake water level give
information about its seasonal changes and the impact of mine dewatering
Input and output rates intofrom lakes important for the complete estimation of local
water balances and the local water cycle
Precipitation and evaporation to and from lakes important for the complete estimation
of local water balances and the local water cycle
Rates of surface fluids at different points (eg in front of and behind the mine) possible
impacts (higher ex-filtration rates from fluids into the underground near a dewatered
mine gives information about hydraulic interactions
Input and output rates intofrom fluids lakes important for the complete estimation of
local water balances and the local water cycle
Monitoring Program
Flow rates of fluids change rapidly with the climate conditions (precipitation snow smelting)
That is why times for measurement canrsquot be predicted exactly The frequency should be fixed
individually and iterative with the results Measurements under different conditions such as
during dry phase or after precipitation can give the range of possible rates
For a lake water sampling is recommended at the different phases of the circulation of the water
body This means four times per year spring circulation begin and end of the summer-
stagnation and during autumn circulation
Recommendations on water monitoring in open-pit coal-mine areas in Mongolia (RWM)
31
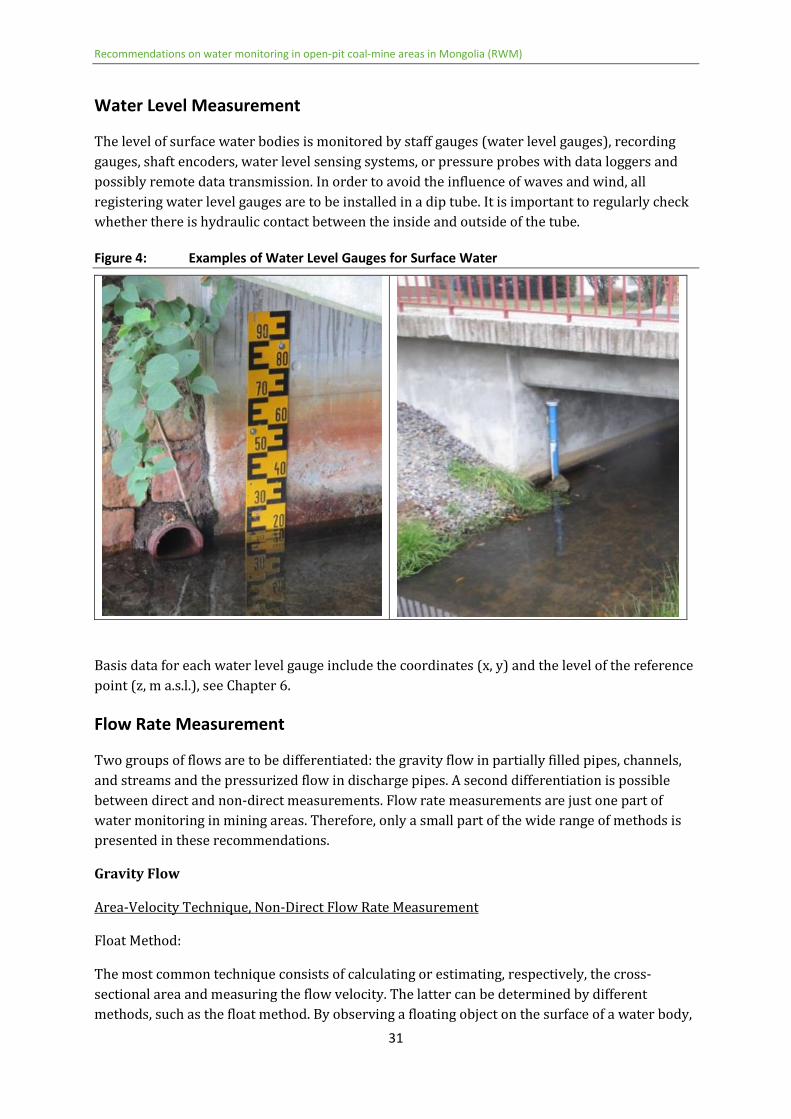
Water Level Measurement
The level of surface water bodies is monitored by staff gauges (water level gauges) recording
gauges shaft encoders water level sensing systems or pressure probes with data loggers and
possibly remote data transmission In order to avoid the influence of waves and wind all
registering water level gauges are to be installed in a dip tube It is important to regularly check
whether there is hydraulic contact between the inside and outside of the tube
Figure 4 Examples of Water Level Gauges for Surface Water
Basis data for each water level gauge include the coordinates (x y) and the level of the reference
point (z m asl) see Chapter 6
Flow Rate Measurement
Two groups of flows are to be differentiated the gravity flow in partially filled pipes channels
and streams and the pressurized flow in discharge pipes A second differentiation is possible
between direct and non-direct measurements Flow rate measurements are just one part of
water monitoring in mining areas Therefore only a small part of the wide range of methods is
presented in these recommendations
Gravity Flow
Area-Velocity Technique Non-Direct Flow Rate Measurement
Float Method
The most common technique consists of calculating or estimating respectively the cross-
sectional area and measuring the flow velocity The latter can be determined by different
methods such as the float method By observing a floating object on the surface of a water body
Recommendations on water monitoring in open-pit coal-mine areas in Mongolia (RWM)
32
the flow velocity at the surface can be measured The equation v asymp 085 middot v13 yields an
estimate for the average flow velocity [(Gunston 1998)] The measurement of the velocity is
more sophisticated for defined areas
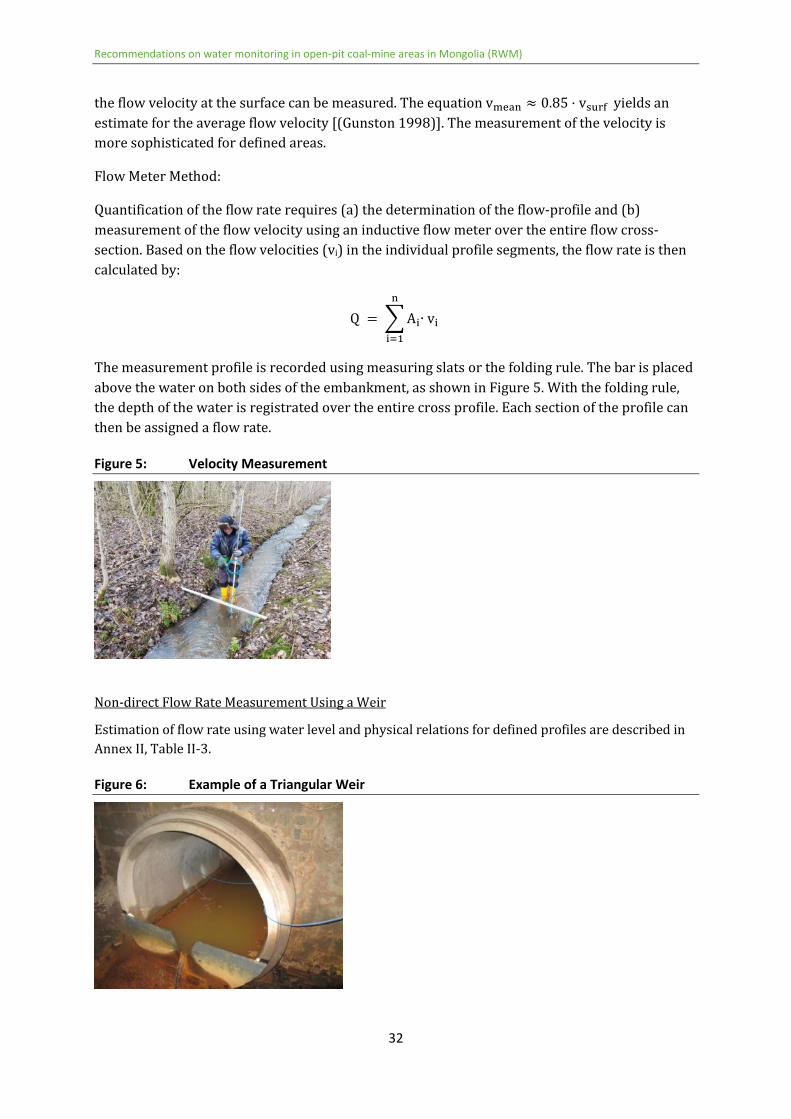
Flow Meter Method
Quantification of the flow rate requires (a) the determination of the flow-profile and (b)
measurement of the flow velocity using an inductive flow meter over the entire flow cross-
section Based on the flow velocities (vi) in the individual profile segments the flow rate is then
calculated by
Q = A∙ v
The measurement profile is recorded using measuring slats or the folding rule The bar is placed
above the water on both sides of the embankment as shown in Figure 5 With the folding rule
the depth of the water is registrated over the entire cross profile Each section of the profile can
then be assigned a flow rate
Figure 5 Velocity Measurement
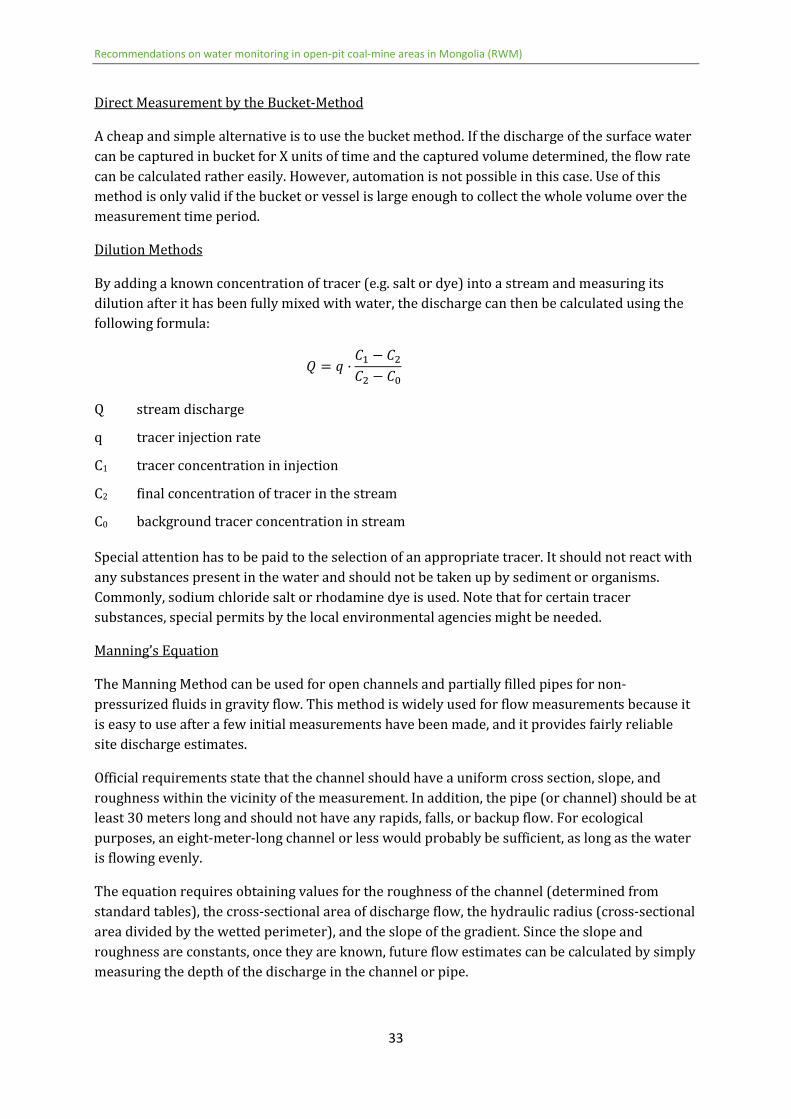
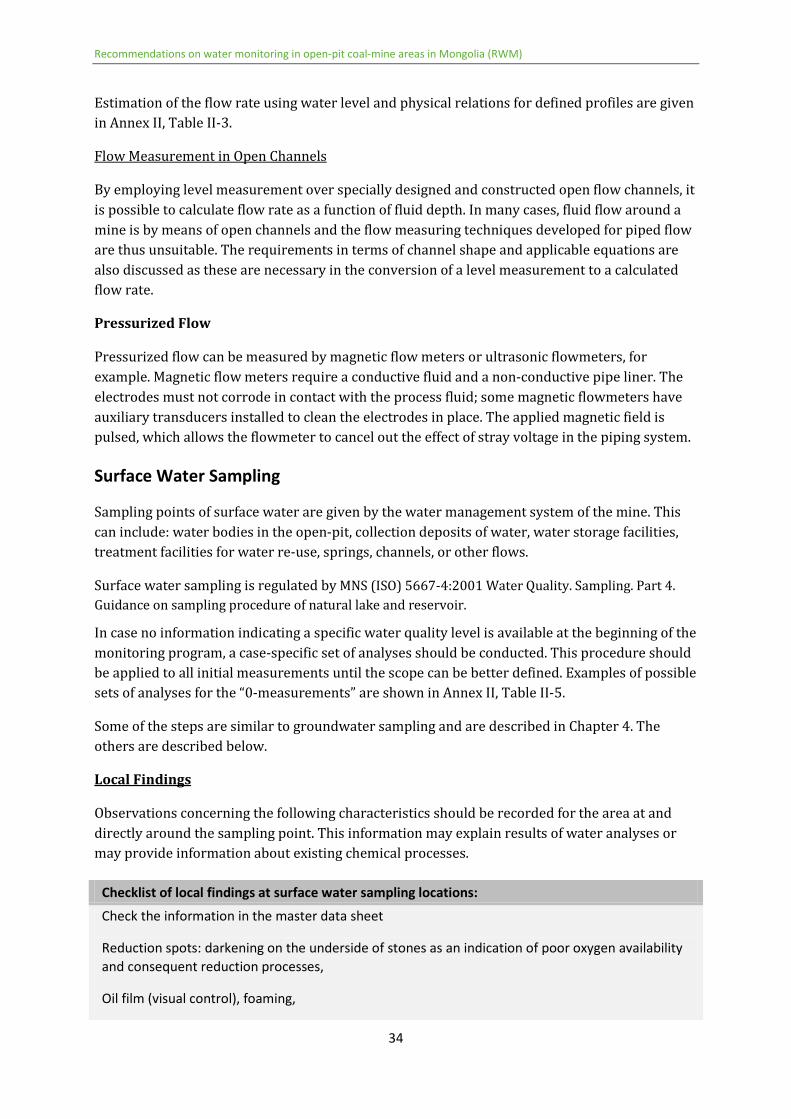
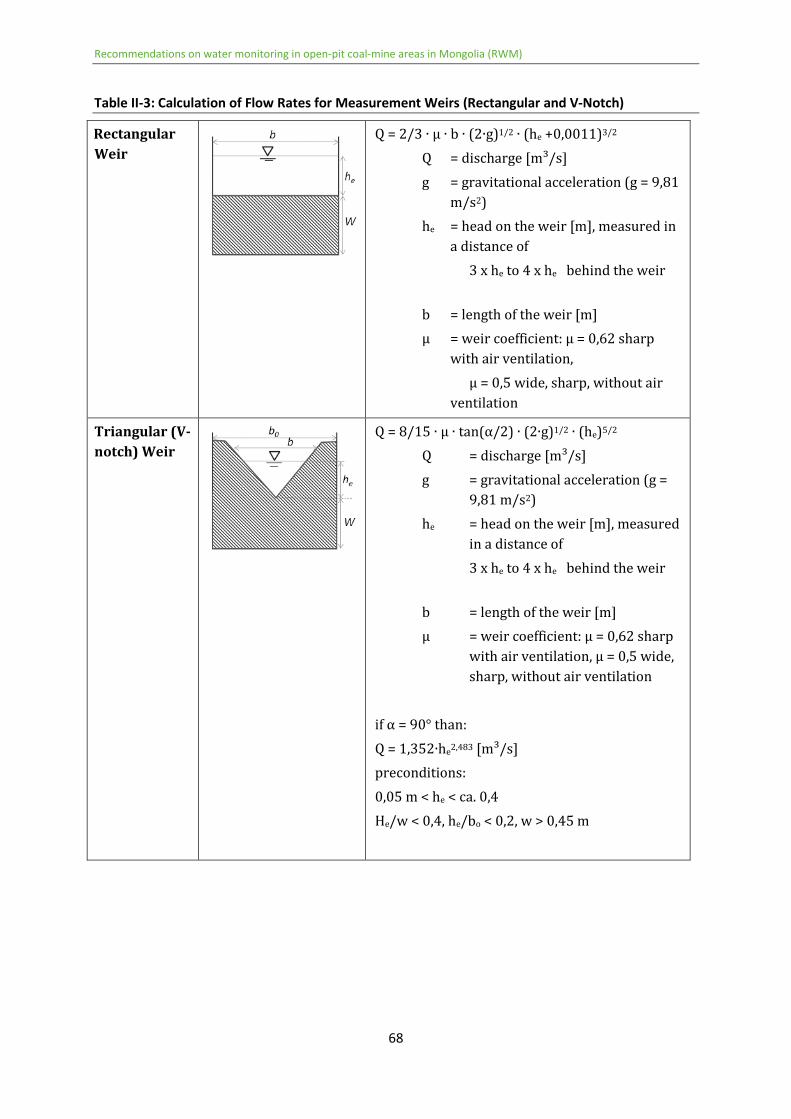
Non-direct Flow Rate Measurement Using a Weir
Estimation of flow rate using water level and physical relations for defined profiles are described in
Annex II Table II-3
Figure 6 Example of a Triangular Weir
Recommendations on water monitoring in open-pit coal-mine areas in Mongolia (RWM)
33
Direct Measurement by the Bucket-Method
A cheap and simple alternative is to use the bucket method If the discharge of the surface water
can be captured in bucket for X units of time and the captured volume determined the flow rate
can be calculated rather easily However automation is not possible in this case Use of this
method is only valid if the bucket or vessel is large enough to collect the whole volume over the
measurement time period
Dilution Methods
By adding a known concentration of tracer (eg salt or dye) into a stream and measuring its
dilution after it has been fully mixed with water the discharge can then be calculated using the
following formula
Special attention has to be paid to the selection of an appropriate tracer It should not react with
any substances present in the water and should not be taken up by sediment or organisms
Commonly sodium chloride salt or rhodamine dye is used Note that for certain tracer
substances special permits by the local environmental agencies might be needed
Manningrsquos Equation
The Manning Method can be used for open channels and partially filled pipes for non-
pressurized fluids in gravity flow This method is widely used for flow measurements because it
is easy to use after a few initial measurements have been made and it provides fairly reliable
site discharge estimates
Official requirements state that the channel should have a uniform cross section slope and
roughness within the vicinity of the measurement In addition the pipe (or channel) should be at
least 30 meters long and should not have any rapids falls or backup flow For ecological
purposes an eight-meter-long channel or less would probably be sufficient as long as the water
is flowing evenly
The equation requires obtaining values for the roughness of the channel (determined from
standard tables) the cross-sectional area of discharge flow the hydraulic radius (cross-sectional
area divided by the wetted perimeter) and the slope of the gradient Since the slope and
roughness are constants once they are known future flow estimates can be calculated by simply
measuring the depth of the discharge in the channel or pipe
= middot minus minus
Q stream discharge
q tracer injection rate
C1 tracer concentration in injection
C2 final concentration of tracer in the stream
C0 background tracer concentration in stream
Recommendations on water monitoring in open-pit coal-mine areas in Mongolia (RWM)
34
Estimation of the flow rate using water level and physical relations for defined profiles are given
in Annex II Table II-3
Flow Measurement in Open Channels
By employing level measurement over specially designed and constructed open flow channels it
is possible to calculate flow rate as a function of fluid depth In many cases fluid flow around a
mine is by means of open channels and the flow measuring techniques developed for piped flow
are thus unsuitable The requirements in terms of channel shape and applicable equations are
also discussed as these are necessary in the conversion of a level measurement to a calculated
flow rate
Pressurized Flow
Pressurized flow can be measured by magnetic flow meters or ultrasonic flowmeters for
example Magnetic flow meters require a conductive fluid and a non-conductive pipe liner The
electrodes must not corrode in contact with the process fluid some magnetic flowmeters have
auxiliary transducers installed to clean the electrodes in place The applied magnetic field is
pulsed which allows the flowmeter to cancel out the effect of stray voltage in the piping system
Surface Water Sampling
Sampling points of surface water are given by the water management system of the mine This
can include water bodies in the open-pit collection deposits of water water storage facilities
treatment facilities for water re-use springs channels or other flows
Surface water sampling is regulated by MNS (ISO) 5667-42001 Water Quality Sampling Part 4
Guidance on sampling procedure of natural lake and reservoir
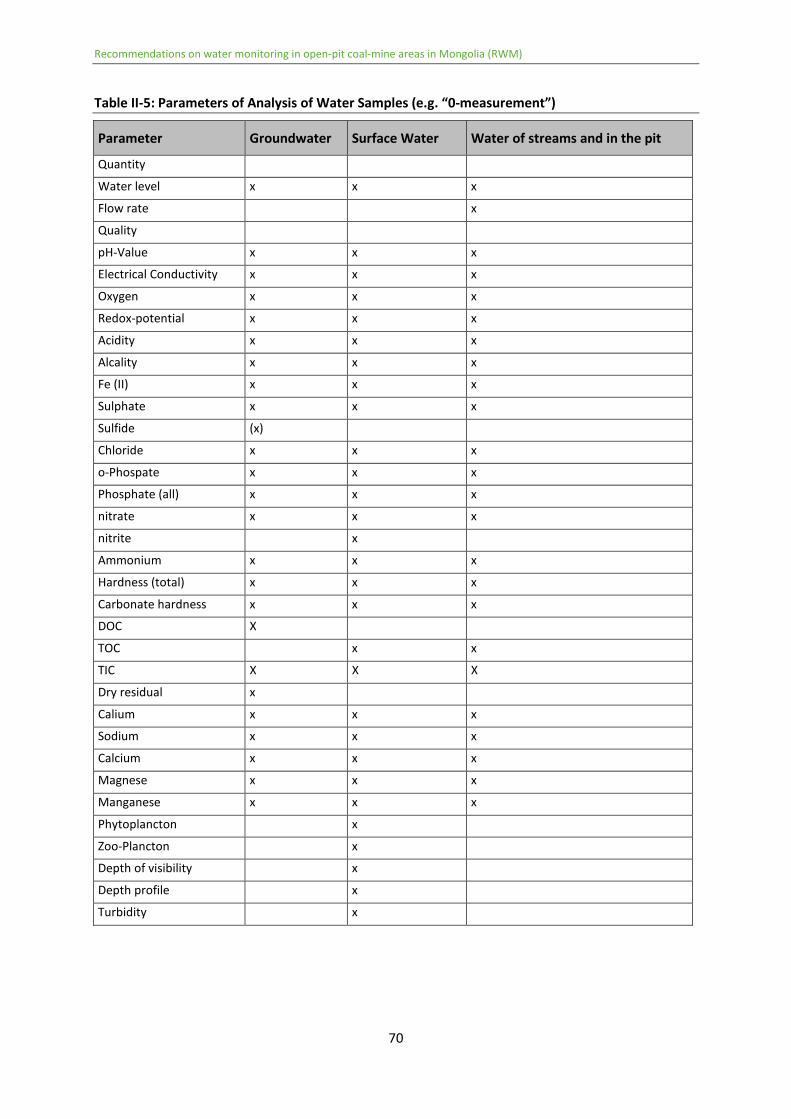
In case no information indicating a specific water quality level is available at the beginning of the
monitoring program a case-specific set of analyses should be conducted This procedure should
be applied to all initial measurements until the scope can be better defined Examples of possible
sets of analyses for the ldquo0-measurementsrdquo are shown in Annex II Table II-5
Some of the steps are similar to groundwater sampling and are described in Chapter 4 The
others are described below
Local Findings
Observations concerning the following characteristics should be recorded for the area at and
directly around the sampling point This information may explain results of water analyses or
may provide information about existing chemical processes
Checklist of local findings at surface water sampling locations
Check the information in the master data sheet
Reduction spots darkening on the underside of stones as an indication of poor oxygen availability
and consequent reduction processes
Oil film (visual control) foaming
Recommendations on water monitoring in open-pit coal-mine areas in Mongolia (RWM)
35
water level runoff retention
frozen water table
changes since the last sampling eg agricultural activities earthworks or construction
sedimentation conspicuous surface use visible contamination changes in banks foreign matter
sewage foam discharges discharges
other abnormalities water level development substrate sediment
biocenoses eg waterfowls
weather during sampling eg air temperature precipitation degree of cloudiness or sun exposure
Taking Samples
In the case of surface water local representatives should be careful not to detect wastewater
plumes dead water zones or returbulence Rather the site to be sampled should be where the
largest mass transport is to be expected or where the flow rate is about 1 ms when sampling
from the embankment On the one hand for safety reasons entering the water body should be
avoided as far as possible in order to prevent sedimentation
Water samples from running waters should be taken as single samples using scooping devices
The appropriate sampling equipment is to be thoroughly rinsed with the water to be sampled
several times in advance When sampling bridges and the like care should be taken that no
contaminants get into the scoop When removing the water bottom should not be touched with
the scooping device in order to prevent the sediment being stirred up Likewise the sampling of
floating materials should be avoided
The sampler should be submerged in the upper third of the water body depth (or if necessary
approximately 5-30 cm below the surface of the water) The opening of the ladle or sampling
vessel is held in the direction of flow If several scooping processes are required to fill the
sampling containers the homogeneity of the sample must be ensured
In the case of lakes individual samples from several depth stages are to be taken at the
measuring points for the analysis of the chemical parameters depending on the different
seasonal circulation-stagnation-phases
Recommendations on water monitoring in open-pit coal-mine areas in Mongolia (RWM)
36
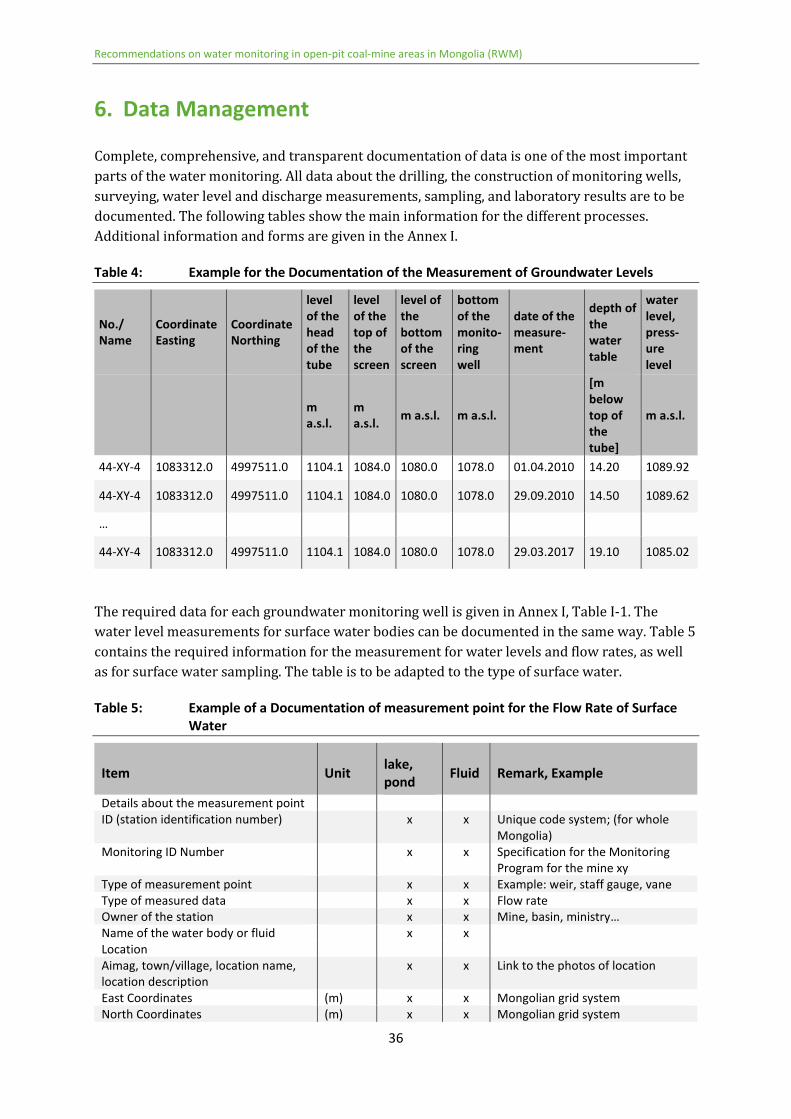
6 Data Management
Complete comprehensive and transparent documentation of data is one of the most important
parts of the water monitoring All data about the drilling the construction of monitoring wells
surveying water level and discharge measurements sampling and laboratory results are to be
documented The following tables show the main information for the different processes
Additional information and forms are given in the Annex I
Table 4 Example for the Documentation of the Measurement of Groundwater Levels
No
Name
Coordinate
Easting
Coordinate
Northing
level
of the
head
of the
tube
level
of the
top of
the
screen
level of
the
bottom
of the
screen
bottom
of the
monito-
ring
well
date of the
measure-
ment
depth of
the
water
table
water
level
press-
ure
level
m
asl
m
asl m asl m asl
[m
below
top of
the
tube]
m asl
44-XY-4 10833120 49975110 11041 10840 10800 10780 01042010 1420 108992
44-XY-4 10833120 49975110 11041 10840 10800 10780 29092010 1450 108962
hellip
44-XY-4 10833120 49975110 11041 10840 10800 10780 29032017 1910 108502
The required data for each groundwater monitoring well is given in Annex I Table I-1 The
water level measurements for surface water bodies can be documented in the same way Table 5
contains the required information for the measurement for water levels and flow rates as well
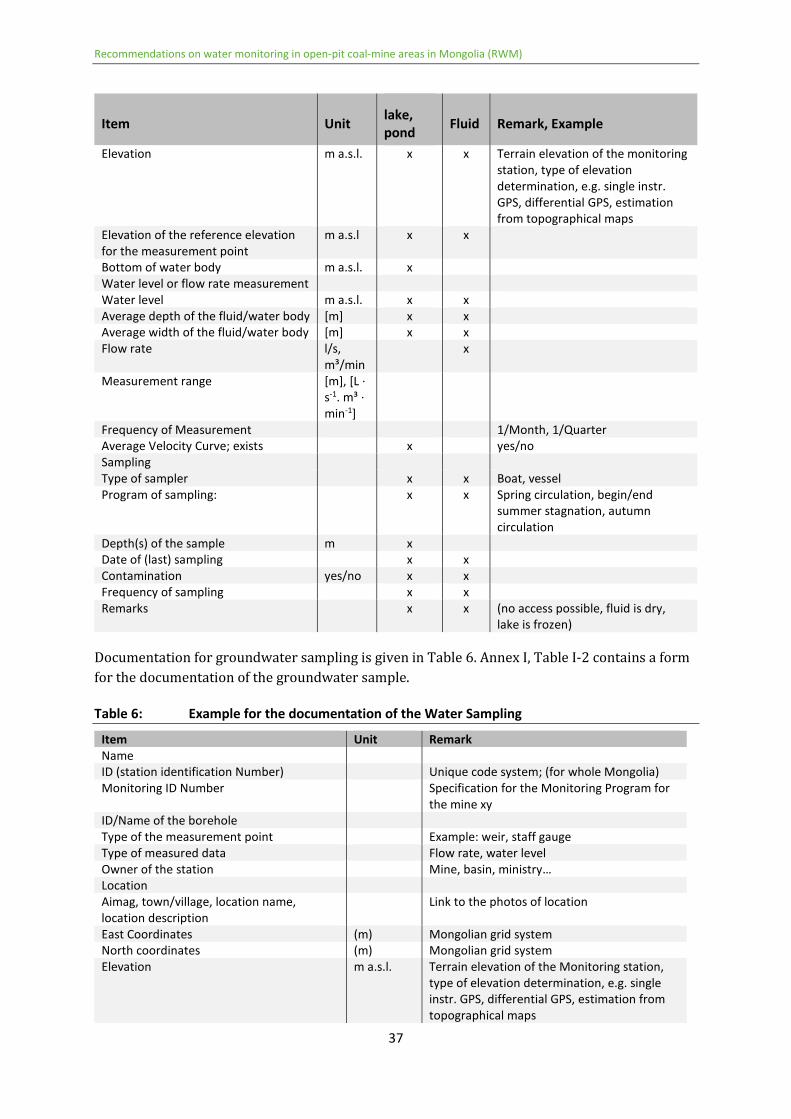
as for surface water sampling The table is to be adapted to the type of surface water
Table 5 Example of a Documentation of measurement point for the Flow Rate of Surface
Water
Item Unit lake
pond Fluid Remark Example
Details about the measurement point
ID (station identification number) x x Unique code system (for whole
Mongolia)
Monitoring ID Number x x Specification for the Monitoring
Program for the mine xy
Type of measurement point x x Example weir staff gauge vane
Type of measured data x x Flow rate
Owner of the station x x Mine basin ministryhellip
Name of the water body or fluid x x
Location
Aimag townvillage location name
location description
x x Link to the photos of location
East Coordinates (m) x x Mongolian grid system
North Coordinates (m) x x Mongolian grid system
Recommendations on water monitoring in open-pit coal-mine areas in Mongolia (RWM)
37
Item Unit lake
pond Fluid Remark Example
Elevation m asl x x Terrain elevation of the monitoring
station type of elevation
determination eg single instr
GPS differential GPS estimation
from topographical maps
Elevation of the reference elevation
for the measurement point
m asl x x
Bottom of water body m asl x
Water level or flow rate measurement
Water level m asl x x
Average depth of the fluidwater body [m] x x
Average width of the fluidwater body [m] x x
Flow rate ls
msup3min
x
Measurement range [m] [L ∙
s-1 msup3 ∙
min-1]
Frequency of Measurement 1Month 1Quarter
Average Velocity Curve exists x yesno
Sampling
Type of sampler x x Boat vessel
Program of sampling x x Spring circulation beginend
summer stagnation autumn
circulation
Depth(s) of the sample m x
Date of (last) sampling x x
Contamination yesno x x
Frequency of sampling x x
Remarks x x (no access possible fluid is dry
lake is frozen)
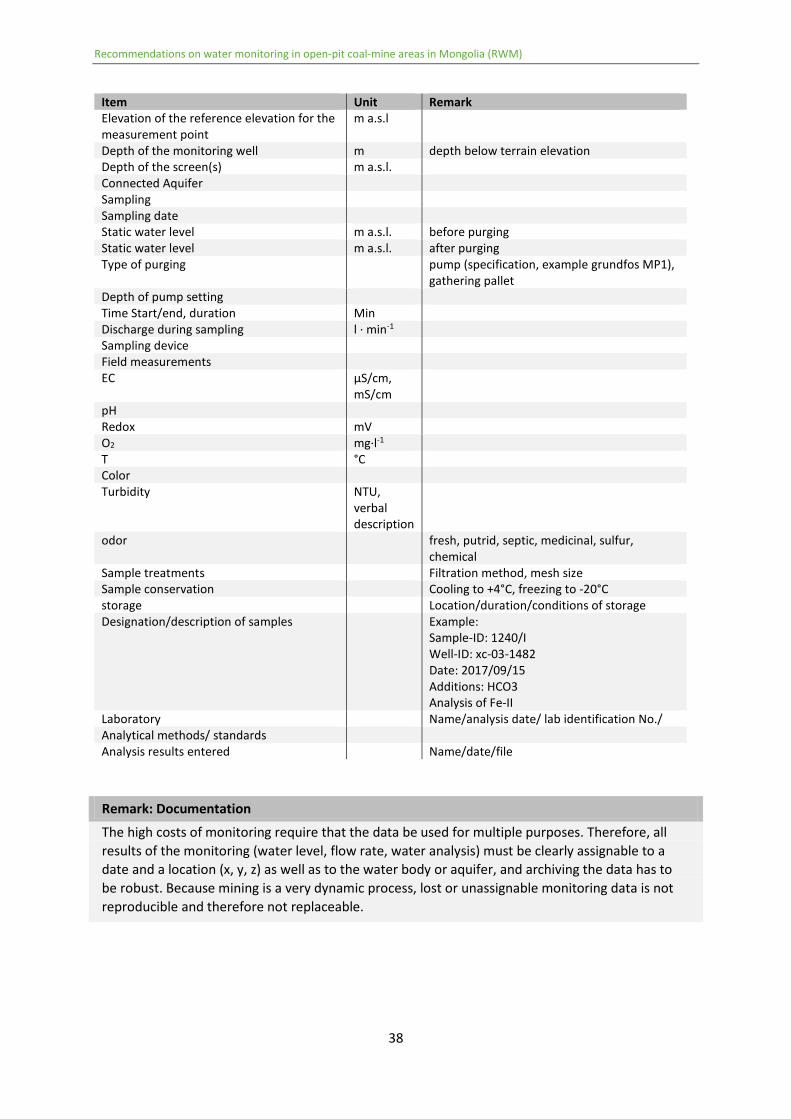
Documentation for groundwater sampling is given in Table 6 Annex I Table I-2 contains a form
for the documentation of the groundwater sample
Table 6 Example for the documentation of the Water Sampling
Item Unit Remark
Name
ID (station identification Number) Unique code system (for whole Mongolia)
Monitoring ID Number Specification for the Monitoring Program for
the mine xy
IDName of the borehole
Type of the measurement point Example weir staff gauge
Type of measured data Flow rate water level
Owner of the station Mine basin ministryhellip
Location
Aimag townvillage location name
location description
Link to the photos of location
East Coordinates (m) Mongolian grid system
North coordinates (m) Mongolian grid system
Elevation m asl Terrain elevation of the Monitoring station
type of elevation determination eg single
instr GPS differential GPS estimation from
topographical maps
Recommendations on water monitoring in open-pit coal-mine areas in Mongolia (RWM)
38
Item Unit Remark
Elevation of the reference elevation for the
measurement point
m asl
Depth of the monitoring well m depth below terrain elevation
Depth of the screen(s) m asl
Connected Aquifer
Sampling
Sampling date
Static water level m asl before purging
Static water level m asl after purging
Type of purging pump (specification example grundfos MP1)
gathering pallet
Depth of pump setting
Time Startend duration Min
Discharge during sampling l ∙ min-1
Sampling device
Field measurements
EC microScm
mScm
pH
Redox mV
O2 mg∙l-1
T degC
Color
Turbidity NTU
verbal
description
odor fresh putrid septic medicinal sulfur
chemical
Sample treatments Filtration method mesh size
Sample conservation Cooling to +4degC freezing to -20degC
storage Locationdurationconditions of storage
Designationdescription of samples Example
Sample-ID 1240I
Well-ID xc-03-1482
Date 20170915
Additions HCO3
Analysis of Fe-II
Laboratory Nameanalysis date lab identification No
Analytical methods standards
Analysis results entered Namedatefile
Remark Documentation
The high costs of monitoring require that the data be used for multiple purposes Therefore all
results of the monitoring (water level flow rate water analysis) must be clearly assignable to a
date and a location (x y z) as well as to the water body or aquifer and archiving the data has to
be robust Because mining is a very dynamic process lost or unassignable monitoring data is not
reproducible and therefore not replaceable
Recommendations on water monitoring in open-pit coal-mine areas in Mongolia (RWM)
39
7 Interpretation and Analysis of Monitoring Results
Validity Check Visualization and Interpretation of Water Level
Measurements
Validity Check
The purpose of the validity check is to compare with previously collected values (hydrographs)
with the construction details of the observation well Extreme values conflicting values and
outliers can be caused by incorrect metering of the water depth (reading error) Comparison
with former values would show a difference in this case The difference is an even value in case
of a reading error and the data can be adjusted in some cases Secondly the development of
mines and dumps may require a cut of the observation well If a change in the reference point
(head of the observation well) is not taken into account the hydrographs show a step of the
values These values have to be adjusted by the difference of the elevation of the well head
Finally if the groundwater level is below the screen the measured water level shows the water
in the sump pipe of the observation well That means the well is dry and the values are invalid
The quality control of the data is of enormous importance Flawed data can lead to wrong
conclusions (for example concerning mine safety) and thus to wrong decisions or implemented
measures
Visualization of Monitoring Results
Hydrographs
Hydrographs are plotted values of the water level versus time The water level is shown as
meters above sea level (masl) The plot can be created using basic software (eg MS Office)
Time-related changes of the water level can be detected by graphing It may be useful to plot the
water levels together with the graph of the climate water balance or graphs of groundwater
abstraction (dewatering of the mine) The measured values can be used directly
If there is a density difference of the liquid medium (eg very high salinity of the groundwater) a
conversaion into fresh water levels is necessary using the following formula
hfresh = HSW middot (ρsρf)
where hfresh is the equivalent fresh water column [m] HSW is the length of saline water column
above reference level [m] ps is the density of saline water [kgdmsup3] and ρf is the density of fresh
water [kgdmsup3] Flow rates or water levels of surface water can be plotted as hydrographs as
well
Example Interpretation of Hydrographs
The following figure (Figure 7) shows some hydrographs of different groundwater monitoring wells
around a dewatered coal mine together with the values of the climate water balance (CWB) The
values of the groundwater level are shown on the left axis and the values of the CWB on the right
axis
Recommendations on water monitoring in open-pit coal-mine areas in Mongolia (RWM)
40
As shown in the Figure 7 the water level of monitoring well 1 is stable The value of March 1996 is
an error (outlier) which should be corrected Values during the time between June 2015 and
November 2016 are missing Monitoring Well 1 is screened in the upper aquifer in our case That
means this upper aquifer is protected from dewatering of the mine by natural hydraulic barriers
(aquiclude)
However the graphs of the monitoring wells 2 and 3 show a significant drawdown (gt30 m) since
2003 These monitoring wells represent the deeper aquifer which was dewatered The
hydrograph of the monitoring well 3 has been stable since March 2008 At this point there was no
more groundwater in this well The groundwater table was either deeper than the monitoring well
or deeper than the screen of this well The values since March 2008 are not useable
Figure 7 Example of Water Level Hydrographs
Monitoring wells 4 and 5 are located at a large distance from the mine (gt5km) The water level is
directly influenced by the groundwater recharge specifically by the CWB The highly positive CWB
during 20102011 and 2013 caused higher groundwater levels The hydrograph of well 5 shows a
small drawdown in 2014 and 2015 The aquifer near well 5 could be affected by mine dewatering
Mapping of Contour Lines
A water-level contour map is a common tool used by hydrogeologists to indicate groundwater
flow directions and the hydraulic gradient as well as to test the continuum approach From field
measurements of static water levels in wells a water level contour map can be constructed
Anomalously high or low water levels and jagged or discontinuous contours may be evidence
that the continuum approach is not legitimate Water flow directions aid in the delineation of the
source water protection area
Recommendations on water monitoring in open-pit coal-mine areas in Mongolia (RWM)
41
If there is hydraulic contact between surface and groundwater the surface water bodies are to
be considered in the contour maps This applies for standing water bodies and for flowing water
Knowledge of surface water levels is required The basis of the water body added to an
estimated water level can be used in the case of flows The potential level (pressure level) is
used in the case of a confined aquifer It is also standard to use special software (eg SAGA GIS
see below) for designing contour lines A manual design of these lines however is also possible
Mapping the Depths to the Water Table
Mapping the depth of the water table is important for (a) regions with different groundwater
users with wells that are screened at different depths (b) when a hydraulic interaction between
surface water and groundwater occurs or (c) in regions with small distances between terrain
surface and the groundwater table Levels of the terrain levels of groundwater and special
software (eg SAGA GIS see below) are required for creating a map of groundwater depths
Mapping of Table Differences
Maps of groundwater level differences are a suitable tool for showing the impact of mine-
dewatering on the aquifer The groundwater levels in the monitoring wells at different dates are
the base for mapping these differences
Mapping of Monitoring Results
Contour lines describing groundwater level or potential are a suitable tool to plot the dynamics of
groundwater results are the direction of groundwater flow and the hydraulic gradient
Mapping contour lines should be done for the state before dewatering activities starts and for
each year afterward (measured in the same month)
Groundwater level difference maps are a suitable tool to illustrate the effect of mine dewatering
on the aquifers
Suitable reference states for mapping of table differences are (i) state before dewatering activities
and current state (ii) state of previous year and current state (iii) current state and prognosis
state (based on the calculated state from the model) (iv) state before dewatering activities and
prognosis state (v) state before dewatering activities and after dewatering including completed
groundwater increase
If different data sets (measurements model results) are used possible deviations must be
explained and discussed
A suitable software (freeware) is SAGA-GIS httpsaga-gissourceforgeneten
Interpretation of Monitoring Results (Water Level Flow Rates)
Establishing a hypothesis can support the interpretation of monitoring results For the
monitoring of mine dewatering such hypotheses can be the different drawdowns of the
groundwater level or a decrease in the flow rates of fluids because of higher infiltration rates
The climate situation during the monitoring period also is to be focus and part of the
interpretation Changes of groundwater level can be caused by different rates of groundwater
recharge as a consequence of different climate conditions
Recommendations on water monitoring in open-pit coal-mine areas in Mongolia (RWM)
42
Table 7 contains different types of hydraulic conditions The quantification of these conditions
can aid the interpretation of the monitoring results
Table 7 Overview of Hydraulic Conditions
Hydraulic Conditions Method for Quantifying
Precipitation Online-Data from climate stations measurement of
precipitation
Evaporation Online-Data from climate stations measurement of
evaporation from water bodies
Development of the mine Areas of claim (extensions date) Interpretation and
reports of monitoring results should include the
development of the mine during the monitoring period
The spatial development of the dewatering (construction of
well galleries) is to be documented
Development of the dewatering system of the
mine (well galleries pumping from ponds)
Rate well-specific (location depth) breaks of dewatering
begin and end of dewatering
Use of the water in the mine (process water
eg dust fixation irrigation)
Rates (Specific for location and date)
Water abstraction outside of the mine by
other users (eg water supply for livestock)
Rates (Specific for location and date)
Water infiltration (into the Aquifer) or input
(into lakes or ponds)
Rates (Specific for location and date)
Rates of fluids around of the mine Measurement of flow rates
Groundwater levels in and around of the mine Monitoring groundwater designation of water divides
Evaluation of the Hydraulic System
The hydraulic system of the mine is to be described and quantified Parameters for the hydraulic
system include water in- and outputs dewatering precipitation and evaporation among others
Water balances should then be established
The measurement estimation or calculation of parameters in the water cycle allows the
determination of the CWB The following equation describes a local water cycle
0 = P ndash ETP plusmn Qinout plusmn ∆S
where P is precipitation ETP is evapotranspiration Qinout are runoff recharge in- and outputs
(eg from wells) and ∆S is the change of storage volume The difference of precipitation and
evapotranspiration is called climate water balance (CWB)
CWB = P ndash ETP
The equation of the water cycle can be written as
0 = CWB plusmn Qinout plusmn ∆S
Dimension of the Catchment Area (Subterranean Basin)
The dimension of the catchment area is given by the following equation
Acatch = QOut GWR
where Acatch is the area of the catchment area [msup2] QOut the volumetric dewatering rate of the
mine [msup3s] and GWR is the groundwater recharge [msup3(msup2 s)]
Recommendations on water monitoring in open-pit coal-mine areas in Mongolia (RWM)
43
Validity Check Visualization and Interpretation of Water Quality
Measurements
1 Assessment of Outliers
Issue Validity check of analyses results
Goal Outlier change of water quality sampling or analysis errors
Data Requirements Time series of chemical parameters including electrical conductivity pH
and plotted concentration vs date of sampling
Method for the Interpretation of Deviations in a Time Series of Water Analysis Results
The quality of waters can naturally change over time or can be impacted by human activities
Concentration differences lower than 25 are natural in most cases If the difference is greater
than 25 the following causes are possible (a) a serious change of water quality based on
human activities (b) an error in the sampling or transport of samples or (c) an error in the
laboratory analysis
Methods for Comparison with Other Parameters
Comparison with other parameters such as electrical conductivity and pH-value gives two
possible results 1) In the case where the other parameter values have also changed that means
the change of water quality is real or the sampling was erroneous or 2) If one of the other
parameters didnrsquot change the analysis of the sample may have been erroneous The search for
errors can be identified by conducting laboratory quality assurance checks and repeating the
analyses for a retained sample If the results of the repeated analysis show the same result the
sampling is to be repeated a third time The water of the sample is to be analysed at two
different laboratories If these results yield the same concentration there has been a change in
the water quality
Result This method can estimate if a measured value (an outlier) is correct
indicating a change of quality of water or if the result is an error of
sampling or analyzation
Source DGFZ eV Dresdener Grundwasserforschungszentrum eV (GERMAN)
2 Exclusion of Ion Concentrations
Issue Validity check of analysis results
Goal Plausibility checks of analysis results
Data requirements Analysis results of O2 Fe2+ Mn2+ Ca2+ Mg2+ NO2- NH4- H2S NO3- pH-
value (doesnrsquot need to be complete)
Recommendations on water monitoring in open-pit coal-mine areas in Mongolia (RWM)
44
Method
The following concentrations exclude each other
O2 gt 5 mgl exclusion of Fe2+ Mn2+ NO2- NH4- gt 005 mgl H2S gt001 mgl
Fe2+ gt 02 mgl exclusion of NO3- gt 20 mgl
Mn2+ gt 02 mgl exclusion NO3- gt 20 mgl
H2S gt 01 mgl exclusion Fe2+ gt 01 mgl and Mn2+ gt 02 mgl
80 gt pH gt 55 exclusion of Ca2+ Mg2+ gt 1 mmoll
Result This method estimates if analysis results are correct
3 Charge Balance Error (CBE)
Issue Validity check of analysis results
Goal Check of analyses results or completeness of analyses
Data requirements Analysis results of all anions and cations with relevant concentrations
expressed in mol(eq)L
Method
One fundamental law of nature is that aqueous solutions (like water) are electrically neutral
This means that in real solutions the total sum of all the positive charges (cations) must equal
the total sum of all negative charges (anions)
Charge Balance sumcations = sumanions
Analytical errors andor unanalyzed constituents cause electrical imbalances One way to
quantify this imbalance is the charge balance error in percent
CBE = (sumcationsminussumanions)(sumcations+∣sumanions∣)times100
Interpretation of the Charge Balance Error (CBE)
CBE gt plusmn 5 analysis is incomplete (major ions are not measured) or incorrect the analyses are to
be repeated including those of additional (relevant) ions
negative CBE higher concentration of anions than of cations (not all relevant cations are analyzed)
positive CBE higher concentration of cations than of anions (not all relevant anions are analyzed)
using unfiltered samples that contain particulate matter which dissolve upon addition of acid (for
preservation purposes)
A suitable software-tool (freeware) for calculating CBE is
httpswwwlenntechcomcalculatorsaccuracyaccuracy-water-analysishtm
Recommendations on water monitoring in open-pit coal-mine areas in Mongolia (RWM)
45
4 Additional Validity Checks
Correlation of redundant parameters are to be given eg pH value or electrical
conductivity field measurement with laboratory measurement
Correlation of related parameters should be given eg electrical conductivity and
concentration of sulphate
The hydrochemical plausibility should be checked pH and concentration of the metal
ions
Chemical Characterization of Groundwater
The composition of the water is determined by the natural geogenic environment of the water
sources and chemical or biochemical reactions Knowing the sources of abstracted waters is
important for understanding the hydraulic system Possible sources may include precipitation
waters infiltrated waters from surface water bodies infiltrated waste water recharged
groundwater or fossil groundwater The following section shows some possibilities for
visualization of analyzed data from water samples This visualization allows the classification of
different water samples based on sources A special tool is the analysis and interpretation of
isotopes An estimation of the age of groundwater is possible with the results of this analysis For
more information on this topic consult the corresponding literature
1 Classification of the Water Sample by the Electrical Conductivity
Data Requirements Measured electrical conductivity
Method
Comparison of the measured values of the electrical conductivity with values from Table 8
Table 8 Conductivity for Different Types of Water
Type of Water Electrical Conductivity [microScm]
ldquopurerdquo water 0055
Distilled water lt3
Precipitation water 5 - 100
(natural uncontaminated) groundwater 100 ndash 1900
Drinking water 150 - 800
Mineral water 150 - 2000
Sea water (salt water) Round about 50 000
Result Information about the source of a water sample classification of different samples
Recommendations on water monitoring in open-pit coal-mine areas in Mongolia (RWM)
46
Graphical Tool for the Interpretation of Chemical Analyzes
The use of graphical tools can help illustrate the different types of water Different types of water
can indicate different sources (eg catchment areas different aquifers fossil groundwater)
1 Schoeller Plot
Issue Visualization and classification of water analysis results
Goal Classification of different water samples into groups
Data requirements Analysis results of anions and cations of diverse samples expressed in
mol(eq)L (advantage analyses can be incomplete)
Method
Major ion analyses (in milliequivalents per liter) can be plotted semi-logarithmically to indicate
different hydrochemical water types This plot is called Schoeller-plot The plot has the
advantages that unlike trilinear plots incomplete analyses can be used and real parameter
concentrations are displayed
Result Information as to whether there are the same or different (different
sources) types of water for different samples
2 Piperrsquos Trilinear Plot
Issue Visualization of results from water analyses classification typecast
Source GW-Chart (Freeware
httpswaterusgsgovnrpgwsoftwareGW_ChartGW_Charthtml)
Goal Classification of different water samples into groups
Data requirements complete() concentrations of Calcium Sodium Potassium Magnesium
Chloride Sulfate Hydrogen Carbonate and Carbonate expressed in
mol(eq)L
Carbonate can be calculated by the software itself using the water
temperature The TDS (total dissolved solids) are also respected in the
calculation The TDS-value can estimate by 05 ∙ electrical conductivity
Method
To see the changes in groundwater chemistry at different locations and the extent of water rock
interaction data for the ionic composition of the water samples were plotted for both the time
periods using a Piper Trilinear diagram as shown in Figure 8 Piper Diagrams are broadly used
in hydrogeology as they illustrate the hydro-chemical characteristics of groundwater by
representing the percentage of anions and cations (in meq L-1) in separate triangular diagrams
Geochemically-similar waters are clustered in clearly defined areas which indicates water
mixing phenomena precipitation dissolution etc The piper diagram can also be plotted with
the help of software
Recommendations on water monitoring in open-pit coal-mine areas in Mongolia (RWM)
47
Figure 8 Classification by Piper Plots
Source httpswwwhatarilabscom
Result Information about the type and source of water for different samples
Presentation of Data using the Valjashko Diagram
A system for the representation and classification of groundwater based on the ratio of the mean
ions and their hypothethesized dissolved salts on the basis of the publication by Valjashko
(1961) offers information on the origin of the water Compared to other methods (eg PIPER
(1944) or FURTAK amp LANGGUTH (1967)) the system allows for a better description and genetic
interpretation of the chemistry of groundwater The waters can be characterized in their genetic
position in the infiltration cycle and the influence of human activity or salt waters can be
identified
Evaluation of the Suitability of Waters for Different Uses
Drinking Water
The main aim of the water analyses is to evaluate the suitability of water for various uses such
as domestic use irrigation or industrial use In the last few decades there has been a
tremendous increase in the demand for fresh water due to rapid growth of population and the
accelerated pace of industrialization
Irrigation Water
The use of the pumped water for irrigation can be an important possibility for sustainable water
management However potential salinization of the soil limits the use of waters for irrigation
Recommendations on water monitoring in open-pit coal-mine areas in Mongolia (RWM)
48
The following interpretation gives information about the potential hazard of salinization
through salinity or sodium concentration of waters
The sodium adsorption ratio (SAR) is an irrigation-water-quality parameter used in the
management of sodium-affected soils It is an indicator of the suitability of water for use in
agricultural irrigation as determined from the concentrations of the main alkaline and earth
alkaline cations present in the water It is also a standard diagnostic parameter for the sodicity
hazard of a soil as determined from the analysis of pore waters extracted from the soil
Sodium Adsorption Ratio (SAR) Criterion
Sodium absorption ratio is the measurement of sodium content relative to calcium and
magnesium in the soil-water medium and influences soil properties and plant growth The total
soluble salt content of irrigation water is generally measured by determining its electrical
conductivity (EC) reported in microsiemens per centimeter The individual classes are defined
as EC lt 250 microScm ndash Low-Salinity-Water 250 lt EC lt 750 microScm ndash Medium-salinity-water 750 lt
EC lt 2250 microScm ndash high-salinity water and EC gt 2250 microScm ndash very high-salinity water
The sodium or alkali hazard in the use of water for irrigation is determined by the absolute and
relative concentration of cations and is expressed as the sodium adsorption ratio (SAR) The
following formula is used to calculate SAR
= $amp()
where the sodium calcium and magnesium concentrations are expressed in mmolL
The results are shown as a WILCOX-Plot as shown in Figure 9
Figure 9 WILCOX-Plot
Ions in the equation are expressed in milliequivalent per liter (meql) The salinity hazard was
between medium and high for most samples One sample indicated a very high hazard The
sodium hazard was low for the most samples and moderate for one sample
Recommendations on water monitoring in open-pit coal-mine areas in Mongolia (RWM)
49
8 Reporting
The documentation of hydrogeological studies (eg monitoring results) should contain the topics
outlined in the following checklist
Checklist Contents of Hydrogeological Studies
General information about mine company consulting company scoping area period of validity
Description of the study area
Description of monitoring program
Hydrogeological calculations (eg water balances prognoses scenarios)
Interpretation of results
Conclusions and additional measurements if necessary
Details about the several topics are given in Table 9
Table 9 Overview about the documentation of Hydrogeological Studies
Monitoring Results Hydrogeological Calculation
Chapter Content
1 General information
Name amp address of the mining company (incl respons person)
Name amp address of the consulting company name of the responsible specialist
Title of the document
Objective of the study
Name of the mining area and location of the mine (AIMAG coordinates)
Scoping area
Validity period
Name amp signature of the author (expert specialist)
2 Details of the Report
Contents
References
Objectives of the reportstudy
3 Description of the Study
Area
Morphology
Geology
HydrologyHydrography
HydrologyMeteorology
Mining activities (eg development of dewatering)
More details see below the Table 9
4 Water Monitoring
(Quality amp Quantity)
Description of the monitoring
Results of the monitoring
Documentation (values eg in tables Annex I Chapter 6)
Visualization of the results (hydrographs)
More details see below the Table 9
5 Hydrogeological
Calculations
Hydrogeological Calculation
Description of the calculation methodology modeling
Determination Calculation water cycle parameters surface runoff hypodermic
runoff storage change groundwater recharge etc
Identification of the water balances
More details see below the Table 9
6 Interpretation of the
Results of (a) Monitoring
Description of direct mining activities and the impact to groundwater levels surface
water levels or flow rates and groundwater recharge
Recommendations on water monitoring in open-pit coal-mine areas in Mongolia (RWM)
50
Chapter Content
or (b) Description of non-direct impacts of mining activities (eg water quality geotechnical
stability)
Evaluation of the impacts regarding mining safety water supply systems (wells)
groundwater reserve surface waters (rivers) and protected landscape areas
7 Conclusions -
Requested
Measurements
Groundwater drawdown andor groundwater barrage
Wells galleries of wells (measured and planned) pumping rates number and location
of wells placement the filters and advancement of dewatering
Dewatering of the open mine groundwater input into the open mine sealing walls
reach of groundwater drawdown (groundwater cone) water levels in mine dumps
potential level of the confined groundwater (below coal layer) flow rate and influx
via slopes
Surface water (dewatering change of riverbeds)
Change of flow rates artificial lakes etc
mining water cycle (water use for irrigation water fixation of dust)
water quality
Description of realization of requirements from the side of the authorities
Technical measures to minimize impact of mining dewatering and water output eg
treatment of the waters storage of the contaminated water
Adaption and development of water monitoring in future
The description of the study area includes the existing information and data
Morphology
Information about the morphology should contain data of the altitude and the terrain structure
The terrain structure is an indicator for glacial structures the surface runoff or the mining
activities If airborne laser scan data is available it can be plotted to give an overview about the
morphology
Geology
An overview of the geological situation gives a ldquostandard sectionrdquo It contains all existing layers
of the study area The different layers should be described in regard to their distribution
thickness and their characteristics (eg hydraulic characteristics) The layers can be classified
by geological processes or characteristics The different aquifers should be defined Fault zones
and fault lines should be described by their position characteristics and possible hydraulic
impact The visualization can be realised by mapping (distribution of layers) and cross sections
Hydrology
Information about meteorology should include time series averages and extreme values for
precipitation and evaporation This data is a base for calculating water balances The
interpretation of time series can give reasons behind eg of changes of water levels or flow rates
The base data of the meteorological measurement station (position altitude and distance from
study area) should be given
The hydrographic information includes the name of surface waters (flows standing water
bodies) data of measurement (time series of water levels andor flow rates) information about
the measurement stations with the basic values like (average) high- low- and mean- water or
flowrate) and existing uses of waters incl existing legal This basis information are important to
estimate possible impacts of mine activities to the surface waters
Recommendations on water monitoring in open-pit coal-mine areas in Mongolia (RWM)
51
Mining Activities
The aim is to give short information about the development of the mine eg of the explorations
dewatering system (time series of pumping rates depth of water levels) development of dumps
etc This information is important for explaining and understanding the monitoring results (eg
changes of groundwater levels) An overview of the results of former studies should be also
implemented
Description of the Water Monitoring
Components of the documentation of water monitoring are given in the following checklist
Checklist Documentation of Water Monitoring in Reports
Mapping all measurement points (monitoring wells measurement points for flow rates and water
level in surface waters and at the dewatering system of the mine)
Master data about groundwater monitoring wells screened aquifer
Time interval for level measurements and sampling
Tables containing the results of water level measurements and water sampling flow rates
Hydrographs for water levels and selected parameters of water quality
Mapping results ( Chapter 7)
Hydrogeological Calculations
Documentation of Hydrogeological Calculations should contain
the aims of calculation (eg development of the groundwater depression cone over the previous
years reduced volume of the groundwater body prognosis of pumping rates or water balances)
the methods used (eg analytical equations see Chapter 7 numerical models)
the parameters used (see Chapter 9 in the case of modelling)
results (eg mapping)
Recommendations on water monitoring in open-pit coal-mine areas in Mongolia (RWM)
52
9 Implementation of Monitoring Results into a Numerical
Flow Model
Conception of a Numerical Model
Basics
Prediction models of the quantity and impact of the mine dewatering are the basis for technical
and financial planning Knowledge of the impact of dewatering to the aquifer to water balances
and to the surface water bodies is important for the water authority and other users of the
water
Numerical models can be a suitable tool for calculation of scenarios and the future state of the
groundwater dynamic The validity of this calculation is given by the quality of the model The
model quality depends on the information about geology hydrogeology climate conditions
hydraulic boundary conditions (eg in-output flow rates) and the density and the validity of
monitoring results
Some general notes about numerical flow models
The results of a numerical model are not an alternative for the monitoring results
Every numerical model is made for a special task and for a specific region
Every model is designed using the individual experience of the modeller
The information about the design and the quality of the model is to take into consideration if
model results are be reviewed
Modelling is an iterative process that includes definition of goals grid construction and
assignment of properties and boundary conditions steady state and transient calibration
validation of calibrations predictive simulations and sensitivity analysis
Goals of the Numerical Flow Model
There are three major issues related to groundwater in mining projects that need to be
addressed 1) mine dewatering requirements 2) stability of slopes and 3) environmental
impacts on groundwater levels and on groundwater quality during mining and post-mining
periods
Knowing what we want from the model or the model results is one of the first steps of model
development Some common goals of numerical models include
Simulation of the current hydraulic processes (groundwater abstraction dewatering
progress of the mine infiltration from surface waters water input into a surface water)
Calculation of the current (maybe unknown) impacts of mine dewatering to the
groundwater table (groundwater bodies) other groundwater users Outputs are the
calculated change of the water volume over time of an aquifer maps of the differences of
the groundwater level or calculated hydrographs for (monitoring) wells
Recommendations on water monitoring in open-pit coal-mine areas in Mongolia (RWM)
53
Calculated prediction of future state passive inflow to the mine (both in space and time)
active dewatering options (if required) which means necessary abstraction rates
number of wells well-galleries drawdown cone around the mine during the progress of
the mine and the dewatering systems flow direction for determination of the potential
path lines of substance transport flow velocity impact to other groundwater users pore
pressures as input for sloperoof stability analysis (dumps)
Calculation of a post-mining state eg groundwater levels after dewatering water level
in the residual pit (artificial lake)
Calculation of scenerios impact of the design of the dewatering system eg number and
location of dewatering wells required pumping rate for each well ( optimization of
number of wells)
A numerical flow model can be the basis for a simple geochemical mixing model or a
more comprehensive solute transport model to predict quality of water discharge during
the mining or pit-lake water chemistry for post-mining conditions
The addition of further tasks and goals after establishing the numerical model can cause a lot of problems in most cases
Choosing the Method Solver and Software
Numerical groundwater flow models are based on groundwater flow equations which are
differential equations that can often be solved only by approximate methods using a numerical
analysis The most common numerical solutions are the finite difference method and the finite
element method An often-used software for finite difference method is MODFLOW (commercial
and free ware see Table 10) The commercial software FEFLOW (DHI Wasy
httpswwwmikepoweredbydhicomproductsfeflow) is known for the finite element
method
Finite Difference Method or Finite Element Method - Both methods are suitable for calculation
of dewatering in mining The advantages and disadvantages of each numerical method are not
discussed here Each mine and each dewatering system are unique That some general basics are
to be respected as described below
General Notes
3D-Model transient flow groundwater generally flows into open mines three-dimensionally and
variably through time the groundwater system (Aquifer Aquiclude) can only be characterized by a
3D-Model in the most cases
Dewatered mines are characterized by high hydraulic gradients The discritization and solver
should be adapted to meet these conditions
Rewetting option A suitable water balance (eg the required pumping rate) can calculate if a dry
(dewatered) model cell can be rewetted in the numerical process
Modeling of mine dewatering isnlsquot focused on the unsaturated (vadoze) zone in the most cases
A small selection of suitable software for numerical models can be found in the following table
Recommendations on water monitoring in open-pit coal-mine areas in Mongolia (RWM)
54
Table 10 Examples for Suitable Software for Numerical Models
Name Source Description
MODFLOW 2005
httpswwwusgsgovsoftwaremodflow-2005-usgs-three-
dimensional-finite-difference-ground-water-model
three-dimensional-finite-difference-
ground-water-model
MODFLOW OWHM
httpswaterusgsgovogwmodflow-owhm
Borden Carter Gaur Anju Singh Chabungbam R 2016 Water
Resource Software Application Overview and Review World Bank
Washington DC copy World Bank
httpsopenknowledgeworldbankorghandle1098624762 License CC BY 30 IGO
(httphdlhandlenet1098624762)
MODFLOW OWHM (bases on
Modflow-2005 Unification of all
developed tools)
MODFLOW 6
httpswwwusgsgovsoftwaremodflow-6-usgs-modular-
hydrologic-model
Hanson RT Boyce SE Schmid Wolfgang Hughes JD Mehl
SM Leake SA Maddock Thomas III and Niswonger RG
2014 One-Water Hydrologic Flow Model (MODFLOW-OWHM)
US Geological Survey Techniques and Methods 6-A51 120 p
httpdxdoiorg103133tm6A51
MODFLOW6 Parallel developement
to Modflow 2005 Modflow 6 donrsquot
replace Modflow 2005
ModelMuse-A graphical user interface for MODFLOW-2005
httpswwwusgsgovsoftwaremodelmuse-a-graphical-user-
interface-groundwater-models
Winston RB 2009 and PHAST US Geological Survey
Techniques and Methods 6-A29 52 p
MODELMUSE is an open source tool
and recommended for pre- amp
postprocessing (all versions of
Modflow)
FLOWPY
httpsmodflowpygithubioflopydocintroductionhtml
Bakker M Post V Langevin C D Hughes J D White J T
Starn J J and Fienen M N 2016 Scripting MODFLOW Model
Development Using Python and FloPy Groundwater v 54 p 733ndash
739 doi101111gwat12413
FLOWPY is an open source tool and
recommended as additional tool to
modflow (Python-based)
FREEWAT
httpwwwfreewateusoftware-0
Rossetto R De Filippis G Borsi I Foglia L Cannata M Criollo
R Vaacutezquez-Suntildeeacute E 2018 Integrating free and open source tools
and distributed modelling codes in GIS environment for data-
based groundwater management Environmental Modelling amp
Software 107210-230
for pre- und postprocessing in
combination with QGIS FREEWAT
(not for all types of MODFLOW)
Extent of the Model (Temporal and Spatial)
Most of the processes involved are time-related That means a transient flow model is to be
established in the most cases The time before any mining activity should be the ldquostartrdquo of the
simulation period The ldquoendrdquo is defined by the tasks and goals of the model For example after
dewatering the groundwater levels increase and a post-mining quasi-steady-state (only
seasonal impacts to the groundwater level) will be reached a few decades after dewatering The
maximal time increments are given by the modeled processes (change of time related boundary
conditions period of calculation) Time increments of days (between 1 d to 30 d) are
recommended for this type of modeling The duration of the calculation is proportional to the
number of time increments
Recommendations on water monitoring in open-pit coal-mine areas in Mongolia (RWM)
55
Tips for Design of the Horizontal Extent of the Model
The processes to be simulated in connection with the mine must not be influenced by the external
boundary conditions (which are to be defined at the borders of the model)
A simple rule of practice is it is better that the model area is too large than too small
Modeling the whole (subterranean) catchment area The external boundary conditions of the
model are no-flow conditions (groundwater divides) given by hydraulic barriers
Bordering the model at known stable water levels like surface water levels of lakes or known
groundwater levels both outside of the maxima of the range of dewatering
If the subterranean catchment area is completely unknown and if there are no stable known
boundary conditions an estimation of the model extent is possible using the groundwater
recharge and the abstraction rate of dewatering The rate of dewatering gives the necessary size
of the catchment area The model area is to be larger than this because the spatial direction is
unknown
The vertical extension includes all relevant layers aquifers and aquicludes
The cell size is smaller (eg 1m ndash 100 m) in the focussed area and larger outside of it (gt100 m) in
the most cases
Implementation of Boundary Conditions
Hydraulic boundary conditions are water divide dewatering and infiltration wells surface
water bodies (lakes ponds) or streams with hydraulic contact to the aquifer groundwater
recharge and water levels (outside of the focused area) For detailed information see eg
httpswaterusgsgovnrpgwsoftwareModelMuseHelpindexhtmlboundaryconditions5ht
m
Implementation of Monitoring Results
The results of the water monitoring will be used for the calibration and validation of the
numerical model The model calibration means the minimization of the difference between
calculated and measured water levels (potential levels flow rates of fluids) by modification of
the model structure or its parametrization and modification of the boundary conditions
The quality of a numerical model can be shown by
comparing measured and calculated groundwater levels potential levels flow rates (eg
using a scatter-plot)
calculating the statistical parameters (eg mean error root mean square deviation
normalized root mean square deviation)
comparing the measured and calculated hydrographs and
mapping the difference between measured and calculated values
Recommendations on water monitoring in open-pit coal-mine areas in Mongolia (RWM)
56
Evaluation of Model Results
An evaluation of model results can be supported by answering the following questions of the
three parts a) quality of the used database b) validity and results of calibration and c)
plausibility of modeling
Questions for the Evaluation of Model Results
Are there validity databases for the description of the hydrogeological structure and
characteristics the hydraulic boundary conditions and monitoring results
Are the monitoring results clearly allocable in space and time
Are the relevant processes identified and quantified
Are the implemented boundary conditions plausible and sufficiently unrestrictive Are the
boundary conditions chosen to have a minimal impact on key model outcomes How is this
ascertained
Are all available types of observations (water levels flow rates) used for calibration
Is the model calibrated to steady-state pre-mining and transient (initial mine dewatering pump
tests etc) conditions
Are there graphs showing modeled and observed hydrographs at an appropriate scale Follow the
calculated values in the observed trend
Are calibration statistics reported and illustrated in a reasonable manner Is the model sufficiently
calibrated (spatially temporally) Are the calibrated parameters plausible Are the water volumes
and fluxes in the water balance realistic
Are the model predictions designed in a manner that meets the model objectives
Are the scenarios defined in accordance with the model objectives and confidence level
classification Are the pumping stresses similar in magnitude to those of the calibrated model Are
well losses accounted for when estimating maximum pumping rates per well If not Is there
reference made to the associated reduction in model confidence Are the pumping rates assigned
in the input files equal to the modeled pumping rates
Are there any anomalous boundary fluxes due to superposition of head dependent sinks (eg
evapotranspiration) on head dependent boundary cells (Type 1 or 3 boundary conditions) Does
predicted seepage to or from a river exceed measured or expected river flow
Is some qualitative or quantitative measure of uncertainty associated with the prediction reported
together with the prediction Are the sources of uncertainty discussed
Recommendations on water monitoring in open-pit coal-mine areas in Mongolia (RWM)
57
Reporting of Numerical Models
Numerical modeling is an iterative process over month to years Often only the modelers use the
numerical model with all details of in- and output data It isnrsquot possible to check all databases in
the implemented kind (input data files) for example That means the documentation of the
model is the most important way to control model assumptions and model results and to
evaluate the model That means all input data assumptions and results of the calculation
should be containing in the documentation of the model
Checklist Must-haves of Documentation Concerning Numerical Flow Model and Model Results
The model objectives and model confidence level classification have to been clearly stated Are the
objectives satisfied
Definition of space and period (eg flow of groundwater of the aquifers XY within the catchment
area of mine Z from pre-mining until post-mining state)
Description of the conceptional model Is the conceptual model consistent with objectives and
confidence level classification
Description and citation of the used data base and information base
Description of the design of the structure model discritizaion of the space cell size numbers of
model layers parametrization (eg mappimg of the implemented values hydraulic conductivity
the storage coefficient effective and total porosity anisotropy)
Description of the design of boundary conditions discretication of time mapping of the used
types of boundary conditions (including groundwater recharge) and detailed description (time
constant time variable values) mapping of the initial heads of water level (groundwater surface
water)
Information about the method used (finite difference method finite elemnte method) the
software and the solver
Description of the calibration process (a) analysis of the sensitive parameters (calc hydrographs
by different rates of groundwater recharge or hydraulic conductivity anisotropy of hydraulic
parameters) (b) measurement values for the comparision with modeled results (measured
groundwater levels of monitoring wells measured flow rates) (c) results of calibration (differences
between calculated and observed values and its distribution in space and time verbal discussion
of these results (causes of differences is the calibration satisfactory)
Results of the validation
Description of the basics (eg boundary conditions) for the calculation of prognosis andor
scenarios (eg change the number or pumping rates of dewatering wells)
Results of the calculation (mapping) and verbal discussion Are the results plausible Evaluation of
the uncertinity Is the model fit for its purpose
Further useful information about numerical flow modeling documentation of models and evaluation
of models are given at the following pages (in English language)
Recommendations on water monitoring in open-pit coal-mine areas in Mongolia (RWM)
58
About Modeling
ftpftpccrsnrcangccaadEMSAnitaGW_articlesgrwater_modelpdf
Documentation of Models
httpspubsusgsgovtm06a55tm6a55pdf
Evaluation of Models
httpspubsusgsgovsir20045038PDFSIR20045038part2pdf
httpsconsultationdplhwagovaucommunications14d86ef9supporting_documentsCompaniontomod
ellingguidelinespdf
Recommendations on water monitoring in open-pit coal-mine areas in Mongolia (RWM)
59
10 Audit Evaluation and Optimization of Monitoring
Auditing the monitoring program means evaluating and reviewing the methods used in the
monitoring program and identifying additional information required It is important to
recognize that the environmental and water management requirements and driving forces
change from time to time and methods of monitoring improve Monitoring programs must
therefore be updatedmodifiedimproved regularly to reflect these changes or modifications in
practices and procedures The rationalization of the monitoring program is also required to
ensure that the program remains effective and properly focused and that it does not entail
excessive costs
The evaluation of a monitoring program includes
Training of the staff
Certification (Staff laboratory techniques of measurement)
Accreditation of the laboratory
Standardizations (proceedings compliance management)
ISO 14001
Recommendations on water monitoring in open-pit coal-mine areas in Mongolia (RWM)
60
Specific Glossary
Unconfined Aquifer An aquifer which is not overlain by any confining layer but has a
confining layer at its bottom is called unconfined aquifer It is normally exposed to the
atmosphere and its upper portion is partly saturated with water The upper surface of
saturation is called the water table which is under atmospheric pressure Therefore this aquifer
is also called phreatic aquifer
Perched Aquifer This is a special case of an unconfined aquifer This type of aquifer occurs
when an impervious or relatively impervious layer of limited area in the form of a lens is located
in the water-bearing unconfined aquifer The water storage created above the lens is the
perched aquifer and its top layer is called perched water table
Confined Aquifer Also called artesian aquifer this is a type of aquifer overlain as well as
underlain by confining layers The water within the aquifer is therefore held under pressure It
is also sometimes called pressure aquifer If the aquifer has high outcrop laterally then the
ground surface there will have a positive hydrostatic pressure creating the conditions for a
flowing well Water from such well comes to the surface without pumping The imaginary level
up to which the water will rise is called piezometric surface
Leaky Aquifer In nature truly confined aquifers are rare because the confining layers are not
completely impervious An aquifer that is overlain or underlain by a semi-pervious layer
(aquitard) through which vertical leakage takes place due to head difference is called leaky
aquifer or semi-confined aquifer The permeability of the semi-confining layer is usually very
small compared to the permeability of the main aquifer Thus the water which seeps vertically
through the semi-confining layer is diverted internally to proceed horizontally in the main
aquifer
FracturedFissured Rock Aquifer Fractured rock aquifers (bedrock crystalline rock hard
rock and basement) have limited storage capability and transports water along planar breaks
Aquitard A body of rock or stratum of sediment that retards but does not prevent the flow of
groundwater from one aquifer to another
Aquiclude (or aquifuge) is a solid impermeable area underlying or overlying an aquifer
Porosity In soil mechanics and hydrology porosity is defined as the ratio of volume of voids to
the total volume of porous medium The significance of the porosity is that it gives the idea of
water storage capacity in the aquifer Qualitatively porosity less than 5 is considered small
between 5 and 20 as medium and above 20 is considered large
Hydraulic Conductivity is a property of soils and rocks that describes the ease with which a
fluid (usually water) can move through pore spaces or fractures It depends on the intrinsic
permeability of the material the degree of saturation and on the density and viscosity of the
fluid Saturated hydraulic conductivity Ksat describes water movement through saturated media
By definition hydraulic conductivity is the ratio of velocity to hydraulic gradient indicating
permeability of porous media
Recommendations on water monitoring in open-pit coal-mine areas in Mongolia (RWM)
61
The water cycle also known as the hydrologic cycle or the hydrological cycle describes the
continuous movement of water on above and below the surface of the Earth
Groundwater recharge also known as deep drainage or deep percolation is a hydrologic
process where water moves downward from surface water to groundwater Recharge is the
primary method through which water enters an aquifer This process usually occurs in the
vadose zone below plant roots and is often expressed as a flux to the water table surface
Groundwater recharge also encompasses water moving away from the water table further into
the saturated zone Recharge occurs both naturally (through the water cycle) and through
anthropogenic processes (ie artificial groundwater recharge) where rainwater and or
reclaimed water is routed to the subsurface
Climatic Water Balance (CWB) The climatic water balance (CWB) is defined as the difference
between precipitation depth and the depth of potential evapotranspiration at a given site during
a certain time period
Groundwater Monitoring Wells (GWM) Groundwater management point groundwater
observation well both are common synonyms
Water Quantity in this document means water level flow rates and water volume
Groundwater surface Groundwater table pressure table (in case of confined groundwater) are
common synonyms
Recommendations on water monitoring in open-pit coal-mine areas in Mongolia (RWM)
62
Annexes
I Forms
Table I-1 Example for the Documentation of a Monitoring Well
UNIT Example 1 Example 2 Example 3
Number Name of the measurement
point -- 4500123 HY-45-2018 000789 (73L)
ID (well borehole)
Owner of the well
Coordinate Northing -- 5712345 5745678 5756789
Coordinate Easting -- 5412345 5445678 5456789
Location (Aimag village mine)
Elevation (terrain level) -- 10757 11229 10944
Elevation of well head [m asl] 10761 11237 10951
Name of the hydraulic connected
aquifer -- 100 300 111
Water level pressure level [m asl] 10635 10960 10804
Diameter of the casing [mm] 115 115 115
Drilling Method dry Dry dry
Diameter of the borehole [mm] 324 324 324
Bottom of the monitoring well [m asl] 10181 10330 10200
Screen (top ndash bottom) [m asl] 10221 ndash 10201
Material of
construction
blank casing sump
pipe -- PVC-U PE-HD PE-HD
tube of the screen -- PVC-U PE-HD EWD
Length of the
casing
blank casing [m] 540 300 150
tube of the screen [m] 20 20 30
sump pipe [m] 20 10 20
Thickness of filter sand filter gravel [m] 30 30 40
Recommendations on water monitoring in open-pit coal-mine areas in Mongolia (RWM)
63
annulus sand barrier (between
filter sand and clay
seal)
[m] 10 10 10
clay seal [m] 30 100 30
filling sand [m] 510 190 120
Data logger yesno --
Water sampling yesno
Remarks Examples no water no
access observation well destroyed
maintenance repair necessary
Recommendations on water monitoring in open-pit coal-mine areas in Mongolia (RWM)
64
Table I-2 Form for a Water Sample (source LMBV mbH Merkblatt Montanhydrologisches
Monitoring 2019)
JOURNAL for Sampling of Groundwater
Date Time Sample-Ndeg
Object Client
NameNumber
of Moni well
Other Ndeg
Position Easting Northing
Type of Moni Well Single Well
Bundle of Monitoring wells
(please mark) group Construction Material
Measurm point [m asl] Diameter of the Casing cm
Position of screen bottom
Date Level of GW
[m below MP]
top
1 pump m
2 pump m
Depth of the
moni well Constr [m] 3 pump m
sonded [m]
Before sampling
m
After sampling
m
Zone of Sampling mixture Depth of the sample [m]
top central bottom
Type of Sampling Dopple pump
Centrifugal pump
cock suction drawing
Pumping Rate
[Lmin]
Duration [min]
Volume
[msup3]
Analysis in
Field
Temperature of GW [degC]
Air-Temperature
[degC]
pH-Value [-]
el Conductivity [microScm]
Oxygen [mgl]
Redox potential UG1) UH2)
[mV]
perceptions clear white grey yellow Brown
Recommendations on water monitoring in open-pit coal-mine areas in Mongolia (RWM)
65
At the sample Color
no low medium strong
Turbidity
no aromatic putrid sanious chemical
Odor
yes no yes no Chlorine Mineral oil
Out gasing Deposit
Vessel Glass light dark Plastic
Conservation
See
Documentation
cooler refrigerator Date Time
Transportstorage
Delivery
to the
lab
Remarks
Institution
(stamp)
Sampler
(signature)
Recommendations on water monitoring in open-pit coal-mine areas in Mongolia (RWM)
66
II Technical Details
Table II-1 Construction Details for Monitoring Wells (Water Level and Water Quality)
Construction Diameter Pipe Inner Diameter ge DN 50 (2) for water level measurements pipe inner
Diameter ge DN 100 (4rdquo) for water sampling wells
Material of Construction HDPE PVC-U
Length of the Filter Pipe 1- 2 m (in special cases this can also be longer)
Filter Size and Filter Filling
Based on the on-site wet sieving the following filling diameter and filter gap
size are recommended
Composition of the
Aquifer Filling Diameter [mm] Filter Gap Size [mm]
Middle sand and
fine sand fraction 071 - 125 05
Course sand 20 -- 315 15
Solid rock 20 -- 315 15
The use of gravel adhesive filters is excluded In principle the groundwater
measuring well has to be backfilled with a bulk pipe
Length of the fill material should be from about 05 m under the lower edge
of the filter up to about 05 m over the upper edge of the filter
Length of the Counterfilter about 05 m on both sides in direct contact with the upper and lower filter
material
Seals in the Annular Space
1 m (through geophysical methods localizable)
Bothsides in direct contact with the counterfilter as well as 10 m (or
completely) sealed of drilled aquicludes
A missing or incorrectly installed seal can cause a hydraulic short circuit
between hydraulically separated aquifers In doing so the functionality of the
drainage system of the mine can be impaired Furthermore a water
exchange of different aquifers can cause a mixture of different water
qualities Water samples from not right-sealed monitoring wells are not
useable
Sump pipe 1 m with bottom plate
Bottom Closure
Protecting pipe construction as measuring well head ldquohooksrdquo against the
throwing in of solids pouring in of fluids secure cap closure
Installation with spacers and pouring pipe (should be carried along during installation)
Recommendations on water monitoring in open-pit coal-mine areas in Mongolia (RWM)
67
Table II-2 Overview of the Recommended Processes for the Functionality Test of Groundwater
Measuring Points
Analysis Method Parameters to be Measured and Recorded Application Hard (H)
or Loose (L) Rock
Camera Inspection (OPT) Depth profile of the visual contamination of
the inner construction
H L
Caliper and Microcaliper Log (CAL-M) Depth inspection of the inner diameter H L
Gamma Ray Log (GR) Depth profile of the natural radioactivity H L
Gamma-Gamma Log (GG) Depth profile of gamma radiation dispersion
in the rock (Conclusions about back-filling
density)
H L
Neutron-Neutron Log (NN) Depth profile of the neutrons after the
deceleration of fast neutrons (Conclusions
about porosity through the hydrogen
content)
H L
Magnetic-Log (MAG) Depth profile of magnetic susceptibility of
the backfill
Predominately H
Resistance measurement in focused
configuration (FEL)
Depth profile of the electrical backfill
resistance
Predominantly H
Short Pump Trial (KPV) Time-profile of the groundwater level
decrease and pump-out rate
Predominantly L
Packer Flow Meter Measurement
(FW-PACK)
Depth-dependence of the groundwater flow
rate in the groundwater measuring well
H L
Measuring the Salinity (SAL) and
Temperature (TEMP)
Depth profile of the salinity and temperature
of the groundwater in the measuring well
H L
OPTIONAL Filling Test Time profile of the decrease after water
filling the groundwater measuring well
L
OPTIONAL 12-hour well
performance test (like observation
well test)
Dependence of the groundwater level
decrease on the pump flow rate in the
measuring well
L
Recommendations on water monitoring in open-pit coal-mine areas in Mongolia (RWM)
68
Table II-3 Calculation of Flow Rates for Measurement Weirs (Rectangular and V-Notch)
Rectangular
Weir
Q = 23 ∙ micro ∙ b ∙ (2∙g)12 ∙ (he +00011)32
Q = discharge [msup3s]
g = gravitational acceleration (g = 981
ms2)
he = head on the weir [m] measured in
a distance of
3 x he to 4 x he behind the weir
b = length of the weir [m]
micro = weir coefficient micro = 062 sharp
with air ventilation
micro = 05 wide sharp without air
ventilation
Triangular (V-
notch) Weir
Q = 815 ∙ micro ∙ tan(α2) ∙ (2∙g)12 ∙ (he)52
Q = discharge [msup3s]
g = gravitational acceleration (g =
981 ms2)
he = head on the weir [m] measured
in a distance of
3 x he to 4 x he behind the weir
b = length of the weir [m]
micro = weir coefficient micro = 062 sharp
with air ventilation micro = 05 wide
sharp without air ventilation
if α = 90deg than
Q = 1352∙he2483 [msup3s]
preconditions
005 m lt he lt ca 04
Hew lt 04 hebo lt 02 w gt 045 m
Recommendations on water monitoring in open-pit coal-mine areas in Mongolia (RWM)
69
Table II-4 Purge Volume Determination (VP) of the Water Sampling
The Purge Volume Determination (VP) is carried out by calculating the hydraulic criteria and by
measuring the chemical criteria
Hydraulic Criteria
The purge volume can be calculated by the equation
VP = n π4 dsup2 h
With
h = length of water column in the screen of the well [m]
d = diameter of well (borehole) in [m]
V = volume of water [msup3]
n= volume factor
n ge 15 in [17] n = 3 to n = 5
If the pump is installed more than one meter above screen this additional distance is
to be added to the value of h
Chemical Parameter
Stabilization Criteria
Achievement of the chemical stability criteria is the guarantee for a homogeneous
water sample Otherwise the sample would represent a mixture from different
waters and a mixture doesnrsquot represent the quality of the water from the aquifer
With respect to the groundwater chemistry an adequate purge is achieved when the
pH of the groundwater has stabilized within plusmn 01 the specific conductance within plusmn
5 and the turbidity has either stabilized or is below 10 nephelometric turbidity
units (NTUs) The temperature of the groundwater is not suitable for proof the
chemical stability criterion because it changes too rapidily during sampling
especially in extreme climatic regions This data should be noted in the field log
during sampling see ANNEX I Table I-2
For these analyses the pumped volume shouldnrsquot be too high because in this case
the water sample can represent another zone of the aquifer (eg deeperhigher
layers)
Recommendations on water monitoring in open-pit coal-mine areas in Mongolia (RWM)
70
Table II-5 Parameters of Analysis of Water Samples (eg ldquo0-measurementrdquo)
Parameter Groundwater Surface Water Water of streams and in the pit
Quantity
Water level x x x
Flow rate x
Quality
pH-Value x x x
Electrical Conductivity x x x
Oxygen x x x
Redox-potential x x x
Acidity x x x
Alcality x x x
Fe (II) x x x
Sulphate x x x
Sulfide (x)
Chloride x x x
o-Phospate x x x
Phosphate (all) x x x
nitrate x x x
nitrite x
Ammonium x x x
Hardness (total) x x x
Carbonate hardness x x x
DOC X
TOC x x
TIC X X X
Dry residual x
Calium x x x
Sodium x x x
Calcium x x x
Magnese x x x
Manganese x x x
Phytoplancton x
Zoo-Plancton x
Depth of visibility x
Depth profile x
Turbidity x
Recommendations on water monitoring in open-pit coal-mine areas in Mongolia (RWM)
71
Table II-6 Type of Sample-Flagons and Reagents for the StabilizationConservation of Water
Samples
Parameter Type of sample flagons
and reagents
Method for chemical
stabilizationconservation of water
samples
Coloring (SAK-436) turbidity
(TEF) SAK-254 Ammonium
nitrate nitrite calcium
magnesium sulphate chloride
Glass Polyethylene cooling
Oxygen (Winkler) acid-base
capacity phosphate
Glass with grinding
borosilicate glass full plug
cooling
Bore borate silicate sodium
potassium fluoride
Polyethylene cooling
Cyanides Polyethylene pH-Value 9-12 by input NaOH
recommendations of the laboratory
Metal ions (Al Ag As Ba B Ca
Cd Co Cr Cu Fe Li Mg Mn Mo
Ni Pb Sb Si Sr Ti Tl U V Zn)
Polyethylene FEP acidify by HNO3 to pHlt2 for analyzing
of dissolved metal ions filtration in field
(membrane filter 045 microm)
mercury borosilicate glass acidify by HNO3 to pHlt2 add-on
K2Cr2O7 (005)
DOC TOC Brown glass cooling
Recommendations on water monitoring in open-pit coal-mine areas in Mongolia (RWM)
72
III Supporting Websites
Table III-1 Some Online Sources of Basis Information about Geology and Hydrogeology
Topic Website
Hydrogeology httpswwwcommdevorgwp-contentuploads201505IFC008_PPT_
Community_Rev1_FINAL_MON_250517pdf
Water httpirimhenamemgovmnindexphp
httpeicmnwater
httpraisesuiritsukubaacjpnewpressyoushi_sugita9pdf
httpeicmngeodata httpeicmnsurfwater
Meteorology amp
Hydrology
httpirimhenamemgovmnuploadfilesButeel_35-2015pdf
httpeicmnclimate
httpwwwtsag-agaargovmnatmosphere
httpwwwsteelhouseinfoindexphpmn94294-mongolian-weather
Geology httpirimhenamemgovmnuploadfilesButeel_35-2015pdf
Aquifers httpwwweicmngroundwater
httpwwweicmnwaterbasin
httpwwweicmngroundwaterdepositinfo_morephpgid=52
Groundwater
Recharge
httpeicmngroundwatergisphp
httpwwwewa-onlineeuyoung-water-professionals-
conferencehtmlfile=tl
_files_mediacontentdocuments_pdfEvents2016IFAT202016115
0_Sunjimaapdf
Water Basins httpeicmngroundwatergisphp
httpwwwiwrm-
momodedownloadAndrewKausDissertation2018pdf
Groundwater
Monitoring
httpwwwgroundwatermn
httpwwwewa-onlineeuyoung-water-professionals-conference
htmlfile=tl_files_mediacontentdocuments_pdfEvents2016IFAT2
020161150_Sunjimaapdf
Norms httpgreenassessmentmnuploadfiles
httpwwwmnemnwp-contentuploads201709Tailan-pdf-last-1-
ilovepdf-compressed-ilovepdf-compressedpdf
httpswwwcommdevorgwp-
contentuploads201505IFC008_PPT_Community_Rev1_FINAL_MON_250517pdf
Recommendations on water monitoring in open-pit coal-mine areas in Mongolia (RWM)
73
IV Mining Water in Mongolian Laws
(Extractions)
The Law of Mongolia on Water (2012) is one of the most important environmental laws
Especially for the mining sector the law plays an integral role However the current
legislation is only poorly linked to the mining objectives Therefore authorities might
experience difficulties in the decision-making process The specific interaction and
compatibility should be checked and special attention must be paid to ambiguous cases
Art 46 The cabinet members in charge of nature and environment establish a water
resource council and approve the rules and regulations
Water Monitoring Art 6 amp 25 Water monitoring-research network The State
Administrative Central Organization in charge of nature and environment is supposed to
establish and maintain a water monitoring research-integrated network Organizations
and economic entities such as mining companies are a component of this network
Article 8 The State Great Hural (parliament of Mongolia) has the power to determine the
fees for water usage and water pollution
Article 17 The duties and powers of the basin administration include receiving
applications from citizens economic entities and organizations for well and hole drilling
as well as channel and canal building for the purpose of water usage to make
conclusions on water use on the basis of water resource management plans and in
accordance to 284 of the present law and to enter new wells into a database
Additionally the basin administration defines the grounds for water usage and water
pollution fee in accordance with the relevant legislation monitors the potential usable
water resources and water utilization at basin area regularly Licenses for mineral
exploration and exploitation in the relevant basin shall be granted based on the
recommendation of the relevant basin administration
Article 19 The respective soum (second level subdivision below the aimags (province of
Mongolia)) has the power to charge the water usage and pollution fees in accordance
with the legislation and to supervise its payment
The basin councilrsquos tasks are to monitor whether the water user is fulfilling its obligation
set out in article 30 of the present law to monitor whether the water user is fulfilling its
duty to reduce negative impacts elimination of damage and rehabilitation work
Article 21 A license for professional institutions can be issued by the State
Administrative Central Organizations in charge of nature and environment for a period
of five years and could be extended for another five years if the institution fulfilled its
duty in a proper way
Article 24 Protection of water resource against contamination The basin administration
can issue a permit to entities engaged in waste water removal with a quantity exceeding
500 m3 per day or contaminated waste water specified in 10112 of the present law The
governors of the soum and district may also issue permits However only when the
Recommendations on water monitoring in open-pit coal-mine areas in Mongolia (RWM)
74
volume of waste water per does not exceed 50 m3 In case of disregarding of the norms
specified in the permit or repeatedly disregarding the standard procedures the permit
might be subject to cancellation
Article 25 Payment and compensation for water pollution and depletion The permit
holder is responsible for the supervision of the quantity and the quality of the waste
water and the discharge of it after having met the standard requirements The holder is
furthermore liable to pay a water contamination fee If treatments do not meet standard
requirements the permit holder might be subject to a water pollution compensation
which has to be paid to the environment protection fund Water pollution and water
depletion fees are determined according to the law
Water utilization Article 27 and 28 Issuing permission to water users Permissions for
well and hole drilling and digging of channels and canals are issued by the aimag capital
city environment authority Applications to obtain a permit need to be submitted to that
authority and needs to document ie the following information Purpose and volume of
water usage copy of proof of land ownership possession and use information
regarding the wells The aimag capital city environment authority registers the wells and
holes in the water database and issues well passports
Citizens economic entities and organizations need to submit the water usage request to
a legal person specified in 284 of the present law The following documents need to be
annexed to the request A map indicating the water source to be used and its location
exploration and survey reports of water and mineral water resources quality
composition and conclusion on potential usable resources amount of water to be used
per day and its purpose drawings and project of water facilities production capacity
technical and economic indications environmental impact assessment documents In
case of the utilization of water for strategically important mineral deposits the permit
should be valid throughout the duration of the exploitation license
Article 31 Water usage fees Upon usage of water fees are charged which are set by the
law In case of usage of water exceeding the permitrsquos volume escalated rates up to 50
may apply The state administrative central organization will determine the exact rate
which the government needs to approve
Recommendations on water monitoring in open-pit coal-mine areas in Mongolia (RWM)
75
V Regulations concerning Water Monitoring and Water Management in
Mongolian Standards (MNS)
Mongolian standards are stored in httpgreenassessmentmn and httpwwwmnemn
Table V-1 Regulations about water monitoring and water management in Mongolian Standards (MNS)
Task Mongolian Standard (MNS)
Environmental protection and
hydrology general
requirements
MNS 334288 Groundwater protection General requirements Replaced by
MNS 33421982 General requirements for protection of groundwater from
pollution contamination
MNS 0017-1-1-101979 Water use and protection Terms and definition
MNS 0017-1-1-141980 Hydrosphere Classification of water use General
requirements
Water quality general
requirements
MNS 45861998 Water environmental quality General requirements
MNS 49432000 Water quality Waste water
MNS 4943-2011 Effluent treated waste water (Max content of polluting
substances in the waste water released to open nature monitoring
requirements during operation)
MNS 6148-2010 water quality Maximum limit of substance contaminating
the groundwater
MNS 9002005 Environment The human health protection Security Drinking
water Hygienic requirements and quality control
MNS 25731978 Environmental protection Hydrosphere Water quality
indicators
Surface water quality
monitoring procedure
MNS 404788 Environmental protection Hydrosphere
Water sampling MNS (ISO) 48671999 Water quality Sampling Part 3 Recommendation of
sample preparation and storage
MNS (ISO) 5667-12002 Water Quality Sampling Part 1 Guidance on the
design of sampling programs
MNS (ISO) 5667-22001 Water Quality Sampling Part 2Guidance on
sampling techniques
MNS (ISO) 5667-42001 Water Quality Sampling Part 4 Guidance on
sampling procedure of natural lake and reservoir
MNS (ISO) 5667-102001 Water Quality Sampling Part 10 Guidance on
waste water sampling procedure
MNS (ISO) 5667-112000 Water quality Sampling Part 11 Guidance on
groundwater sampling
MNS (ISO) 5667-132001 Water Quality Sampling Part 13 Guidance on
waste water and water treatment facility sludge sampling procedure
Water sampling analysis MNS (ISO) 110832001 Environment Water Quality Determination of
chromium (VI) uing spectrometric method (15-diphenylcarbazide)
MNS 50322001 Water quality Determination of heavy metals using the
Rontgen fluorescence method
MNS (ISO) 119232001 Water quality Determination of suspended solids by
filtration through glass (fibre filters)
MNS (ISO) 48891999 Water quality Determination of electrical conductivity
MNS 44201997 Drinking water Determination of mercury Atomic
absorption method
MNS 44302005 Drinking water Determination of measuring iron
compounds
MNS 43411996 Industrial water Determination of magnesium
concentration
MNS 43481996 Industrial water Determination of copper
Recommendations on water monitoring in open-pit coal-mine areas in Mongolia (RWM)
76
Task Mongolian Standard (MNS)
MNS 44312005 Drinking water Determination of nitrite concentration
MNS 42171994 Drinking water Determination of total nitrate concentration
MNS 39351986 Drinking water General requirement for field testing of
water
MNS 39361986 Drinking water Field analysis methods
MNS 39001986 Drinking water Determination of taste color smell and
turbidity
MNS 39001986 Drinking water Determination of taste color smell and
turbidity
MNS 35321983 Surface water Determination of lead content
MNS 0017-1-5-151980 Environmental protection Hydrosphere
Determination method of oil products in water
MNS 44231997 Drinking water Method of measuring dry residue
MNS 25701978 Method of measuring water purity
MNS 40791988 Water quality terms and definition
MNS (ISO) 78872000 Water quality Determination method of water color
and its checking
MNS 57902007 Water quality Determination of manganese (Mn)
concentration
MNS (ISO) 48171999 Water quality Determination of ammonium
MNS (ISO) 79802003 Water quality Determination of calcium and
magnesium through atom absorption spectrometer method
MNS (ISO) 58142005 Water quality Determination of dissolved oxygen
concentration Electric chemistry method
MNS (ISO) 60602001 Water quality Determination of chemical oxygen
demand
MNS (ISO) 92802001 Water quality Determination of sulphate by barium
chlorine gravimetric method
MNS (ISO) 105232001 Water quality Determination of pH
MNS 56662006 Water biological properties Assessment Determination
method of active sludge of waste water treatment facility
MNS 56682006 Water biological properties assessment Microbiological
analysis method of waste water

ADVISORY ASSISTANCE PROGRAMME (AAP)
of
the Federal Ministry for the Environment Nature
Conservation and Nuclear Safety
Project No 90148
Project Strengthening of environmental protection
requirements for the rehabilitation of areas devastated
by coal-mining in Mongolia
Recommendations on water monitoring in open-pit coal-mine areas in Mongolia (RWM)
by
GUB Ingenieur AG
Niederlassung Freiberg
Halsbruumlcker Straszlige 34
09599 Freiberg
Telephone 0049 3731 69228-0
E-Mail infogub-freibergde
Internet wwwgub-ingde
and
Lausitzer und Mitteldeutsche
Bergbauverwaltungsgesellschaft mbH (LMBV mbH)
Knappenstraszlige 1
01968 Senftenberg
On behalf of the German Environment Agency
Report completed in November 2019
This project was financed by the German Federal Environment Ministryrsquos Advisory Assistance
Programme (AAP) for environmental protection in the countries of Central and Eastern Europe the
Caucasus and Central Asia and other countries neighboring the EU It was supervised by the German
Environment Agency
The responsibility for the content of this publication and the photos lies with the authors
Image on the front page Open-pit coal-mine Sharyn Gol (Ch Konrad 2018)
Recommendations on water monitoring in open-pit coal-mine areas in Mongolia (RWM)
5
Abstract Recommendations on Water Monitoring in Open-pit Coal Mine Areas
Monitoring and understanding the local water system provides a basis for a more sustainable and efficient water management
This document gives recommendations concerning the planning and technical realization of water monitoring system for open-pit coal-mines while providing focus on the interpretation documentation and reporting of monitoring results These recommendations are based on site visits to Mongolian open-pits mines as well as experiences from water monitoring in lignite mining in Germany which have been adapted by considering the current conditions in Mongolia
These recommendations are intended for managers at the operational level but they may also be useful for environmental officials competent authorities non-government organizations students and people with a general interest in the best practices associated with monitoring the quality and quantity of ground and surface waters in and around open-pit coal-mines The goal of this work is to improve the mining industryrsquos environmental performance
Kurzbeschreibung Empfehlungen zum Wassermonitoring fuumlr Gebiete des Kohlentagebaus
Grundlagen fuumlr eine nachhaltige und wirkungsvolle Wasserwirtschaft sind das Systemverstaumlndnis und die messtechnische Erfassung des lokalen Wasserhaushaltes
Mit dem vorliegenden Dokument sollen Empfehlungen zur Planung und technischen Realisation fuumlr das Wassermonitoring in Kohlentagebauen gegeben werden wobei der Schwerpunkt auf der Interpretration Auswertung und der Erarbeitung von entsprechenden Bereichten liegt Diese Empfehluingen basieren auf Befahrungen mongolischer Tagebau und Erfahrungen zum Wassermonitoring die im Braunkohlentagebau in Deutschland gemacht worden sind wobei letztere auf die gegenwaumlrtigen mongolischen Verhaumlltnisse angepasst worden
Die vorgelegten Hinweise sind fuumlr Tagebautreibende genauso wie fuumlr Umweltinspektoren Behoumlrdenvertreter NGOs Studenten und Interessenten bewaumlhrter Praxis des Monitoring von Grund- und Oberflaumlchenwasser hinsichtlich Menge und Beschaffenheit in und um Kohlentagebaue gerichtet Ziel dieser Arbeit ist die Umweltvertraumlglichkeit des Bergbaus zu verbessern
Recommendations on water monitoring in open-pit coal-mine areas in Mongolia (RWM)
6
Table of Contents
List of Figures 8
List of Tables 9
Summary 10
1 Forward 11
2 Introduction 12
Mining and Water 12
Goals and Outputs of Water Monitoring in Mining Areas 12
Legal Framework and Standards 14
Processes and Outputs of Water Monitoring 15
Preliminary Characterization of the System 16
3 Definition of Monitoring Objects 19
4 Groundwater 21
Use of Existing Groundwater SamplingMeasurement Points 21
Planning of Positions for (New) Groundwater Observation Wells 22
Construction of New Groundwater Monitoring Wells 23
Monitoring Program 25
Groundwater Sampling 26
5 Surface Water 30
Objects of Surface Water Monitoring 30
Monitoring Program 30
Water Level Measurement 31
Flow Rate Measurement 31
Surface Water Sampling 34
6 Data Management 36
7 Interpretation and Analysis of Monitoring Results 39
Validity Check Visualization and Interpretation of Water Level Measurements 39
Hydrographs 39
Validity Check Visualization and Interpretation of Water Quality Measurements 43
Chemical Characterization of Groundwater 45
Evaluation of the Suitability of Waters for Different Uses 47
8 Reporting 49
9 Implementation of Monitoring Results into a Numerical Flow Model 52
Conception of a Numerical Model 52
Recommendations on water monitoring in open-pit coal-mine areas in Mongolia (RWM)
7
Basics 52
Goals of the Numerical Flow Model 52
Choosing the Method Solver and Software 53
Extent of the Model (Temporal and Spatial) 54
Implementation of Boundary Conditions 55
Implementation of Monitoring Results 55
Evaluation of Model Results 56
Reporting of Numerical Models 57
10 Audit Evaluation and Optimization of Monitoring 59
Specific Glossary 60
Annexes 62
I Forms 62
II Technical Details 66
III Supporting Websites 72
IV Mining Water in Mongolian Laws 73
V Regulations concerning Water Monitoring and Water Management in Mongolian
Standards (MNS) 75
Recommendations on water monitoring in open-pit coal-mine areas in Mongolia (RWM)
8
List of Figures
Figure 1 Major Laws Related to Minerals and Mining in Mongolia
Concerning the Environment 14
Figure 2 Hydrological Triangle and the Construction of Water Level
Lines 23
Figure 3 Different Types of Monitoring Wells 24
Figure 4 Examples of Water Level Gauges for Surface Water 31
Figure 5 Velocity Measurement 32
Figure 6 Example of a Triangular Weir 32
Figure 7 Example of Water Level Hydrographs 40
Figure 8 Classification by Piper Plots 47
Figure 9 WILCOX-Plot 48
Recommendations on water monitoring in open-pit coal-mine areas in Mongolia (RWM)
9
List of Tables
Table 1 Characteristics of the Aquifer System per Zone 17
Table 2 Characteristics and Hydraulic Boundary Conditions of the
Aquifer System per Zone 18
Table 3 Short Description of Different Types of Monitoring Wells 23
Table 4 Example for the Documentation of the Measurement of
Groundwater Levels 36
Table 5 Example of a Documentation of measurement point for the
Flow Rate of Surface Water 36
Table 6 Example for the documentation of the Water Sampling 37
Table 7 Overview of Hydraulic Conditions 42
Table 8 Conductivity for Different Types of Water 45
Table 9 Overview about the documentation of Hydrogeological Studies 49
Table 10 Examples for Suitable Software for Numerical Models 54
Recommendations on water monitoring in open-pit coal-mine areas in Mongolia (RWM)
10
Summary
Coal mining is a growing part of the Mongolian mining industry and supplies Mongolias most
prevalent energy source Therefore thorough longterm planning of mining projects is crucial
because of their impacts on the economic social and natural environment Additionally existing
coal mining practices are in need of practical recommendations for minimizing negative impacts
on the environment and for optimizing operating expenditures to fulfill legal commitments
The majority of coal-mining activities impact the water balances andor the quality of local
waters Dewatering the deposit is a requirement for mining in many cases which in the case of
open-pit coal mines draws down the groundwater level within a large area Furthermore
hydrochemical reactions and the use of water for operational processes can change chemical
characteristics of water The limitation of water resources in Mongolia requires that this
resource be protected As the effects of mining on water resources is unavoidable the
government of Mongolia is aware of these impacts and regulates the mining activities on
different levels Their aim is to minimize the negative environmental impacts of mining which
includes obligating mining companies to conduct sustainable water management
Monitoring and understanding the local water system provides a basis for a more sustainable
and efficient water management Mining companies are therefore required by law to integrate
water monitoring into their operations Numerous legal regulations partially based on
international standards exist However because detailed comprehensive specifications for the
interpretation documentation and reporting of monitoring results are not available at present
it is difficult for water authorities to audit and evaluate monitoring reports Furthermore mining
companies are unlikely to profit directly from improving their dewatering methods There are
however numerous benefits that can be realized through improvements and optimizations in
dewatering management which can be achieved through the evaluation of monitoring results
This document gives recommendations concerning the planning and technical realization of
water monitoring systems for open-pit coal mines while providing particular focus on the
interpretation documentation and reporting of monitoring results These recommendations are
based on the site visits to Mongolian open-pits mines as well as experiences from water
monitoring in lignite mining in Germany which have been adapted by considering the current
conditions in Mongolia
These recommendations are intended for managers at the operational level but they may also
be useful for environmental officials competent authorities non-government organizations
students and people with a general interest in the best practices associated with monitoring the
quality and quantity of ground and surface waters in and around open-pit coal mines The goal
of this work is to improve the mining industryrsquos environmental performance
Recommendations on water monitoring in open-pit coal-mine areas in Mongolia (RWM)
11
1 Forward
Water is one of the environmental resources that in addition to air and soil are impacted by
mining activities Mining activities can affect water quantity andor quality and can pose a risk
to water resources In many cases mining operations change the hydrological hydrogeological
and topographical characteristics of the mining areas Changes in surface runoff soil moisture
groundwater dynamic water quality and evapotranspiration can also persist long into the post-
mining phase
Sound management practices are a fundamental component of mining operations for mitigating
the impact on water balances and water quality for both surface and groundwater resources in a
responsible manner These practices are to be carried out throughout the life cycle of a mine as
well as post-closure on both a local and regional scale Water monitoring is a legal requirement
(see Fig 1) and is a part of negotiations with authorities for a mining permit
An accurate and reliable database is an essential component of many environmental
management plans The objectives of water monitoring programs include
Documentation of the base line situation for the mining project
Monitoring the water usage within the site This also provides companies with
opportunities for internal cost controlling and optimization regarding water reuse
Identification of sources and extent of pollution Actions to mitigate these risks may include
implementing a water treatment technology or further process control
Assessment of the impact of water reuse and management as well as the impact of the
mining activities on the regional water balance
Calibration and verification of numerical groundwater models against measured data for
improved prediction and assessment of future states
Improved planning for decommissioning and closure procedures regarding required actions
and financial provisions based on the numerical groundwater models
Establishment of environmental and water management plans based on impact and incident
monitoring for the mine and the surrounding region These plans facilitate decision making
and serve as an early warning system for indicating necessary preventive and remedial
measures in certain areas
Auditing of compliance with set standards and legislation and evaluation of the success of
implemented management actions
In this document water monitoring is defined as the recording documentation and
interpretation of water quantity and quality of surface and groundwater by mining companies
These recommendations do not go deep into the theoretical background of hydrology and
hydrogeology rather they are focused on the design implementation and operating procedures
of monitoring as well as the documentation and interpretation of data and conclusions for the
water management Particular emphasis is put on data interpretation
Recommendations on water monitoring in open-pit coal-mine areas in Mongolia (RWM)
12
2 Introduction
Mining and Water
The following recommendations are in regard to groundwater necessary groundwater drainage
in open pit coal mining and groundwater contact with surface waters
Classically the water table is lowered using preliminary drainage reducing the volume of the
groundwater body Changes in the groundwater composition such as an increase in the salt or
fluorine concentrations may result Dewatering of the pit itself follows which captures the
diffuse groundwater and precipitating water influx The pumped water is partially used as clean
process water such as in dust collection or as water for plants in re-cultivation areas and is
directed either into an artificial lake or into receiving waters In a few cases the receiving waters
need to be relocated in order to secure the open-pit
In the rear end of the open-pit mine as well as in post mining conditions another increase of the
groundwater table follows The interim introduction of air to the underground area causes
geochemical processes to be activated which result in mostly negative consequences for
groundwater quality
Goals and Outputs of Water Monitoring in Mining Areas
The objectives of the monitoring are
Monitoring the safety of the mining operations with regard to water
A priority of the mining operations is also to secure the safety of the mining employees An
influx of water can endanger the geotechnical stability of the pit Data for the groundwater
level and incoming water flow is the most important prerequisite for the implementation of
water drainage measures and their monitoring The behaviour of the ground and surface
water can be derived from the water monitoring Through the appropriate water drainage
measures the safety of the mine should be ensured
Provide necessary basics for the planning monitoring control and optimization of water
drainage measures
The mining of resources (coal) in open pits is only possible if the water table is lowered
From the results of the water monitoring conclusions can be drawn about how the
dewatering process can be carried out In most cases the inflowing water stream varies
with time for example with seasonal changes in such a way that the water drainage is
controlled For this control the results from monitoring are required Drainage is very cost-
intensive however with the analysis of the water monitoring data the drainage process can
be optimized so that the accompanying costs can be greatly reduced
The impacts of mining operations on the evironment are to be minimized as much as possible
That means that avoiding and minimizing consumption are the highest priorities The
contamination of water is to be prevented or minimized by implementing necessary
management measures or strategies One strategy is to reclaim and reuse contaminated water in
cases where total pollution prevention is not possible Treating water that cannot be reused is
Recommendations on water monitoring in open-pit coal-mine areas in Mongolia (RWM)
13
another example of a strategy for contamination prevention The discharge or disposal of water
is the lowest priority The implementation of these measures may accompany the monitoring
phase or may be carried out after reliable results are obtained
Fundamentally the following requirements should be fulfilled
A basis for sharing transparent information to the public exists including warnings for
health risks caused by water quality
Mining companies should be held responsible for the realization of water protection
directives
Authorities need to have confidence that the mining companies will work responsibly
The public and NGOs should have confidence in the work of authorities overseeing the
mining companies
Compliance with set standards and legislation such as Integrated Water Use licenses and
Environmental Management Plans etc is audited
The impacts of the mining operations and activities on the receiving water balance are
assessed
Various hydrogeological models for prediction and assessment are to be verified and
calibrated This includes planning the financial provisions and required actions
fordecommissioning and closure
The following details regarding water quantity are to be recorded for the understanding
determination and documentation of the hydraulic system groundwater levels flow direction
trends climate water balance water users infiltration into groundwater input into surface
water groundwater catchment and the interaction between ground and surface water Within
the framework of water balances the climatic water balance the quantity inflowing and
outflowing waters and an estimation of the influence of dewatering are to be taken into
consideration for the extraction of the impact of mining activity After the mining efforts are
complete a steady self-regulated water balance should be established and managed for the
purpose of minimizing water deficits that could arise through the evaporation of surface water
Within the topic of water quality the following key points are to be addressed
Qunatitative description of the original water quality before the influence of mining
activities
Quantitative estimation of the impact of mining on the quality of waters (ie the change in
water quality)
Understanding of the limits and standards for water discharge quantities and
concentrations as well as the establishment of accurate records for actual discharge values
in comparison to these limits
Determination of any existing local contaminations which were not caused by the current
mining activities
Estimation of hydrochemical processes both natural and those caused by mining and
Recommendations on water monitoring in open-pit coal-mine areas in Mongolia (RWM)
14
Quantitative estimation of the future changes and developments to the water quality
Legal Framework and Standards
In addition to applying for a water license the mine developers should include a proposal for the
monitoring program describing the scope of measurement points chemical analyses reporting
time intervals etc This proposal might be subject for approval and modification by the licensing
authority The final water license states the requirements for monitoring to be carried out
A summary of the Law of Mongolia on Water is given in Annex IV The major laws and
regulations governing the minerals mining and the accompanying environmental obligations
are depicted in Figure 1
Figure 1 Major Laws Related to Minerals and Mining in Mongolia Concerning the
Environment
(LMBV mbH)
Regulatory requirements for water monitoring are determined by the following two tasks in
most cases
monitoring the qualitative and quantitative influence of the measures (eg dewatering) on
the environment surrounding the mining operation and
monitoring the effectiveness of the dewatering process to guarantee the safety of the
operation
Requirements and secondary provisions are therefore individually determined by the type of
mining as well as the natural conditions of the catchment and other (potential) users
Recommendations on water monitoring in open-pit coal-mine areas in Mongolia (RWM)
15
Regulations and standards concerning water monitoring and water management are listed in
Annex V
Processes and Outputs of Water Monitoring
Water monitoring is to be conducted throughout the entire mining cycle which comprises the
following phases
Feasibility Study and Planning Phase including exploration (I)
Operational Phase (II)
Closure Phase Post-Mining Phase (III)
Post-Operation Phase (after rehabilitation hydraulic steady state) (IV)
The engineering and consulting services which are to be developed for water monitoring and
integrated water management during the mine cycle are listed below
Feasibility and Planning Phase (Before Mining)
An exact description of the initial unmodified state of the hydrological and hydrogeological
conditions is an integral component of monitoring This description should include
groundwater dynamic characteristics groundwater flow direction flow gradient seasonal
changes of groundwater levels
a full quanititative analysis of groundwater quality
surface water characteristics water levels flow rates seasonal variations and
a full quanititative analysis of surface water quality
Because it is impossible to reproduce the data describing the original state after mining has
commenced special attention needs to be devoted to gathering this invaluable information
beforehand The pre-mining monitoring phase should be cover 3 ndash 5 years to capture data over
varying weather and climate conditions The goal is to establish a local (unmodified) water
balance
Water management practices in this phase consist of
evaluation of different process designs in order to optimize the overall water balance in the
affected area including reuse and recovery strategies
identification of potential water sources
determination of water quantity and quality requirements based on the different process
designs
investigation of opportunities for water reuse and recovery
development of a strategic plan and measurable performance targets and
the combination of all points above into an integrated water management plan
Recommendations on water monitoring in open-pit coal-mine areas in Mongolia (RWM)
16
Here ldquoprocess designrdquo refers to the mining companiesrsquo individual proposed plans for
monitoring drainage water use and mining activities
Operational Phase
During the operational phase the impact of dewatering on the groundwater dynamic is to be
monitored This entails monitoring the scope of groundwater extraction the dimensions of the
catchment area and the drop in the water level (potential level) in the mine and the surrounding
areas and for example at drinking water wells nearby The flow rates and water levels of
surface waters may also be affected by dewatering procedures One possible outcome is that a
higher surface water flowrate into the aquifer causes the surface water levels or flow rates to
decrease Continuous measurement of all water input and output rates is therefore obligatory
The water balances are to be calculated for the operational phase taking different scenarios
with varying extraction rates into account
Changes of the water quality (eg acid mine drainage) may be caused by aeration of the
overburden due to the extraction of waters the infiltration of extracted waters into ground- or
surface waters Continuous sampling and analysis are important in detecting possible changes in
the water quality
Closure Phase and Post-Mining
The post-mining phase can be divided into two sub-phases the transient phase and the quasi-
steady-state phase The groundwater level (potential level) will rise after dewatering processes
are terminated While a stable water level has not yet been established in this transient phase
continuous measurements of ground- and surface water levels are necessary for monitoring
changes and planning required measures accordingly In the quasi-steady-state phase a stable
water table has again been established and depends therefore only on climate conditions
which affect the groundwater recharge rate The frequency and extent of water quantity
measurements may be successively reduced throughout the transient phase if the data shows
little to no fluctuation over time
In many cases changes in water quality after mining as well as after dewatering can be
observed This can often be attributed to chemical reactions between aerated tailings material
and water which might cause acid mine drainage in cases where sulfur-rich material is involved
Dissolution of minerals ie salt may also have an effect Special attention needs to be paid to
identifying potential reactions such as these in order to prevent or mitigate negative long-term
effects
Preliminary Characterization of the System
A first estimation of the geological hydrological and hydrogeological state provides a necessary
foundation for the conception of a water monitoring plan This first estimation relies on
generally available data mostly on the internet and existing studies or expert opinions over the
area being studied
Basic information about geology hydrology and hydrogeology exist for nearly each region of the
world While the spatial solution may be very large it is possible to obtain an overview of
important background knowledge such as sedimentary or hard rock aquifers existing surface
Recommendations on water monitoring in open-pit coal-mine areas in Mongolia (RWM)
17
waters and climate conditions without any exploration results in most cases The study of this
background information is important for the planning of further geological hydrological or
hydrogeological investigations The websites found in Annex III Table III-1 contain such
background information
In other cases results of former investigationsmdashsuch as for draining water wells former mines
or the exploration of other resources may exist The first step is searching for this information If
a mine already exists any available results reports or data should be analysed and interpreted
One foundation for a model of the hydraulic system is the characterization of the aquifer system
by zone A table like the one in Table 1 can be used to collect and organize relevant information
The following data can help to determine in which areaszones groundwater bodies are
significant their extent (of groundwater bodies) saturated thickness estimation of hydraulic
conductivity and porosity The type of confinement describes how well the upper aquifer is
protected from pollution sources at the surface
Table 1 Characteristics of the Aquifer System per Zone
A preliminary estimation of the original state of groundwater body can be described with
support of the following information for each defined zone
extent of the catchment basin
area specific precipitation annual average estimation of the climate water balance and
information of the groundwater recharge ([lskmsup2] [Mio msup3a])
total stored volume ([msup3msup2] [Mio msup3])
total abstraction rate of other users in the basin eg drinking water supply ([msup3d] [Mio
msup3a])
estimation of flow rates between ground- and surface water in-exfiltration ([msup3md]
[msup3d] [msup3a])
Groundwater quality results of chemical analyses
The impact of dewatering mines into the water cycle can provoke situations of conflict among
groundwater users An initial consideration of potential conflicts (in the frame of groundwater
quality and quantity) can be an important basis for planning monitoring programs and water
Zone
Aquifer System Characteristics ndash Preliminary Estimates
Type Confined
(upper layer)
Lateral
Extent
Total
Thickness
Hydraulic
Parameters
Water
Table
Source of
Information
1 Single
multi
layer
unconfined
semiconfined
confined
[km] amp
[] of
total
[m] kf ne no S So [meters
above
sea
level]
[meters
below
surface]
study report
map etc
2
hellip
N
Recommendations on water monitoring in open-pit coal-mine areas in Mongolia (RWM)
18
management systems for the mine The general reference monitoring network (river basin)
should reliability depict the groundwater situation on a regional scale This function covers the
natural state as well as the regional impacts of groundwater use and surface water
management The following table 2 lists information to describe potential conflict situations
Table 2 Characteristics and Hydraulic Boundary Conditions of the Aquifer System per Zone
In every case Quantity and Quality importance (nolittlemediumhigh) numbers (numbers
or nonfewsomemany) strengths (noneweakmediumstrong)
Conflict (historical actual and prospective) Zone 1 hellip Zone N
Surface water measures (rates of infiltration extraction
changes of the run hellip) influencing surface water outside of
the mine area
Quantity
nonelittlemediuma lot
Quality
nonelowmediumhigh
Surface water measures (rates of infiltration extraction
changes of the run hellip) influencing groundwater
same as above
Dewatering (groundwater abstraction rate) influencing
surface water
same as above
Dewatering (groundwater abstraction rate) influencing
groundwater bodies (outside mining area) eg water
supply wells irrigation wells springs groundwater
dependent eco-systems
nonefewsomemany
Mine rehabilitation measurements (irrigation dump-
rehabilitation) influencing ground- amp surface waters
Beside the data research the evaluation of the results the robust archiving of all data
documents and the development of a GIS-supported database are recommended see the
following box
Development of a GIS-supported Database
A suitable tool to develop show edit and analysis of spatial information is the software QGIS
(QGIS 38 Zanzibar) httpswwwqgisorgdesite (or httpswwwqgisorg) itrsquos for free a
WINDOWS MAX LINUX BSD and next time ANDROID
Implement all information about geology (eg spatial distribution of aquifers and aquicludes
fracture structures boreholes) hydrology (eg spatial distribution of groundwater recharge flows
surface water bodies) and the mine (eg current state and planned development of the mine
dewatering wells and monitoring wells)
For some information given information see Annex III table III-1
Continue filling the database permanently (eg with results of drillings results of the water
monitoring)
A further important tool is SAGA-GIS (freeware) httpsaga-gissourceforgeneten It can be
used eg for gridding (triangulation nearest neighbor inverse distance) access to different files
grid calculator (combine grids through user defined functions calculation of surface ndash
groundwater ndash distance) terrain analysis (eg flow path analyses) or vector tools like polygon
intersection contour lines from grid (mapping potential lines of groundwater table) simulation of
dynamic processes (erosion landscape development) statistical tools
Recommendations on water monitoring in open-pit coal-mine areas in Mongolia (RWM)
19
3 Definition of Monitoring Objects
The diversity of climates ecosystems land uses different water users and topography
influences the design of a monitoring program Thus the resulting monitoring program should
be tailored to meet a specific set of needs and expectations of the site and will need to consider
regional physical and social factors
Each of the management actions has unique objectives and monitoring requirements These
objectives should be clearly defined measurable and implementable The development of
environmental and water management plans identification of sources of pollution and
assessment of compliance with set standards are examples of typical management actions that
require the results of a monitoring program
Examples of items to be monitored are groundwater soil water surface waters or other
parameters of the water cycle like precipitation evapotranspiration and groundwater recharge
The development of environmental and water management plans may be executed as described
in the following box (some of them are taken from Fehler Verweisquelle konnte nicht
gefunden werden) Details are described below
Steps for the development of environmental and water management plans
Identification of climatic conditions
Identification and quantification of all flow rates within the mine
Developement of a mine water catchment model (balances)
Develop and implement appropriate water reclamation strategies
Evaluation of the quality and quantity of groundwater from existend monitoring wells and
borholes of potential pollution sources
Definition of key ndashindicators for potential pollutions and integrate it into the monitoring program
Definition of requirements on water quality and design methods for the water treatment
The climatic conditions (incl measured parameters) can be determined by interpretation of data
from existing meteorological observation stations or by installing weather stations (with ie rain
gauge thermometer anemometer evaporimeter) If the weather station density in the area of
interest is too low the installation of additional measuring stations might be necessary as
variables such as rainfall evaporation temperature humidity or wind may vary significantly
across short distances
The evaluation of groundwater quality and quantity is based on the results of measurements and
analysed samples from existing boreholes in the vicinity of potential pollution sources The
definition of key pollution indicators (eg sulphate conductivity for residue deposits nitrogen
and phosphorus for sewage plants fine coal particle from coal washing) is a part for the
development of a monitoring program Based on these results pollution sources of the mine can
Recommendations on water monitoring in open-pit coal-mine areas in Mongolia (RWM)
20
be identified (eg residue deposits domestic waste landfill point discharges sewage treatment
plants processing plants mine shaft area)
The identification and quantification of all (relevant) water flow rates within the mine is an
essential part of water monitoring This includes the extraction (pumping) rates discharge rates
and infiltration rates Knowledge of water sources and sinks (eg drinking water wells)
including rates outside the mine are a basis for understanding the hydraulic system
The identification of current and future water uses and determination of their water quality and
quantity requirements are parts of planning strategies Critical water qualityquantity
parameters for all considered water treatment options (in terms of absolute values and
variability) are to be defined Upon evaluation of monitored water quality and quantity
parameters the need for water treatment may be indicated
Recommendations on water monitoring in open-pit coal-mine areas in Mongolia (RWM)
21
4 Groundwater
Use of Existing Groundwater SamplingMeasurement Points
Existing groundwater measurement points should be integrated into the monitoring program
but first they need to be tested for their functionality For the initial evaluation of an existing
measuring point the following steps are to be followed as described in [24]
Research and Compilation of the Existing Base Data (coordinates elevation and construction
details) The following data are to be sourced andor measured bore log construction drawing
depth location of the filter section diameter drilling method and drilling year and results of
measurements and sampling
Preselection of Monitoring Wells
Does the observation well represent the point of interest
Is the diameter of the well tube gt 2rdquo If the tube is too small sampling and water level
measurements are not possible
Is a clear appropriation to the aquifer given
Is there free access to the observation well and a right of access given
To use an observation well the following questions should be answered positively
Inspection of existing monitoring wells
Evaluation of the outer condition and inner condition through the sounding of the bottom and the
water level are they in a suitable condition If both measurments arenrsquot possible the measuring
point is probably plugged meaning that the ability and means of unplugging should be tested
Is the well made of a suitable material (For water sampling wells PE-HD or PVC-U are
recommended because some other materials can influence the water quality or the tubes can be
influenced by compounds found in the water)
Is there consistency between researched data and investigation results
Is it possible to insert a dummy of the sampling pump or data diver
Infiltration Test for Monitoring wells The measuring point should be filled with water and time-
dependent water level measurements should be taken If the level of the filled water stays
constant for several hours there is no longer sufficient contact with the aquifer The measuring
point is possibly silted up or the filter crusted over The measuring point cannot be used for
monitoring
Short Pump Test at the measuring points for water contamination The groundwater should be
pumped out of the measuring point and the characteristic data (water level electrical
conductivity pH value temperature oxygen concentration etc) recorded
Recommendations on water monitoring in open-pit coal-mine areas in Mongolia (RWM)
22
Other criteria for the usability of the monitoring points are location and accessibility standard-
conforming installation as well as general physical condition installation and age of the
measuring point
For a comprehensive functionality test the processes listed in Annex II table II-2 is suggested
Planning of Positions for (New) Groundwater Observation Wells
The monitoring boreholes cannot be randomly located but should be placed at the most suitable
location to accurately collect the required data The groundwater flow directions vertical limits
of different aquifers depth of the groundwater table pollution source locations pollution
plumes etc all need to be considered If the measuring points are positioned at the wrong or
poorly established (eg too shallow) location the resulting data may lead to incorrect
interpretation and therefore to wrong decisions
The exact location of the monitoring points should be clearly marked on a map in such a way
that it can be found by an external party This may be achieved by GPS referencing or by using
GIS-software to produce a reliable map with suitable background information such as
topography infrastructure rivers or buildings
For determining locations of monitoring wells the following points need to be considered
Monitoring wells for all existing hydro-geologically relevant layers are needed In the case of a
multi-layer system a group of monitoring wells with different depths of the screens is usually
necessary
Therefore measurement points upstream and downstream of the mine are essential (outside of
groundwater lowering) Wells should also be placed at specific monitoring objects (eg
groundwater dependent eco-system infiltration points etc)
Access to all monitoring wells should always be possible
Wells should be arranged in a triangular manner as shown in Figure 2 to enable determination of
flow direction and construction of hydrogeological maps
Groundwater flow monitoring is very site specific because it is dependent on the local
geohydrology which may vary significantly from one area to another
Recommendations on water monitoring in open-pit coal-mine areas in Mongolia (RWM)
23
Figure 2 Hydrological Triangle and the Construction of Water Level Lines
Construction of New Groundwater Monitoring Wells
Types of Groundwater Monitoring Wells
Some different types of groundwater monitoring wells are shown in Figure 3 (taken from [16])
The type of groundwater monitoring well is given by the aquifer system and the task of the well
The following table 3 shows the different conditions and wells
Table 3 Short Description of Different Types of Monitoring Wells
Type Application Limits
Full-screen
monitoring wells
Single ndash layer ndash aquifer system screened
the whole aquifer thickness samples are
a mixture
Different layers will connect hydraulically
problem in case of different potential
levels or different quality types (incl
contamination) depth-dependet sampling
is possible with packer-systems only
Multi-screen
monitoring wells
depth-dependet sampling is more
possible than in case of a full screened
well packer systems are needed
Hydraulic contact of different layers is
possible in the well different level
measurements arenrsquot possible
Partial-screen
monitoring wells
Different measurements and samples of
one specific layer is possible (also in a
multi-layer-system)
Gives information about only one of the
layers
Group of partial-
screen monitoring
wells (different
boreholes)
multi-layer-system different
measurements (of different water or
pressure levels) and samples of the
specific layers are possible
relatively high costs (nearly same costs as
the bunch of Monitoring wells but much
more valuable than a bunch)
Bunch of partial-
screen monitoring
wells (single
borehole)
multi-layer-system different
measurements (of different water or
pressure levels) and samples of the
specific layers are possible
Relatively high costs an accurate
construction is very important to prevent
hydraulic transfers between the different
layers a large diameter borehole is
needed
Subterranean head
monitoring well
Location can be roads parking etc Possible destruction by transport
Recommendations on water monitoring in open-pit coal-mine areas in Mongolia (RWM)
24
Figure 3 Different Types of Monitoring Wells
Sources httpspublikationensachsendebdbartikel23156documents31473
Construction Details for Monitoring Wells
Groundwater measuring wells for the measurement of the potential level should be constructed
according to the specifications in Annex II Table II-1 (taken from LMBV mbH Merkblatt
Montanhydrologisches Monitoring 2019)
Recommendations on water monitoring in open-pit coal-mine areas in Mongolia (RWM)
25
Recommendation for a Multi-Layer System
Groundwater levels and water quality should be measured for each aquifer seperately in the case
of a multi-layer system
The different aquifers must not be connected eg at the construction of monitoring wells
Aquitards (aquicludes) should be sealed in boreholes by hydraulic barriers like clay seals
Contaminations of the water can be dispersed throughout different aquifers in the case of
connected layers The conditions of flow and pressure can be changed by connecting aquifers
Unregulated water outputs and chemical reactions between water and the rock matrix can be a
consequence of connected aquifers
The construction of measuring point bundles makes an effective hydraulic seal difficult In the case
of different aquifers the construction of a group of monitoring wells is recommended
Monitoring Program
Measuring borehole depths and the water levels in them should be a standard part of a
groundwater monitoring program Groundwater levels can be measured using electrical contact
tape float mechanism or pressure transducer The following factors must be considered in
groundwater flow topography streams stream flow fountains dams geology and excavations
The usual measurement frequency of the groundwater level and pressure is once per quarter
which allows seasonal changes to be detected However the frequency of required observation
can be different among sites or monitoring wells (eg depending on the dewatering wells) The
frequency of measurements depends on the type and position of the aquifer the groundwater
dynamic aquifer development and climate conditions
Frequency of measurement should be
Denser for shallow unconfined aquifers because the seasonal change of water level is higher than
for deeper and confined aquifers
Denser for rapid groundwater flow (high hydraulic gradient) than for slow groundwater flow
Denser for more intensive groundwater drawdown (eg short distance to the dewatering system)
than for less withdrawal and small drawdown (higher distance to dewatering wells)
Denser for more variable climatic conditions (incl high groundwater recharge) than for less
variable conditions (eg small seasonal changes)
The frequency should be adapted with respect to these conditions and interpretation of the
monitoring results
Measuring groundwater level is a technical procedure that should be undertaken by a suitably
qualified person The forms found in Annex I Table I-2 should be used for the documentation of
the measurements The sampling interval should be once per year (MarchApril) at a minimum
If two samplings per year are possible the months MarchApril (1st) and SeptemberOctober
(2nd) are recommended
Recommendations on water monitoring in open-pit coal-mine areas in Mongolia (RWM)
26
Groundwater Sampling
The MNS (ISO) 5667-X consisting of several parts is a guideline for taking water samples The
following text doesnrsquot replace this guideline but it should give some additional practical tips
Preparation of Sampling
The technical functionality should be checked according to the device-specific requirements The
calibration of all measuring tools is necessary before every monitoring campaign and during the
campaigns in the case of different water qualities This is very important because the
differences between the true value and the measured values are often surprisingly high
when non-calibrated gauges are used The calibration and handling are to be carried out
according to the manufacturer specifications before each use Calibration buffers are to be
checked regularly and if necessary are to be replaced as they have a limited shelf life The
calibration value also is to be corrected according to the temperature dependency of the buffer
solution used
Check-list for the suitability of the equipment
Is the pump-system complete This includes a motor-pump with control unit an electric power-
source (eg diesel generator) and stand pipes (tubes andor flexible tubes)
Are all measuring tools calibrated
Is the pump power (pumping head) sufficient
Are the hoses and the light cable long enough
Do the devices meet the quality requirements (purity cleanliness) of the sampling (also applies for
individual sampling)
Do the necessary filtration units comply with the Equipment Standard requirements
Are hoses and connectors reagents andor tools suitable for the task in proper working
condition
Are the flagons prepared Are necessary reagents for sample stabilization andor necessary
cooling elements available in sufficient numbers see Annex II Table II-6
Are the bottles individually labelled with sample number the monitoring well name or number
sampling date and sampling campaign name or number Important additional information should
be recorded the name of the sampler and the name the laboratory as well as the parameters to
analyse and type of chemical stabilization
Are the necessary cameras GPS master data sheets sampling protocols and cleaning equipment
on site and ready for service
Recommendations on water monitoring in open-pit coal-mine areas in Mongolia (RWM)
27
Sampling
The following steps are carried out during a groundwater sampling
(1) Well monitoring
Samples for water analyses can also be taken from the same groundwater measuring points
used for quantity monitoring Important is that the pipe can be navigated with a motor
pump Classic sampling motor pumps can be installed in measuring points with two-inch
inner diameters (ID) In case of very deep monitoring wells the pipes can become
misaligned in such a way that the pump can get stuck and break off Before installing a
pump at least one test with a light cable or a dummy should be completed
(2) Local Findings Observations at the Sampling Point and the Surrounding Vicinity
Check of the information on the master data sheet for completeness
Check the condition and serviceability of the sampling point for visible damage safety
(closeability) cleanliness corrosion of metal parts and other changes
Check for and document any deposits and incrustations eg precipitations biota (algae
mold animals) sediment etc
Check and document any mixed waters mixture of water of different origin inflow of
foreign water overflows
In principle gross deficiencies in drinking water supply systems (also in the case of
drinking water purposes used house wells) should be communicated to the operator
Document changes since the last sampling eg agricultural activities earthwork or
construction sedimentation conspicuous surface use visible contamination sources
Record any other abnormalities eg weathering during sampling air temperature
precipitation degree of cloudiness or sun exposure nuisance dust
(3) Measurement of Groundwater Level before Pumping
The groundwater level describes a part of the actual hydraulic situation The results of the
sample analyses should be interpreted with respect to the hydraulic situation (eg high or
low groundwater level) The measurement should continue during the whole pumping
duration
(4) Installation of the Pump
The pump should be installed more than one meter above the screen of the monitoring well
(5) Pumping and Purging
For pumping it is important to maintain a continuous moderate pumping rate
Discontinuous pumping can provoke turbulence in the water column of the monitoring well
and if the pumping rate is too high solid substances outside from screen can enter into the
monitoring well The pumping rate can also be optimized by adapting to the yield of the
well A continuous water level should also be maintained since the water level must not
Recommendations on water monitoring in open-pit coal-mine areas in Mongolia (RWM)
28
decrease below the pump and should be at least 1 m above the screen The inflow of oxygen
is to be avoided
Purging is the process of removing stagnant water from a well immediately prior to
sampling causing its replacement by groundwater which is representative of actual aquifer
conditions from adjacent formations To determine when a well has been adequately
purged field investigators should monitor (at a minimum) the temperature the pH specific
conductance and the turbidity of the groundwater removed during purging In the case of
permanent monitoring wells they should observe and record the volume of water removed
The Purge Volume Determination (VP) is carried out by calculating the hydraulic criteria
and by measuring the chemical criteria see Annex II Table II-4
The water should then be released a long distance away of the monitoring well (minimum
five meters) after pumping
(6) On-site Parameter Measuring
Organoleptic (sensory) data include the qualitative recording of color turbidity smell and
sediment The tests should be carried out in a transparent vessel with a volume of at least
one liter against a white and black background Abnormalities of the groundwater can
already be detected through the optical or odoriferous findings This data can therefore
also be used to assess the measuring point or quality of sampling Dregs from another
monitoring well in a pore aquifer can indicate damage to the measuring point
The parameters water temperature electric conductivity (in μScm) dissolved oxygen
reduction-oxidation potential and pH-value are measured by gauges The use of multi cells
is recommended Otherwise the use of vessels is possible The sensors should not be used
in the same vessel The volume of the vessels should be greater than one liter The measured
value must first be read and logged if the display remains stable
(7) Sampling
It is particularly important that wells be sampled as soon as possible after purging If
adequate volume is available upon completion of purging the well is to be sampled
immediately If not sampling should occur as soon as adequate water volume has
recovered
(i) Charging the Sample Flagons see also Annex II Table II-6
When sampling with a medium or large mobile pump a bypass with adjustable flow off of
the sampling line can be used to fill the sample vessels The bypass should be installed in
front of the on-line measuring instrument and the line should be purged briefly to remove
fluid standing in the line before the sample is taken
When filling the sample bottles are to be completely and appropriately labeled All sample
containers not pre-filled with stabilizing reagent are to be rinsed out at least twice before
filling This is done by filling the container approximately 25 with sample water placing
on the lid shaking vigorously and emptying Before closing the sample containers the
closures are also to be rinsed thoroughly Filling of the water samples must be completed
Recommendations on water monitoring in open-pit coal-mine areas in Mongolia (RWM)
29
without bubbles and avoiding turbulence To achieve this the filling tube should be kept
submersed in the sample Fill the bottles completely and let them overflow several times
before closing the bottle The groundwater sample thus enters the sample vessel without
contact with the atmosphere
For vessels containing stabilizers the hose must not come into contact with the contents of
the bottle and with the stabilizer The filling process is to be interrupted at about two-thirds
of the bottle volume in order to distribute the stabilizing agent homogeneously throughout
the sample by gently swirling the closed vessel Then the bottle can be completely filled
(ii) Filtration of Samples
For most parameters analyses are taken using unfiltrated samples However some
parameters like DOC or metal concentration first require filtration of the water sample If
the samples are to be filtered disposable filters with a pore size of 045 μm and disposable
syringes are used The filters should be rinsed with at least 20 ml of sample water A
membrane filtration device can also be used on site Filtration is to completed before
conservationcooling in every case
(8) Conservation and Storage of the Samples
Information as to the conservation and storage of samples is given in Table 9 Without
stabilization the concentration of some dissolved elements can change during storage or
transportation (eg precipitation of Fe-II as FE-III) causing errors in the laboratory
analyses of the solutes
(9) Transport and Storage of Samples
The temperature during transport and storage should be kept between 2degC and 5degC A cooling
box with cool pads can be used while freezing of samples is to be avoided
InfoBox Water Sampling
Failures in and carelessness during sampling conservation storage and transport of a water
sample can change the quality of a sample and change the analysed results An (expensive) water
analysis becomes useless because of this
The parameters temperature electrical conductivity pH value dissolved oxygen content and
redox potential as well as organoleptic parameters must be measured or recorded and
documented on site Results of these measurements in the laboratory do not represent the
original water quality
Proof of compliance with hydraulic and quality criteria should be part of the sampling
documentation
The original documentation of the analysis results should be stored securely and long-lasting
For additional information see
httpswwwepagovsitesproductionfiles2015-06documentsGroundwater-Samplingpdf
Recommendations on water monitoring in open-pit coal-mine areas in Mongolia (RWM)
30
5 Surface Water
Objects of Surface Water Monitoring
Surface water monitoring includes measurements of volumic flow rates and water levels in the
mine and the surrounding area This is necessary to determine the interaction between surface
and groundwater
Surface water monitoring includes the important water flow rates in the mine and the
distribution of pumped water (eg dusk fixation irrigation re-infiltration or output)
In the area directly surrounding the mine the following measurements are part of the surface
water monitoring
Delivery rate of a spring comparing the delivery rate and dewatering of the mine can
give information about the impact of mine dewatering to the groundwater and local
water balances
Water levels of artificial and natural lakes hydrographs of the lake water level give
information about its seasonal changes and the impact of mine dewatering
Input and output rates intofrom lakes important for the complete estimation of local
water balances and the local water cycle
Precipitation and evaporation to and from lakes important for the complete estimation
of local water balances and the local water cycle
Rates of surface fluids at different points (eg in front of and behind the mine) possible
impacts (higher ex-filtration rates from fluids into the underground near a dewatered
mine gives information about hydraulic interactions
Input and output rates intofrom fluids lakes important for the complete estimation of
local water balances and the local water cycle
Monitoring Program
Flow rates of fluids change rapidly with the climate conditions (precipitation snow smelting)
That is why times for measurement canrsquot be predicted exactly The frequency should be fixed
individually and iterative with the results Measurements under different conditions such as
during dry phase or after precipitation can give the range of possible rates
For a lake water sampling is recommended at the different phases of the circulation of the water
body This means four times per year spring circulation begin and end of the summer-
stagnation and during autumn circulation
Recommendations on water monitoring in open-pit coal-mine areas in Mongolia (RWM)
31
Water Level Measurement
The level of surface water bodies is monitored by staff gauges (water level gauges) recording
gauges shaft encoders water level sensing systems or pressure probes with data loggers and
possibly remote data transmission In order to avoid the influence of waves and wind all
registering water level gauges are to be installed in a dip tube It is important to regularly check
whether there is hydraulic contact between the inside and outside of the tube
Figure 4 Examples of Water Level Gauges for Surface Water
Basis data for each water level gauge include the coordinates (x y) and the level of the reference
point (z m asl) see Chapter 6
Flow Rate Measurement
Two groups of flows are to be differentiated the gravity flow in partially filled pipes channels
and streams and the pressurized flow in discharge pipes A second differentiation is possible
between direct and non-direct measurements Flow rate measurements are just one part of
water monitoring in mining areas Therefore only a small part of the wide range of methods is
presented in these recommendations
Gravity Flow
Area-Velocity Technique Non-Direct Flow Rate Measurement
Float Method
The most common technique consists of calculating or estimating respectively the cross-
sectional area and measuring the flow velocity The latter can be determined by different
methods such as the float method By observing a floating object on the surface of a water body
Recommendations on water monitoring in open-pit coal-mine areas in Mongolia (RWM)
32
the flow velocity at the surface can be measured The equation v asymp 085 middot v13 yields an
estimate for the average flow velocity [(Gunston 1998)] The measurement of the velocity is
more sophisticated for defined areas
Flow Meter Method
Quantification of the flow rate requires (a) the determination of the flow-profile and (b)
measurement of the flow velocity using an inductive flow meter over the entire flow cross-
section Based on the flow velocities (vi) in the individual profile segments the flow rate is then
calculated by
Q = A∙ v
The measurement profile is recorded using measuring slats or the folding rule The bar is placed
above the water on both sides of the embankment as shown in Figure 5 With the folding rule
the depth of the water is registrated over the entire cross profile Each section of the profile can
then be assigned a flow rate
Figure 5 Velocity Measurement
Non-direct Flow Rate Measurement Using a Weir
Estimation of flow rate using water level and physical relations for defined profiles are described in
Annex II Table II-3
Figure 6 Example of a Triangular Weir
Recommendations on water monitoring in open-pit coal-mine areas in Mongolia (RWM)
33
Direct Measurement by the Bucket-Method
A cheap and simple alternative is to use the bucket method If the discharge of the surface water
can be captured in bucket for X units of time and the captured volume determined the flow rate
can be calculated rather easily However automation is not possible in this case Use of this
method is only valid if the bucket or vessel is large enough to collect the whole volume over the
measurement time period
Dilution Methods
By adding a known concentration of tracer (eg salt or dye) into a stream and measuring its
dilution after it has been fully mixed with water the discharge can then be calculated using the
following formula
Special attention has to be paid to the selection of an appropriate tracer It should not react with
any substances present in the water and should not be taken up by sediment or organisms
Commonly sodium chloride salt or rhodamine dye is used Note that for certain tracer
substances special permits by the local environmental agencies might be needed
Manningrsquos Equation
The Manning Method can be used for open channels and partially filled pipes for non-
pressurized fluids in gravity flow This method is widely used for flow measurements because it
is easy to use after a few initial measurements have been made and it provides fairly reliable
site discharge estimates
Official requirements state that the channel should have a uniform cross section slope and
roughness within the vicinity of the measurement In addition the pipe (or channel) should be at
least 30 meters long and should not have any rapids falls or backup flow For ecological
purposes an eight-meter-long channel or less would probably be sufficient as long as the water
is flowing evenly
The equation requires obtaining values for the roughness of the channel (determined from
standard tables) the cross-sectional area of discharge flow the hydraulic radius (cross-sectional
area divided by the wetted perimeter) and the slope of the gradient Since the slope and
roughness are constants once they are known future flow estimates can be calculated by simply
measuring the depth of the discharge in the channel or pipe
= middot minus minus
Q stream discharge
q tracer injection rate
C1 tracer concentration in injection
C2 final concentration of tracer in the stream
C0 background tracer concentration in stream
Recommendations on water monitoring in open-pit coal-mine areas in Mongolia (RWM)
34
Estimation of the flow rate using water level and physical relations for defined profiles are given
in Annex II Table II-3
Flow Measurement in Open Channels
By employing level measurement over specially designed and constructed open flow channels it
is possible to calculate flow rate as a function of fluid depth In many cases fluid flow around a
mine is by means of open channels and the flow measuring techniques developed for piped flow
are thus unsuitable The requirements in terms of channel shape and applicable equations are
also discussed as these are necessary in the conversion of a level measurement to a calculated
flow rate
Pressurized Flow
Pressurized flow can be measured by magnetic flow meters or ultrasonic flowmeters for
example Magnetic flow meters require a conductive fluid and a non-conductive pipe liner The
electrodes must not corrode in contact with the process fluid some magnetic flowmeters have
auxiliary transducers installed to clean the electrodes in place The applied magnetic field is
pulsed which allows the flowmeter to cancel out the effect of stray voltage in the piping system
Surface Water Sampling
Sampling points of surface water are given by the water management system of the mine This
can include water bodies in the open-pit collection deposits of water water storage facilities
treatment facilities for water re-use springs channels or other flows
Surface water sampling is regulated by MNS (ISO) 5667-42001 Water Quality Sampling Part 4
Guidance on sampling procedure of natural lake and reservoir
In case no information indicating a specific water quality level is available at the beginning of the
monitoring program a case-specific set of analyses should be conducted This procedure should
be applied to all initial measurements until the scope can be better defined Examples of possible
sets of analyses for the ldquo0-measurementsrdquo are shown in Annex II Table II-5
Some of the steps are similar to groundwater sampling and are described in Chapter 4 The
others are described below
Local Findings
Observations concerning the following characteristics should be recorded for the area at and
directly around the sampling point This information may explain results of water analyses or
may provide information about existing chemical processes
Checklist of local findings at surface water sampling locations
Check the information in the master data sheet
Reduction spots darkening on the underside of stones as an indication of poor oxygen availability
and consequent reduction processes
Oil film (visual control) foaming
Recommendations on water monitoring in open-pit coal-mine areas in Mongolia (RWM)
35
water level runoff retention
frozen water table
changes since the last sampling eg agricultural activities earthworks or construction
sedimentation conspicuous surface use visible contamination changes in banks foreign matter
sewage foam discharges discharges
other abnormalities water level development substrate sediment
biocenoses eg waterfowls
weather during sampling eg air temperature precipitation degree of cloudiness or sun exposure
Taking Samples
In the case of surface water local representatives should be careful not to detect wastewater
plumes dead water zones or returbulence Rather the site to be sampled should be where the
largest mass transport is to be expected or where the flow rate is about 1 ms when sampling
from the embankment On the one hand for safety reasons entering the water body should be
avoided as far as possible in order to prevent sedimentation
Water samples from running waters should be taken as single samples using scooping devices
The appropriate sampling equipment is to be thoroughly rinsed with the water to be sampled
several times in advance When sampling bridges and the like care should be taken that no
contaminants get into the scoop When removing the water bottom should not be touched with
the scooping device in order to prevent the sediment being stirred up Likewise the sampling of
floating materials should be avoided
The sampler should be submerged in the upper third of the water body depth (or if necessary
approximately 5-30 cm below the surface of the water) The opening of the ladle or sampling
vessel is held in the direction of flow If several scooping processes are required to fill the
sampling containers the homogeneity of the sample must be ensured
In the case of lakes individual samples from several depth stages are to be taken at the
measuring points for the analysis of the chemical parameters depending on the different
seasonal circulation-stagnation-phases
Recommendations on water monitoring in open-pit coal-mine areas in Mongolia (RWM)
36
6 Data Management
Complete comprehensive and transparent documentation of data is one of the most important
parts of the water monitoring All data about the drilling the construction of monitoring wells
surveying water level and discharge measurements sampling and laboratory results are to be
documented The following tables show the main information for the different processes
Additional information and forms are given in the Annex I
Table 4 Example for the Documentation of the Measurement of Groundwater Levels
No
Name
Coordinate
Easting
Coordinate
Northing
level
of the
head
of the
tube
level
of the
top of
the
screen
level of
the
bottom
of the
screen
bottom
of the
monito-
ring
well
date of the
measure-
ment
depth of
the
water
table
water
level
press-
ure
level
m
asl
m
asl m asl m asl
[m
below
top of
the
tube]
m asl
44-XY-4 10833120 49975110 11041 10840 10800 10780 01042010 1420 108992
44-XY-4 10833120 49975110 11041 10840 10800 10780 29092010 1450 108962
hellip
44-XY-4 10833120 49975110 11041 10840 10800 10780 29032017 1910 108502
The required data for each groundwater monitoring well is given in Annex I Table I-1 The
water level measurements for surface water bodies can be documented in the same way Table 5
contains the required information for the measurement for water levels and flow rates as well
as for surface water sampling The table is to be adapted to the type of surface water
Table 5 Example of a Documentation of measurement point for the Flow Rate of Surface
Water
Item Unit lake
pond Fluid Remark Example
Details about the measurement point
ID (station identification number) x x Unique code system (for whole
Mongolia)
Monitoring ID Number x x Specification for the Monitoring
Program for the mine xy
Type of measurement point x x Example weir staff gauge vane
Type of measured data x x Flow rate
Owner of the station x x Mine basin ministryhellip
Name of the water body or fluid x x
Location
Aimag townvillage location name
location description
x x Link to the photos of location
East Coordinates (m) x x Mongolian grid system
North Coordinates (m) x x Mongolian grid system
Recommendations on water monitoring in open-pit coal-mine areas in Mongolia (RWM)
37
Item Unit lake
pond Fluid Remark Example
Elevation m asl x x Terrain elevation of the monitoring
station type of elevation
determination eg single instr
GPS differential GPS estimation
from topographical maps
Elevation of the reference elevation
for the measurement point
m asl x x
Bottom of water body m asl x
Water level or flow rate measurement
Water level m asl x x
Average depth of the fluidwater body [m] x x
Average width of the fluidwater body [m] x x
Flow rate ls
msup3min
x
Measurement range [m] [L ∙
s-1 msup3 ∙
min-1]
Frequency of Measurement 1Month 1Quarter
Average Velocity Curve exists x yesno
Sampling
Type of sampler x x Boat vessel
Program of sampling x x Spring circulation beginend
summer stagnation autumn
circulation
Depth(s) of the sample m x
Date of (last) sampling x x
Contamination yesno x x
Frequency of sampling x x
Remarks x x (no access possible fluid is dry
lake is frozen)
Documentation for groundwater sampling is given in Table 6 Annex I Table I-2 contains a form
for the documentation of the groundwater sample
Table 6 Example for the documentation of the Water Sampling
Item Unit Remark
Name
ID (station identification Number) Unique code system (for whole Mongolia)
Monitoring ID Number Specification for the Monitoring Program for
the mine xy
IDName of the borehole
Type of the measurement point Example weir staff gauge
Type of measured data Flow rate water level
Owner of the station Mine basin ministryhellip
Location
Aimag townvillage location name
location description
Link to the photos of location
East Coordinates (m) Mongolian grid system
North coordinates (m) Mongolian grid system
Elevation m asl Terrain elevation of the Monitoring station
type of elevation determination eg single
instr GPS differential GPS estimation from
topographical maps
Recommendations on water monitoring in open-pit coal-mine areas in Mongolia (RWM)
38
Item Unit Remark
Elevation of the reference elevation for the
measurement point
m asl
Depth of the monitoring well m depth below terrain elevation
Depth of the screen(s) m asl
Connected Aquifer
Sampling
Sampling date
Static water level m asl before purging
Static water level m asl after purging
Type of purging pump (specification example grundfos MP1)
gathering pallet
Depth of pump setting
Time Startend duration Min
Discharge during sampling l ∙ min-1
Sampling device
Field measurements
EC microScm
mScm
pH
Redox mV
O2 mg∙l-1
T degC
Color
Turbidity NTU
verbal
description
odor fresh putrid septic medicinal sulfur
chemical
Sample treatments Filtration method mesh size
Sample conservation Cooling to +4degC freezing to -20degC
storage Locationdurationconditions of storage
Designationdescription of samples Example
Sample-ID 1240I
Well-ID xc-03-1482
Date 20170915
Additions HCO3
Analysis of Fe-II
Laboratory Nameanalysis date lab identification No
Analytical methods standards
Analysis results entered Namedatefile
Remark Documentation
The high costs of monitoring require that the data be used for multiple purposes Therefore all
results of the monitoring (water level flow rate water analysis) must be clearly assignable to a
date and a location (x y z) as well as to the water body or aquifer and archiving the data has to
be robust Because mining is a very dynamic process lost or unassignable monitoring data is not
reproducible and therefore not replaceable
Recommendations on water monitoring in open-pit coal-mine areas in Mongolia (RWM)
39
7 Interpretation and Analysis of Monitoring Results
Validity Check Visualization and Interpretation of Water Level
Measurements
Validity Check
The purpose of the validity check is to compare with previously collected values (hydrographs)
with the construction details of the observation well Extreme values conflicting values and
outliers can be caused by incorrect metering of the water depth (reading error) Comparison
with former values would show a difference in this case The difference is an even value in case
of a reading error and the data can be adjusted in some cases Secondly the development of
mines and dumps may require a cut of the observation well If a change in the reference point
(head of the observation well) is not taken into account the hydrographs show a step of the
values These values have to be adjusted by the difference of the elevation of the well head
Finally if the groundwater level is below the screen the measured water level shows the water
in the sump pipe of the observation well That means the well is dry and the values are invalid
The quality control of the data is of enormous importance Flawed data can lead to wrong
conclusions (for example concerning mine safety) and thus to wrong decisions or implemented
measures
Visualization of Monitoring Results
Hydrographs
Hydrographs are plotted values of the water level versus time The water level is shown as
meters above sea level (masl) The plot can be created using basic software (eg MS Office)
Time-related changes of the water level can be detected by graphing It may be useful to plot the
water levels together with the graph of the climate water balance or graphs of groundwater
abstraction (dewatering of the mine) The measured values can be used directly
If there is a density difference of the liquid medium (eg very high salinity of the groundwater) a
conversaion into fresh water levels is necessary using the following formula
hfresh = HSW middot (ρsρf)
where hfresh is the equivalent fresh water column [m] HSW is the length of saline water column
above reference level [m] ps is the density of saline water [kgdmsup3] and ρf is the density of fresh
water [kgdmsup3] Flow rates or water levels of surface water can be plotted as hydrographs as
well
Example Interpretation of Hydrographs
The following figure (Figure 7) shows some hydrographs of different groundwater monitoring wells
around a dewatered coal mine together with the values of the climate water balance (CWB) The
values of the groundwater level are shown on the left axis and the values of the CWB on the right
axis
Recommendations on water monitoring in open-pit coal-mine areas in Mongolia (RWM)
40
As shown in the Figure 7 the water level of monitoring well 1 is stable The value of March 1996 is
an error (outlier) which should be corrected Values during the time between June 2015 and
November 2016 are missing Monitoring Well 1 is screened in the upper aquifer in our case That
means this upper aquifer is protected from dewatering of the mine by natural hydraulic barriers
(aquiclude)
However the graphs of the monitoring wells 2 and 3 show a significant drawdown (gt30 m) since
2003 These monitoring wells represent the deeper aquifer which was dewatered The
hydrograph of the monitoring well 3 has been stable since March 2008 At this point there was no
more groundwater in this well The groundwater table was either deeper than the monitoring well
or deeper than the screen of this well The values since March 2008 are not useable
Figure 7 Example of Water Level Hydrographs
Monitoring wells 4 and 5 are located at a large distance from the mine (gt5km) The water level is
directly influenced by the groundwater recharge specifically by the CWB The highly positive CWB
during 20102011 and 2013 caused higher groundwater levels The hydrograph of well 5 shows a
small drawdown in 2014 and 2015 The aquifer near well 5 could be affected by mine dewatering
Mapping of Contour Lines
A water-level contour map is a common tool used by hydrogeologists to indicate groundwater
flow directions and the hydraulic gradient as well as to test the continuum approach From field
measurements of static water levels in wells a water level contour map can be constructed
Anomalously high or low water levels and jagged or discontinuous contours may be evidence
that the continuum approach is not legitimate Water flow directions aid in the delineation of the
source water protection area
Recommendations on water monitoring in open-pit coal-mine areas in Mongolia (RWM)
41
If there is hydraulic contact between surface and groundwater the surface water bodies are to
be considered in the contour maps This applies for standing water bodies and for flowing water
Knowledge of surface water levels is required The basis of the water body added to an
estimated water level can be used in the case of flows The potential level (pressure level) is
used in the case of a confined aquifer It is also standard to use special software (eg SAGA GIS
see below) for designing contour lines A manual design of these lines however is also possible
Mapping the Depths to the Water Table
Mapping the depth of the water table is important for (a) regions with different groundwater
users with wells that are screened at different depths (b) when a hydraulic interaction between
surface water and groundwater occurs or (c) in regions with small distances between terrain
surface and the groundwater table Levels of the terrain levels of groundwater and special
software (eg SAGA GIS see below) are required for creating a map of groundwater depths
Mapping of Table Differences
Maps of groundwater level differences are a suitable tool for showing the impact of mine-
dewatering on the aquifer The groundwater levels in the monitoring wells at different dates are
the base for mapping these differences
Mapping of Monitoring Results
Contour lines describing groundwater level or potential are a suitable tool to plot the dynamics of
groundwater results are the direction of groundwater flow and the hydraulic gradient
Mapping contour lines should be done for the state before dewatering activities starts and for
each year afterward (measured in the same month)
Groundwater level difference maps are a suitable tool to illustrate the effect of mine dewatering
on the aquifers
Suitable reference states for mapping of table differences are (i) state before dewatering activities
and current state (ii) state of previous year and current state (iii) current state and prognosis
state (based on the calculated state from the model) (iv) state before dewatering activities and
prognosis state (v) state before dewatering activities and after dewatering including completed
groundwater increase
If different data sets (measurements model results) are used possible deviations must be
explained and discussed
A suitable software (freeware) is SAGA-GIS httpsaga-gissourceforgeneten
Interpretation of Monitoring Results (Water Level Flow Rates)
Establishing a hypothesis can support the interpretation of monitoring results For the
monitoring of mine dewatering such hypotheses can be the different drawdowns of the
groundwater level or a decrease in the flow rates of fluids because of higher infiltration rates
The climate situation during the monitoring period also is to be focus and part of the
interpretation Changes of groundwater level can be caused by different rates of groundwater
recharge as a consequence of different climate conditions
Recommendations on water monitoring in open-pit coal-mine areas in Mongolia (RWM)
42
Table 7 contains different types of hydraulic conditions The quantification of these conditions
can aid the interpretation of the monitoring results
Table 7 Overview of Hydraulic Conditions
Hydraulic Conditions Method for Quantifying
Precipitation Online-Data from climate stations measurement of
precipitation
Evaporation Online-Data from climate stations measurement of
evaporation from water bodies
Development of the mine Areas of claim (extensions date) Interpretation and
reports of monitoring results should include the
development of the mine during the monitoring period
The spatial development of the dewatering (construction of
well galleries) is to be documented
Development of the dewatering system of the
mine (well galleries pumping from ponds)
Rate well-specific (location depth) breaks of dewatering
begin and end of dewatering
Use of the water in the mine (process water
eg dust fixation irrigation)
Rates (Specific for location and date)
Water abstraction outside of the mine by
other users (eg water supply for livestock)
Rates (Specific for location and date)
Water infiltration (into the Aquifer) or input
(into lakes or ponds)
Rates (Specific for location and date)
Rates of fluids around of the mine Measurement of flow rates
Groundwater levels in and around of the mine Monitoring groundwater designation of water divides
Evaluation of the Hydraulic System
The hydraulic system of the mine is to be described and quantified Parameters for the hydraulic
system include water in- and outputs dewatering precipitation and evaporation among others
Water balances should then be established
The measurement estimation or calculation of parameters in the water cycle allows the
determination of the CWB The following equation describes a local water cycle
0 = P ndash ETP plusmn Qinout plusmn ∆S
where P is precipitation ETP is evapotranspiration Qinout are runoff recharge in- and outputs
(eg from wells) and ∆S is the change of storage volume The difference of precipitation and
evapotranspiration is called climate water balance (CWB)
CWB = P ndash ETP
The equation of the water cycle can be written as
0 = CWB plusmn Qinout plusmn ∆S
Dimension of the Catchment Area (Subterranean Basin)
The dimension of the catchment area is given by the following equation
Acatch = QOut GWR
where Acatch is the area of the catchment area [msup2] QOut the volumetric dewatering rate of the
mine [msup3s] and GWR is the groundwater recharge [msup3(msup2 s)]
Recommendations on water monitoring in open-pit coal-mine areas in Mongolia (RWM)
43
Validity Check Visualization and Interpretation of Water Quality
Measurements
1 Assessment of Outliers
Issue Validity check of analyses results
Goal Outlier change of water quality sampling or analysis errors
Data Requirements Time series of chemical parameters including electrical conductivity pH
and plotted concentration vs date of sampling
Method for the Interpretation of Deviations in a Time Series of Water Analysis Results
The quality of waters can naturally change over time or can be impacted by human activities
Concentration differences lower than 25 are natural in most cases If the difference is greater
than 25 the following causes are possible (a) a serious change of water quality based on
human activities (b) an error in the sampling or transport of samples or (c) an error in the
laboratory analysis
Methods for Comparison with Other Parameters
Comparison with other parameters such as electrical conductivity and pH-value gives two
possible results 1) In the case where the other parameter values have also changed that means
the change of water quality is real or the sampling was erroneous or 2) If one of the other
parameters didnrsquot change the analysis of the sample may have been erroneous The search for
errors can be identified by conducting laboratory quality assurance checks and repeating the
analyses for a retained sample If the results of the repeated analysis show the same result the
sampling is to be repeated a third time The water of the sample is to be analysed at two
different laboratories If these results yield the same concentration there has been a change in
the water quality
Result This method can estimate if a measured value (an outlier) is correct
indicating a change of quality of water or if the result is an error of
sampling or analyzation
Source DGFZ eV Dresdener Grundwasserforschungszentrum eV (GERMAN)
2 Exclusion of Ion Concentrations
Issue Validity check of analysis results
Goal Plausibility checks of analysis results
Data requirements Analysis results of O2 Fe2+ Mn2+ Ca2+ Mg2+ NO2- NH4- H2S NO3- pH-
value (doesnrsquot need to be complete)
Recommendations on water monitoring in open-pit coal-mine areas in Mongolia (RWM)
44
Method
The following concentrations exclude each other
O2 gt 5 mgl exclusion of Fe2+ Mn2+ NO2- NH4- gt 005 mgl H2S gt001 mgl
Fe2+ gt 02 mgl exclusion of NO3- gt 20 mgl
Mn2+ gt 02 mgl exclusion NO3- gt 20 mgl
H2S gt 01 mgl exclusion Fe2+ gt 01 mgl and Mn2+ gt 02 mgl
80 gt pH gt 55 exclusion of Ca2+ Mg2+ gt 1 mmoll
Result This method estimates if analysis results are correct
3 Charge Balance Error (CBE)
Issue Validity check of analysis results
Goal Check of analyses results or completeness of analyses
Data requirements Analysis results of all anions and cations with relevant concentrations
expressed in mol(eq)L
Method
One fundamental law of nature is that aqueous solutions (like water) are electrically neutral
This means that in real solutions the total sum of all the positive charges (cations) must equal
the total sum of all negative charges (anions)
Charge Balance sumcations = sumanions
Analytical errors andor unanalyzed constituents cause electrical imbalances One way to
quantify this imbalance is the charge balance error in percent
CBE = (sumcationsminussumanions)(sumcations+∣sumanions∣)times100
Interpretation of the Charge Balance Error (CBE)
CBE gt plusmn 5 analysis is incomplete (major ions are not measured) or incorrect the analyses are to
be repeated including those of additional (relevant) ions
negative CBE higher concentration of anions than of cations (not all relevant cations are analyzed)
positive CBE higher concentration of cations than of anions (not all relevant anions are analyzed)
using unfiltered samples that contain particulate matter which dissolve upon addition of acid (for
preservation purposes)
A suitable software-tool (freeware) for calculating CBE is
httpswwwlenntechcomcalculatorsaccuracyaccuracy-water-analysishtm
Recommendations on water monitoring in open-pit coal-mine areas in Mongolia (RWM)
45
4 Additional Validity Checks
Correlation of redundant parameters are to be given eg pH value or electrical
conductivity field measurement with laboratory measurement
Correlation of related parameters should be given eg electrical conductivity and
concentration of sulphate
The hydrochemical plausibility should be checked pH and concentration of the metal
ions
Chemical Characterization of Groundwater
The composition of the water is determined by the natural geogenic environment of the water
sources and chemical or biochemical reactions Knowing the sources of abstracted waters is
important for understanding the hydraulic system Possible sources may include precipitation
waters infiltrated waters from surface water bodies infiltrated waste water recharged
groundwater or fossil groundwater The following section shows some possibilities for
visualization of analyzed data from water samples This visualization allows the classification of
different water samples based on sources A special tool is the analysis and interpretation of
isotopes An estimation of the age of groundwater is possible with the results of this analysis For
more information on this topic consult the corresponding literature
1 Classification of the Water Sample by the Electrical Conductivity
Data Requirements Measured electrical conductivity
Method
Comparison of the measured values of the electrical conductivity with values from Table 8
Table 8 Conductivity for Different Types of Water
Type of Water Electrical Conductivity [microScm]
ldquopurerdquo water 0055
Distilled water lt3
Precipitation water 5 - 100
(natural uncontaminated) groundwater 100 ndash 1900
Drinking water 150 - 800
Mineral water 150 - 2000
Sea water (salt water) Round about 50 000
Result Information about the source of a water sample classification of different samples
Recommendations on water monitoring in open-pit coal-mine areas in Mongolia (RWM)
46
Graphical Tool for the Interpretation of Chemical Analyzes
The use of graphical tools can help illustrate the different types of water Different types of water
can indicate different sources (eg catchment areas different aquifers fossil groundwater)
1 Schoeller Plot
Issue Visualization and classification of water analysis results
Goal Classification of different water samples into groups
Data requirements Analysis results of anions and cations of diverse samples expressed in
mol(eq)L (advantage analyses can be incomplete)
Method
Major ion analyses (in milliequivalents per liter) can be plotted semi-logarithmically to indicate
different hydrochemical water types This plot is called Schoeller-plot The plot has the
advantages that unlike trilinear plots incomplete analyses can be used and real parameter
concentrations are displayed
Result Information as to whether there are the same or different (different
sources) types of water for different samples
2 Piperrsquos Trilinear Plot
Issue Visualization of results from water analyses classification typecast
Source GW-Chart (Freeware
httpswaterusgsgovnrpgwsoftwareGW_ChartGW_Charthtml)
Goal Classification of different water samples into groups
Data requirements complete() concentrations of Calcium Sodium Potassium Magnesium
Chloride Sulfate Hydrogen Carbonate and Carbonate expressed in
mol(eq)L
Carbonate can be calculated by the software itself using the water
temperature The TDS (total dissolved solids) are also respected in the
calculation The TDS-value can estimate by 05 ∙ electrical conductivity
Method
To see the changes in groundwater chemistry at different locations and the extent of water rock
interaction data for the ionic composition of the water samples were plotted for both the time
periods using a Piper Trilinear diagram as shown in Figure 8 Piper Diagrams are broadly used
in hydrogeology as they illustrate the hydro-chemical characteristics of groundwater by
representing the percentage of anions and cations (in meq L-1) in separate triangular diagrams
Geochemically-similar waters are clustered in clearly defined areas which indicates water
mixing phenomena precipitation dissolution etc The piper diagram can also be plotted with
the help of software
Recommendations on water monitoring in open-pit coal-mine areas in Mongolia (RWM)
47
Figure 8 Classification by Piper Plots
Source httpswwwhatarilabscom
Result Information about the type and source of water for different samples
Presentation of Data using the Valjashko Diagram
A system for the representation and classification of groundwater based on the ratio of the mean
ions and their hypothethesized dissolved salts on the basis of the publication by Valjashko
(1961) offers information on the origin of the water Compared to other methods (eg PIPER
(1944) or FURTAK amp LANGGUTH (1967)) the system allows for a better description and genetic
interpretation of the chemistry of groundwater The waters can be characterized in their genetic
position in the infiltration cycle and the influence of human activity or salt waters can be
identified
Evaluation of the Suitability of Waters for Different Uses
Drinking Water
The main aim of the water analyses is to evaluate the suitability of water for various uses such
as domestic use irrigation or industrial use In the last few decades there has been a
tremendous increase in the demand for fresh water due to rapid growth of population and the
accelerated pace of industrialization
Irrigation Water
The use of the pumped water for irrigation can be an important possibility for sustainable water
management However potential salinization of the soil limits the use of waters for irrigation
Recommendations on water monitoring in open-pit coal-mine areas in Mongolia (RWM)
48
The following interpretation gives information about the potential hazard of salinization
through salinity or sodium concentration of waters
The sodium adsorption ratio (SAR) is an irrigation-water-quality parameter used in the
management of sodium-affected soils It is an indicator of the suitability of water for use in
agricultural irrigation as determined from the concentrations of the main alkaline and earth
alkaline cations present in the water It is also a standard diagnostic parameter for the sodicity
hazard of a soil as determined from the analysis of pore waters extracted from the soil
Sodium Adsorption Ratio (SAR) Criterion
Sodium absorption ratio is the measurement of sodium content relative to calcium and
magnesium in the soil-water medium and influences soil properties and plant growth The total
soluble salt content of irrigation water is generally measured by determining its electrical
conductivity (EC) reported in microsiemens per centimeter The individual classes are defined
as EC lt 250 microScm ndash Low-Salinity-Water 250 lt EC lt 750 microScm ndash Medium-salinity-water 750 lt
EC lt 2250 microScm ndash high-salinity water and EC gt 2250 microScm ndash very high-salinity water
The sodium or alkali hazard in the use of water for irrigation is determined by the absolute and
relative concentration of cations and is expressed as the sodium adsorption ratio (SAR) The
following formula is used to calculate SAR
= $amp()
where the sodium calcium and magnesium concentrations are expressed in mmolL
The results are shown as a WILCOX-Plot as shown in Figure 9
Figure 9 WILCOX-Plot
Ions in the equation are expressed in milliequivalent per liter (meql) The salinity hazard was
between medium and high for most samples One sample indicated a very high hazard The
sodium hazard was low for the most samples and moderate for one sample
Recommendations on water monitoring in open-pit coal-mine areas in Mongolia (RWM)
49
8 Reporting
The documentation of hydrogeological studies (eg monitoring results) should contain the topics
outlined in the following checklist
Checklist Contents of Hydrogeological Studies
General information about mine company consulting company scoping area period of validity
Description of the study area
Description of monitoring program
Hydrogeological calculations (eg water balances prognoses scenarios)
Interpretation of results
Conclusions and additional measurements if necessary
Details about the several topics are given in Table 9
Table 9 Overview about the documentation of Hydrogeological Studies
Monitoring Results Hydrogeological Calculation
Chapter Content
1 General information
Name amp address of the mining company (incl respons person)
Name amp address of the consulting company name of the responsible specialist
Title of the document
Objective of the study
Name of the mining area and location of the mine (AIMAG coordinates)
Scoping area
Validity period
Name amp signature of the author (expert specialist)
2 Details of the Report
Contents
References
Objectives of the reportstudy
3 Description of the Study
Area
Morphology
Geology
HydrologyHydrography
HydrologyMeteorology
Mining activities (eg development of dewatering)
More details see below the Table 9
4 Water Monitoring
(Quality amp Quantity)
Description of the monitoring
Results of the monitoring
Documentation (values eg in tables Annex I Chapter 6)
Visualization of the results (hydrographs)
More details see below the Table 9
5 Hydrogeological
Calculations
Hydrogeological Calculation
Description of the calculation methodology modeling
Determination Calculation water cycle parameters surface runoff hypodermic
runoff storage change groundwater recharge etc
Identification of the water balances
More details see below the Table 9
6 Interpretation of the
Results of (a) Monitoring
Description of direct mining activities and the impact to groundwater levels surface
water levels or flow rates and groundwater recharge
Recommendations on water monitoring in open-pit coal-mine areas in Mongolia (RWM)
50
Chapter Content
or (b) Description of non-direct impacts of mining activities (eg water quality geotechnical
stability)
Evaluation of the impacts regarding mining safety water supply systems (wells)
groundwater reserve surface waters (rivers) and protected landscape areas
7 Conclusions -
Requested
Measurements
Groundwater drawdown andor groundwater barrage
Wells galleries of wells (measured and planned) pumping rates number and location
of wells placement the filters and advancement of dewatering
Dewatering of the open mine groundwater input into the open mine sealing walls
reach of groundwater drawdown (groundwater cone) water levels in mine dumps
potential level of the confined groundwater (below coal layer) flow rate and influx
via slopes
Surface water (dewatering change of riverbeds)
Change of flow rates artificial lakes etc
mining water cycle (water use for irrigation water fixation of dust)
water quality
Description of realization of requirements from the side of the authorities
Technical measures to minimize impact of mining dewatering and water output eg
treatment of the waters storage of the contaminated water
Adaption and development of water monitoring in future
The description of the study area includes the existing information and data
Morphology
Information about the morphology should contain data of the altitude and the terrain structure
The terrain structure is an indicator for glacial structures the surface runoff or the mining
activities If airborne laser scan data is available it can be plotted to give an overview about the
morphology
Geology
An overview of the geological situation gives a ldquostandard sectionrdquo It contains all existing layers
of the study area The different layers should be described in regard to their distribution
thickness and their characteristics (eg hydraulic characteristics) The layers can be classified
by geological processes or characteristics The different aquifers should be defined Fault zones
and fault lines should be described by their position characteristics and possible hydraulic
impact The visualization can be realised by mapping (distribution of layers) and cross sections
Hydrology
Information about meteorology should include time series averages and extreme values for
precipitation and evaporation This data is a base for calculating water balances The
interpretation of time series can give reasons behind eg of changes of water levels or flow rates
The base data of the meteorological measurement station (position altitude and distance from
study area) should be given
The hydrographic information includes the name of surface waters (flows standing water
bodies) data of measurement (time series of water levels andor flow rates) information about
the measurement stations with the basic values like (average) high- low- and mean- water or
flowrate) and existing uses of waters incl existing legal This basis information are important to
estimate possible impacts of mine activities to the surface waters
Recommendations on water monitoring in open-pit coal-mine areas in Mongolia (RWM)
51
Mining Activities
The aim is to give short information about the development of the mine eg of the explorations
dewatering system (time series of pumping rates depth of water levels) development of dumps
etc This information is important for explaining and understanding the monitoring results (eg
changes of groundwater levels) An overview of the results of former studies should be also
implemented
Description of the Water Monitoring
Components of the documentation of water monitoring are given in the following checklist
Checklist Documentation of Water Monitoring in Reports
Mapping all measurement points (monitoring wells measurement points for flow rates and water
level in surface waters and at the dewatering system of the mine)
Master data about groundwater monitoring wells screened aquifer
Time interval for level measurements and sampling
Tables containing the results of water level measurements and water sampling flow rates
Hydrographs for water levels and selected parameters of water quality
Mapping results ( Chapter 7)
Hydrogeological Calculations
Documentation of Hydrogeological Calculations should contain
the aims of calculation (eg development of the groundwater depression cone over the previous
years reduced volume of the groundwater body prognosis of pumping rates or water balances)
the methods used (eg analytical equations see Chapter 7 numerical models)
the parameters used (see Chapter 9 in the case of modelling)
results (eg mapping)
Recommendations on water monitoring in open-pit coal-mine areas in Mongolia (RWM)
52
9 Implementation of Monitoring Results into a Numerical
Flow Model
Conception of a Numerical Model
Basics
Prediction models of the quantity and impact of the mine dewatering are the basis for technical
and financial planning Knowledge of the impact of dewatering to the aquifer to water balances
and to the surface water bodies is important for the water authority and other users of the
water
Numerical models can be a suitable tool for calculation of scenarios and the future state of the
groundwater dynamic The validity of this calculation is given by the quality of the model The
model quality depends on the information about geology hydrogeology climate conditions
hydraulic boundary conditions (eg in-output flow rates) and the density and the validity of
monitoring results
Some general notes about numerical flow models
The results of a numerical model are not an alternative for the monitoring results
Every numerical model is made for a special task and for a specific region
Every model is designed using the individual experience of the modeller
The information about the design and the quality of the model is to take into consideration if
model results are be reviewed
Modelling is an iterative process that includes definition of goals grid construction and
assignment of properties and boundary conditions steady state and transient calibration
validation of calibrations predictive simulations and sensitivity analysis
Goals of the Numerical Flow Model
There are three major issues related to groundwater in mining projects that need to be
addressed 1) mine dewatering requirements 2) stability of slopes and 3) environmental
impacts on groundwater levels and on groundwater quality during mining and post-mining
periods
Knowing what we want from the model or the model results is one of the first steps of model
development Some common goals of numerical models include
Simulation of the current hydraulic processes (groundwater abstraction dewatering
progress of the mine infiltration from surface waters water input into a surface water)
Calculation of the current (maybe unknown) impacts of mine dewatering to the
groundwater table (groundwater bodies) other groundwater users Outputs are the
calculated change of the water volume over time of an aquifer maps of the differences of
the groundwater level or calculated hydrographs for (monitoring) wells
Recommendations on water monitoring in open-pit coal-mine areas in Mongolia (RWM)
53
Calculated prediction of future state passive inflow to the mine (both in space and time)
active dewatering options (if required) which means necessary abstraction rates
number of wells well-galleries drawdown cone around the mine during the progress of
the mine and the dewatering systems flow direction for determination of the potential
path lines of substance transport flow velocity impact to other groundwater users pore
pressures as input for sloperoof stability analysis (dumps)
Calculation of a post-mining state eg groundwater levels after dewatering water level
in the residual pit (artificial lake)
Calculation of scenerios impact of the design of the dewatering system eg number and
location of dewatering wells required pumping rate for each well ( optimization of
number of wells)
A numerical flow model can be the basis for a simple geochemical mixing model or a
more comprehensive solute transport model to predict quality of water discharge during
the mining or pit-lake water chemistry for post-mining conditions
The addition of further tasks and goals after establishing the numerical model can cause a lot of problems in most cases
Choosing the Method Solver and Software
Numerical groundwater flow models are based on groundwater flow equations which are
differential equations that can often be solved only by approximate methods using a numerical
analysis The most common numerical solutions are the finite difference method and the finite
element method An often-used software for finite difference method is MODFLOW (commercial
and free ware see Table 10) The commercial software FEFLOW (DHI Wasy
httpswwwmikepoweredbydhicomproductsfeflow) is known for the finite element
method
Finite Difference Method or Finite Element Method - Both methods are suitable for calculation
of dewatering in mining The advantages and disadvantages of each numerical method are not
discussed here Each mine and each dewatering system are unique That some general basics are
to be respected as described below
General Notes
3D-Model transient flow groundwater generally flows into open mines three-dimensionally and
variably through time the groundwater system (Aquifer Aquiclude) can only be characterized by a
3D-Model in the most cases
Dewatered mines are characterized by high hydraulic gradients The discritization and solver
should be adapted to meet these conditions
Rewetting option A suitable water balance (eg the required pumping rate) can calculate if a dry
(dewatered) model cell can be rewetted in the numerical process
Modeling of mine dewatering isnlsquot focused on the unsaturated (vadoze) zone in the most cases
A small selection of suitable software for numerical models can be found in the following table
Recommendations on water monitoring in open-pit coal-mine areas in Mongolia (RWM)
54
Table 10 Examples for Suitable Software for Numerical Models
Name Source Description
MODFLOW 2005
httpswwwusgsgovsoftwaremodflow-2005-usgs-three-
dimensional-finite-difference-ground-water-model
three-dimensional-finite-difference-
ground-water-model
MODFLOW OWHM
httpswaterusgsgovogwmodflow-owhm
Borden Carter Gaur Anju Singh Chabungbam R 2016 Water
Resource Software Application Overview and Review World Bank
Washington DC copy World Bank
httpsopenknowledgeworldbankorghandle1098624762 License CC BY 30 IGO
(httphdlhandlenet1098624762)
MODFLOW OWHM (bases on
Modflow-2005 Unification of all
developed tools)
MODFLOW 6
httpswwwusgsgovsoftwaremodflow-6-usgs-modular-
hydrologic-model
Hanson RT Boyce SE Schmid Wolfgang Hughes JD Mehl
SM Leake SA Maddock Thomas III and Niswonger RG
2014 One-Water Hydrologic Flow Model (MODFLOW-OWHM)
US Geological Survey Techniques and Methods 6-A51 120 p
httpdxdoiorg103133tm6A51
MODFLOW6 Parallel developement
to Modflow 2005 Modflow 6 donrsquot
replace Modflow 2005
ModelMuse-A graphical user interface for MODFLOW-2005
httpswwwusgsgovsoftwaremodelmuse-a-graphical-user-
interface-groundwater-models
Winston RB 2009 and PHAST US Geological Survey
Techniques and Methods 6-A29 52 p
MODELMUSE is an open source tool
and recommended for pre- amp
postprocessing (all versions of
Modflow)
FLOWPY
httpsmodflowpygithubioflopydocintroductionhtml
Bakker M Post V Langevin C D Hughes J D White J T
Starn J J and Fienen M N 2016 Scripting MODFLOW Model
Development Using Python and FloPy Groundwater v 54 p 733ndash
739 doi101111gwat12413
FLOWPY is an open source tool and
recommended as additional tool to
modflow (Python-based)
FREEWAT
httpwwwfreewateusoftware-0
Rossetto R De Filippis G Borsi I Foglia L Cannata M Criollo
R Vaacutezquez-Suntildeeacute E 2018 Integrating free and open source tools
and distributed modelling codes in GIS environment for data-
based groundwater management Environmental Modelling amp
Software 107210-230
for pre- und postprocessing in
combination with QGIS FREEWAT
(not for all types of MODFLOW)
Extent of the Model (Temporal and Spatial)
Most of the processes involved are time-related That means a transient flow model is to be
established in the most cases The time before any mining activity should be the ldquostartrdquo of the
simulation period The ldquoendrdquo is defined by the tasks and goals of the model For example after
dewatering the groundwater levels increase and a post-mining quasi-steady-state (only
seasonal impacts to the groundwater level) will be reached a few decades after dewatering The
maximal time increments are given by the modeled processes (change of time related boundary
conditions period of calculation) Time increments of days (between 1 d to 30 d) are
recommended for this type of modeling The duration of the calculation is proportional to the
number of time increments
Recommendations on water monitoring in open-pit coal-mine areas in Mongolia (RWM)
55
Tips for Design of the Horizontal Extent of the Model
The processes to be simulated in connection with the mine must not be influenced by the external
boundary conditions (which are to be defined at the borders of the model)
A simple rule of practice is it is better that the model area is too large than too small
Modeling the whole (subterranean) catchment area The external boundary conditions of the
model are no-flow conditions (groundwater divides) given by hydraulic barriers
Bordering the model at known stable water levels like surface water levels of lakes or known
groundwater levels both outside of the maxima of the range of dewatering
If the subterranean catchment area is completely unknown and if there are no stable known
boundary conditions an estimation of the model extent is possible using the groundwater
recharge and the abstraction rate of dewatering The rate of dewatering gives the necessary size
of the catchment area The model area is to be larger than this because the spatial direction is
unknown
The vertical extension includes all relevant layers aquifers and aquicludes
The cell size is smaller (eg 1m ndash 100 m) in the focussed area and larger outside of it (gt100 m) in
the most cases
Implementation of Boundary Conditions
Hydraulic boundary conditions are water divide dewatering and infiltration wells surface
water bodies (lakes ponds) or streams with hydraulic contact to the aquifer groundwater
recharge and water levels (outside of the focused area) For detailed information see eg
httpswaterusgsgovnrpgwsoftwareModelMuseHelpindexhtmlboundaryconditions5ht
m
Implementation of Monitoring Results
The results of the water monitoring will be used for the calibration and validation of the
numerical model The model calibration means the minimization of the difference between
calculated and measured water levels (potential levels flow rates of fluids) by modification of
the model structure or its parametrization and modification of the boundary conditions
The quality of a numerical model can be shown by
comparing measured and calculated groundwater levels potential levels flow rates (eg
using a scatter-plot)
calculating the statistical parameters (eg mean error root mean square deviation
normalized root mean square deviation)
comparing the measured and calculated hydrographs and
mapping the difference between measured and calculated values
Recommendations on water monitoring in open-pit coal-mine areas in Mongolia (RWM)
56
Evaluation of Model Results
An evaluation of model results can be supported by answering the following questions of the
three parts a) quality of the used database b) validity and results of calibration and c)
plausibility of modeling
Questions for the Evaluation of Model Results
Are there validity databases for the description of the hydrogeological structure and
characteristics the hydraulic boundary conditions and monitoring results
Are the monitoring results clearly allocable in space and time
Are the relevant processes identified and quantified
Are the implemented boundary conditions plausible and sufficiently unrestrictive Are the
boundary conditions chosen to have a minimal impact on key model outcomes How is this
ascertained
Are all available types of observations (water levels flow rates) used for calibration
Is the model calibrated to steady-state pre-mining and transient (initial mine dewatering pump
tests etc) conditions
Are there graphs showing modeled and observed hydrographs at an appropriate scale Follow the
calculated values in the observed trend
Are calibration statistics reported and illustrated in a reasonable manner Is the model sufficiently
calibrated (spatially temporally) Are the calibrated parameters plausible Are the water volumes
and fluxes in the water balance realistic
Are the model predictions designed in a manner that meets the model objectives
Are the scenarios defined in accordance with the model objectives and confidence level
classification Are the pumping stresses similar in magnitude to those of the calibrated model Are
well losses accounted for when estimating maximum pumping rates per well If not Is there
reference made to the associated reduction in model confidence Are the pumping rates assigned
in the input files equal to the modeled pumping rates
Are there any anomalous boundary fluxes due to superposition of head dependent sinks (eg
evapotranspiration) on head dependent boundary cells (Type 1 or 3 boundary conditions) Does
predicted seepage to or from a river exceed measured or expected river flow
Is some qualitative or quantitative measure of uncertainty associated with the prediction reported
together with the prediction Are the sources of uncertainty discussed
Recommendations on water monitoring in open-pit coal-mine areas in Mongolia (RWM)
57
Reporting of Numerical Models
Numerical modeling is an iterative process over month to years Often only the modelers use the
numerical model with all details of in- and output data It isnrsquot possible to check all databases in
the implemented kind (input data files) for example That means the documentation of the
model is the most important way to control model assumptions and model results and to
evaluate the model That means all input data assumptions and results of the calculation
should be containing in the documentation of the model
Checklist Must-haves of Documentation Concerning Numerical Flow Model and Model Results
The model objectives and model confidence level classification have to been clearly stated Are the
objectives satisfied
Definition of space and period (eg flow of groundwater of the aquifers XY within the catchment
area of mine Z from pre-mining until post-mining state)
Description of the conceptional model Is the conceptual model consistent with objectives and
confidence level classification
Description and citation of the used data base and information base
Description of the design of the structure model discritizaion of the space cell size numbers of
model layers parametrization (eg mappimg of the implemented values hydraulic conductivity
the storage coefficient effective and total porosity anisotropy)
Description of the design of boundary conditions discretication of time mapping of the used
types of boundary conditions (including groundwater recharge) and detailed description (time
constant time variable values) mapping of the initial heads of water level (groundwater surface
water)
Information about the method used (finite difference method finite elemnte method) the
software and the solver
Description of the calibration process (a) analysis of the sensitive parameters (calc hydrographs
by different rates of groundwater recharge or hydraulic conductivity anisotropy of hydraulic
parameters) (b) measurement values for the comparision with modeled results (measured
groundwater levels of monitoring wells measured flow rates) (c) results of calibration (differences
between calculated and observed values and its distribution in space and time verbal discussion
of these results (causes of differences is the calibration satisfactory)
Results of the validation
Description of the basics (eg boundary conditions) for the calculation of prognosis andor
scenarios (eg change the number or pumping rates of dewatering wells)
Results of the calculation (mapping) and verbal discussion Are the results plausible Evaluation of
the uncertinity Is the model fit for its purpose
Further useful information about numerical flow modeling documentation of models and evaluation
of models are given at the following pages (in English language)
Recommendations on water monitoring in open-pit coal-mine areas in Mongolia (RWM)
58
About Modeling
ftpftpccrsnrcangccaadEMSAnitaGW_articlesgrwater_modelpdf
Documentation of Models
httpspubsusgsgovtm06a55tm6a55pdf
Evaluation of Models
httpspubsusgsgovsir20045038PDFSIR20045038part2pdf
httpsconsultationdplhwagovaucommunications14d86ef9supporting_documentsCompaniontomod
ellingguidelinespdf
Recommendations on water monitoring in open-pit coal-mine areas in Mongolia (RWM)
59
10 Audit Evaluation and Optimization of Monitoring
Auditing the monitoring program means evaluating and reviewing the methods used in the
monitoring program and identifying additional information required It is important to
recognize that the environmental and water management requirements and driving forces
change from time to time and methods of monitoring improve Monitoring programs must
therefore be updatedmodifiedimproved regularly to reflect these changes or modifications in
practices and procedures The rationalization of the monitoring program is also required to
ensure that the program remains effective and properly focused and that it does not entail
excessive costs
The evaluation of a monitoring program includes
Training of the staff
Certification (Staff laboratory techniques of measurement)
Accreditation of the laboratory
Standardizations (proceedings compliance management)
ISO 14001
Recommendations on water monitoring in open-pit coal-mine areas in Mongolia (RWM)
60
Specific Glossary
Unconfined Aquifer An aquifer which is not overlain by any confining layer but has a
confining layer at its bottom is called unconfined aquifer It is normally exposed to the
atmosphere and its upper portion is partly saturated with water The upper surface of
saturation is called the water table which is under atmospheric pressure Therefore this aquifer
is also called phreatic aquifer
Perched Aquifer This is a special case of an unconfined aquifer This type of aquifer occurs
when an impervious or relatively impervious layer of limited area in the form of a lens is located
in the water-bearing unconfined aquifer The water storage created above the lens is the
perched aquifer and its top layer is called perched water table
Confined Aquifer Also called artesian aquifer this is a type of aquifer overlain as well as
underlain by confining layers The water within the aquifer is therefore held under pressure It
is also sometimes called pressure aquifer If the aquifer has high outcrop laterally then the
ground surface there will have a positive hydrostatic pressure creating the conditions for a
flowing well Water from such well comes to the surface without pumping The imaginary level
up to which the water will rise is called piezometric surface
Leaky Aquifer In nature truly confined aquifers are rare because the confining layers are not
completely impervious An aquifer that is overlain or underlain by a semi-pervious layer
(aquitard) through which vertical leakage takes place due to head difference is called leaky
aquifer or semi-confined aquifer The permeability of the semi-confining layer is usually very
small compared to the permeability of the main aquifer Thus the water which seeps vertically
through the semi-confining layer is diverted internally to proceed horizontally in the main
aquifer
FracturedFissured Rock Aquifer Fractured rock aquifers (bedrock crystalline rock hard
rock and basement) have limited storage capability and transports water along planar breaks
Aquitard A body of rock or stratum of sediment that retards but does not prevent the flow of
groundwater from one aquifer to another
Aquiclude (or aquifuge) is a solid impermeable area underlying or overlying an aquifer
Porosity In soil mechanics and hydrology porosity is defined as the ratio of volume of voids to
the total volume of porous medium The significance of the porosity is that it gives the idea of
water storage capacity in the aquifer Qualitatively porosity less than 5 is considered small
between 5 and 20 as medium and above 20 is considered large
Hydraulic Conductivity is a property of soils and rocks that describes the ease with which a
fluid (usually water) can move through pore spaces or fractures It depends on the intrinsic
permeability of the material the degree of saturation and on the density and viscosity of the
fluid Saturated hydraulic conductivity Ksat describes water movement through saturated media
By definition hydraulic conductivity is the ratio of velocity to hydraulic gradient indicating
permeability of porous media
Recommendations on water monitoring in open-pit coal-mine areas in Mongolia (RWM)
61
The water cycle also known as the hydrologic cycle or the hydrological cycle describes the
continuous movement of water on above and below the surface of the Earth
Groundwater recharge also known as deep drainage or deep percolation is a hydrologic
process where water moves downward from surface water to groundwater Recharge is the
primary method through which water enters an aquifer This process usually occurs in the
vadose zone below plant roots and is often expressed as a flux to the water table surface
Groundwater recharge also encompasses water moving away from the water table further into
the saturated zone Recharge occurs both naturally (through the water cycle) and through
anthropogenic processes (ie artificial groundwater recharge) where rainwater and or
reclaimed water is routed to the subsurface
Climatic Water Balance (CWB) The climatic water balance (CWB) is defined as the difference
between precipitation depth and the depth of potential evapotranspiration at a given site during
a certain time period
Groundwater Monitoring Wells (GWM) Groundwater management point groundwater
observation well both are common synonyms
Water Quantity in this document means water level flow rates and water volume
Groundwater surface Groundwater table pressure table (in case of confined groundwater) are
common synonyms
Recommendations on water monitoring in open-pit coal-mine areas in Mongolia (RWM)
62
Annexes
I Forms
Table I-1 Example for the Documentation of a Monitoring Well
UNIT Example 1 Example 2 Example 3
Number Name of the measurement
point -- 4500123 HY-45-2018 000789 (73L)
ID (well borehole)
Owner of the well
Coordinate Northing -- 5712345 5745678 5756789
Coordinate Easting -- 5412345 5445678 5456789
Location (Aimag village mine)
Elevation (terrain level) -- 10757 11229 10944
Elevation of well head [m asl] 10761 11237 10951
Name of the hydraulic connected
aquifer -- 100 300 111
Water level pressure level [m asl] 10635 10960 10804
Diameter of the casing [mm] 115 115 115
Drilling Method dry Dry dry
Diameter of the borehole [mm] 324 324 324
Bottom of the monitoring well [m asl] 10181 10330 10200
Screen (top ndash bottom) [m asl] 10221 ndash 10201
Material of
construction
blank casing sump
pipe -- PVC-U PE-HD PE-HD
tube of the screen -- PVC-U PE-HD EWD
Length of the
casing
blank casing [m] 540 300 150
tube of the screen [m] 20 20 30
sump pipe [m] 20 10 20
Thickness of filter sand filter gravel [m] 30 30 40
Recommendations on water monitoring in open-pit coal-mine areas in Mongolia (RWM)
63
annulus sand barrier (between
filter sand and clay
seal)
[m] 10 10 10
clay seal [m] 30 100 30
filling sand [m] 510 190 120
Data logger yesno --
Water sampling yesno
Remarks Examples no water no
access observation well destroyed
maintenance repair necessary
Recommendations on water monitoring in open-pit coal-mine areas in Mongolia (RWM)
64
Table I-2 Form for a Water Sample (source LMBV mbH Merkblatt Montanhydrologisches
Monitoring 2019)
JOURNAL for Sampling of Groundwater
Date Time Sample-Ndeg
Object Client
NameNumber
of Moni well
Other Ndeg
Position Easting Northing
Type of Moni Well Single Well
Bundle of Monitoring wells
(please mark) group Construction Material
Measurm point [m asl] Diameter of the Casing cm
Position of screen bottom
Date Level of GW
[m below MP]
top
1 pump m
2 pump m
Depth of the
moni well Constr [m] 3 pump m
sonded [m]
Before sampling
m
After sampling
m
Zone of Sampling mixture Depth of the sample [m]
top central bottom
Type of Sampling Dopple pump
Centrifugal pump
cock suction drawing
Pumping Rate
[Lmin]
Duration [min]
Volume
[msup3]
Analysis in
Field
Temperature of GW [degC]
Air-Temperature
[degC]
pH-Value [-]
el Conductivity [microScm]
Oxygen [mgl]
Redox potential UG1) UH2)
[mV]
perceptions clear white grey yellow Brown
Recommendations on water monitoring in open-pit coal-mine areas in Mongolia (RWM)
65
At the sample Color
no low medium strong
Turbidity
no aromatic putrid sanious chemical
Odor
yes no yes no Chlorine Mineral oil
Out gasing Deposit
Vessel Glass light dark Plastic
Conservation
See
Documentation
cooler refrigerator Date Time
Transportstorage
Delivery
to the
lab
Remarks
Institution
(stamp)
Sampler
(signature)
Recommendations on water monitoring in open-pit coal-mine areas in Mongolia (RWM)
66
II Technical Details
Table II-1 Construction Details for Monitoring Wells (Water Level and Water Quality)
Construction Diameter Pipe Inner Diameter ge DN 50 (2) for water level measurements pipe inner
Diameter ge DN 100 (4rdquo) for water sampling wells
Material of Construction HDPE PVC-U
Length of the Filter Pipe 1- 2 m (in special cases this can also be longer)
Filter Size and Filter Filling
Based on the on-site wet sieving the following filling diameter and filter gap
size are recommended
Composition of the
Aquifer Filling Diameter [mm] Filter Gap Size [mm]
Middle sand and
fine sand fraction 071 - 125 05
Course sand 20 -- 315 15
Solid rock 20 -- 315 15
The use of gravel adhesive filters is excluded In principle the groundwater
measuring well has to be backfilled with a bulk pipe
Length of the fill material should be from about 05 m under the lower edge
of the filter up to about 05 m over the upper edge of the filter
Length of the Counterfilter about 05 m on both sides in direct contact with the upper and lower filter
material
Seals in the Annular Space
1 m (through geophysical methods localizable)
Bothsides in direct contact with the counterfilter as well as 10 m (or
completely) sealed of drilled aquicludes
A missing or incorrectly installed seal can cause a hydraulic short circuit
between hydraulically separated aquifers In doing so the functionality of the
drainage system of the mine can be impaired Furthermore a water
exchange of different aquifers can cause a mixture of different water
qualities Water samples from not right-sealed monitoring wells are not
useable
Sump pipe 1 m with bottom plate
Bottom Closure
Protecting pipe construction as measuring well head ldquohooksrdquo against the
throwing in of solids pouring in of fluids secure cap closure
Installation with spacers and pouring pipe (should be carried along during installation)
Recommendations on water monitoring in open-pit coal-mine areas in Mongolia (RWM)
67
Table II-2 Overview of the Recommended Processes for the Functionality Test of Groundwater
Measuring Points
Analysis Method Parameters to be Measured and Recorded Application Hard (H)
or Loose (L) Rock
Camera Inspection (OPT) Depth profile of the visual contamination of
the inner construction
H L
Caliper and Microcaliper Log (CAL-M) Depth inspection of the inner diameter H L
Gamma Ray Log (GR) Depth profile of the natural radioactivity H L
Gamma-Gamma Log (GG) Depth profile of gamma radiation dispersion
in the rock (Conclusions about back-filling
density)
H L
Neutron-Neutron Log (NN) Depth profile of the neutrons after the
deceleration of fast neutrons (Conclusions
about porosity through the hydrogen
content)
H L
Magnetic-Log (MAG) Depth profile of magnetic susceptibility of
the backfill
Predominately H
Resistance measurement in focused
configuration (FEL)
Depth profile of the electrical backfill
resistance
Predominantly H
Short Pump Trial (KPV) Time-profile of the groundwater level
decrease and pump-out rate
Predominantly L
Packer Flow Meter Measurement
(FW-PACK)
Depth-dependence of the groundwater flow
rate in the groundwater measuring well
H L
Measuring the Salinity (SAL) and
Temperature (TEMP)
Depth profile of the salinity and temperature
of the groundwater in the measuring well
H L
OPTIONAL Filling Test Time profile of the decrease after water
filling the groundwater measuring well
L
OPTIONAL 12-hour well
performance test (like observation
well test)
Dependence of the groundwater level
decrease on the pump flow rate in the
measuring well
L
Recommendations on water monitoring in open-pit coal-mine areas in Mongolia (RWM)
68
Table II-3 Calculation of Flow Rates for Measurement Weirs (Rectangular and V-Notch)
Rectangular
Weir
Q = 23 ∙ micro ∙ b ∙ (2∙g)12 ∙ (he +00011)32
Q = discharge [msup3s]
g = gravitational acceleration (g = 981
ms2)
he = head on the weir [m] measured in
a distance of
3 x he to 4 x he behind the weir
b = length of the weir [m]
micro = weir coefficient micro = 062 sharp
with air ventilation
micro = 05 wide sharp without air
ventilation
Triangular (V-
notch) Weir
Q = 815 ∙ micro ∙ tan(α2) ∙ (2∙g)12 ∙ (he)52
Q = discharge [msup3s]
g = gravitational acceleration (g =
981 ms2)
he = head on the weir [m] measured
in a distance of
3 x he to 4 x he behind the weir
b = length of the weir [m]
micro = weir coefficient micro = 062 sharp
with air ventilation micro = 05 wide
sharp without air ventilation
if α = 90deg than
Q = 1352∙he2483 [msup3s]
preconditions
005 m lt he lt ca 04
Hew lt 04 hebo lt 02 w gt 045 m
Recommendations on water monitoring in open-pit coal-mine areas in Mongolia (RWM)
69
Table II-4 Purge Volume Determination (VP) of the Water Sampling
The Purge Volume Determination (VP) is carried out by calculating the hydraulic criteria and by
measuring the chemical criteria
Hydraulic Criteria
The purge volume can be calculated by the equation
VP = n π4 dsup2 h
With
h = length of water column in the screen of the well [m]
d = diameter of well (borehole) in [m]
V = volume of water [msup3]
n= volume factor
n ge 15 in [17] n = 3 to n = 5
If the pump is installed more than one meter above screen this additional distance is
to be added to the value of h
Chemical Parameter
Stabilization Criteria
Achievement of the chemical stability criteria is the guarantee for a homogeneous
water sample Otherwise the sample would represent a mixture from different
waters and a mixture doesnrsquot represent the quality of the water from the aquifer
With respect to the groundwater chemistry an adequate purge is achieved when the
pH of the groundwater has stabilized within plusmn 01 the specific conductance within plusmn
5 and the turbidity has either stabilized or is below 10 nephelometric turbidity
units (NTUs) The temperature of the groundwater is not suitable for proof the
chemical stability criterion because it changes too rapidily during sampling
especially in extreme climatic regions This data should be noted in the field log
during sampling see ANNEX I Table I-2
For these analyses the pumped volume shouldnrsquot be too high because in this case
the water sample can represent another zone of the aquifer (eg deeperhigher
layers)
Recommendations on water monitoring in open-pit coal-mine areas in Mongolia (RWM)
70
Table II-5 Parameters of Analysis of Water Samples (eg ldquo0-measurementrdquo)
Parameter Groundwater Surface Water Water of streams and in the pit
Quantity
Water level x x x
Flow rate x
Quality
pH-Value x x x
Electrical Conductivity x x x
Oxygen x x x
Redox-potential x x x
Acidity x x x
Alcality x x x
Fe (II) x x x
Sulphate x x x
Sulfide (x)
Chloride x x x
o-Phospate x x x
Phosphate (all) x x x
nitrate x x x
nitrite x
Ammonium x x x
Hardness (total) x x x
Carbonate hardness x x x
DOC X
TOC x x
TIC X X X
Dry residual x
Calium x x x
Sodium x x x
Calcium x x x
Magnese x x x
Manganese x x x
Phytoplancton x
Zoo-Plancton x
Depth of visibility x
Depth profile x
Turbidity x
Recommendations on water monitoring in open-pit coal-mine areas in Mongolia (RWM)
71
Table II-6 Type of Sample-Flagons and Reagents for the StabilizationConservation of Water
Samples
Parameter Type of sample flagons
and reagents
Method for chemical
stabilizationconservation of water
samples
Coloring (SAK-436) turbidity
(TEF) SAK-254 Ammonium
nitrate nitrite calcium
magnesium sulphate chloride
Glass Polyethylene cooling
Oxygen (Winkler) acid-base
capacity phosphate
Glass with grinding
borosilicate glass full plug
cooling
Bore borate silicate sodium
potassium fluoride
Polyethylene cooling
Cyanides Polyethylene pH-Value 9-12 by input NaOH
recommendations of the laboratory
Metal ions (Al Ag As Ba B Ca
Cd Co Cr Cu Fe Li Mg Mn Mo
Ni Pb Sb Si Sr Ti Tl U V Zn)
Polyethylene FEP acidify by HNO3 to pHlt2 for analyzing
of dissolved metal ions filtration in field
(membrane filter 045 microm)
mercury borosilicate glass acidify by HNO3 to pHlt2 add-on
K2Cr2O7 (005)
DOC TOC Brown glass cooling
Recommendations on water monitoring in open-pit coal-mine areas in Mongolia (RWM)
72
III Supporting Websites
Table III-1 Some Online Sources of Basis Information about Geology and Hydrogeology
Topic Website
Hydrogeology httpswwwcommdevorgwp-contentuploads201505IFC008_PPT_
Community_Rev1_FINAL_MON_250517pdf
Water httpirimhenamemgovmnindexphp
httpeicmnwater
httpraisesuiritsukubaacjpnewpressyoushi_sugita9pdf
httpeicmngeodata httpeicmnsurfwater
Meteorology amp
Hydrology
httpirimhenamemgovmnuploadfilesButeel_35-2015pdf
httpeicmnclimate
httpwwwtsag-agaargovmnatmosphere
httpwwwsteelhouseinfoindexphpmn94294-mongolian-weather
Geology httpirimhenamemgovmnuploadfilesButeel_35-2015pdf
Aquifers httpwwweicmngroundwater
httpwwweicmnwaterbasin
httpwwweicmngroundwaterdepositinfo_morephpgid=52
Groundwater
Recharge
httpeicmngroundwatergisphp
httpwwwewa-onlineeuyoung-water-professionals-
conferencehtmlfile=tl
_files_mediacontentdocuments_pdfEvents2016IFAT202016115
0_Sunjimaapdf
Water Basins httpeicmngroundwatergisphp
httpwwwiwrm-
momodedownloadAndrewKausDissertation2018pdf
Groundwater
Monitoring
httpwwwgroundwatermn
httpwwwewa-onlineeuyoung-water-professionals-conference
htmlfile=tl_files_mediacontentdocuments_pdfEvents2016IFAT2
020161150_Sunjimaapdf
Norms httpgreenassessmentmnuploadfiles
httpwwwmnemnwp-contentuploads201709Tailan-pdf-last-1-
ilovepdf-compressed-ilovepdf-compressedpdf
httpswwwcommdevorgwp-
contentuploads201505IFC008_PPT_Community_Rev1_FINAL_MON_250517pdf
Recommendations on water monitoring in open-pit coal-mine areas in Mongolia (RWM)
73
IV Mining Water in Mongolian Laws
(Extractions)
The Law of Mongolia on Water (2012) is one of the most important environmental laws
Especially for the mining sector the law plays an integral role However the current
legislation is only poorly linked to the mining objectives Therefore authorities might
experience difficulties in the decision-making process The specific interaction and
compatibility should be checked and special attention must be paid to ambiguous cases
Art 46 The cabinet members in charge of nature and environment establish a water
resource council and approve the rules and regulations
Water Monitoring Art 6 amp 25 Water monitoring-research network The State
Administrative Central Organization in charge of nature and environment is supposed to
establish and maintain a water monitoring research-integrated network Organizations
and economic entities such as mining companies are a component of this network
Article 8 The State Great Hural (parliament of Mongolia) has the power to determine the
fees for water usage and water pollution
Article 17 The duties and powers of the basin administration include receiving
applications from citizens economic entities and organizations for well and hole drilling
as well as channel and canal building for the purpose of water usage to make
conclusions on water use on the basis of water resource management plans and in
accordance to 284 of the present law and to enter new wells into a database
Additionally the basin administration defines the grounds for water usage and water
pollution fee in accordance with the relevant legislation monitors the potential usable
water resources and water utilization at basin area regularly Licenses for mineral
exploration and exploitation in the relevant basin shall be granted based on the
recommendation of the relevant basin administration
Article 19 The respective soum (second level subdivision below the aimags (province of
Mongolia)) has the power to charge the water usage and pollution fees in accordance
with the legislation and to supervise its payment
The basin councilrsquos tasks are to monitor whether the water user is fulfilling its obligation
set out in article 30 of the present law to monitor whether the water user is fulfilling its
duty to reduce negative impacts elimination of damage and rehabilitation work
Article 21 A license for professional institutions can be issued by the State
Administrative Central Organizations in charge of nature and environment for a period
of five years and could be extended for another five years if the institution fulfilled its
duty in a proper way
Article 24 Protection of water resource against contamination The basin administration
can issue a permit to entities engaged in waste water removal with a quantity exceeding
500 m3 per day or contaminated waste water specified in 10112 of the present law The
governors of the soum and district may also issue permits However only when the
Recommendations on water monitoring in open-pit coal-mine areas in Mongolia (RWM)
74
volume of waste water per does not exceed 50 m3 In case of disregarding of the norms
specified in the permit or repeatedly disregarding the standard procedures the permit
might be subject to cancellation
Article 25 Payment and compensation for water pollution and depletion The permit
holder is responsible for the supervision of the quantity and the quality of the waste
water and the discharge of it after having met the standard requirements The holder is
furthermore liable to pay a water contamination fee If treatments do not meet standard
requirements the permit holder might be subject to a water pollution compensation
which has to be paid to the environment protection fund Water pollution and water
depletion fees are determined according to the law
Water utilization Article 27 and 28 Issuing permission to water users Permissions for
well and hole drilling and digging of channels and canals are issued by the aimag capital
city environment authority Applications to obtain a permit need to be submitted to that
authority and needs to document ie the following information Purpose and volume of
water usage copy of proof of land ownership possession and use information
regarding the wells The aimag capital city environment authority registers the wells and
holes in the water database and issues well passports
Citizens economic entities and organizations need to submit the water usage request to
a legal person specified in 284 of the present law The following documents need to be
annexed to the request A map indicating the water source to be used and its location
exploration and survey reports of water and mineral water resources quality
composition and conclusion on potential usable resources amount of water to be used
per day and its purpose drawings and project of water facilities production capacity
technical and economic indications environmental impact assessment documents In
case of the utilization of water for strategically important mineral deposits the permit
should be valid throughout the duration of the exploitation license
Article 31 Water usage fees Upon usage of water fees are charged which are set by the
law In case of usage of water exceeding the permitrsquos volume escalated rates up to 50
may apply The state administrative central organization will determine the exact rate
which the government needs to approve
Recommendations on water monitoring in open-pit coal-mine areas in Mongolia (RWM)
75
V Regulations concerning Water Monitoring and Water Management in
Mongolian Standards (MNS)
Mongolian standards are stored in httpgreenassessmentmn and httpwwwmnemn
Table V-1 Regulations about water monitoring and water management in Mongolian Standards (MNS)
Task Mongolian Standard (MNS)
Environmental protection and
hydrology general
requirements
MNS 334288 Groundwater protection General requirements Replaced by
MNS 33421982 General requirements for protection of groundwater from
pollution contamination
MNS 0017-1-1-101979 Water use and protection Terms and definition
MNS 0017-1-1-141980 Hydrosphere Classification of water use General
requirements
Water quality general
requirements
MNS 45861998 Water environmental quality General requirements
MNS 49432000 Water quality Waste water
MNS 4943-2011 Effluent treated waste water (Max content of polluting
substances in the waste water released to open nature monitoring
requirements during operation)
MNS 6148-2010 water quality Maximum limit of substance contaminating
the groundwater
MNS 9002005 Environment The human health protection Security Drinking
water Hygienic requirements and quality control
MNS 25731978 Environmental protection Hydrosphere Water quality
indicators
Surface water quality
monitoring procedure
MNS 404788 Environmental protection Hydrosphere
Water sampling MNS (ISO) 48671999 Water quality Sampling Part 3 Recommendation of
sample preparation and storage
MNS (ISO) 5667-12002 Water Quality Sampling Part 1 Guidance on the
design of sampling programs
MNS (ISO) 5667-22001 Water Quality Sampling Part 2Guidance on
sampling techniques
MNS (ISO) 5667-42001 Water Quality Sampling Part 4 Guidance on
sampling procedure of natural lake and reservoir
MNS (ISO) 5667-102001 Water Quality Sampling Part 10 Guidance on
waste water sampling procedure
MNS (ISO) 5667-112000 Water quality Sampling Part 11 Guidance on
groundwater sampling
MNS (ISO) 5667-132001 Water Quality Sampling Part 13 Guidance on
waste water and water treatment facility sludge sampling procedure
Water sampling analysis MNS (ISO) 110832001 Environment Water Quality Determination of
chromium (VI) uing spectrometric method (15-diphenylcarbazide)
MNS 50322001 Water quality Determination of heavy metals using the
Rontgen fluorescence method
MNS (ISO) 119232001 Water quality Determination of suspended solids by
filtration through glass (fibre filters)
MNS (ISO) 48891999 Water quality Determination of electrical conductivity
MNS 44201997 Drinking water Determination of mercury Atomic
absorption method
MNS 44302005 Drinking water Determination of measuring iron
compounds
MNS 43411996 Industrial water Determination of magnesium
concentration
MNS 43481996 Industrial water Determination of copper
Recommendations on water monitoring in open-pit coal-mine areas in Mongolia (RWM)
76
Task Mongolian Standard (MNS)
MNS 44312005 Drinking water Determination of nitrite concentration
MNS 42171994 Drinking water Determination of total nitrate concentration
MNS 39351986 Drinking water General requirement for field testing of
water
MNS 39361986 Drinking water Field analysis methods
MNS 39001986 Drinking water Determination of taste color smell and
turbidity
MNS 39001986 Drinking water Determination of taste color smell and
turbidity
MNS 35321983 Surface water Determination of lead content
MNS 0017-1-5-151980 Environmental protection Hydrosphere
Determination method of oil products in water
MNS 44231997 Drinking water Method of measuring dry residue
MNS 25701978 Method of measuring water purity
MNS 40791988 Water quality terms and definition
MNS (ISO) 78872000 Water quality Determination method of water color
and its checking
MNS 57902007 Water quality Determination of manganese (Mn)
concentration
MNS (ISO) 48171999 Water quality Determination of ammonium
MNS (ISO) 79802003 Water quality Determination of calcium and
magnesium through atom absorption spectrometer method
MNS (ISO) 58142005 Water quality Determination of dissolved oxygen
concentration Electric chemistry method
MNS (ISO) 60602001 Water quality Determination of chemical oxygen
demand
MNS (ISO) 92802001 Water quality Determination of sulphate by barium
chlorine gravimetric method
MNS (ISO) 105232001 Water quality Determination of pH
MNS 56662006 Water biological properties Assessment Determination
method of active sludge of waste water treatment facility
MNS 56682006 Water biological properties assessment Microbiological
analysis method of waste water

Recommendations on water monitoring in open-pit coal-mine areas in Mongolia (RWM)
5
Abstract Recommendations on Water Monitoring in Open-pit Coal Mine Areas
Monitoring and understanding the local water system provides a basis for a more sustainable and efficient water management
This document gives recommendations concerning the planning and technical realization of water monitoring system for open-pit coal-mines while providing focus on the interpretation documentation and reporting of monitoring results These recommendations are based on site visits to Mongolian open-pits mines as well as experiences from water monitoring in lignite mining in Germany which have been adapted by considering the current conditions in Mongolia
These recommendations are intended for managers at the operational level but they may also be useful for environmental officials competent authorities non-government organizations students and people with a general interest in the best practices associated with monitoring the quality and quantity of ground and surface waters in and around open-pit coal-mines The goal of this work is to improve the mining industryrsquos environmental performance
Kurzbeschreibung Empfehlungen zum Wassermonitoring fuumlr Gebiete des Kohlentagebaus
Grundlagen fuumlr eine nachhaltige und wirkungsvolle Wasserwirtschaft sind das Systemverstaumlndnis und die messtechnische Erfassung des lokalen Wasserhaushaltes
Mit dem vorliegenden Dokument sollen Empfehlungen zur Planung und technischen Realisation fuumlr das Wassermonitoring in Kohlentagebauen gegeben werden wobei der Schwerpunkt auf der Interpretration Auswertung und der Erarbeitung von entsprechenden Bereichten liegt Diese Empfehluingen basieren auf Befahrungen mongolischer Tagebau und Erfahrungen zum Wassermonitoring die im Braunkohlentagebau in Deutschland gemacht worden sind wobei letztere auf die gegenwaumlrtigen mongolischen Verhaumlltnisse angepasst worden
Die vorgelegten Hinweise sind fuumlr Tagebautreibende genauso wie fuumlr Umweltinspektoren Behoumlrdenvertreter NGOs Studenten und Interessenten bewaumlhrter Praxis des Monitoring von Grund- und Oberflaumlchenwasser hinsichtlich Menge und Beschaffenheit in und um Kohlentagebaue gerichtet Ziel dieser Arbeit ist die Umweltvertraumlglichkeit des Bergbaus zu verbessern
Recommendations on water monitoring in open-pit coal-mine areas in Mongolia (RWM)
6
Table of Contents
List of Figures 8
List of Tables 9
Summary 10
1 Forward 11
2 Introduction 12
Mining and Water 12
Goals and Outputs of Water Monitoring in Mining Areas 12
Legal Framework and Standards 14
Processes and Outputs of Water Monitoring 15
Preliminary Characterization of the System 16
3 Definition of Monitoring Objects 19
4 Groundwater 21
Use of Existing Groundwater SamplingMeasurement Points 21
Planning of Positions for (New) Groundwater Observation Wells 22
Construction of New Groundwater Monitoring Wells 23
Monitoring Program 25
Groundwater Sampling 26
5 Surface Water 30
Objects of Surface Water Monitoring 30
Monitoring Program 30
Water Level Measurement 31
Flow Rate Measurement 31
Surface Water Sampling 34
6 Data Management 36
7 Interpretation and Analysis of Monitoring Results 39
Validity Check Visualization and Interpretation of Water Level Measurements 39
Hydrographs 39
Validity Check Visualization and Interpretation of Water Quality Measurements 43
Chemical Characterization of Groundwater 45
Evaluation of the Suitability of Waters for Different Uses 47
8 Reporting 49
9 Implementation of Monitoring Results into a Numerical Flow Model 52
Conception of a Numerical Model 52
Recommendations on water monitoring in open-pit coal-mine areas in Mongolia (RWM)
7
Basics 52
Goals of the Numerical Flow Model 52
Choosing the Method Solver and Software 53
Extent of the Model (Temporal and Spatial) 54
Implementation of Boundary Conditions 55
Implementation of Monitoring Results 55
Evaluation of Model Results 56
Reporting of Numerical Models 57
10 Audit Evaluation and Optimization of Monitoring 59
Specific Glossary 60
Annexes 62
I Forms 62
II Technical Details 66
III Supporting Websites 72
IV Mining Water in Mongolian Laws 73
V Regulations concerning Water Monitoring and Water Management in Mongolian
Standards (MNS) 75
Recommendations on water monitoring in open-pit coal-mine areas in Mongolia (RWM)
8
List of Figures
Figure 1 Major Laws Related to Minerals and Mining in Mongolia
Concerning the Environment 14
Figure 2 Hydrological Triangle and the Construction of Water Level
Lines 23
Figure 3 Different Types of Monitoring Wells 24
Figure 4 Examples of Water Level Gauges for Surface Water 31
Figure 5 Velocity Measurement 32
Figure 6 Example of a Triangular Weir 32
Figure 7 Example of Water Level Hydrographs 40
Figure 8 Classification by Piper Plots 47
Figure 9 WILCOX-Plot 48
Recommendations on water monitoring in open-pit coal-mine areas in Mongolia (RWM)
9
List of Tables
Table 1 Characteristics of the Aquifer System per Zone 17
Table 2 Characteristics and Hydraulic Boundary Conditions of the
Aquifer System per Zone 18
Table 3 Short Description of Different Types of Monitoring Wells 23
Table 4 Example for the Documentation of the Measurement of
Groundwater Levels 36
Table 5 Example of a Documentation of measurement point for the
Flow Rate of Surface Water 36
Table 6 Example for the documentation of the Water Sampling 37
Table 7 Overview of Hydraulic Conditions 42
Table 8 Conductivity for Different Types of Water 45
Table 9 Overview about the documentation of Hydrogeological Studies 49
Table 10 Examples for Suitable Software for Numerical Models 54
Recommendations on water monitoring in open-pit coal-mine areas in Mongolia (RWM)
10
Summary
Coal mining is a growing part of the Mongolian mining industry and supplies Mongolias most
prevalent energy source Therefore thorough longterm planning of mining projects is crucial
because of their impacts on the economic social and natural environment Additionally existing
coal mining practices are in need of practical recommendations for minimizing negative impacts
on the environment and for optimizing operating expenditures to fulfill legal commitments
The majority of coal-mining activities impact the water balances andor the quality of local
waters Dewatering the deposit is a requirement for mining in many cases which in the case of
open-pit coal mines draws down the groundwater level within a large area Furthermore
hydrochemical reactions and the use of water for operational processes can change chemical
characteristics of water The limitation of water resources in Mongolia requires that this
resource be protected As the effects of mining on water resources is unavoidable the
government of Mongolia is aware of these impacts and regulates the mining activities on
different levels Their aim is to minimize the negative environmental impacts of mining which
includes obligating mining companies to conduct sustainable water management
Monitoring and understanding the local water system provides a basis for a more sustainable
and efficient water management Mining companies are therefore required by law to integrate
water monitoring into their operations Numerous legal regulations partially based on
international standards exist However because detailed comprehensive specifications for the
interpretation documentation and reporting of monitoring results are not available at present
it is difficult for water authorities to audit and evaluate monitoring reports Furthermore mining
companies are unlikely to profit directly from improving their dewatering methods There are
however numerous benefits that can be realized through improvements and optimizations in
dewatering management which can be achieved through the evaluation of monitoring results
This document gives recommendations concerning the planning and technical realization of
water monitoring systems for open-pit coal mines while providing particular focus on the
interpretation documentation and reporting of monitoring results These recommendations are
based on the site visits to Mongolian open-pits mines as well as experiences from water
monitoring in lignite mining in Germany which have been adapted by considering the current
conditions in Mongolia
These recommendations are intended for managers at the operational level but they may also
be useful for environmental officials competent authorities non-government organizations
students and people with a general interest in the best practices associated with monitoring the
quality and quantity of ground and surface waters in and around open-pit coal mines The goal
of this work is to improve the mining industryrsquos environmental performance
Recommendations on water monitoring in open-pit coal-mine areas in Mongolia (RWM)
11
1 Forward
Water is one of the environmental resources that in addition to air and soil are impacted by
mining activities Mining activities can affect water quantity andor quality and can pose a risk
to water resources In many cases mining operations change the hydrological hydrogeological
and topographical characteristics of the mining areas Changes in surface runoff soil moisture
groundwater dynamic water quality and evapotranspiration can also persist long into the post-
mining phase
Sound management practices are a fundamental component of mining operations for mitigating
the impact on water balances and water quality for both surface and groundwater resources in a
responsible manner These practices are to be carried out throughout the life cycle of a mine as
well as post-closure on both a local and regional scale Water monitoring is a legal requirement
(see Fig 1) and is a part of negotiations with authorities for a mining permit
An accurate and reliable database is an essential component of many environmental
management plans The objectives of water monitoring programs include
Documentation of the base line situation for the mining project
Monitoring the water usage within the site This also provides companies with
opportunities for internal cost controlling and optimization regarding water reuse
Identification of sources and extent of pollution Actions to mitigate these risks may include
implementing a water treatment technology or further process control
Assessment of the impact of water reuse and management as well as the impact of the
mining activities on the regional water balance
Calibration and verification of numerical groundwater models against measured data for
improved prediction and assessment of future states
Improved planning for decommissioning and closure procedures regarding required actions
and financial provisions based on the numerical groundwater models
Establishment of environmental and water management plans based on impact and incident
monitoring for the mine and the surrounding region These plans facilitate decision making
and serve as an early warning system for indicating necessary preventive and remedial
measures in certain areas
Auditing of compliance with set standards and legislation and evaluation of the success of
implemented management actions
In this document water monitoring is defined as the recording documentation and
interpretation of water quantity and quality of surface and groundwater by mining companies
These recommendations do not go deep into the theoretical background of hydrology and
hydrogeology rather they are focused on the design implementation and operating procedures
of monitoring as well as the documentation and interpretation of data and conclusions for the
water management Particular emphasis is put on data interpretation
Recommendations on water monitoring in open-pit coal-mine areas in Mongolia (RWM)
12
2 Introduction
Mining and Water
The following recommendations are in regard to groundwater necessary groundwater drainage
in open pit coal mining and groundwater contact with surface waters
Classically the water table is lowered using preliminary drainage reducing the volume of the
groundwater body Changes in the groundwater composition such as an increase in the salt or
fluorine concentrations may result Dewatering of the pit itself follows which captures the
diffuse groundwater and precipitating water influx The pumped water is partially used as clean
process water such as in dust collection or as water for plants in re-cultivation areas and is
directed either into an artificial lake or into receiving waters In a few cases the receiving waters
need to be relocated in order to secure the open-pit
In the rear end of the open-pit mine as well as in post mining conditions another increase of the
groundwater table follows The interim introduction of air to the underground area causes
geochemical processes to be activated which result in mostly negative consequences for
groundwater quality
Goals and Outputs of Water Monitoring in Mining Areas
The objectives of the monitoring are
Monitoring the safety of the mining operations with regard to water
A priority of the mining operations is also to secure the safety of the mining employees An
influx of water can endanger the geotechnical stability of the pit Data for the groundwater
level and incoming water flow is the most important prerequisite for the implementation of
water drainage measures and their monitoring The behaviour of the ground and surface
water can be derived from the water monitoring Through the appropriate water drainage
measures the safety of the mine should be ensured
Provide necessary basics for the planning monitoring control and optimization of water
drainage measures
The mining of resources (coal) in open pits is only possible if the water table is lowered
From the results of the water monitoring conclusions can be drawn about how the
dewatering process can be carried out In most cases the inflowing water stream varies
with time for example with seasonal changes in such a way that the water drainage is
controlled For this control the results from monitoring are required Drainage is very cost-
intensive however with the analysis of the water monitoring data the drainage process can
be optimized so that the accompanying costs can be greatly reduced
The impacts of mining operations on the evironment are to be minimized as much as possible
That means that avoiding and minimizing consumption are the highest priorities The
contamination of water is to be prevented or minimized by implementing necessary
management measures or strategies One strategy is to reclaim and reuse contaminated water in
cases where total pollution prevention is not possible Treating water that cannot be reused is
Recommendations on water monitoring in open-pit coal-mine areas in Mongolia (RWM)
13
another example of a strategy for contamination prevention The discharge or disposal of water
is the lowest priority The implementation of these measures may accompany the monitoring
phase or may be carried out after reliable results are obtained
Fundamentally the following requirements should be fulfilled
A basis for sharing transparent information to the public exists including warnings for
health risks caused by water quality
Mining companies should be held responsible for the realization of water protection
directives
Authorities need to have confidence that the mining companies will work responsibly
The public and NGOs should have confidence in the work of authorities overseeing the
mining companies
Compliance with set standards and legislation such as Integrated Water Use licenses and
Environmental Management Plans etc is audited
The impacts of the mining operations and activities on the receiving water balance are
assessed
Various hydrogeological models for prediction and assessment are to be verified and
calibrated This includes planning the financial provisions and required actions
fordecommissioning and closure
The following details regarding water quantity are to be recorded for the understanding
determination and documentation of the hydraulic system groundwater levels flow direction
trends climate water balance water users infiltration into groundwater input into surface
water groundwater catchment and the interaction between ground and surface water Within
the framework of water balances the climatic water balance the quantity inflowing and
outflowing waters and an estimation of the influence of dewatering are to be taken into
consideration for the extraction of the impact of mining activity After the mining efforts are
complete a steady self-regulated water balance should be established and managed for the
purpose of minimizing water deficits that could arise through the evaporation of surface water
Within the topic of water quality the following key points are to be addressed
Qunatitative description of the original water quality before the influence of mining
activities
Quantitative estimation of the impact of mining on the quality of waters (ie the change in
water quality)
Understanding of the limits and standards for water discharge quantities and
concentrations as well as the establishment of accurate records for actual discharge values
in comparison to these limits
Determination of any existing local contaminations which were not caused by the current
mining activities
Estimation of hydrochemical processes both natural and those caused by mining and
Recommendations on water monitoring in open-pit coal-mine areas in Mongolia (RWM)
14
Quantitative estimation of the future changes and developments to the water quality
Legal Framework and Standards
In addition to applying for a water license the mine developers should include a proposal for the
monitoring program describing the scope of measurement points chemical analyses reporting
time intervals etc This proposal might be subject for approval and modification by the licensing
authority The final water license states the requirements for monitoring to be carried out
A summary of the Law of Mongolia on Water is given in Annex IV The major laws and
regulations governing the minerals mining and the accompanying environmental obligations
are depicted in Figure 1
Figure 1 Major Laws Related to Minerals and Mining in Mongolia Concerning the
Environment
(LMBV mbH)
Regulatory requirements for water monitoring are determined by the following two tasks in
most cases
monitoring the qualitative and quantitative influence of the measures (eg dewatering) on
the environment surrounding the mining operation and
monitoring the effectiveness of the dewatering process to guarantee the safety of the
operation
Requirements and secondary provisions are therefore individually determined by the type of
mining as well as the natural conditions of the catchment and other (potential) users
Recommendations on water monitoring in open-pit coal-mine areas in Mongolia (RWM)
15
Regulations and standards concerning water monitoring and water management are listed in
Annex V
Processes and Outputs of Water Monitoring
Water monitoring is to be conducted throughout the entire mining cycle which comprises the
following phases
Feasibility Study and Planning Phase including exploration (I)
Operational Phase (II)
Closure Phase Post-Mining Phase (III)
Post-Operation Phase (after rehabilitation hydraulic steady state) (IV)
The engineering and consulting services which are to be developed for water monitoring and
integrated water management during the mine cycle are listed below
Feasibility and Planning Phase (Before Mining)
An exact description of the initial unmodified state of the hydrological and hydrogeological
conditions is an integral component of monitoring This description should include
groundwater dynamic characteristics groundwater flow direction flow gradient seasonal
changes of groundwater levels
a full quanititative analysis of groundwater quality
surface water characteristics water levels flow rates seasonal variations and
a full quanititative analysis of surface water quality
Because it is impossible to reproduce the data describing the original state after mining has
commenced special attention needs to be devoted to gathering this invaluable information
beforehand The pre-mining monitoring phase should be cover 3 ndash 5 years to capture data over
varying weather and climate conditions The goal is to establish a local (unmodified) water
balance
Water management practices in this phase consist of
evaluation of different process designs in order to optimize the overall water balance in the
affected area including reuse and recovery strategies
identification of potential water sources
determination of water quantity and quality requirements based on the different process
designs
investigation of opportunities for water reuse and recovery
development of a strategic plan and measurable performance targets and
the combination of all points above into an integrated water management plan
Recommendations on water monitoring in open-pit coal-mine areas in Mongolia (RWM)
16
Here ldquoprocess designrdquo refers to the mining companiesrsquo individual proposed plans for
monitoring drainage water use and mining activities
Operational Phase
During the operational phase the impact of dewatering on the groundwater dynamic is to be
monitored This entails monitoring the scope of groundwater extraction the dimensions of the
catchment area and the drop in the water level (potential level) in the mine and the surrounding
areas and for example at drinking water wells nearby The flow rates and water levels of
surface waters may also be affected by dewatering procedures One possible outcome is that a
higher surface water flowrate into the aquifer causes the surface water levels or flow rates to
decrease Continuous measurement of all water input and output rates is therefore obligatory
The water balances are to be calculated for the operational phase taking different scenarios
with varying extraction rates into account
Changes of the water quality (eg acid mine drainage) may be caused by aeration of the
overburden due to the extraction of waters the infiltration of extracted waters into ground- or
surface waters Continuous sampling and analysis are important in detecting possible changes in
the water quality
Closure Phase and Post-Mining
The post-mining phase can be divided into two sub-phases the transient phase and the quasi-
steady-state phase The groundwater level (potential level) will rise after dewatering processes
are terminated While a stable water level has not yet been established in this transient phase
continuous measurements of ground- and surface water levels are necessary for monitoring
changes and planning required measures accordingly In the quasi-steady-state phase a stable
water table has again been established and depends therefore only on climate conditions
which affect the groundwater recharge rate The frequency and extent of water quantity
measurements may be successively reduced throughout the transient phase if the data shows
little to no fluctuation over time
In many cases changes in water quality after mining as well as after dewatering can be
observed This can often be attributed to chemical reactions between aerated tailings material
and water which might cause acid mine drainage in cases where sulfur-rich material is involved
Dissolution of minerals ie salt may also have an effect Special attention needs to be paid to
identifying potential reactions such as these in order to prevent or mitigate negative long-term
effects
Preliminary Characterization of the System
A first estimation of the geological hydrological and hydrogeological state provides a necessary
foundation for the conception of a water monitoring plan This first estimation relies on
generally available data mostly on the internet and existing studies or expert opinions over the
area being studied
Basic information about geology hydrology and hydrogeology exist for nearly each region of the
world While the spatial solution may be very large it is possible to obtain an overview of
important background knowledge such as sedimentary or hard rock aquifers existing surface
Recommendations on water monitoring in open-pit coal-mine areas in Mongolia (RWM)
17
waters and climate conditions without any exploration results in most cases The study of this
background information is important for the planning of further geological hydrological or
hydrogeological investigations The websites found in Annex III Table III-1 contain such
background information
In other cases results of former investigationsmdashsuch as for draining water wells former mines
or the exploration of other resources may exist The first step is searching for this information If
a mine already exists any available results reports or data should be analysed and interpreted
One foundation for a model of the hydraulic system is the characterization of the aquifer system
by zone A table like the one in Table 1 can be used to collect and organize relevant information
The following data can help to determine in which areaszones groundwater bodies are
significant their extent (of groundwater bodies) saturated thickness estimation of hydraulic
conductivity and porosity The type of confinement describes how well the upper aquifer is
protected from pollution sources at the surface
Table 1 Characteristics of the Aquifer System per Zone
A preliminary estimation of the original state of groundwater body can be described with
support of the following information for each defined zone
extent of the catchment basin
area specific precipitation annual average estimation of the climate water balance and
information of the groundwater recharge ([lskmsup2] [Mio msup3a])
total stored volume ([msup3msup2] [Mio msup3])
total abstraction rate of other users in the basin eg drinking water supply ([msup3d] [Mio
msup3a])
estimation of flow rates between ground- and surface water in-exfiltration ([msup3md]
[msup3d] [msup3a])
Groundwater quality results of chemical analyses
The impact of dewatering mines into the water cycle can provoke situations of conflict among
groundwater users An initial consideration of potential conflicts (in the frame of groundwater
quality and quantity) can be an important basis for planning monitoring programs and water
Zone
Aquifer System Characteristics ndash Preliminary Estimates
Type Confined
(upper layer)
Lateral
Extent
Total
Thickness
Hydraulic
Parameters
Water
Table
Source of
Information
1 Single
multi
layer
unconfined
semiconfined
confined
[km] amp
[] of
total
[m] kf ne no S So [meters
above
sea
level]
[meters
below
surface]
study report
map etc
2
hellip
N
Recommendations on water monitoring in open-pit coal-mine areas in Mongolia (RWM)
18
management systems for the mine The general reference monitoring network (river basin)
should reliability depict the groundwater situation on a regional scale This function covers the
natural state as well as the regional impacts of groundwater use and surface water
management The following table 2 lists information to describe potential conflict situations
Table 2 Characteristics and Hydraulic Boundary Conditions of the Aquifer System per Zone
In every case Quantity and Quality importance (nolittlemediumhigh) numbers (numbers
or nonfewsomemany) strengths (noneweakmediumstrong)
Conflict (historical actual and prospective) Zone 1 hellip Zone N
Surface water measures (rates of infiltration extraction
changes of the run hellip) influencing surface water outside of
the mine area
Quantity
nonelittlemediuma lot
Quality
nonelowmediumhigh
Surface water measures (rates of infiltration extraction
changes of the run hellip) influencing groundwater
same as above
Dewatering (groundwater abstraction rate) influencing
surface water
same as above
Dewatering (groundwater abstraction rate) influencing
groundwater bodies (outside mining area) eg water
supply wells irrigation wells springs groundwater
dependent eco-systems
nonefewsomemany
Mine rehabilitation measurements (irrigation dump-
rehabilitation) influencing ground- amp surface waters
Beside the data research the evaluation of the results the robust archiving of all data
documents and the development of a GIS-supported database are recommended see the
following box
Development of a GIS-supported Database
A suitable tool to develop show edit and analysis of spatial information is the software QGIS
(QGIS 38 Zanzibar) httpswwwqgisorgdesite (or httpswwwqgisorg) itrsquos for free a
WINDOWS MAX LINUX BSD and next time ANDROID
Implement all information about geology (eg spatial distribution of aquifers and aquicludes
fracture structures boreholes) hydrology (eg spatial distribution of groundwater recharge flows
surface water bodies) and the mine (eg current state and planned development of the mine
dewatering wells and monitoring wells)
For some information given information see Annex III table III-1
Continue filling the database permanently (eg with results of drillings results of the water
monitoring)
A further important tool is SAGA-GIS (freeware) httpsaga-gissourceforgeneten It can be
used eg for gridding (triangulation nearest neighbor inverse distance) access to different files
grid calculator (combine grids through user defined functions calculation of surface ndash
groundwater ndash distance) terrain analysis (eg flow path analyses) or vector tools like polygon
intersection contour lines from grid (mapping potential lines of groundwater table) simulation of
dynamic processes (erosion landscape development) statistical tools
Recommendations on water monitoring in open-pit coal-mine areas in Mongolia (RWM)
19
3 Definition of Monitoring Objects
The diversity of climates ecosystems land uses different water users and topography
influences the design of a monitoring program Thus the resulting monitoring program should
be tailored to meet a specific set of needs and expectations of the site and will need to consider
regional physical and social factors
Each of the management actions has unique objectives and monitoring requirements These
objectives should be clearly defined measurable and implementable The development of
environmental and water management plans identification of sources of pollution and
assessment of compliance with set standards are examples of typical management actions that
require the results of a monitoring program
Examples of items to be monitored are groundwater soil water surface waters or other
parameters of the water cycle like precipitation evapotranspiration and groundwater recharge
The development of environmental and water management plans may be executed as described
in the following box (some of them are taken from Fehler Verweisquelle konnte nicht
gefunden werden) Details are described below
Steps for the development of environmental and water management plans
Identification of climatic conditions
Identification and quantification of all flow rates within the mine
Developement of a mine water catchment model (balances)
Develop and implement appropriate water reclamation strategies
Evaluation of the quality and quantity of groundwater from existend monitoring wells and
borholes of potential pollution sources
Definition of key ndashindicators for potential pollutions and integrate it into the monitoring program
Definition of requirements on water quality and design methods for the water treatment
The climatic conditions (incl measured parameters) can be determined by interpretation of data
from existing meteorological observation stations or by installing weather stations (with ie rain
gauge thermometer anemometer evaporimeter) If the weather station density in the area of
interest is too low the installation of additional measuring stations might be necessary as
variables such as rainfall evaporation temperature humidity or wind may vary significantly
across short distances
The evaluation of groundwater quality and quantity is based on the results of measurements and
analysed samples from existing boreholes in the vicinity of potential pollution sources The
definition of key pollution indicators (eg sulphate conductivity for residue deposits nitrogen
and phosphorus for sewage plants fine coal particle from coal washing) is a part for the
development of a monitoring program Based on these results pollution sources of the mine can
Recommendations on water monitoring in open-pit coal-mine areas in Mongolia (RWM)
20
be identified (eg residue deposits domestic waste landfill point discharges sewage treatment
plants processing plants mine shaft area)
The identification and quantification of all (relevant) water flow rates within the mine is an
essential part of water monitoring This includes the extraction (pumping) rates discharge rates
and infiltration rates Knowledge of water sources and sinks (eg drinking water wells)
including rates outside the mine are a basis for understanding the hydraulic system
The identification of current and future water uses and determination of their water quality and
quantity requirements are parts of planning strategies Critical water qualityquantity
parameters for all considered water treatment options (in terms of absolute values and
variability) are to be defined Upon evaluation of monitored water quality and quantity
parameters the need for water treatment may be indicated
Recommendations on water monitoring in open-pit coal-mine areas in Mongolia (RWM)
21
4 Groundwater
Use of Existing Groundwater SamplingMeasurement Points
Existing groundwater measurement points should be integrated into the monitoring program
but first they need to be tested for their functionality For the initial evaluation of an existing
measuring point the following steps are to be followed as described in [24]
Research and Compilation of the Existing Base Data (coordinates elevation and construction
details) The following data are to be sourced andor measured bore log construction drawing
depth location of the filter section diameter drilling method and drilling year and results of
measurements and sampling
Preselection of Monitoring Wells
Does the observation well represent the point of interest
Is the diameter of the well tube gt 2rdquo If the tube is too small sampling and water level
measurements are not possible
Is a clear appropriation to the aquifer given
Is there free access to the observation well and a right of access given
To use an observation well the following questions should be answered positively
Inspection of existing monitoring wells
Evaluation of the outer condition and inner condition through the sounding of the bottom and the
water level are they in a suitable condition If both measurments arenrsquot possible the measuring
point is probably plugged meaning that the ability and means of unplugging should be tested
Is the well made of a suitable material (For water sampling wells PE-HD or PVC-U are
recommended because some other materials can influence the water quality or the tubes can be
influenced by compounds found in the water)
Is there consistency between researched data and investigation results
Is it possible to insert a dummy of the sampling pump or data diver
Infiltration Test for Monitoring wells The measuring point should be filled with water and time-
dependent water level measurements should be taken If the level of the filled water stays
constant for several hours there is no longer sufficient contact with the aquifer The measuring
point is possibly silted up or the filter crusted over The measuring point cannot be used for
monitoring
Short Pump Test at the measuring points for water contamination The groundwater should be
pumped out of the measuring point and the characteristic data (water level electrical
conductivity pH value temperature oxygen concentration etc) recorded
Recommendations on water monitoring in open-pit coal-mine areas in Mongolia (RWM)
22
Other criteria for the usability of the monitoring points are location and accessibility standard-
conforming installation as well as general physical condition installation and age of the
measuring point
For a comprehensive functionality test the processes listed in Annex II table II-2 is suggested
Planning of Positions for (New) Groundwater Observation Wells
The monitoring boreholes cannot be randomly located but should be placed at the most suitable
location to accurately collect the required data The groundwater flow directions vertical limits
of different aquifers depth of the groundwater table pollution source locations pollution
plumes etc all need to be considered If the measuring points are positioned at the wrong or
poorly established (eg too shallow) location the resulting data may lead to incorrect
interpretation and therefore to wrong decisions
The exact location of the monitoring points should be clearly marked on a map in such a way
that it can be found by an external party This may be achieved by GPS referencing or by using
GIS-software to produce a reliable map with suitable background information such as
topography infrastructure rivers or buildings
For determining locations of monitoring wells the following points need to be considered
Monitoring wells for all existing hydro-geologically relevant layers are needed In the case of a
multi-layer system a group of monitoring wells with different depths of the screens is usually
necessary
Therefore measurement points upstream and downstream of the mine are essential (outside of
groundwater lowering) Wells should also be placed at specific monitoring objects (eg
groundwater dependent eco-system infiltration points etc)
Access to all monitoring wells should always be possible
Wells should be arranged in a triangular manner as shown in Figure 2 to enable determination of
flow direction and construction of hydrogeological maps
Groundwater flow monitoring is very site specific because it is dependent on the local
geohydrology which may vary significantly from one area to another
Recommendations on water monitoring in open-pit coal-mine areas in Mongolia (RWM)
23
Figure 2 Hydrological Triangle and the Construction of Water Level Lines
Construction of New Groundwater Monitoring Wells
Types of Groundwater Monitoring Wells
Some different types of groundwater monitoring wells are shown in Figure 3 (taken from [16])
The type of groundwater monitoring well is given by the aquifer system and the task of the well
The following table 3 shows the different conditions and wells
Table 3 Short Description of Different Types of Monitoring Wells
Type Application Limits
Full-screen
monitoring wells
Single ndash layer ndash aquifer system screened
the whole aquifer thickness samples are
a mixture
Different layers will connect hydraulically
problem in case of different potential
levels or different quality types (incl
contamination) depth-dependet sampling
is possible with packer-systems only
Multi-screen
monitoring wells
depth-dependet sampling is more
possible than in case of a full screened
well packer systems are needed
Hydraulic contact of different layers is
possible in the well different level
measurements arenrsquot possible
Partial-screen
monitoring wells
Different measurements and samples of
one specific layer is possible (also in a
multi-layer-system)
Gives information about only one of the
layers
Group of partial-
screen monitoring
wells (different
boreholes)
multi-layer-system different
measurements (of different water or
pressure levels) and samples of the
specific layers are possible
relatively high costs (nearly same costs as
the bunch of Monitoring wells but much
more valuable than a bunch)
Bunch of partial-
screen monitoring
wells (single
borehole)
multi-layer-system different
measurements (of different water or
pressure levels) and samples of the
specific layers are possible
Relatively high costs an accurate
construction is very important to prevent
hydraulic transfers between the different
layers a large diameter borehole is
needed
Subterranean head
monitoring well
Location can be roads parking etc Possible destruction by transport
Recommendations on water monitoring in open-pit coal-mine areas in Mongolia (RWM)
24
Figure 3 Different Types of Monitoring Wells
Sources httpspublikationensachsendebdbartikel23156documents31473
Construction Details for Monitoring Wells
Groundwater measuring wells for the measurement of the potential level should be constructed
according to the specifications in Annex II Table II-1 (taken from LMBV mbH Merkblatt
Montanhydrologisches Monitoring 2019)
Recommendations on water monitoring in open-pit coal-mine areas in Mongolia (RWM)
25
Recommendation for a Multi-Layer System
Groundwater levels and water quality should be measured for each aquifer seperately in the case
of a multi-layer system
The different aquifers must not be connected eg at the construction of monitoring wells
Aquitards (aquicludes) should be sealed in boreholes by hydraulic barriers like clay seals
Contaminations of the water can be dispersed throughout different aquifers in the case of
connected layers The conditions of flow and pressure can be changed by connecting aquifers
Unregulated water outputs and chemical reactions between water and the rock matrix can be a
consequence of connected aquifers
The construction of measuring point bundles makes an effective hydraulic seal difficult In the case
of different aquifers the construction of a group of monitoring wells is recommended
Monitoring Program
Measuring borehole depths and the water levels in them should be a standard part of a
groundwater monitoring program Groundwater levels can be measured using electrical contact
tape float mechanism or pressure transducer The following factors must be considered in
groundwater flow topography streams stream flow fountains dams geology and excavations
The usual measurement frequency of the groundwater level and pressure is once per quarter
which allows seasonal changes to be detected However the frequency of required observation
can be different among sites or monitoring wells (eg depending on the dewatering wells) The
frequency of measurements depends on the type and position of the aquifer the groundwater
dynamic aquifer development and climate conditions
Frequency of measurement should be
Denser for shallow unconfined aquifers because the seasonal change of water level is higher than
for deeper and confined aquifers
Denser for rapid groundwater flow (high hydraulic gradient) than for slow groundwater flow
Denser for more intensive groundwater drawdown (eg short distance to the dewatering system)
than for less withdrawal and small drawdown (higher distance to dewatering wells)
Denser for more variable climatic conditions (incl high groundwater recharge) than for less
variable conditions (eg small seasonal changes)
The frequency should be adapted with respect to these conditions and interpretation of the
monitoring results
Measuring groundwater level is a technical procedure that should be undertaken by a suitably
qualified person The forms found in Annex I Table I-2 should be used for the documentation of
the measurements The sampling interval should be once per year (MarchApril) at a minimum
If two samplings per year are possible the months MarchApril (1st) and SeptemberOctober
(2nd) are recommended
Recommendations on water monitoring in open-pit coal-mine areas in Mongolia (RWM)
26
Groundwater Sampling
The MNS (ISO) 5667-X consisting of several parts is a guideline for taking water samples The
following text doesnrsquot replace this guideline but it should give some additional practical tips
Preparation of Sampling
The technical functionality should be checked according to the device-specific requirements The
calibration of all measuring tools is necessary before every monitoring campaign and during the
campaigns in the case of different water qualities This is very important because the
differences between the true value and the measured values are often surprisingly high
when non-calibrated gauges are used The calibration and handling are to be carried out
according to the manufacturer specifications before each use Calibration buffers are to be
checked regularly and if necessary are to be replaced as they have a limited shelf life The
calibration value also is to be corrected according to the temperature dependency of the buffer
solution used
Check-list for the suitability of the equipment
Is the pump-system complete This includes a motor-pump with control unit an electric power-
source (eg diesel generator) and stand pipes (tubes andor flexible tubes)
Are all measuring tools calibrated
Is the pump power (pumping head) sufficient
Are the hoses and the light cable long enough
Do the devices meet the quality requirements (purity cleanliness) of the sampling (also applies for
individual sampling)
Do the necessary filtration units comply with the Equipment Standard requirements
Are hoses and connectors reagents andor tools suitable for the task in proper working
condition
Are the flagons prepared Are necessary reagents for sample stabilization andor necessary
cooling elements available in sufficient numbers see Annex II Table II-6
Are the bottles individually labelled with sample number the monitoring well name or number
sampling date and sampling campaign name or number Important additional information should
be recorded the name of the sampler and the name the laboratory as well as the parameters to
analyse and type of chemical stabilization
Are the necessary cameras GPS master data sheets sampling protocols and cleaning equipment
on site and ready for service
Recommendations on water monitoring in open-pit coal-mine areas in Mongolia (RWM)
27
Sampling
The following steps are carried out during a groundwater sampling
(1) Well monitoring
Samples for water analyses can also be taken from the same groundwater measuring points
used for quantity monitoring Important is that the pipe can be navigated with a motor
pump Classic sampling motor pumps can be installed in measuring points with two-inch
inner diameters (ID) In case of very deep monitoring wells the pipes can become
misaligned in such a way that the pump can get stuck and break off Before installing a
pump at least one test with a light cable or a dummy should be completed
(2) Local Findings Observations at the Sampling Point and the Surrounding Vicinity
Check of the information on the master data sheet for completeness
Check the condition and serviceability of the sampling point for visible damage safety
(closeability) cleanliness corrosion of metal parts and other changes
Check for and document any deposits and incrustations eg precipitations biota (algae
mold animals) sediment etc
Check and document any mixed waters mixture of water of different origin inflow of
foreign water overflows
In principle gross deficiencies in drinking water supply systems (also in the case of
drinking water purposes used house wells) should be communicated to the operator
Document changes since the last sampling eg agricultural activities earthwork or
construction sedimentation conspicuous surface use visible contamination sources
Record any other abnormalities eg weathering during sampling air temperature
precipitation degree of cloudiness or sun exposure nuisance dust
(3) Measurement of Groundwater Level before Pumping
The groundwater level describes a part of the actual hydraulic situation The results of the
sample analyses should be interpreted with respect to the hydraulic situation (eg high or
low groundwater level) The measurement should continue during the whole pumping
duration
(4) Installation of the Pump
The pump should be installed more than one meter above the screen of the monitoring well
(5) Pumping and Purging
For pumping it is important to maintain a continuous moderate pumping rate
Discontinuous pumping can provoke turbulence in the water column of the monitoring well
and if the pumping rate is too high solid substances outside from screen can enter into the
monitoring well The pumping rate can also be optimized by adapting to the yield of the
well A continuous water level should also be maintained since the water level must not
Recommendations on water monitoring in open-pit coal-mine areas in Mongolia (RWM)
28
decrease below the pump and should be at least 1 m above the screen The inflow of oxygen
is to be avoided
Purging is the process of removing stagnant water from a well immediately prior to
sampling causing its replacement by groundwater which is representative of actual aquifer
conditions from adjacent formations To determine when a well has been adequately
purged field investigators should monitor (at a minimum) the temperature the pH specific
conductance and the turbidity of the groundwater removed during purging In the case of
permanent monitoring wells they should observe and record the volume of water removed
The Purge Volume Determination (VP) is carried out by calculating the hydraulic criteria
and by measuring the chemical criteria see Annex II Table II-4
The water should then be released a long distance away of the monitoring well (minimum
five meters) after pumping
(6) On-site Parameter Measuring
Organoleptic (sensory) data include the qualitative recording of color turbidity smell and
sediment The tests should be carried out in a transparent vessel with a volume of at least
one liter against a white and black background Abnormalities of the groundwater can
already be detected through the optical or odoriferous findings This data can therefore
also be used to assess the measuring point or quality of sampling Dregs from another
monitoring well in a pore aquifer can indicate damage to the measuring point
The parameters water temperature electric conductivity (in μScm) dissolved oxygen
reduction-oxidation potential and pH-value are measured by gauges The use of multi cells
is recommended Otherwise the use of vessels is possible The sensors should not be used
in the same vessel The volume of the vessels should be greater than one liter The measured
value must first be read and logged if the display remains stable
(7) Sampling
It is particularly important that wells be sampled as soon as possible after purging If
adequate volume is available upon completion of purging the well is to be sampled
immediately If not sampling should occur as soon as adequate water volume has
recovered
(i) Charging the Sample Flagons see also Annex II Table II-6
When sampling with a medium or large mobile pump a bypass with adjustable flow off of
the sampling line can be used to fill the sample vessels The bypass should be installed in
front of the on-line measuring instrument and the line should be purged briefly to remove
fluid standing in the line before the sample is taken
When filling the sample bottles are to be completely and appropriately labeled All sample
containers not pre-filled with stabilizing reagent are to be rinsed out at least twice before
filling This is done by filling the container approximately 25 with sample water placing
on the lid shaking vigorously and emptying Before closing the sample containers the
closures are also to be rinsed thoroughly Filling of the water samples must be completed
Recommendations on water monitoring in open-pit coal-mine areas in Mongolia (RWM)
29
without bubbles and avoiding turbulence To achieve this the filling tube should be kept
submersed in the sample Fill the bottles completely and let them overflow several times
before closing the bottle The groundwater sample thus enters the sample vessel without
contact with the atmosphere
For vessels containing stabilizers the hose must not come into contact with the contents of
the bottle and with the stabilizer The filling process is to be interrupted at about two-thirds
of the bottle volume in order to distribute the stabilizing agent homogeneously throughout
the sample by gently swirling the closed vessel Then the bottle can be completely filled
(ii) Filtration of Samples
For most parameters analyses are taken using unfiltrated samples However some
parameters like DOC or metal concentration first require filtration of the water sample If
the samples are to be filtered disposable filters with a pore size of 045 μm and disposable
syringes are used The filters should be rinsed with at least 20 ml of sample water A
membrane filtration device can also be used on site Filtration is to completed before
conservationcooling in every case
(8) Conservation and Storage of the Samples
Information as to the conservation and storage of samples is given in Table 9 Without
stabilization the concentration of some dissolved elements can change during storage or
transportation (eg precipitation of Fe-II as FE-III) causing errors in the laboratory
analyses of the solutes
(9) Transport and Storage of Samples
The temperature during transport and storage should be kept between 2degC and 5degC A cooling
box with cool pads can be used while freezing of samples is to be avoided
InfoBox Water Sampling
Failures in and carelessness during sampling conservation storage and transport of a water
sample can change the quality of a sample and change the analysed results An (expensive) water
analysis becomes useless because of this
The parameters temperature electrical conductivity pH value dissolved oxygen content and
redox potential as well as organoleptic parameters must be measured or recorded and
documented on site Results of these measurements in the laboratory do not represent the
original water quality
Proof of compliance with hydraulic and quality criteria should be part of the sampling
documentation
The original documentation of the analysis results should be stored securely and long-lasting
For additional information see
httpswwwepagovsitesproductionfiles2015-06documentsGroundwater-Samplingpdf
Recommendations on water monitoring in open-pit coal-mine areas in Mongolia (RWM)
30
5 Surface Water
Objects of Surface Water Monitoring
Surface water monitoring includes measurements of volumic flow rates and water levels in the
mine and the surrounding area This is necessary to determine the interaction between surface
and groundwater
Surface water monitoring includes the important water flow rates in the mine and the
distribution of pumped water (eg dusk fixation irrigation re-infiltration or output)
In the area directly surrounding the mine the following measurements are part of the surface
water monitoring
Delivery rate of a spring comparing the delivery rate and dewatering of the mine can
give information about the impact of mine dewatering to the groundwater and local
water balances
Water levels of artificial and natural lakes hydrographs of the lake water level give
information about its seasonal changes and the impact of mine dewatering
Input and output rates intofrom lakes important for the complete estimation of local
water balances and the local water cycle
Precipitation and evaporation to and from lakes important for the complete estimation
of local water balances and the local water cycle
Rates of surface fluids at different points (eg in front of and behind the mine) possible
impacts (higher ex-filtration rates from fluids into the underground near a dewatered
mine gives information about hydraulic interactions
Input and output rates intofrom fluids lakes important for the complete estimation of
local water balances and the local water cycle
Monitoring Program
Flow rates of fluids change rapidly with the climate conditions (precipitation snow smelting)
That is why times for measurement canrsquot be predicted exactly The frequency should be fixed
individually and iterative with the results Measurements under different conditions such as
during dry phase or after precipitation can give the range of possible rates
For a lake water sampling is recommended at the different phases of the circulation of the water
body This means four times per year spring circulation begin and end of the summer-
stagnation and during autumn circulation
Recommendations on water monitoring in open-pit coal-mine areas in Mongolia (RWM)
31
Water Level Measurement
The level of surface water bodies is monitored by staff gauges (water level gauges) recording
gauges shaft encoders water level sensing systems or pressure probes with data loggers and
possibly remote data transmission In order to avoid the influence of waves and wind all
registering water level gauges are to be installed in a dip tube It is important to regularly check
whether there is hydraulic contact between the inside and outside of the tube
Figure 4 Examples of Water Level Gauges for Surface Water
Basis data for each water level gauge include the coordinates (x y) and the level of the reference
point (z m asl) see Chapter 6
Flow Rate Measurement
Two groups of flows are to be differentiated the gravity flow in partially filled pipes channels
and streams and the pressurized flow in discharge pipes A second differentiation is possible
between direct and non-direct measurements Flow rate measurements are just one part of
water monitoring in mining areas Therefore only a small part of the wide range of methods is
presented in these recommendations
Gravity Flow
Area-Velocity Technique Non-Direct Flow Rate Measurement
Float Method
The most common technique consists of calculating or estimating respectively the cross-
sectional area and measuring the flow velocity The latter can be determined by different
methods such as the float method By observing a floating object on the surface of a water body
Recommendations on water monitoring in open-pit coal-mine areas in Mongolia (RWM)
32
the flow velocity at the surface can be measured The equation v asymp 085 middot v13 yields an
estimate for the average flow velocity [(Gunston 1998)] The measurement of the velocity is
more sophisticated for defined areas
Flow Meter Method
Quantification of the flow rate requires (a) the determination of the flow-profile and (b)
measurement of the flow velocity using an inductive flow meter over the entire flow cross-
section Based on the flow velocities (vi) in the individual profile segments the flow rate is then
calculated by
Q = A∙ v
The measurement profile is recorded using measuring slats or the folding rule The bar is placed
above the water on both sides of the embankment as shown in Figure 5 With the folding rule
the depth of the water is registrated over the entire cross profile Each section of the profile can
then be assigned a flow rate
Figure 5 Velocity Measurement
Non-direct Flow Rate Measurement Using a Weir
Estimation of flow rate using water level and physical relations for defined profiles are described in
Annex II Table II-3
Figure 6 Example of a Triangular Weir
Recommendations on water monitoring in open-pit coal-mine areas in Mongolia (RWM)
33
Direct Measurement by the Bucket-Method
A cheap and simple alternative is to use the bucket method If the discharge of the surface water
can be captured in bucket for X units of time and the captured volume determined the flow rate
can be calculated rather easily However automation is not possible in this case Use of this
method is only valid if the bucket or vessel is large enough to collect the whole volume over the
measurement time period
Dilution Methods
By adding a known concentration of tracer (eg salt or dye) into a stream and measuring its
dilution after it has been fully mixed with water the discharge can then be calculated using the
following formula
Special attention has to be paid to the selection of an appropriate tracer It should not react with
any substances present in the water and should not be taken up by sediment or organisms
Commonly sodium chloride salt or rhodamine dye is used Note that for certain tracer
substances special permits by the local environmental agencies might be needed
Manningrsquos Equation
The Manning Method can be used for open channels and partially filled pipes for non-
pressurized fluids in gravity flow This method is widely used for flow measurements because it
is easy to use after a few initial measurements have been made and it provides fairly reliable
site discharge estimates
Official requirements state that the channel should have a uniform cross section slope and
roughness within the vicinity of the measurement In addition the pipe (or channel) should be at
least 30 meters long and should not have any rapids falls or backup flow For ecological
purposes an eight-meter-long channel or less would probably be sufficient as long as the water
is flowing evenly
The equation requires obtaining values for the roughness of the channel (determined from
standard tables) the cross-sectional area of discharge flow the hydraulic radius (cross-sectional
area divided by the wetted perimeter) and the slope of the gradient Since the slope and
roughness are constants once they are known future flow estimates can be calculated by simply
measuring the depth of the discharge in the channel or pipe
= middot minus minus
Q stream discharge
q tracer injection rate
C1 tracer concentration in injection
C2 final concentration of tracer in the stream
C0 background tracer concentration in stream
Recommendations on water monitoring in open-pit coal-mine areas in Mongolia (RWM)
34
Estimation of the flow rate using water level and physical relations for defined profiles are given
in Annex II Table II-3
Flow Measurement in Open Channels
By employing level measurement over specially designed and constructed open flow channels it
is possible to calculate flow rate as a function of fluid depth In many cases fluid flow around a
mine is by means of open channels and the flow measuring techniques developed for piped flow
are thus unsuitable The requirements in terms of channel shape and applicable equations are
also discussed as these are necessary in the conversion of a level measurement to a calculated
flow rate
Pressurized Flow
Pressurized flow can be measured by magnetic flow meters or ultrasonic flowmeters for
example Magnetic flow meters require a conductive fluid and a non-conductive pipe liner The
electrodes must not corrode in contact with the process fluid some magnetic flowmeters have
auxiliary transducers installed to clean the electrodes in place The applied magnetic field is
pulsed which allows the flowmeter to cancel out the effect of stray voltage in the piping system
Surface Water Sampling
Sampling points of surface water are given by the water management system of the mine This
can include water bodies in the open-pit collection deposits of water water storage facilities
treatment facilities for water re-use springs channels or other flows
Surface water sampling is regulated by MNS (ISO) 5667-42001 Water Quality Sampling Part 4
Guidance on sampling procedure of natural lake and reservoir
In case no information indicating a specific water quality level is available at the beginning of the
monitoring program a case-specific set of analyses should be conducted This procedure should
be applied to all initial measurements until the scope can be better defined Examples of possible
sets of analyses for the ldquo0-measurementsrdquo are shown in Annex II Table II-5
Some of the steps are similar to groundwater sampling and are described in Chapter 4 The
others are described below
Local Findings
Observations concerning the following characteristics should be recorded for the area at and
directly around the sampling point This information may explain results of water analyses or
may provide information about existing chemical processes
Checklist of local findings at surface water sampling locations
Check the information in the master data sheet
Reduction spots darkening on the underside of stones as an indication of poor oxygen availability
and consequent reduction processes
Oil film (visual control) foaming
Recommendations on water monitoring in open-pit coal-mine areas in Mongolia (RWM)
35
water level runoff retention
frozen water table
changes since the last sampling eg agricultural activities earthworks or construction
sedimentation conspicuous surface use visible contamination changes in banks foreign matter
sewage foam discharges discharges
other abnormalities water level development substrate sediment
biocenoses eg waterfowls
weather during sampling eg air temperature precipitation degree of cloudiness or sun exposure
Taking Samples
In the case of surface water local representatives should be careful not to detect wastewater
plumes dead water zones or returbulence Rather the site to be sampled should be where the
largest mass transport is to be expected or where the flow rate is about 1 ms when sampling
from the embankment On the one hand for safety reasons entering the water body should be
avoided as far as possible in order to prevent sedimentation
Water samples from running waters should be taken as single samples using scooping devices
The appropriate sampling equipment is to be thoroughly rinsed with the water to be sampled
several times in advance When sampling bridges and the like care should be taken that no
contaminants get into the scoop When removing the water bottom should not be touched with
the scooping device in order to prevent the sediment being stirred up Likewise the sampling of
floating materials should be avoided
The sampler should be submerged in the upper third of the water body depth (or if necessary
approximately 5-30 cm below the surface of the water) The opening of the ladle or sampling
vessel is held in the direction of flow If several scooping processes are required to fill the
sampling containers the homogeneity of the sample must be ensured
In the case of lakes individual samples from several depth stages are to be taken at the
measuring points for the analysis of the chemical parameters depending on the different
seasonal circulation-stagnation-phases
Recommendations on water monitoring in open-pit coal-mine areas in Mongolia (RWM)
36
6 Data Management
Complete comprehensive and transparent documentation of data is one of the most important
parts of the water monitoring All data about the drilling the construction of monitoring wells
surveying water level and discharge measurements sampling and laboratory results are to be
documented The following tables show the main information for the different processes
Additional information and forms are given in the Annex I
Table 4 Example for the Documentation of the Measurement of Groundwater Levels
No
Name
Coordinate
Easting
Coordinate
Northing
level
of the
head
of the
tube
level
of the
top of
the
screen
level of
the
bottom
of the
screen
bottom
of the
monito-
ring
well
date of the
measure-
ment
depth of
the
water
table
water
level
press-
ure
level
m
asl
m
asl m asl m asl
[m
below
top of
the
tube]
m asl
44-XY-4 10833120 49975110 11041 10840 10800 10780 01042010 1420 108992
44-XY-4 10833120 49975110 11041 10840 10800 10780 29092010 1450 108962
hellip
44-XY-4 10833120 49975110 11041 10840 10800 10780 29032017 1910 108502
The required data for each groundwater monitoring well is given in Annex I Table I-1 The
water level measurements for surface water bodies can be documented in the same way Table 5
contains the required information for the measurement for water levels and flow rates as well
as for surface water sampling The table is to be adapted to the type of surface water
Table 5 Example of a Documentation of measurement point for the Flow Rate of Surface
Water
Item Unit lake
pond Fluid Remark Example
Details about the measurement point
ID (station identification number) x x Unique code system (for whole
Mongolia)
Monitoring ID Number x x Specification for the Monitoring
Program for the mine xy
Type of measurement point x x Example weir staff gauge vane
Type of measured data x x Flow rate
Owner of the station x x Mine basin ministryhellip
Name of the water body or fluid x x
Location
Aimag townvillage location name
location description
x x Link to the photos of location
East Coordinates (m) x x Mongolian grid system
North Coordinates (m) x x Mongolian grid system
Recommendations on water monitoring in open-pit coal-mine areas in Mongolia (RWM)
37
Item Unit lake
pond Fluid Remark Example
Elevation m asl x x Terrain elevation of the monitoring
station type of elevation
determination eg single instr
GPS differential GPS estimation
from topographical maps
Elevation of the reference elevation
for the measurement point
m asl x x
Bottom of water body m asl x
Water level or flow rate measurement
Water level m asl x x
Average depth of the fluidwater body [m] x x
Average width of the fluidwater body [m] x x
Flow rate ls
msup3min
x
Measurement range [m] [L ∙
s-1 msup3 ∙
min-1]
Frequency of Measurement 1Month 1Quarter
Average Velocity Curve exists x yesno
Sampling
Type of sampler x x Boat vessel
Program of sampling x x Spring circulation beginend
summer stagnation autumn
circulation
Depth(s) of the sample m x
Date of (last) sampling x x
Contamination yesno x x
Frequency of sampling x x
Remarks x x (no access possible fluid is dry
lake is frozen)
Documentation for groundwater sampling is given in Table 6 Annex I Table I-2 contains a form
for the documentation of the groundwater sample
Table 6 Example for the documentation of the Water Sampling
Item Unit Remark
Name
ID (station identification Number) Unique code system (for whole Mongolia)
Monitoring ID Number Specification for the Monitoring Program for
the mine xy
IDName of the borehole
Type of the measurement point Example weir staff gauge
Type of measured data Flow rate water level
Owner of the station Mine basin ministryhellip
Location
Aimag townvillage location name
location description
Link to the photos of location
East Coordinates (m) Mongolian grid system
North coordinates (m) Mongolian grid system
Elevation m asl Terrain elevation of the Monitoring station
type of elevation determination eg single
instr GPS differential GPS estimation from
topographical maps
Recommendations on water monitoring in open-pit coal-mine areas in Mongolia (RWM)
38
Item Unit Remark
Elevation of the reference elevation for the
measurement point
m asl
Depth of the monitoring well m depth below terrain elevation
Depth of the screen(s) m asl
Connected Aquifer
Sampling
Sampling date
Static water level m asl before purging
Static water level m asl after purging
Type of purging pump (specification example grundfos MP1)
gathering pallet
Depth of pump setting
Time Startend duration Min
Discharge during sampling l ∙ min-1
Sampling device
Field measurements
EC microScm
mScm
pH
Redox mV
O2 mg∙l-1
T degC
Color
Turbidity NTU
verbal
description
odor fresh putrid septic medicinal sulfur
chemical
Sample treatments Filtration method mesh size
Sample conservation Cooling to +4degC freezing to -20degC
storage Locationdurationconditions of storage
Designationdescription of samples Example
Sample-ID 1240I
Well-ID xc-03-1482
Date 20170915
Additions HCO3
Analysis of Fe-II
Laboratory Nameanalysis date lab identification No
Analytical methods standards
Analysis results entered Namedatefile
Remark Documentation
The high costs of monitoring require that the data be used for multiple purposes Therefore all
results of the monitoring (water level flow rate water analysis) must be clearly assignable to a
date and a location (x y z) as well as to the water body or aquifer and archiving the data has to
be robust Because mining is a very dynamic process lost or unassignable monitoring data is not
reproducible and therefore not replaceable
Recommendations on water monitoring in open-pit coal-mine areas in Mongolia (RWM)
39
7 Interpretation and Analysis of Monitoring Results
Validity Check Visualization and Interpretation of Water Level
Measurements
Validity Check
The purpose of the validity check is to compare with previously collected values (hydrographs)
with the construction details of the observation well Extreme values conflicting values and
outliers can be caused by incorrect metering of the water depth (reading error) Comparison
with former values would show a difference in this case The difference is an even value in case
of a reading error and the data can be adjusted in some cases Secondly the development of
mines and dumps may require a cut of the observation well If a change in the reference point
(head of the observation well) is not taken into account the hydrographs show a step of the
values These values have to be adjusted by the difference of the elevation of the well head
Finally if the groundwater level is below the screen the measured water level shows the water
in the sump pipe of the observation well That means the well is dry and the values are invalid
The quality control of the data is of enormous importance Flawed data can lead to wrong
conclusions (for example concerning mine safety) and thus to wrong decisions or implemented
measures
Visualization of Monitoring Results
Hydrographs
Hydrographs are plotted values of the water level versus time The water level is shown as
meters above sea level (masl) The plot can be created using basic software (eg MS Office)
Time-related changes of the water level can be detected by graphing It may be useful to plot the
water levels together with the graph of the climate water balance or graphs of groundwater
abstraction (dewatering of the mine) The measured values can be used directly
If there is a density difference of the liquid medium (eg very high salinity of the groundwater) a
conversaion into fresh water levels is necessary using the following formula
hfresh = HSW middot (ρsρf)
where hfresh is the equivalent fresh water column [m] HSW is the length of saline water column
above reference level [m] ps is the density of saline water [kgdmsup3] and ρf is the density of fresh
water [kgdmsup3] Flow rates or water levels of surface water can be plotted as hydrographs as
well
Example Interpretation of Hydrographs
The following figure (Figure 7) shows some hydrographs of different groundwater monitoring wells
around a dewatered coal mine together with the values of the climate water balance (CWB) The
values of the groundwater level are shown on the left axis and the values of the CWB on the right
axis
Recommendations on water monitoring in open-pit coal-mine areas in Mongolia (RWM)
40
As shown in the Figure 7 the water level of monitoring well 1 is stable The value of March 1996 is
an error (outlier) which should be corrected Values during the time between June 2015 and
November 2016 are missing Monitoring Well 1 is screened in the upper aquifer in our case That
means this upper aquifer is protected from dewatering of the mine by natural hydraulic barriers
(aquiclude)
However the graphs of the monitoring wells 2 and 3 show a significant drawdown (gt30 m) since
2003 These monitoring wells represent the deeper aquifer which was dewatered The
hydrograph of the monitoring well 3 has been stable since March 2008 At this point there was no
more groundwater in this well The groundwater table was either deeper than the monitoring well
or deeper than the screen of this well The values since March 2008 are not useable
Figure 7 Example of Water Level Hydrographs
Monitoring wells 4 and 5 are located at a large distance from the mine (gt5km) The water level is
directly influenced by the groundwater recharge specifically by the CWB The highly positive CWB
during 20102011 and 2013 caused higher groundwater levels The hydrograph of well 5 shows a
small drawdown in 2014 and 2015 The aquifer near well 5 could be affected by mine dewatering
Mapping of Contour Lines
A water-level contour map is a common tool used by hydrogeologists to indicate groundwater
flow directions and the hydraulic gradient as well as to test the continuum approach From field
measurements of static water levels in wells a water level contour map can be constructed
Anomalously high or low water levels and jagged or discontinuous contours may be evidence
that the continuum approach is not legitimate Water flow directions aid in the delineation of the
source water protection area
Recommendations on water monitoring in open-pit coal-mine areas in Mongolia (RWM)
41
If there is hydraulic contact between surface and groundwater the surface water bodies are to
be considered in the contour maps This applies for standing water bodies and for flowing water
Knowledge of surface water levels is required The basis of the water body added to an
estimated water level can be used in the case of flows The potential level (pressure level) is
used in the case of a confined aquifer It is also standard to use special software (eg SAGA GIS
see below) for designing contour lines A manual design of these lines however is also possible
Mapping the Depths to the Water Table
Mapping the depth of the water table is important for (a) regions with different groundwater
users with wells that are screened at different depths (b) when a hydraulic interaction between
surface water and groundwater occurs or (c) in regions with small distances between terrain
surface and the groundwater table Levels of the terrain levels of groundwater and special
software (eg SAGA GIS see below) are required for creating a map of groundwater depths
Mapping of Table Differences
Maps of groundwater level differences are a suitable tool for showing the impact of mine-
dewatering on the aquifer The groundwater levels in the monitoring wells at different dates are
the base for mapping these differences
Mapping of Monitoring Results
Contour lines describing groundwater level or potential are a suitable tool to plot the dynamics of
groundwater results are the direction of groundwater flow and the hydraulic gradient
Mapping contour lines should be done for the state before dewatering activities starts and for
each year afterward (measured in the same month)
Groundwater level difference maps are a suitable tool to illustrate the effect of mine dewatering
on the aquifers
Suitable reference states for mapping of table differences are (i) state before dewatering activities
and current state (ii) state of previous year and current state (iii) current state and prognosis
state (based on the calculated state from the model) (iv) state before dewatering activities and
prognosis state (v) state before dewatering activities and after dewatering including completed
groundwater increase
If different data sets (measurements model results) are used possible deviations must be
explained and discussed
A suitable software (freeware) is SAGA-GIS httpsaga-gissourceforgeneten
Interpretation of Monitoring Results (Water Level Flow Rates)
Establishing a hypothesis can support the interpretation of monitoring results For the
monitoring of mine dewatering such hypotheses can be the different drawdowns of the
groundwater level or a decrease in the flow rates of fluids because of higher infiltration rates
The climate situation during the monitoring period also is to be focus and part of the
interpretation Changes of groundwater level can be caused by different rates of groundwater
recharge as a consequence of different climate conditions
Recommendations on water monitoring in open-pit coal-mine areas in Mongolia (RWM)
42
Table 7 contains different types of hydraulic conditions The quantification of these conditions
can aid the interpretation of the monitoring results
Table 7 Overview of Hydraulic Conditions
Hydraulic Conditions Method for Quantifying
Precipitation Online-Data from climate stations measurement of
precipitation
Evaporation Online-Data from climate stations measurement of
evaporation from water bodies
Development of the mine Areas of claim (extensions date) Interpretation and
reports of monitoring results should include the
development of the mine during the monitoring period
The spatial development of the dewatering (construction of
well galleries) is to be documented
Development of the dewatering system of the
mine (well galleries pumping from ponds)
Rate well-specific (location depth) breaks of dewatering
begin and end of dewatering
Use of the water in the mine (process water
eg dust fixation irrigation)
Rates (Specific for location and date)
Water abstraction outside of the mine by
other users (eg water supply for livestock)
Rates (Specific for location and date)
Water infiltration (into the Aquifer) or input
(into lakes or ponds)
Rates (Specific for location and date)
Rates of fluids around of the mine Measurement of flow rates
Groundwater levels in and around of the mine Monitoring groundwater designation of water divides
Evaluation of the Hydraulic System
The hydraulic system of the mine is to be described and quantified Parameters for the hydraulic
system include water in- and outputs dewatering precipitation and evaporation among others
Water balances should then be established
The measurement estimation or calculation of parameters in the water cycle allows the
determination of the CWB The following equation describes a local water cycle
0 = P ndash ETP plusmn Qinout plusmn ∆S
where P is precipitation ETP is evapotranspiration Qinout are runoff recharge in- and outputs
(eg from wells) and ∆S is the change of storage volume The difference of precipitation and
evapotranspiration is called climate water balance (CWB)
CWB = P ndash ETP
The equation of the water cycle can be written as
0 = CWB plusmn Qinout plusmn ∆S
Dimension of the Catchment Area (Subterranean Basin)
The dimension of the catchment area is given by the following equation
Acatch = QOut GWR
where Acatch is the area of the catchment area [msup2] QOut the volumetric dewatering rate of the
mine [msup3s] and GWR is the groundwater recharge [msup3(msup2 s)]
Recommendations on water monitoring in open-pit coal-mine areas in Mongolia (RWM)
43
Validity Check Visualization and Interpretation of Water Quality
Measurements
1 Assessment of Outliers
Issue Validity check of analyses results
Goal Outlier change of water quality sampling or analysis errors
Data Requirements Time series of chemical parameters including electrical conductivity pH
and plotted concentration vs date of sampling
Method for the Interpretation of Deviations in a Time Series of Water Analysis Results
The quality of waters can naturally change over time or can be impacted by human activities
Concentration differences lower than 25 are natural in most cases If the difference is greater
than 25 the following causes are possible (a) a serious change of water quality based on
human activities (b) an error in the sampling or transport of samples or (c) an error in the
laboratory analysis
Methods for Comparison with Other Parameters
Comparison with other parameters such as electrical conductivity and pH-value gives two
possible results 1) In the case where the other parameter values have also changed that means
the change of water quality is real or the sampling was erroneous or 2) If one of the other
parameters didnrsquot change the analysis of the sample may have been erroneous The search for
errors can be identified by conducting laboratory quality assurance checks and repeating the
analyses for a retained sample If the results of the repeated analysis show the same result the
sampling is to be repeated a third time The water of the sample is to be analysed at two
different laboratories If these results yield the same concentration there has been a change in
the water quality
Result This method can estimate if a measured value (an outlier) is correct
indicating a change of quality of water or if the result is an error of
sampling or analyzation
Source DGFZ eV Dresdener Grundwasserforschungszentrum eV (GERMAN)
2 Exclusion of Ion Concentrations
Issue Validity check of analysis results
Goal Plausibility checks of analysis results
Data requirements Analysis results of O2 Fe2+ Mn2+ Ca2+ Mg2+ NO2- NH4- H2S NO3- pH-
value (doesnrsquot need to be complete)
Recommendations on water monitoring in open-pit coal-mine areas in Mongolia (RWM)
44
Method
The following concentrations exclude each other
O2 gt 5 mgl exclusion of Fe2+ Mn2+ NO2- NH4- gt 005 mgl H2S gt001 mgl
Fe2+ gt 02 mgl exclusion of NO3- gt 20 mgl
Mn2+ gt 02 mgl exclusion NO3- gt 20 mgl
H2S gt 01 mgl exclusion Fe2+ gt 01 mgl and Mn2+ gt 02 mgl
80 gt pH gt 55 exclusion of Ca2+ Mg2+ gt 1 mmoll
Result This method estimates if analysis results are correct
3 Charge Balance Error (CBE)
Issue Validity check of analysis results
Goal Check of analyses results or completeness of analyses
Data requirements Analysis results of all anions and cations with relevant concentrations
expressed in mol(eq)L
Method
One fundamental law of nature is that aqueous solutions (like water) are electrically neutral
This means that in real solutions the total sum of all the positive charges (cations) must equal
the total sum of all negative charges (anions)
Charge Balance sumcations = sumanions
Analytical errors andor unanalyzed constituents cause electrical imbalances One way to
quantify this imbalance is the charge balance error in percent
CBE = (sumcationsminussumanions)(sumcations+∣sumanions∣)times100
Interpretation of the Charge Balance Error (CBE)
CBE gt plusmn 5 analysis is incomplete (major ions are not measured) or incorrect the analyses are to
be repeated including those of additional (relevant) ions
negative CBE higher concentration of anions than of cations (not all relevant cations are analyzed)
positive CBE higher concentration of cations than of anions (not all relevant anions are analyzed)
using unfiltered samples that contain particulate matter which dissolve upon addition of acid (for
preservation purposes)
A suitable software-tool (freeware) for calculating CBE is
httpswwwlenntechcomcalculatorsaccuracyaccuracy-water-analysishtm
Recommendations on water monitoring in open-pit coal-mine areas in Mongolia (RWM)
45
4 Additional Validity Checks
Correlation of redundant parameters are to be given eg pH value or electrical
conductivity field measurement with laboratory measurement
Correlation of related parameters should be given eg electrical conductivity and
concentration of sulphate
The hydrochemical plausibility should be checked pH and concentration of the metal
ions
Chemical Characterization of Groundwater
The composition of the water is determined by the natural geogenic environment of the water
sources and chemical or biochemical reactions Knowing the sources of abstracted waters is
important for understanding the hydraulic system Possible sources may include precipitation
waters infiltrated waters from surface water bodies infiltrated waste water recharged
groundwater or fossil groundwater The following section shows some possibilities for
visualization of analyzed data from water samples This visualization allows the classification of
different water samples based on sources A special tool is the analysis and interpretation of
isotopes An estimation of the age of groundwater is possible with the results of this analysis For
more information on this topic consult the corresponding literature
1 Classification of the Water Sample by the Electrical Conductivity
Data Requirements Measured electrical conductivity
Method
Comparison of the measured values of the electrical conductivity with values from Table 8
Table 8 Conductivity for Different Types of Water
Type of Water Electrical Conductivity [microScm]
ldquopurerdquo water 0055
Distilled water lt3
Precipitation water 5 - 100
(natural uncontaminated) groundwater 100 ndash 1900
Drinking water 150 - 800
Mineral water 150 - 2000
Sea water (salt water) Round about 50 000
Result Information about the source of a water sample classification of different samples
Recommendations on water monitoring in open-pit coal-mine areas in Mongolia (RWM)
46
Graphical Tool for the Interpretation of Chemical Analyzes
The use of graphical tools can help illustrate the different types of water Different types of water
can indicate different sources (eg catchment areas different aquifers fossil groundwater)
1 Schoeller Plot
Issue Visualization and classification of water analysis results
Goal Classification of different water samples into groups
Data requirements Analysis results of anions and cations of diverse samples expressed in
mol(eq)L (advantage analyses can be incomplete)
Method
Major ion analyses (in milliequivalents per liter) can be plotted semi-logarithmically to indicate
different hydrochemical water types This plot is called Schoeller-plot The plot has the
advantages that unlike trilinear plots incomplete analyses can be used and real parameter
concentrations are displayed
Result Information as to whether there are the same or different (different
sources) types of water for different samples
2 Piperrsquos Trilinear Plot
Issue Visualization of results from water analyses classification typecast
Source GW-Chart (Freeware
httpswaterusgsgovnrpgwsoftwareGW_ChartGW_Charthtml)
Goal Classification of different water samples into groups
Data requirements complete() concentrations of Calcium Sodium Potassium Magnesium
Chloride Sulfate Hydrogen Carbonate and Carbonate expressed in
mol(eq)L
Carbonate can be calculated by the software itself using the water
temperature The TDS (total dissolved solids) are also respected in the
calculation The TDS-value can estimate by 05 ∙ electrical conductivity
Method
To see the changes in groundwater chemistry at different locations and the extent of water rock
interaction data for the ionic composition of the water samples were plotted for both the time
periods using a Piper Trilinear diagram as shown in Figure 8 Piper Diagrams are broadly used
in hydrogeology as they illustrate the hydro-chemical characteristics of groundwater by
representing the percentage of anions and cations (in meq L-1) in separate triangular diagrams
Geochemically-similar waters are clustered in clearly defined areas which indicates water
mixing phenomena precipitation dissolution etc The piper diagram can also be plotted with
the help of software
Recommendations on water monitoring in open-pit coal-mine areas in Mongolia (RWM)
47
Figure 8 Classification by Piper Plots
Source httpswwwhatarilabscom
Result Information about the type and source of water for different samples
Presentation of Data using the Valjashko Diagram
A system for the representation and classification of groundwater based on the ratio of the mean
ions and their hypothethesized dissolved salts on the basis of the publication by Valjashko
(1961) offers information on the origin of the water Compared to other methods (eg PIPER
(1944) or FURTAK amp LANGGUTH (1967)) the system allows for a better description and genetic
interpretation of the chemistry of groundwater The waters can be characterized in their genetic
position in the infiltration cycle and the influence of human activity or salt waters can be
identified
Evaluation of the Suitability of Waters for Different Uses
Drinking Water
The main aim of the water analyses is to evaluate the suitability of water for various uses such
as domestic use irrigation or industrial use In the last few decades there has been a
tremendous increase in the demand for fresh water due to rapid growth of population and the
accelerated pace of industrialization
Irrigation Water
The use of the pumped water for irrigation can be an important possibility for sustainable water
management However potential salinization of the soil limits the use of waters for irrigation
Recommendations on water monitoring in open-pit coal-mine areas in Mongolia (RWM)
48
The following interpretation gives information about the potential hazard of salinization
through salinity or sodium concentration of waters
The sodium adsorption ratio (SAR) is an irrigation-water-quality parameter used in the
management of sodium-affected soils It is an indicator of the suitability of water for use in
agricultural irrigation as determined from the concentrations of the main alkaline and earth
alkaline cations present in the water It is also a standard diagnostic parameter for the sodicity
hazard of a soil as determined from the analysis of pore waters extracted from the soil
Sodium Adsorption Ratio (SAR) Criterion
Sodium absorption ratio is the measurement of sodium content relative to calcium and
magnesium in the soil-water medium and influences soil properties and plant growth The total
soluble salt content of irrigation water is generally measured by determining its electrical
conductivity (EC) reported in microsiemens per centimeter The individual classes are defined
as EC lt 250 microScm ndash Low-Salinity-Water 250 lt EC lt 750 microScm ndash Medium-salinity-water 750 lt
EC lt 2250 microScm ndash high-salinity water and EC gt 2250 microScm ndash very high-salinity water
The sodium or alkali hazard in the use of water for irrigation is determined by the absolute and
relative concentration of cations and is expressed as the sodium adsorption ratio (SAR) The
following formula is used to calculate SAR
= $amp()
where the sodium calcium and magnesium concentrations are expressed in mmolL
The results are shown as a WILCOX-Plot as shown in Figure 9
Figure 9 WILCOX-Plot
Ions in the equation are expressed in milliequivalent per liter (meql) The salinity hazard was
between medium and high for most samples One sample indicated a very high hazard The
sodium hazard was low for the most samples and moderate for one sample
Recommendations on water monitoring in open-pit coal-mine areas in Mongolia (RWM)
49
8 Reporting
The documentation of hydrogeological studies (eg monitoring results) should contain the topics
outlined in the following checklist
Checklist Contents of Hydrogeological Studies
General information about mine company consulting company scoping area period of validity
Description of the study area
Description of monitoring program
Hydrogeological calculations (eg water balances prognoses scenarios)
Interpretation of results
Conclusions and additional measurements if necessary
Details about the several topics are given in Table 9
Table 9 Overview about the documentation of Hydrogeological Studies
Monitoring Results Hydrogeological Calculation
Chapter Content
1 General information
Name amp address of the mining company (incl respons person)
Name amp address of the consulting company name of the responsible specialist
Title of the document
Objective of the study
Name of the mining area and location of the mine (AIMAG coordinates)
Scoping area
Validity period
Name amp signature of the author (expert specialist)
2 Details of the Report
Contents
References
Objectives of the reportstudy
3 Description of the Study
Area
Morphology
Geology
HydrologyHydrography
HydrologyMeteorology
Mining activities (eg development of dewatering)
More details see below the Table 9
4 Water Monitoring
(Quality amp Quantity)
Description of the monitoring
Results of the monitoring
Documentation (values eg in tables Annex I Chapter 6)
Visualization of the results (hydrographs)
More details see below the Table 9
5 Hydrogeological
Calculations
Hydrogeological Calculation
Description of the calculation methodology modeling
Determination Calculation water cycle parameters surface runoff hypodermic
runoff storage change groundwater recharge etc
Identification of the water balances
More details see below the Table 9
6 Interpretation of the
Results of (a) Monitoring
Description of direct mining activities and the impact to groundwater levels surface
water levels or flow rates and groundwater recharge
Recommendations on water monitoring in open-pit coal-mine areas in Mongolia (RWM)
50
Chapter Content
or (b) Description of non-direct impacts of mining activities (eg water quality geotechnical
stability)
Evaluation of the impacts regarding mining safety water supply systems (wells)
groundwater reserve surface waters (rivers) and protected landscape areas
7 Conclusions -
Requested
Measurements
Groundwater drawdown andor groundwater barrage
Wells galleries of wells (measured and planned) pumping rates number and location
of wells placement the filters and advancement of dewatering
Dewatering of the open mine groundwater input into the open mine sealing walls
reach of groundwater drawdown (groundwater cone) water levels in mine dumps
potential level of the confined groundwater (below coal layer) flow rate and influx
via slopes
Surface water (dewatering change of riverbeds)
Change of flow rates artificial lakes etc
mining water cycle (water use for irrigation water fixation of dust)
water quality
Description of realization of requirements from the side of the authorities
Technical measures to minimize impact of mining dewatering and water output eg
treatment of the waters storage of the contaminated water
Adaption and development of water monitoring in future
The description of the study area includes the existing information and data
Morphology
Information about the morphology should contain data of the altitude and the terrain structure
The terrain structure is an indicator for glacial structures the surface runoff or the mining
activities If airborne laser scan data is available it can be plotted to give an overview about the
morphology
Geology
An overview of the geological situation gives a ldquostandard sectionrdquo It contains all existing layers
of the study area The different layers should be described in regard to their distribution
thickness and their characteristics (eg hydraulic characteristics) The layers can be classified
by geological processes or characteristics The different aquifers should be defined Fault zones
and fault lines should be described by their position characteristics and possible hydraulic
impact The visualization can be realised by mapping (distribution of layers) and cross sections
Hydrology
Information about meteorology should include time series averages and extreme values for
precipitation and evaporation This data is a base for calculating water balances The
interpretation of time series can give reasons behind eg of changes of water levels or flow rates
The base data of the meteorological measurement station (position altitude and distance from
study area) should be given
The hydrographic information includes the name of surface waters (flows standing water
bodies) data of measurement (time series of water levels andor flow rates) information about
the measurement stations with the basic values like (average) high- low- and mean- water or
flowrate) and existing uses of waters incl existing legal This basis information are important to
estimate possible impacts of mine activities to the surface waters
Recommendations on water monitoring in open-pit coal-mine areas in Mongolia (RWM)
51
Mining Activities
The aim is to give short information about the development of the mine eg of the explorations
dewatering system (time series of pumping rates depth of water levels) development of dumps
etc This information is important for explaining and understanding the monitoring results (eg
changes of groundwater levels) An overview of the results of former studies should be also
implemented
Description of the Water Monitoring
Components of the documentation of water monitoring are given in the following checklist
Checklist Documentation of Water Monitoring in Reports
Mapping all measurement points (monitoring wells measurement points for flow rates and water
level in surface waters and at the dewatering system of the mine)
Master data about groundwater monitoring wells screened aquifer
Time interval for level measurements and sampling
Tables containing the results of water level measurements and water sampling flow rates
Hydrographs for water levels and selected parameters of water quality
Mapping results ( Chapter 7)
Hydrogeological Calculations
Documentation of Hydrogeological Calculations should contain
the aims of calculation (eg development of the groundwater depression cone over the previous
years reduced volume of the groundwater body prognosis of pumping rates or water balances)
the methods used (eg analytical equations see Chapter 7 numerical models)
the parameters used (see Chapter 9 in the case of modelling)
results (eg mapping)
Recommendations on water monitoring in open-pit coal-mine areas in Mongolia (RWM)
52
9 Implementation of Monitoring Results into a Numerical
Flow Model
Conception of a Numerical Model
Basics
Prediction models of the quantity and impact of the mine dewatering are the basis for technical
and financial planning Knowledge of the impact of dewatering to the aquifer to water balances
and to the surface water bodies is important for the water authority and other users of the
water
Numerical models can be a suitable tool for calculation of scenarios and the future state of the
groundwater dynamic The validity of this calculation is given by the quality of the model The
model quality depends on the information about geology hydrogeology climate conditions
hydraulic boundary conditions (eg in-output flow rates) and the density and the validity of
monitoring results
Some general notes about numerical flow models
The results of a numerical model are not an alternative for the monitoring results
Every numerical model is made for a special task and for a specific region
Every model is designed using the individual experience of the modeller
The information about the design and the quality of the model is to take into consideration if
model results are be reviewed
Modelling is an iterative process that includes definition of goals grid construction and
assignment of properties and boundary conditions steady state and transient calibration
validation of calibrations predictive simulations and sensitivity analysis
Goals of the Numerical Flow Model
There are three major issues related to groundwater in mining projects that need to be
addressed 1) mine dewatering requirements 2) stability of slopes and 3) environmental
impacts on groundwater levels and on groundwater quality during mining and post-mining
periods
Knowing what we want from the model or the model results is one of the first steps of model
development Some common goals of numerical models include
Simulation of the current hydraulic processes (groundwater abstraction dewatering
progress of the mine infiltration from surface waters water input into a surface water)
Calculation of the current (maybe unknown) impacts of mine dewatering to the
groundwater table (groundwater bodies) other groundwater users Outputs are the
calculated change of the water volume over time of an aquifer maps of the differences of
the groundwater level or calculated hydrographs for (monitoring) wells
Recommendations on water monitoring in open-pit coal-mine areas in Mongolia (RWM)
53
Calculated prediction of future state passive inflow to the mine (both in space and time)
active dewatering options (if required) which means necessary abstraction rates
number of wells well-galleries drawdown cone around the mine during the progress of
the mine and the dewatering systems flow direction for determination of the potential
path lines of substance transport flow velocity impact to other groundwater users pore
pressures as input for sloperoof stability analysis (dumps)
Calculation of a post-mining state eg groundwater levels after dewatering water level
in the residual pit (artificial lake)
Calculation of scenerios impact of the design of the dewatering system eg number and
location of dewatering wells required pumping rate for each well ( optimization of
number of wells)
A numerical flow model can be the basis for a simple geochemical mixing model or a
more comprehensive solute transport model to predict quality of water discharge during
the mining or pit-lake water chemistry for post-mining conditions
The addition of further tasks and goals after establishing the numerical model can cause a lot of problems in most cases
Choosing the Method Solver and Software
Numerical groundwater flow models are based on groundwater flow equations which are
differential equations that can often be solved only by approximate methods using a numerical
analysis The most common numerical solutions are the finite difference method and the finite
element method An often-used software for finite difference method is MODFLOW (commercial
and free ware see Table 10) The commercial software FEFLOW (DHI Wasy
httpswwwmikepoweredbydhicomproductsfeflow) is known for the finite element
method
Finite Difference Method or Finite Element Method - Both methods are suitable for calculation
of dewatering in mining The advantages and disadvantages of each numerical method are not
discussed here Each mine and each dewatering system are unique That some general basics are
to be respected as described below
General Notes
3D-Model transient flow groundwater generally flows into open mines three-dimensionally and
variably through time the groundwater system (Aquifer Aquiclude) can only be characterized by a
3D-Model in the most cases
Dewatered mines are characterized by high hydraulic gradients The discritization and solver
should be adapted to meet these conditions
Rewetting option A suitable water balance (eg the required pumping rate) can calculate if a dry
(dewatered) model cell can be rewetted in the numerical process
Modeling of mine dewatering isnlsquot focused on the unsaturated (vadoze) zone in the most cases
A small selection of suitable software for numerical models can be found in the following table
Recommendations on water monitoring in open-pit coal-mine areas in Mongolia (RWM)
54
Table 10 Examples for Suitable Software for Numerical Models
Name Source Description
MODFLOW 2005
httpswwwusgsgovsoftwaremodflow-2005-usgs-three-
dimensional-finite-difference-ground-water-model
three-dimensional-finite-difference-
ground-water-model
MODFLOW OWHM
httpswaterusgsgovogwmodflow-owhm
Borden Carter Gaur Anju Singh Chabungbam R 2016 Water
Resource Software Application Overview and Review World Bank
Washington DC copy World Bank
httpsopenknowledgeworldbankorghandle1098624762 License CC BY 30 IGO
(httphdlhandlenet1098624762)
MODFLOW OWHM (bases on
Modflow-2005 Unification of all
developed tools)
MODFLOW 6
httpswwwusgsgovsoftwaremodflow-6-usgs-modular-
hydrologic-model
Hanson RT Boyce SE Schmid Wolfgang Hughes JD Mehl
SM Leake SA Maddock Thomas III and Niswonger RG
2014 One-Water Hydrologic Flow Model (MODFLOW-OWHM)
US Geological Survey Techniques and Methods 6-A51 120 p
httpdxdoiorg103133tm6A51
MODFLOW6 Parallel developement
to Modflow 2005 Modflow 6 donrsquot
replace Modflow 2005
ModelMuse-A graphical user interface for MODFLOW-2005
httpswwwusgsgovsoftwaremodelmuse-a-graphical-user-
interface-groundwater-models
Winston RB 2009 and PHAST US Geological Survey
Techniques and Methods 6-A29 52 p
MODELMUSE is an open source tool
and recommended for pre- amp
postprocessing (all versions of
Modflow)
FLOWPY
httpsmodflowpygithubioflopydocintroductionhtml
Bakker M Post V Langevin C D Hughes J D White J T
Starn J J and Fienen M N 2016 Scripting MODFLOW Model
Development Using Python and FloPy Groundwater v 54 p 733ndash
739 doi101111gwat12413
FLOWPY is an open source tool and
recommended as additional tool to
modflow (Python-based)
FREEWAT
httpwwwfreewateusoftware-0
Rossetto R De Filippis G Borsi I Foglia L Cannata M Criollo
R Vaacutezquez-Suntildeeacute E 2018 Integrating free and open source tools
and distributed modelling codes in GIS environment for data-
based groundwater management Environmental Modelling amp
Software 107210-230
for pre- und postprocessing in
combination with QGIS FREEWAT
(not for all types of MODFLOW)
Extent of the Model (Temporal and Spatial)
Most of the processes involved are time-related That means a transient flow model is to be
established in the most cases The time before any mining activity should be the ldquostartrdquo of the
simulation period The ldquoendrdquo is defined by the tasks and goals of the model For example after
dewatering the groundwater levels increase and a post-mining quasi-steady-state (only
seasonal impacts to the groundwater level) will be reached a few decades after dewatering The
maximal time increments are given by the modeled processes (change of time related boundary
conditions period of calculation) Time increments of days (between 1 d to 30 d) are
recommended for this type of modeling The duration of the calculation is proportional to the
number of time increments
Recommendations on water monitoring in open-pit coal-mine areas in Mongolia (RWM)
55
Tips for Design of the Horizontal Extent of the Model
The processes to be simulated in connection with the mine must not be influenced by the external
boundary conditions (which are to be defined at the borders of the model)
A simple rule of practice is it is better that the model area is too large than too small
Modeling the whole (subterranean) catchment area The external boundary conditions of the
model are no-flow conditions (groundwater divides) given by hydraulic barriers
Bordering the model at known stable water levels like surface water levels of lakes or known
groundwater levels both outside of the maxima of the range of dewatering
If the subterranean catchment area is completely unknown and if there are no stable known
boundary conditions an estimation of the model extent is possible using the groundwater
recharge and the abstraction rate of dewatering The rate of dewatering gives the necessary size
of the catchment area The model area is to be larger than this because the spatial direction is
unknown
The vertical extension includes all relevant layers aquifers and aquicludes
The cell size is smaller (eg 1m ndash 100 m) in the focussed area and larger outside of it (gt100 m) in
the most cases
Implementation of Boundary Conditions
Hydraulic boundary conditions are water divide dewatering and infiltration wells surface
water bodies (lakes ponds) or streams with hydraulic contact to the aquifer groundwater
recharge and water levels (outside of the focused area) For detailed information see eg
httpswaterusgsgovnrpgwsoftwareModelMuseHelpindexhtmlboundaryconditions5ht
m
Implementation of Monitoring Results
The results of the water monitoring will be used for the calibration and validation of the
numerical model The model calibration means the minimization of the difference between
calculated and measured water levels (potential levels flow rates of fluids) by modification of
the model structure or its parametrization and modification of the boundary conditions
The quality of a numerical model can be shown by
comparing measured and calculated groundwater levels potential levels flow rates (eg
using a scatter-plot)
calculating the statistical parameters (eg mean error root mean square deviation
normalized root mean square deviation)
comparing the measured and calculated hydrographs and
mapping the difference between measured and calculated values
Recommendations on water monitoring in open-pit coal-mine areas in Mongolia (RWM)
56
Evaluation of Model Results
An evaluation of model results can be supported by answering the following questions of the
three parts a) quality of the used database b) validity and results of calibration and c)
plausibility of modeling
Questions for the Evaluation of Model Results
Are there validity databases for the description of the hydrogeological structure and
characteristics the hydraulic boundary conditions and monitoring results
Are the monitoring results clearly allocable in space and time
Are the relevant processes identified and quantified
Are the implemented boundary conditions plausible and sufficiently unrestrictive Are the
boundary conditions chosen to have a minimal impact on key model outcomes How is this
ascertained
Are all available types of observations (water levels flow rates) used for calibration
Is the model calibrated to steady-state pre-mining and transient (initial mine dewatering pump
tests etc) conditions
Are there graphs showing modeled and observed hydrographs at an appropriate scale Follow the
calculated values in the observed trend
Are calibration statistics reported and illustrated in a reasonable manner Is the model sufficiently
calibrated (spatially temporally) Are the calibrated parameters plausible Are the water volumes
and fluxes in the water balance realistic
Are the model predictions designed in a manner that meets the model objectives
Are the scenarios defined in accordance with the model objectives and confidence level
classification Are the pumping stresses similar in magnitude to those of the calibrated model Are
well losses accounted for when estimating maximum pumping rates per well If not Is there
reference made to the associated reduction in model confidence Are the pumping rates assigned
in the input files equal to the modeled pumping rates
Are there any anomalous boundary fluxes due to superposition of head dependent sinks (eg
evapotranspiration) on head dependent boundary cells (Type 1 or 3 boundary conditions) Does
predicted seepage to or from a river exceed measured or expected river flow
Is some qualitative or quantitative measure of uncertainty associated with the prediction reported
together with the prediction Are the sources of uncertainty discussed
Recommendations on water monitoring in open-pit coal-mine areas in Mongolia (RWM)
57
Reporting of Numerical Models
Numerical modeling is an iterative process over month to years Often only the modelers use the
numerical model with all details of in- and output data It isnrsquot possible to check all databases in
the implemented kind (input data files) for example That means the documentation of the
model is the most important way to control model assumptions and model results and to
evaluate the model That means all input data assumptions and results of the calculation
should be containing in the documentation of the model
Checklist Must-haves of Documentation Concerning Numerical Flow Model and Model Results
The model objectives and model confidence level classification have to been clearly stated Are the
objectives satisfied
Definition of space and period (eg flow of groundwater of the aquifers XY within the catchment
area of mine Z from pre-mining until post-mining state)
Description of the conceptional model Is the conceptual model consistent with objectives and
confidence level classification
Description and citation of the used data base and information base
Description of the design of the structure model discritizaion of the space cell size numbers of
model layers parametrization (eg mappimg of the implemented values hydraulic conductivity
the storage coefficient effective and total porosity anisotropy)
Description of the design of boundary conditions discretication of time mapping of the used
types of boundary conditions (including groundwater recharge) and detailed description (time
constant time variable values) mapping of the initial heads of water level (groundwater surface
water)
Information about the method used (finite difference method finite elemnte method) the
software and the solver
Description of the calibration process (a) analysis of the sensitive parameters (calc hydrographs
by different rates of groundwater recharge or hydraulic conductivity anisotropy of hydraulic
parameters) (b) measurement values for the comparision with modeled results (measured
groundwater levels of monitoring wells measured flow rates) (c) results of calibration (differences
between calculated and observed values and its distribution in space and time verbal discussion
of these results (causes of differences is the calibration satisfactory)
Results of the validation
Description of the basics (eg boundary conditions) for the calculation of prognosis andor
scenarios (eg change the number or pumping rates of dewatering wells)
Results of the calculation (mapping) and verbal discussion Are the results plausible Evaluation of
the uncertinity Is the model fit for its purpose
Further useful information about numerical flow modeling documentation of models and evaluation
of models are given at the following pages (in English language)
Recommendations on water monitoring in open-pit coal-mine areas in Mongolia (RWM)
58
About Modeling
ftpftpccrsnrcangccaadEMSAnitaGW_articlesgrwater_modelpdf
Documentation of Models
httpspubsusgsgovtm06a55tm6a55pdf
Evaluation of Models
httpspubsusgsgovsir20045038PDFSIR20045038part2pdf
httpsconsultationdplhwagovaucommunications14d86ef9supporting_documentsCompaniontomod
ellingguidelinespdf
Recommendations on water monitoring in open-pit coal-mine areas in Mongolia (RWM)
59
10 Audit Evaluation and Optimization of Monitoring
Auditing the monitoring program means evaluating and reviewing the methods used in the
monitoring program and identifying additional information required It is important to
recognize that the environmental and water management requirements and driving forces
change from time to time and methods of monitoring improve Monitoring programs must
therefore be updatedmodifiedimproved regularly to reflect these changes or modifications in
practices and procedures The rationalization of the monitoring program is also required to
ensure that the program remains effective and properly focused and that it does not entail
excessive costs
The evaluation of a monitoring program includes
Training of the staff
Certification (Staff laboratory techniques of measurement)
Accreditation of the laboratory
Standardizations (proceedings compliance management)
ISO 14001
Recommendations on water monitoring in open-pit coal-mine areas in Mongolia (RWM)
60
Specific Glossary
Unconfined Aquifer An aquifer which is not overlain by any confining layer but has a
confining layer at its bottom is called unconfined aquifer It is normally exposed to the
atmosphere and its upper portion is partly saturated with water The upper surface of
saturation is called the water table which is under atmospheric pressure Therefore this aquifer
is also called phreatic aquifer
Perched Aquifer This is a special case of an unconfined aquifer This type of aquifer occurs
when an impervious or relatively impervious layer of limited area in the form of a lens is located
in the water-bearing unconfined aquifer The water storage created above the lens is the
perched aquifer and its top layer is called perched water table
Confined Aquifer Also called artesian aquifer this is a type of aquifer overlain as well as
underlain by confining layers The water within the aquifer is therefore held under pressure It
is also sometimes called pressure aquifer If the aquifer has high outcrop laterally then the
ground surface there will have a positive hydrostatic pressure creating the conditions for a
flowing well Water from such well comes to the surface without pumping The imaginary level
up to which the water will rise is called piezometric surface
Leaky Aquifer In nature truly confined aquifers are rare because the confining layers are not
completely impervious An aquifer that is overlain or underlain by a semi-pervious layer
(aquitard) through which vertical leakage takes place due to head difference is called leaky
aquifer or semi-confined aquifer The permeability of the semi-confining layer is usually very
small compared to the permeability of the main aquifer Thus the water which seeps vertically
through the semi-confining layer is diverted internally to proceed horizontally in the main
aquifer
FracturedFissured Rock Aquifer Fractured rock aquifers (bedrock crystalline rock hard
rock and basement) have limited storage capability and transports water along planar breaks
Aquitard A body of rock or stratum of sediment that retards but does not prevent the flow of
groundwater from one aquifer to another
Aquiclude (or aquifuge) is a solid impermeable area underlying or overlying an aquifer
Porosity In soil mechanics and hydrology porosity is defined as the ratio of volume of voids to
the total volume of porous medium The significance of the porosity is that it gives the idea of
water storage capacity in the aquifer Qualitatively porosity less than 5 is considered small
between 5 and 20 as medium and above 20 is considered large
Hydraulic Conductivity is a property of soils and rocks that describes the ease with which a
fluid (usually water) can move through pore spaces or fractures It depends on the intrinsic
permeability of the material the degree of saturation and on the density and viscosity of the
fluid Saturated hydraulic conductivity Ksat describes water movement through saturated media
By definition hydraulic conductivity is the ratio of velocity to hydraulic gradient indicating
permeability of porous media
Recommendations on water monitoring in open-pit coal-mine areas in Mongolia (RWM)
61
The water cycle also known as the hydrologic cycle or the hydrological cycle describes the
continuous movement of water on above and below the surface of the Earth
Groundwater recharge also known as deep drainage or deep percolation is a hydrologic
process where water moves downward from surface water to groundwater Recharge is the
primary method through which water enters an aquifer This process usually occurs in the
vadose zone below plant roots and is often expressed as a flux to the water table surface
Groundwater recharge also encompasses water moving away from the water table further into
the saturated zone Recharge occurs both naturally (through the water cycle) and through
anthropogenic processes (ie artificial groundwater recharge) where rainwater and or
reclaimed water is routed to the subsurface
Climatic Water Balance (CWB) The climatic water balance (CWB) is defined as the difference
between precipitation depth and the depth of potential evapotranspiration at a given site during
a certain time period
Groundwater Monitoring Wells (GWM) Groundwater management point groundwater
observation well both are common synonyms
Water Quantity in this document means water level flow rates and water volume
Groundwater surface Groundwater table pressure table (in case of confined groundwater) are
common synonyms
Recommendations on water monitoring in open-pit coal-mine areas in Mongolia (RWM)
62
Annexes
I Forms
Table I-1 Example for the Documentation of a Monitoring Well
UNIT Example 1 Example 2 Example 3
Number Name of the measurement
point -- 4500123 HY-45-2018 000789 (73L)
ID (well borehole)
Owner of the well
Coordinate Northing -- 5712345 5745678 5756789
Coordinate Easting -- 5412345 5445678 5456789
Location (Aimag village mine)
Elevation (terrain level) -- 10757 11229 10944
Elevation of well head [m asl] 10761 11237 10951
Name of the hydraulic connected
aquifer -- 100 300 111
Water level pressure level [m asl] 10635 10960 10804
Diameter of the casing [mm] 115 115 115
Drilling Method dry Dry dry
Diameter of the borehole [mm] 324 324 324
Bottom of the monitoring well [m asl] 10181 10330 10200
Screen (top ndash bottom) [m asl] 10221 ndash 10201
Material of
construction
blank casing sump
pipe -- PVC-U PE-HD PE-HD
tube of the screen -- PVC-U PE-HD EWD
Length of the
casing
blank casing [m] 540 300 150
tube of the screen [m] 20 20 30
sump pipe [m] 20 10 20
Thickness of filter sand filter gravel [m] 30 30 40
Recommendations on water monitoring in open-pit coal-mine areas in Mongolia (RWM)
63
annulus sand barrier (between
filter sand and clay
seal)
[m] 10 10 10
clay seal [m] 30 100 30
filling sand [m] 510 190 120
Data logger yesno --
Water sampling yesno
Remarks Examples no water no
access observation well destroyed
maintenance repair necessary
Recommendations on water monitoring in open-pit coal-mine areas in Mongolia (RWM)
64
Table I-2 Form for a Water Sample (source LMBV mbH Merkblatt Montanhydrologisches
Monitoring 2019)
JOURNAL for Sampling of Groundwater
Date Time Sample-Ndeg
Object Client
NameNumber
of Moni well
Other Ndeg
Position Easting Northing
Type of Moni Well Single Well
Bundle of Monitoring wells
(please mark) group Construction Material
Measurm point [m asl] Diameter of the Casing cm
Position of screen bottom
Date Level of GW
[m below MP]
top
1 pump m
2 pump m
Depth of the
moni well Constr [m] 3 pump m
sonded [m]
Before sampling
m
After sampling
m
Zone of Sampling mixture Depth of the sample [m]
top central bottom
Type of Sampling Dopple pump
Centrifugal pump
cock suction drawing
Pumping Rate
[Lmin]
Duration [min]
Volume
[msup3]
Analysis in
Field
Temperature of GW [degC]
Air-Temperature
[degC]
pH-Value [-]
el Conductivity [microScm]
Oxygen [mgl]
Redox potential UG1) UH2)
[mV]
perceptions clear white grey yellow Brown
Recommendations on water monitoring in open-pit coal-mine areas in Mongolia (RWM)
65
At the sample Color
no low medium strong
Turbidity
no aromatic putrid sanious chemical
Odor
yes no yes no Chlorine Mineral oil
Out gasing Deposit
Vessel Glass light dark Plastic
Conservation
See
Documentation
cooler refrigerator Date Time
Transportstorage
Delivery
to the
lab
Remarks
Institution
(stamp)
Sampler
(signature)
Recommendations on water monitoring in open-pit coal-mine areas in Mongolia (RWM)
66
II Technical Details
Table II-1 Construction Details for Monitoring Wells (Water Level and Water Quality)
Construction Diameter Pipe Inner Diameter ge DN 50 (2) for water level measurements pipe inner
Diameter ge DN 100 (4rdquo) for water sampling wells
Material of Construction HDPE PVC-U
Length of the Filter Pipe 1- 2 m (in special cases this can also be longer)
Filter Size and Filter Filling
Based on the on-site wet sieving the following filling diameter and filter gap
size are recommended
Composition of the
Aquifer Filling Diameter [mm] Filter Gap Size [mm]
Middle sand and
fine sand fraction 071 - 125 05
Course sand 20 -- 315 15
Solid rock 20 -- 315 15
The use of gravel adhesive filters is excluded In principle the groundwater
measuring well has to be backfilled with a bulk pipe
Length of the fill material should be from about 05 m under the lower edge
of the filter up to about 05 m over the upper edge of the filter
Length of the Counterfilter about 05 m on both sides in direct contact with the upper and lower filter
material
Seals in the Annular Space
1 m (through geophysical methods localizable)
Bothsides in direct contact with the counterfilter as well as 10 m (or
completely) sealed of drilled aquicludes
A missing or incorrectly installed seal can cause a hydraulic short circuit
between hydraulically separated aquifers In doing so the functionality of the
drainage system of the mine can be impaired Furthermore a water
exchange of different aquifers can cause a mixture of different water
qualities Water samples from not right-sealed monitoring wells are not
useable
Sump pipe 1 m with bottom plate
Bottom Closure
Protecting pipe construction as measuring well head ldquohooksrdquo against the
throwing in of solids pouring in of fluids secure cap closure
Installation with spacers and pouring pipe (should be carried along during installation)
Recommendations on water monitoring in open-pit coal-mine areas in Mongolia (RWM)
67
Table II-2 Overview of the Recommended Processes for the Functionality Test of Groundwater
Measuring Points
Analysis Method Parameters to be Measured and Recorded Application Hard (H)
or Loose (L) Rock
Camera Inspection (OPT) Depth profile of the visual contamination of
the inner construction
H L
Caliper and Microcaliper Log (CAL-M) Depth inspection of the inner diameter H L
Gamma Ray Log (GR) Depth profile of the natural radioactivity H L
Gamma-Gamma Log (GG) Depth profile of gamma radiation dispersion
in the rock (Conclusions about back-filling
density)
H L
Neutron-Neutron Log (NN) Depth profile of the neutrons after the
deceleration of fast neutrons (Conclusions
about porosity through the hydrogen
content)
H L
Magnetic-Log (MAG) Depth profile of magnetic susceptibility of
the backfill
Predominately H
Resistance measurement in focused
configuration (FEL)
Depth profile of the electrical backfill
resistance
Predominantly H
Short Pump Trial (KPV) Time-profile of the groundwater level
decrease and pump-out rate
Predominantly L
Packer Flow Meter Measurement
(FW-PACK)
Depth-dependence of the groundwater flow
rate in the groundwater measuring well
H L
Measuring the Salinity (SAL) and
Temperature (TEMP)
Depth profile of the salinity and temperature
of the groundwater in the measuring well
H L
OPTIONAL Filling Test Time profile of the decrease after water
filling the groundwater measuring well
L
OPTIONAL 12-hour well
performance test (like observation
well test)
Dependence of the groundwater level
decrease on the pump flow rate in the
measuring well
L
Recommendations on water monitoring in open-pit coal-mine areas in Mongolia (RWM)
68
Table II-3 Calculation of Flow Rates for Measurement Weirs (Rectangular and V-Notch)
Rectangular
Weir
Q = 23 ∙ micro ∙ b ∙ (2∙g)12 ∙ (he +00011)32
Q = discharge [msup3s]
g = gravitational acceleration (g = 981
ms2)
he = head on the weir [m] measured in
a distance of
3 x he to 4 x he behind the weir
b = length of the weir [m]
micro = weir coefficient micro = 062 sharp
with air ventilation
micro = 05 wide sharp without air
ventilation
Triangular (V-
notch) Weir
Q = 815 ∙ micro ∙ tan(α2) ∙ (2∙g)12 ∙ (he)52
Q = discharge [msup3s]
g = gravitational acceleration (g =
981 ms2)
he = head on the weir [m] measured
in a distance of
3 x he to 4 x he behind the weir
b = length of the weir [m]
micro = weir coefficient micro = 062 sharp
with air ventilation micro = 05 wide
sharp without air ventilation
if α = 90deg than
Q = 1352∙he2483 [msup3s]
preconditions
005 m lt he lt ca 04
Hew lt 04 hebo lt 02 w gt 045 m
Recommendations on water monitoring in open-pit coal-mine areas in Mongolia (RWM)
69
Table II-4 Purge Volume Determination (VP) of the Water Sampling
The Purge Volume Determination (VP) is carried out by calculating the hydraulic criteria and by
measuring the chemical criteria
Hydraulic Criteria
The purge volume can be calculated by the equation
VP = n π4 dsup2 h
With
h = length of water column in the screen of the well [m]
d = diameter of well (borehole) in [m]
V = volume of water [msup3]
n= volume factor
n ge 15 in [17] n = 3 to n = 5
If the pump is installed more than one meter above screen this additional distance is
to be added to the value of h
Chemical Parameter
Stabilization Criteria
Achievement of the chemical stability criteria is the guarantee for a homogeneous
water sample Otherwise the sample would represent a mixture from different
waters and a mixture doesnrsquot represent the quality of the water from the aquifer
With respect to the groundwater chemistry an adequate purge is achieved when the
pH of the groundwater has stabilized within plusmn 01 the specific conductance within plusmn
5 and the turbidity has either stabilized or is below 10 nephelometric turbidity
units (NTUs) The temperature of the groundwater is not suitable for proof the
chemical stability criterion because it changes too rapidily during sampling
especially in extreme climatic regions This data should be noted in the field log
during sampling see ANNEX I Table I-2
For these analyses the pumped volume shouldnrsquot be too high because in this case
the water sample can represent another zone of the aquifer (eg deeperhigher
layers)
Recommendations on water monitoring in open-pit coal-mine areas in Mongolia (RWM)
70
Table II-5 Parameters of Analysis of Water Samples (eg ldquo0-measurementrdquo)
Parameter Groundwater Surface Water Water of streams and in the pit
Quantity
Water level x x x
Flow rate x
Quality
pH-Value x x x
Electrical Conductivity x x x
Oxygen x x x
Redox-potential x x x
Acidity x x x
Alcality x x x
Fe (II) x x x
Sulphate x x x
Sulfide (x)
Chloride x x x
o-Phospate x x x
Phosphate (all) x x x
nitrate x x x
nitrite x
Ammonium x x x
Hardness (total) x x x
Carbonate hardness x x x
DOC X
TOC x x
TIC X X X
Dry residual x
Calium x x x
Sodium x x x
Calcium x x x
Magnese x x x
Manganese x x x
Phytoplancton x
Zoo-Plancton x
Depth of visibility x
Depth profile x
Turbidity x
Recommendations on water monitoring in open-pit coal-mine areas in Mongolia (RWM)
71
Table II-6 Type of Sample-Flagons and Reagents for the StabilizationConservation of Water
Samples
Parameter Type of sample flagons
and reagents
Method for chemical
stabilizationconservation of water
samples
Coloring (SAK-436) turbidity
(TEF) SAK-254 Ammonium
nitrate nitrite calcium
magnesium sulphate chloride
Glass Polyethylene cooling
Oxygen (Winkler) acid-base
capacity phosphate
Glass with grinding
borosilicate glass full plug
cooling
Bore borate silicate sodium
potassium fluoride
Polyethylene cooling
Cyanides Polyethylene pH-Value 9-12 by input NaOH
recommendations of the laboratory
Metal ions (Al Ag As Ba B Ca
Cd Co Cr Cu Fe Li Mg Mn Mo
Ni Pb Sb Si Sr Ti Tl U V Zn)
Polyethylene FEP acidify by HNO3 to pHlt2 for analyzing
of dissolved metal ions filtration in field
(membrane filter 045 microm)
mercury borosilicate glass acidify by HNO3 to pHlt2 add-on
K2Cr2O7 (005)
DOC TOC Brown glass cooling
Recommendations on water monitoring in open-pit coal-mine areas in Mongolia (RWM)
72
III Supporting Websites
Table III-1 Some Online Sources of Basis Information about Geology and Hydrogeology
Topic Website
Hydrogeology httpswwwcommdevorgwp-contentuploads201505IFC008_PPT_
Community_Rev1_FINAL_MON_250517pdf
Water httpirimhenamemgovmnindexphp
httpeicmnwater
httpraisesuiritsukubaacjpnewpressyoushi_sugita9pdf
httpeicmngeodata httpeicmnsurfwater
Meteorology amp
Hydrology
httpirimhenamemgovmnuploadfilesButeel_35-2015pdf
httpeicmnclimate
httpwwwtsag-agaargovmnatmosphere
httpwwwsteelhouseinfoindexphpmn94294-mongolian-weather
Geology httpirimhenamemgovmnuploadfilesButeel_35-2015pdf
Aquifers httpwwweicmngroundwater
httpwwweicmnwaterbasin
httpwwweicmngroundwaterdepositinfo_morephpgid=52
Groundwater
Recharge
httpeicmngroundwatergisphp
httpwwwewa-onlineeuyoung-water-professionals-
conferencehtmlfile=tl
_files_mediacontentdocuments_pdfEvents2016IFAT202016115
0_Sunjimaapdf
Water Basins httpeicmngroundwatergisphp
httpwwwiwrm-
momodedownloadAndrewKausDissertation2018pdf
Groundwater
Monitoring
httpwwwgroundwatermn
httpwwwewa-onlineeuyoung-water-professionals-conference
htmlfile=tl_files_mediacontentdocuments_pdfEvents2016IFAT2
020161150_Sunjimaapdf
Norms httpgreenassessmentmnuploadfiles
httpwwwmnemnwp-contentuploads201709Tailan-pdf-last-1-
ilovepdf-compressed-ilovepdf-compressedpdf
httpswwwcommdevorgwp-
contentuploads201505IFC008_PPT_Community_Rev1_FINAL_MON_250517pdf
Recommendations on water monitoring in open-pit coal-mine areas in Mongolia (RWM)
73
IV Mining Water in Mongolian Laws
(Extractions)
The Law of Mongolia on Water (2012) is one of the most important environmental laws
Especially for the mining sector the law plays an integral role However the current
legislation is only poorly linked to the mining objectives Therefore authorities might
experience difficulties in the decision-making process The specific interaction and
compatibility should be checked and special attention must be paid to ambiguous cases
Art 46 The cabinet members in charge of nature and environment establish a water
resource council and approve the rules and regulations
Water Monitoring Art 6 amp 25 Water monitoring-research network The State
Administrative Central Organization in charge of nature and environment is supposed to
establish and maintain a water monitoring research-integrated network Organizations
and economic entities such as mining companies are a component of this network
Article 8 The State Great Hural (parliament of Mongolia) has the power to determine the
fees for water usage and water pollution
Article 17 The duties and powers of the basin administration include receiving
applications from citizens economic entities and organizations for well and hole drilling
as well as channel and canal building for the purpose of water usage to make
conclusions on water use on the basis of water resource management plans and in
accordance to 284 of the present law and to enter new wells into a database
Additionally the basin administration defines the grounds for water usage and water
pollution fee in accordance with the relevant legislation monitors the potential usable
water resources and water utilization at basin area regularly Licenses for mineral
exploration and exploitation in the relevant basin shall be granted based on the
recommendation of the relevant basin administration
Article 19 The respective soum (second level subdivision below the aimags (province of
Mongolia)) has the power to charge the water usage and pollution fees in accordance
with the legislation and to supervise its payment
The basin councilrsquos tasks are to monitor whether the water user is fulfilling its obligation
set out in article 30 of the present law to monitor whether the water user is fulfilling its
duty to reduce negative impacts elimination of damage and rehabilitation work
Article 21 A license for professional institutions can be issued by the State
Administrative Central Organizations in charge of nature and environment for a period
of five years and could be extended for another five years if the institution fulfilled its
duty in a proper way
Article 24 Protection of water resource against contamination The basin administration
can issue a permit to entities engaged in waste water removal with a quantity exceeding
500 m3 per day or contaminated waste water specified in 10112 of the present law The
governors of the soum and district may also issue permits However only when the
Recommendations on water monitoring in open-pit coal-mine areas in Mongolia (RWM)
74
volume of waste water per does not exceed 50 m3 In case of disregarding of the norms
specified in the permit or repeatedly disregarding the standard procedures the permit
might be subject to cancellation
Article 25 Payment and compensation for water pollution and depletion The permit
holder is responsible for the supervision of the quantity and the quality of the waste
water and the discharge of it after having met the standard requirements The holder is
furthermore liable to pay a water contamination fee If treatments do not meet standard
requirements the permit holder might be subject to a water pollution compensation
which has to be paid to the environment protection fund Water pollution and water
depletion fees are determined according to the law
Water utilization Article 27 and 28 Issuing permission to water users Permissions for
well and hole drilling and digging of channels and canals are issued by the aimag capital
city environment authority Applications to obtain a permit need to be submitted to that
authority and needs to document ie the following information Purpose and volume of
water usage copy of proof of land ownership possession and use information
regarding the wells The aimag capital city environment authority registers the wells and
holes in the water database and issues well passports
Citizens economic entities and organizations need to submit the water usage request to
a legal person specified in 284 of the present law The following documents need to be
annexed to the request A map indicating the water source to be used and its location
exploration and survey reports of water and mineral water resources quality
composition and conclusion on potential usable resources amount of water to be used
per day and its purpose drawings and project of water facilities production capacity
technical and economic indications environmental impact assessment documents In
case of the utilization of water for strategically important mineral deposits the permit
should be valid throughout the duration of the exploitation license
Article 31 Water usage fees Upon usage of water fees are charged which are set by the
law In case of usage of water exceeding the permitrsquos volume escalated rates up to 50
may apply The state administrative central organization will determine the exact rate
which the government needs to approve
Recommendations on water monitoring in open-pit coal-mine areas in Mongolia (RWM)
75
V Regulations concerning Water Monitoring and Water Management in
Mongolian Standards (MNS)
Mongolian standards are stored in httpgreenassessmentmn and httpwwwmnemn
Table V-1 Regulations about water monitoring and water management in Mongolian Standards (MNS)
Task Mongolian Standard (MNS)
Environmental protection and
hydrology general
requirements
MNS 334288 Groundwater protection General requirements Replaced by
MNS 33421982 General requirements for protection of groundwater from
pollution contamination
MNS 0017-1-1-101979 Water use and protection Terms and definition
MNS 0017-1-1-141980 Hydrosphere Classification of water use General
requirements
Water quality general
requirements
MNS 45861998 Water environmental quality General requirements
MNS 49432000 Water quality Waste water
MNS 4943-2011 Effluent treated waste water (Max content of polluting
substances in the waste water released to open nature monitoring
requirements during operation)
MNS 6148-2010 water quality Maximum limit of substance contaminating
the groundwater
MNS 9002005 Environment The human health protection Security Drinking
water Hygienic requirements and quality control
MNS 25731978 Environmental protection Hydrosphere Water quality
indicators
Surface water quality
monitoring procedure
MNS 404788 Environmental protection Hydrosphere
Water sampling MNS (ISO) 48671999 Water quality Sampling Part 3 Recommendation of
sample preparation and storage
MNS (ISO) 5667-12002 Water Quality Sampling Part 1 Guidance on the
design of sampling programs
MNS (ISO) 5667-22001 Water Quality Sampling Part 2Guidance on
sampling techniques
MNS (ISO) 5667-42001 Water Quality Sampling Part 4 Guidance on
sampling procedure of natural lake and reservoir
MNS (ISO) 5667-102001 Water Quality Sampling Part 10 Guidance on
waste water sampling procedure
MNS (ISO) 5667-112000 Water quality Sampling Part 11 Guidance on
groundwater sampling
MNS (ISO) 5667-132001 Water Quality Sampling Part 13 Guidance on
waste water and water treatment facility sludge sampling procedure
Water sampling analysis MNS (ISO) 110832001 Environment Water Quality Determination of
chromium (VI) uing spectrometric method (15-diphenylcarbazide)
MNS 50322001 Water quality Determination of heavy metals using the
Rontgen fluorescence method
MNS (ISO) 119232001 Water quality Determination of suspended solids by
filtration through glass (fibre filters)
MNS (ISO) 48891999 Water quality Determination of electrical conductivity
MNS 44201997 Drinking water Determination of mercury Atomic
absorption method
MNS 44302005 Drinking water Determination of measuring iron
compounds
MNS 43411996 Industrial water Determination of magnesium
concentration
MNS 43481996 Industrial water Determination of copper
Recommendations on water monitoring in open-pit coal-mine areas in Mongolia (RWM)
76
Task Mongolian Standard (MNS)
MNS 44312005 Drinking water Determination of nitrite concentration
MNS 42171994 Drinking water Determination of total nitrate concentration
MNS 39351986 Drinking water General requirement for field testing of
water
MNS 39361986 Drinking water Field analysis methods
MNS 39001986 Drinking water Determination of taste color smell and
turbidity
MNS 39001986 Drinking water Determination of taste color smell and
turbidity
MNS 35321983 Surface water Determination of lead content
MNS 0017-1-5-151980 Environmental protection Hydrosphere
Determination method of oil products in water
MNS 44231997 Drinking water Method of measuring dry residue
MNS 25701978 Method of measuring water purity
MNS 40791988 Water quality terms and definition
MNS (ISO) 78872000 Water quality Determination method of water color
and its checking
MNS 57902007 Water quality Determination of manganese (Mn)
concentration
MNS (ISO) 48171999 Water quality Determination of ammonium
MNS (ISO) 79802003 Water quality Determination of calcium and
magnesium through atom absorption spectrometer method
MNS (ISO) 58142005 Water quality Determination of dissolved oxygen
concentration Electric chemistry method
MNS (ISO) 60602001 Water quality Determination of chemical oxygen
demand
MNS (ISO) 92802001 Water quality Determination of sulphate by barium
chlorine gravimetric method
MNS (ISO) 105232001 Water quality Determination of pH
MNS 56662006 Water biological properties Assessment Determination
method of active sludge of waste water treatment facility
MNS 56682006 Water biological properties assessment Microbiological
analysis method of waste water
Recommendations on water monitoring in open-pit coal-mine areas in Mongolia (RWM)
14
Quantitative estimation of the future changes and developments to the water quality
Legal Framework and Standards
In addition to applying for a water license the mine developers should include a proposal for the
monitoring program describing the scope of measurement points chemical analyses reporting
time intervals etc This proposal might be subject for approval and modification by the licensing
authority The final water license states the requirements for monitoring to be carried out
A summary of the Law of Mongolia on Water is given in Annex IV The major laws and
regulations governing the minerals mining and the accompanying environmental obligations
are depicted in Figure 1
Figure 1 Major Laws Related to Minerals and Mining in Mongolia Concerning the
Environment
(LMBV mbH)
Regulatory requirements for water monitoring are determined by the following two tasks in
most cases
monitoring the qualitative and quantitative influence of the measures (eg dewatering) on
the environment surrounding the mining operation and
monitoring the effectiveness of the dewatering process to guarantee the safety of the
operation
Requirements and secondary provisions are therefore individually determined by the type of
mining as well as the natural conditions of the catchment and other (potential) users
Recommendations on water monitoring in open-pit coal-mine areas in Mongolia (RWM)
15
Regulations and standards concerning water monitoring and water management are listed in
Annex V
Processes and Outputs of Water Monitoring
Water monitoring is to be conducted throughout the entire mining cycle which comprises the
following phases
Feasibility Study and Planning Phase including exploration (I)
Operational Phase (II)
Closure Phase Post-Mining Phase (III)
Post-Operation Phase (after rehabilitation hydraulic steady state) (IV)
The engineering and consulting services which are to be developed for water monitoring and
integrated water management during the mine cycle are listed below
Feasibility and Planning Phase (Before Mining)
An exact description of the initial unmodified state of the hydrological and hydrogeological
conditions is an integral component of monitoring This description should include
groundwater dynamic characteristics groundwater flow direction flow gradient seasonal
changes of groundwater levels
a full quanititative analysis of groundwater quality
surface water characteristics water levels flow rates seasonal variations and
a full quanititative analysis of surface water quality
Because it is impossible to reproduce the data describing the original state after mining has
commenced special attention needs to be devoted to gathering this invaluable information
beforehand The pre-mining monitoring phase should be cover 3 ndash 5 years to capture data over
varying weather and climate conditions The goal is to establish a local (unmodified) water
balance
Water management practices in this phase consist of
evaluation of different process designs in order to optimize the overall water balance in the
affected area including reuse and recovery strategies
identification of potential water sources
determination of water quantity and quality requirements based on the different process
designs
investigation of opportunities for water reuse and recovery
development of a strategic plan and measurable performance targets and
the combination of all points above into an integrated water management plan
Recommendations on water monitoring in open-pit coal-mine areas in Mongolia (RWM)
16
Here ldquoprocess designrdquo refers to the mining companiesrsquo individual proposed plans for
monitoring drainage water use and mining activities
Operational Phase
During the operational phase the impact of dewatering on the groundwater dynamic is to be
monitored This entails monitoring the scope of groundwater extraction the dimensions of the
catchment area and the drop in the water level (potential level) in the mine and the surrounding
areas and for example at drinking water wells nearby The flow rates and water levels of
surface waters may also be affected by dewatering procedures One possible outcome is that a
higher surface water flowrate into the aquifer causes the surface water levels or flow rates to
decrease Continuous measurement of all water input and output rates is therefore obligatory
The water balances are to be calculated for the operational phase taking different scenarios
with varying extraction rates into account
Changes of the water quality (eg acid mine drainage) may be caused by aeration of the
overburden due to the extraction of waters the infiltration of extracted waters into ground- or
surface waters Continuous sampling and analysis are important in detecting possible changes in
the water quality
Closure Phase and Post-Mining
The post-mining phase can be divided into two sub-phases the transient phase and the quasi-
steady-state phase The groundwater level (potential level) will rise after dewatering processes
are terminated While a stable water level has not yet been established in this transient phase
continuous measurements of ground- and surface water levels are necessary for monitoring
changes and planning required measures accordingly In the quasi-steady-state phase a stable
water table has again been established and depends therefore only on climate conditions
which affect the groundwater recharge rate The frequency and extent of water quantity
measurements may be successively reduced throughout the transient phase if the data shows
little to no fluctuation over time
In many cases changes in water quality after mining as well as after dewatering can be
observed This can often be attributed to chemical reactions between aerated tailings material
and water which might cause acid mine drainage in cases where sulfur-rich material is involved
Dissolution of minerals ie salt may also have an effect Special attention needs to be paid to
identifying potential reactions such as these in order to prevent or mitigate negative long-term
effects
Preliminary Characterization of the System
A first estimation of the geological hydrological and hydrogeological state provides a necessary
foundation for the conception of a water monitoring plan This first estimation relies on
generally available data mostly on the internet and existing studies or expert opinions over the
area being studied
Basic information about geology hydrology and hydrogeology exist for nearly each region of the
world While the spatial solution may be very large it is possible to obtain an overview of
important background knowledge such as sedimentary or hard rock aquifers existing surface
Recommendations on water monitoring in open-pit coal-mine areas in Mongolia (RWM)
17
waters and climate conditions without any exploration results in most cases The study of this
background information is important for the planning of further geological hydrological or
hydrogeological investigations The websites found in Annex III Table III-1 contain such
background information
In other cases results of former investigationsmdashsuch as for draining water wells former mines
or the exploration of other resources may exist The first step is searching for this information If
a mine already exists any available results reports or data should be analysed and interpreted
One foundation for a model of the hydraulic system is the characterization of the aquifer system
by zone A table like the one in Table 1 can be used to collect and organize relevant information
The following data can help to determine in which areaszones groundwater bodies are
significant their extent (of groundwater bodies) saturated thickness estimation of hydraulic
conductivity and porosity The type of confinement describes how well the upper aquifer is
protected from pollution sources at the surface
Table 1 Characteristics of the Aquifer System per Zone
A preliminary estimation of the original state of groundwater body can be described with
support of the following information for each defined zone
extent of the catchment basin
area specific precipitation annual average estimation of the climate water balance and
information of the groundwater recharge ([lskmsup2] [Mio msup3a])
total stored volume ([msup3msup2] [Mio msup3])
total abstraction rate of other users in the basin eg drinking water supply ([msup3d] [Mio
msup3a])
estimation of flow rates between ground- and surface water in-exfiltration ([msup3md]
[msup3d] [msup3a])
Groundwater quality results of chemical analyses
The impact of dewatering mines into the water cycle can provoke situations of conflict among
groundwater users An initial consideration of potential conflicts (in the frame of groundwater
quality and quantity) can be an important basis for planning monitoring programs and water
Zone
Aquifer System Characteristics ndash Preliminary Estimates
Type Confined
(upper layer)
Lateral
Extent
Total
Thickness
Hydraulic
Parameters
Water
Table
Source of
Information
1 Single
multi
layer
unconfined
semiconfined
confined
[km] amp
[] of
total
[m] kf ne no S So [meters
above
sea
level]
[meters
below
surface]
study report
map etc
2
hellip
N
Recommendations on water monitoring in open-pit coal-mine areas in Mongolia (RWM)
18
management systems for the mine The general reference monitoring network (river basin)
should reliability depict the groundwater situation on a regional scale This function covers the
natural state as well as the regional impacts of groundwater use and surface water
management The following table 2 lists information to describe potential conflict situations
Table 2 Characteristics and Hydraulic Boundary Conditions of the Aquifer System per Zone
In every case Quantity and Quality importance (nolittlemediumhigh) numbers (numbers
or nonfewsomemany) strengths (noneweakmediumstrong)
Conflict (historical actual and prospective) Zone 1 hellip Zone N
Surface water measures (rates of infiltration extraction
changes of the run hellip) influencing surface water outside of
the mine area
Quantity
nonelittlemediuma lot
Quality
nonelowmediumhigh
Surface water measures (rates of infiltration extraction
changes of the run hellip) influencing groundwater
same as above
Dewatering (groundwater abstraction rate) influencing
surface water
same as above
Dewatering (groundwater abstraction rate) influencing
groundwater bodies (outside mining area) eg water
supply wells irrigation wells springs groundwater
dependent eco-systems
nonefewsomemany
Mine rehabilitation measurements (irrigation dump-
rehabilitation) influencing ground- amp surface waters
Beside the data research the evaluation of the results the robust archiving of all data
documents and the development of a GIS-supported database are recommended see the
following box
Development of a GIS-supported Database
A suitable tool to develop show edit and analysis of spatial information is the software QGIS
(QGIS 38 Zanzibar) httpswwwqgisorgdesite (or httpswwwqgisorg) itrsquos for free a
WINDOWS MAX LINUX BSD and next time ANDROID
Implement all information about geology (eg spatial distribution of aquifers and aquicludes
fracture structures boreholes) hydrology (eg spatial distribution of groundwater recharge flows
surface water bodies) and the mine (eg current state and planned development of the mine
dewatering wells and monitoring wells)
For some information given information see Annex III table III-1
Continue filling the database permanently (eg with results of drillings results of the water
monitoring)
A further important tool is SAGA-GIS (freeware) httpsaga-gissourceforgeneten It can be
used eg for gridding (triangulation nearest neighbor inverse distance) access to different files
grid calculator (combine grids through user defined functions calculation of surface ndash
groundwater ndash distance) terrain analysis (eg flow path analyses) or vector tools like polygon
intersection contour lines from grid (mapping potential lines of groundwater table) simulation of
dynamic processes (erosion landscape development) statistical tools
Recommendations on water monitoring in open-pit coal-mine areas in Mongolia (RWM)
19
3 Definition of Monitoring Objects
The diversity of climates ecosystems land uses different water users and topography
influences the design of a monitoring program Thus the resulting monitoring program should
be tailored to meet a specific set of needs and expectations of the site and will need to consider
regional physical and social factors
Each of the management actions has unique objectives and monitoring requirements These
objectives should be clearly defined measurable and implementable The development of
environmental and water management plans identification of sources of pollution and
assessment of compliance with set standards are examples of typical management actions that
require the results of a monitoring program
Examples of items to be monitored are groundwater soil water surface waters or other
parameters of the water cycle like precipitation evapotranspiration and groundwater recharge
The development of environmental and water management plans may be executed as described
in the following box (some of them are taken from Fehler Verweisquelle konnte nicht
gefunden werden) Details are described below
Steps for the development of environmental and water management plans
Identification of climatic conditions
Identification and quantification of all flow rates within the mine
Developement of a mine water catchment model (balances)
Develop and implement appropriate water reclamation strategies
Evaluation of the quality and quantity of groundwater from existend monitoring wells and
borholes of potential pollution sources
Definition of key ndashindicators for potential pollutions and integrate it into the monitoring program
Definition of requirements on water quality and design methods for the water treatment
The climatic conditions (incl measured parameters) can be determined by interpretation of data
from existing meteorological observation stations or by installing weather stations (with ie rain
gauge thermometer anemometer evaporimeter) If the weather station density in the area of
interest is too low the installation of additional measuring stations might be necessary as
variables such as rainfall evaporation temperature humidity or wind may vary significantly
across short distances
The evaluation of groundwater quality and quantity is based on the results of measurements and
analysed samples from existing boreholes in the vicinity of potential pollution sources The
definition of key pollution indicators (eg sulphate conductivity for residue deposits nitrogen
and phosphorus for sewage plants fine coal particle from coal washing) is a part for the
development of a monitoring program Based on these results pollution sources of the mine can
Recommendations on water monitoring in open-pit coal-mine areas in Mongolia (RWM)
20
be identified (eg residue deposits domestic waste landfill point discharges sewage treatment
plants processing plants mine shaft area)
The identification and quantification of all (relevant) water flow rates within the mine is an
essential part of water monitoring This includes the extraction (pumping) rates discharge rates
and infiltration rates Knowledge of water sources and sinks (eg drinking water wells)
including rates outside the mine are a basis for understanding the hydraulic system
The identification of current and future water uses and determination of their water quality and
quantity requirements are parts of planning strategies Critical water qualityquantity
parameters for all considered water treatment options (in terms of absolute values and
variability) are to be defined Upon evaluation of monitored water quality and quantity
parameters the need for water treatment may be indicated
Recommendations on water monitoring in open-pit coal-mine areas in Mongolia (RWM)
21
4 Groundwater
Use of Existing Groundwater SamplingMeasurement Points
Existing groundwater measurement points should be integrated into the monitoring program
but first they need to be tested for their functionality For the initial evaluation of an existing
measuring point the following steps are to be followed as described in [24]
Research and Compilation of the Existing Base Data (coordinates elevation and construction
details) The following data are to be sourced andor measured bore log construction drawing
depth location of the filter section diameter drilling method and drilling year and results of
measurements and sampling
Preselection of Monitoring Wells
Does the observation well represent the point of interest
Is the diameter of the well tube gt 2rdquo If the tube is too small sampling and water level
measurements are not possible
Is a clear appropriation to the aquifer given
Is there free access to the observation well and a right of access given
To use an observation well the following questions should be answered positively
Inspection of existing monitoring wells
Evaluation of the outer condition and inner condition through the sounding of the bottom and the
water level are they in a suitable condition If both measurments arenrsquot possible the measuring
point is probably plugged meaning that the ability and means of unplugging should be tested
Is the well made of a suitable material (For water sampling wells PE-HD or PVC-U are
recommended because some other materials can influence the water quality or the tubes can be
influenced by compounds found in the water)
Is there consistency between researched data and investigation results
Is it possible to insert a dummy of the sampling pump or data diver
Infiltration Test for Monitoring wells The measuring point should be filled with water and time-
dependent water level measurements should be taken If the level of the filled water stays
constant for several hours there is no longer sufficient contact with the aquifer The measuring
point is possibly silted up or the filter crusted over The measuring point cannot be used for
monitoring
Short Pump Test at the measuring points for water contamination The groundwater should be
pumped out of the measuring point and the characteristic data (water level electrical
conductivity pH value temperature oxygen concentration etc) recorded
Recommendations on water monitoring in open-pit coal-mine areas in Mongolia (RWM)
22
Other criteria for the usability of the monitoring points are location and accessibility standard-
conforming installation as well as general physical condition installation and age of the
measuring point
For a comprehensive functionality test the processes listed in Annex II table II-2 is suggested
Planning of Positions for (New) Groundwater Observation Wells
The monitoring boreholes cannot be randomly located but should be placed at the most suitable
location to accurately collect the required data The groundwater flow directions vertical limits
of different aquifers depth of the groundwater table pollution source locations pollution
plumes etc all need to be considered If the measuring points are positioned at the wrong or
poorly established (eg too shallow) location the resulting data may lead to incorrect
interpretation and therefore to wrong decisions
The exact location of the monitoring points should be clearly marked on a map in such a way
that it can be found by an external party This may be achieved by GPS referencing or by using
GIS-software to produce a reliable map with suitable background information such as
topography infrastructure rivers or buildings
For determining locations of monitoring wells the following points need to be considered
Monitoring wells for all existing hydro-geologically relevant layers are needed In the case of a
multi-layer system a group of monitoring wells with different depths of the screens is usually
necessary
Therefore measurement points upstream and downstream of the mine are essential (outside of
groundwater lowering) Wells should also be placed at specific monitoring objects (eg
groundwater dependent eco-system infiltration points etc)
Access to all monitoring wells should always be possible
Wells should be arranged in a triangular manner as shown in Figure 2 to enable determination of
flow direction and construction of hydrogeological maps
Groundwater flow monitoring is very site specific because it is dependent on the local
geohydrology which may vary significantly from one area to another
Recommendations on water monitoring in open-pit coal-mine areas in Mongolia (RWM)
23
Figure 2 Hydrological Triangle and the Construction of Water Level Lines
Construction of New Groundwater Monitoring Wells
Types of Groundwater Monitoring Wells
Some different types of groundwater monitoring wells are shown in Figure 3 (taken from [16])
The type of groundwater monitoring well is given by the aquifer system and the task of the well
The following table 3 shows the different conditions and wells
Table 3 Short Description of Different Types of Monitoring Wells
Type Application Limits
Full-screen
monitoring wells
Single ndash layer ndash aquifer system screened
the whole aquifer thickness samples are
a mixture
Different layers will connect hydraulically
problem in case of different potential
levels or different quality types (incl
contamination) depth-dependet sampling
is possible with packer-systems only
Multi-screen
monitoring wells
depth-dependet sampling is more
possible than in case of a full screened
well packer systems are needed
Hydraulic contact of different layers is
possible in the well different level
measurements arenrsquot possible
Partial-screen
monitoring wells
Different measurements and samples of
one specific layer is possible (also in a
multi-layer-system)
Gives information about only one of the
layers
Group of partial-
screen monitoring
wells (different
boreholes)
multi-layer-system different
measurements (of different water or
pressure levels) and samples of the
specific layers are possible
relatively high costs (nearly same costs as
the bunch of Monitoring wells but much
more valuable than a bunch)
Bunch of partial-
screen monitoring
wells (single
borehole)
multi-layer-system different
measurements (of different water or
pressure levels) and samples of the
specific layers are possible
Relatively high costs an accurate
construction is very important to prevent
hydraulic transfers between the different
layers a large diameter borehole is
needed
Subterranean head
monitoring well
Location can be roads parking etc Possible destruction by transport
Recommendations on water monitoring in open-pit coal-mine areas in Mongolia (RWM)
24
Figure 3 Different Types of Monitoring Wells
Sources httpspublikationensachsendebdbartikel23156documents31473
Construction Details for Monitoring Wells
Groundwater measuring wells for the measurement of the potential level should be constructed
according to the specifications in Annex II Table II-1 (taken from LMBV mbH Merkblatt
Montanhydrologisches Monitoring 2019)
Recommendations on water monitoring in open-pit coal-mine areas in Mongolia (RWM)
25
Recommendation for a Multi-Layer System
Groundwater levels and water quality should be measured for each aquifer seperately in the case
of a multi-layer system
The different aquifers must not be connected eg at the construction of monitoring wells
Aquitards (aquicludes) should be sealed in boreholes by hydraulic barriers like clay seals
Contaminations of the water can be dispersed throughout different aquifers in the case of
connected layers The conditions of flow and pressure can be changed by connecting aquifers
Unregulated water outputs and chemical reactions between water and the rock matrix can be a
consequence of connected aquifers
The construction of measuring point bundles makes an effective hydraulic seal difficult In the case
of different aquifers the construction of a group of monitoring wells is recommended
Monitoring Program
Measuring borehole depths and the water levels in them should be a standard part of a
groundwater monitoring program Groundwater levels can be measured using electrical contact
tape float mechanism or pressure transducer The following factors must be considered in
groundwater flow topography streams stream flow fountains dams geology and excavations
The usual measurement frequency of the groundwater level and pressure is once per quarter
which allows seasonal changes to be detected However the frequency of required observation
can be different among sites or monitoring wells (eg depending on the dewatering wells) The
frequency of measurements depends on the type and position of the aquifer the groundwater
dynamic aquifer development and climate conditions
Frequency of measurement should be
Denser for shallow unconfined aquifers because the seasonal change of water level is higher than
for deeper and confined aquifers
Denser for rapid groundwater flow (high hydraulic gradient) than for slow groundwater flow
Denser for more intensive groundwater drawdown (eg short distance to the dewatering system)
than for less withdrawal and small drawdown (higher distance to dewatering wells)
Denser for more variable climatic conditions (incl high groundwater recharge) than for less
variable conditions (eg small seasonal changes)
The frequency should be adapted with respect to these conditions and interpretation of the
monitoring results
Measuring groundwater level is a technical procedure that should be undertaken by a suitably
qualified person The forms found in Annex I Table I-2 should be used for the documentation of
the measurements The sampling interval should be once per year (MarchApril) at a minimum
If two samplings per year are possible the months MarchApril (1st) and SeptemberOctober
(2nd) are recommended
Recommendations on water monitoring in open-pit coal-mine areas in Mongolia (RWM)
26
Groundwater Sampling
The MNS (ISO) 5667-X consisting of several parts is a guideline for taking water samples The
following text doesnrsquot replace this guideline but it should give some additional practical tips
Preparation of Sampling
The technical functionality should be checked according to the device-specific requirements The
calibration of all measuring tools is necessary before every monitoring campaign and during the
campaigns in the case of different water qualities This is very important because the
differences between the true value and the measured values are often surprisingly high
when non-calibrated gauges are used The calibration and handling are to be carried out
according to the manufacturer specifications before each use Calibration buffers are to be
checked regularly and if necessary are to be replaced as they have a limited shelf life The
calibration value also is to be corrected according to the temperature dependency of the buffer
solution used
Check-list for the suitability of the equipment
Is the pump-system complete This includes a motor-pump with control unit an electric power-
source (eg diesel generator) and stand pipes (tubes andor flexible tubes)
Are all measuring tools calibrated
Is the pump power (pumping head) sufficient
Are the hoses and the light cable long enough
Do the devices meet the quality requirements (purity cleanliness) of the sampling (also applies for
individual sampling)
Do the necessary filtration units comply with the Equipment Standard requirements
Are hoses and connectors reagents andor tools suitable for the task in proper working
condition
Are the flagons prepared Are necessary reagents for sample stabilization andor necessary
cooling elements available in sufficient numbers see Annex II Table II-6
Are the bottles individually labelled with sample number the monitoring well name or number
sampling date and sampling campaign name or number Important additional information should
be recorded the name of the sampler and the name the laboratory as well as the parameters to
analyse and type of chemical stabilization
Are the necessary cameras GPS master data sheets sampling protocols and cleaning equipment
on site and ready for service
Recommendations on water monitoring in open-pit coal-mine areas in Mongolia (RWM)
27
Sampling
The following steps are carried out during a groundwater sampling
(1) Well monitoring
Samples for water analyses can also be taken from the same groundwater measuring points
used for quantity monitoring Important is that the pipe can be navigated with a motor
pump Classic sampling motor pumps can be installed in measuring points with two-inch
inner diameters (ID) In case of very deep monitoring wells the pipes can become
misaligned in such a way that the pump can get stuck and break off Before installing a
pump at least one test with a light cable or a dummy should be completed
(2) Local Findings Observations at the Sampling Point and the Surrounding Vicinity
Check of the information on the master data sheet for completeness
Check the condition and serviceability of the sampling point for visible damage safety
(closeability) cleanliness corrosion of metal parts and other changes
Check for and document any deposits and incrustations eg precipitations biota (algae
mold animals) sediment etc
Check and document any mixed waters mixture of water of different origin inflow of
foreign water overflows
In principle gross deficiencies in drinking water supply systems (also in the case of
drinking water purposes used house wells) should be communicated to the operator
Document changes since the last sampling eg agricultural activities earthwork or
construction sedimentation conspicuous surface use visible contamination sources
Record any other abnormalities eg weathering during sampling air temperature
precipitation degree of cloudiness or sun exposure nuisance dust
(3) Measurement of Groundwater Level before Pumping
The groundwater level describes a part of the actual hydraulic situation The results of the
sample analyses should be interpreted with respect to the hydraulic situation (eg high or
low groundwater level) The measurement should continue during the whole pumping
duration
(4) Installation of the Pump
The pump should be installed more than one meter above the screen of the monitoring well
(5) Pumping and Purging
For pumping it is important to maintain a continuous moderate pumping rate
Discontinuous pumping can provoke turbulence in the water column of the monitoring well
and if the pumping rate is too high solid substances outside from screen can enter into the
monitoring well The pumping rate can also be optimized by adapting to the yield of the
well A continuous water level should also be maintained since the water level must not
Recommendations on water monitoring in open-pit coal-mine areas in Mongolia (RWM)
28
decrease below the pump and should be at least 1 m above the screen The inflow of oxygen
is to be avoided
Purging is the process of removing stagnant water from a well immediately prior to
sampling causing its replacement by groundwater which is representative of actual aquifer
conditions from adjacent formations To determine when a well has been adequately
purged field investigators should monitor (at a minimum) the temperature the pH specific
conductance and the turbidity of the groundwater removed during purging In the case of
permanent monitoring wells they should observe and record the volume of water removed
The Purge Volume Determination (VP) is carried out by calculating the hydraulic criteria
and by measuring the chemical criteria see Annex II Table II-4
The water should then be released a long distance away of the monitoring well (minimum
five meters) after pumping
(6) On-site Parameter Measuring
Organoleptic (sensory) data include the qualitative recording of color turbidity smell and
sediment The tests should be carried out in a transparent vessel with a volume of at least
one liter against a white and black background Abnormalities of the groundwater can
already be detected through the optical or odoriferous findings This data can therefore
also be used to assess the measuring point or quality of sampling Dregs from another
monitoring well in a pore aquifer can indicate damage to the measuring point
The parameters water temperature electric conductivity (in μScm) dissolved oxygen
reduction-oxidation potential and pH-value are measured by gauges The use of multi cells
is recommended Otherwise the use of vessels is possible The sensors should not be used
in the same vessel The volume of the vessels should be greater than one liter The measured
value must first be read and logged if the display remains stable
(7) Sampling
It is particularly important that wells be sampled as soon as possible after purging If
adequate volume is available upon completion of purging the well is to be sampled
immediately If not sampling should occur as soon as adequate water volume has
recovered
(i) Charging the Sample Flagons see also Annex II Table II-6
When sampling with a medium or large mobile pump a bypass with adjustable flow off of
the sampling line can be used to fill the sample vessels The bypass should be installed in
front of the on-line measuring instrument and the line should be purged briefly to remove
fluid standing in the line before the sample is taken
When filling the sample bottles are to be completely and appropriately labeled All sample
containers not pre-filled with stabilizing reagent are to be rinsed out at least twice before
filling This is done by filling the container approximately 25 with sample water placing
on the lid shaking vigorously and emptying Before closing the sample containers the
closures are also to be rinsed thoroughly Filling of the water samples must be completed
Recommendations on water monitoring in open-pit coal-mine areas in Mongolia (RWM)
29
without bubbles and avoiding turbulence To achieve this the filling tube should be kept
submersed in the sample Fill the bottles completely and let them overflow several times
before closing the bottle The groundwater sample thus enters the sample vessel without
contact with the atmosphere
For vessels containing stabilizers the hose must not come into contact with the contents of
the bottle and with the stabilizer The filling process is to be interrupted at about two-thirds
of the bottle volume in order to distribute the stabilizing agent homogeneously throughout
the sample by gently swirling the closed vessel Then the bottle can be completely filled
(ii) Filtration of Samples
For most parameters analyses are taken using unfiltrated samples However some
parameters like DOC or metal concentration first require filtration of the water sample If
the samples are to be filtered disposable filters with a pore size of 045 μm and disposable
syringes are used The filters should be rinsed with at least 20 ml of sample water A
membrane filtration device can also be used on site Filtration is to completed before
conservationcooling in every case
(8) Conservation and Storage of the Samples
Information as to the conservation and storage of samples is given in Table 9 Without
stabilization the concentration of some dissolved elements can change during storage or
transportation (eg precipitation of Fe-II as FE-III) causing errors in the laboratory
analyses of the solutes
(9) Transport and Storage of Samples
The temperature during transport and storage should be kept between 2degC and 5degC A cooling
box with cool pads can be used while freezing of samples is to be avoided
InfoBox Water Sampling
Failures in and carelessness during sampling conservation storage and transport of a water
sample can change the quality of a sample and change the analysed results An (expensive) water
analysis becomes useless because of this
The parameters temperature electrical conductivity pH value dissolved oxygen content and
redox potential as well as organoleptic parameters must be measured or recorded and
documented on site Results of these measurements in the laboratory do not represent the
original water quality
Proof of compliance with hydraulic and quality criteria should be part of the sampling
documentation
The original documentation of the analysis results should be stored securely and long-lasting
For additional information see
httpswwwepagovsitesproductionfiles2015-06documentsGroundwater-Samplingpdf
Recommendations on water monitoring in open-pit coal-mine areas in Mongolia (RWM)
30
5 Surface Water
Objects of Surface Water Monitoring
Surface water monitoring includes measurements of volumic flow rates and water levels in the
mine and the surrounding area This is necessary to determine the interaction between surface
and groundwater
Surface water monitoring includes the important water flow rates in the mine and the
distribution of pumped water (eg dusk fixation irrigation re-infiltration or output)
In the area directly surrounding the mine the following measurements are part of the surface
water monitoring
Delivery rate of a spring comparing the delivery rate and dewatering of the mine can
give information about the impact of mine dewatering to the groundwater and local
water balances
Water levels of artificial and natural lakes hydrographs of the lake water level give
information about its seasonal changes and the impact of mine dewatering
Input and output rates intofrom lakes important for the complete estimation of local
water balances and the local water cycle
Precipitation and evaporation to and from lakes important for the complete estimation
of local water balances and the local water cycle
Rates of surface fluids at different points (eg in front of and behind the mine) possible
impacts (higher ex-filtration rates from fluids into the underground near a dewatered
mine gives information about hydraulic interactions
Input and output rates intofrom fluids lakes important for the complete estimation of
local water balances and the local water cycle
Monitoring Program
Flow rates of fluids change rapidly with the climate conditions (precipitation snow smelting)
That is why times for measurement canrsquot be predicted exactly The frequency should be fixed
individually and iterative with the results Measurements under different conditions such as
during dry phase or after precipitation can give the range of possible rates
For a lake water sampling is recommended at the different phases of the circulation of the water
body This means four times per year spring circulation begin and end of the summer-
stagnation and during autumn circulation
Recommendations on water monitoring in open-pit coal-mine areas in Mongolia (RWM)
31
Water Level Measurement
The level of surface water bodies is monitored by staff gauges (water level gauges) recording
gauges shaft encoders water level sensing systems or pressure probes with data loggers and
possibly remote data transmission In order to avoid the influence of waves and wind all
registering water level gauges are to be installed in a dip tube It is important to regularly check
whether there is hydraulic contact between the inside and outside of the tube
Figure 4 Examples of Water Level Gauges for Surface Water
Basis data for each water level gauge include the coordinates (x y) and the level of the reference
point (z m asl) see Chapter 6
Flow Rate Measurement
Two groups of flows are to be differentiated the gravity flow in partially filled pipes channels
and streams and the pressurized flow in discharge pipes A second differentiation is possible
between direct and non-direct measurements Flow rate measurements are just one part of
water monitoring in mining areas Therefore only a small part of the wide range of methods is
presented in these recommendations
Gravity Flow
Area-Velocity Technique Non-Direct Flow Rate Measurement
Float Method
The most common technique consists of calculating or estimating respectively the cross-
sectional area and measuring the flow velocity The latter can be determined by different
methods such as the float method By observing a floating object on the surface of a water body
Recommendations on water monitoring in open-pit coal-mine areas in Mongolia (RWM)
32
the flow velocity at the surface can be measured The equation v asymp 085 middot v13 yields an
estimate for the average flow velocity [(Gunston 1998)] The measurement of the velocity is
more sophisticated for defined areas
Flow Meter Method
Quantification of the flow rate requires (a) the determination of the flow-profile and (b)
measurement of the flow velocity using an inductive flow meter over the entire flow cross-
section Based on the flow velocities (vi) in the individual profile segments the flow rate is then
calculated by
Q = A∙ v
The measurement profile is recorded using measuring slats or the folding rule The bar is placed
above the water on both sides of the embankment as shown in Figure 5 With the folding rule
the depth of the water is registrated over the entire cross profile Each section of the profile can
then be assigned a flow rate
Figure 5 Velocity Measurement
Non-direct Flow Rate Measurement Using a Weir
Estimation of flow rate using water level and physical relations for defined profiles are described in
Annex II Table II-3
Figure 6 Example of a Triangular Weir
Recommendations on water monitoring in open-pit coal-mine areas in Mongolia (RWM)
33
Direct Measurement by the Bucket-Method
A cheap and simple alternative is to use the bucket method If the discharge of the surface water
can be captured in bucket for X units of time and the captured volume determined the flow rate
can be calculated rather easily However automation is not possible in this case Use of this
method is only valid if the bucket or vessel is large enough to collect the whole volume over the
measurement time period
Dilution Methods
By adding a known concentration of tracer (eg salt or dye) into a stream and measuring its
dilution after it has been fully mixed with water the discharge can then be calculated using the
following formula
Special attention has to be paid to the selection of an appropriate tracer It should not react with
any substances present in the water and should not be taken up by sediment or organisms
Commonly sodium chloride salt or rhodamine dye is used Note that for certain tracer
substances special permits by the local environmental agencies might be needed
Manningrsquos Equation
The Manning Method can be used for open channels and partially filled pipes for non-
pressurized fluids in gravity flow This method is widely used for flow measurements because it
is easy to use after a few initial measurements have been made and it provides fairly reliable
site discharge estimates
Official requirements state that the channel should have a uniform cross section slope and
roughness within the vicinity of the measurement In addition the pipe (or channel) should be at
least 30 meters long and should not have any rapids falls or backup flow For ecological
purposes an eight-meter-long channel or less would probably be sufficient as long as the water
is flowing evenly
The equation requires obtaining values for the roughness of the channel (determined from
standard tables) the cross-sectional area of discharge flow the hydraulic radius (cross-sectional
area divided by the wetted perimeter) and the slope of the gradient Since the slope and
roughness are constants once they are known future flow estimates can be calculated by simply
measuring the depth of the discharge in the channel or pipe
= middot minus minus
Q stream discharge
q tracer injection rate
C1 tracer concentration in injection
C2 final concentration of tracer in the stream
C0 background tracer concentration in stream
Recommendations on water monitoring in open-pit coal-mine areas in Mongolia (RWM)
34
Estimation of the flow rate using water level and physical relations for defined profiles are given
in Annex II Table II-3
Flow Measurement in Open Channels
By employing level measurement over specially designed and constructed open flow channels it
is possible to calculate flow rate as a function of fluid depth In many cases fluid flow around a
mine is by means of open channels and the flow measuring techniques developed for piped flow
are thus unsuitable The requirements in terms of channel shape and applicable equations are
also discussed as these are necessary in the conversion of a level measurement to a calculated
flow rate
Pressurized Flow
Pressurized flow can be measured by magnetic flow meters or ultrasonic flowmeters for
example Magnetic flow meters require a conductive fluid and a non-conductive pipe liner The
electrodes must not corrode in contact with the process fluid some magnetic flowmeters have
auxiliary transducers installed to clean the electrodes in place The applied magnetic field is
pulsed which allows the flowmeter to cancel out the effect of stray voltage in the piping system
Surface Water Sampling
Sampling points of surface water are given by the water management system of the mine This
can include water bodies in the open-pit collection deposits of water water storage facilities
treatment facilities for water re-use springs channels or other flows
Surface water sampling is regulated by MNS (ISO) 5667-42001 Water Quality Sampling Part 4
Guidance on sampling procedure of natural lake and reservoir
In case no information indicating a specific water quality level is available at the beginning of the
monitoring program a case-specific set of analyses should be conducted This procedure should
be applied to all initial measurements until the scope can be better defined Examples of possible
sets of analyses for the ldquo0-measurementsrdquo are shown in Annex II Table II-5
Some of the steps are similar to groundwater sampling and are described in Chapter 4 The
others are described below
Local Findings
Observations concerning the following characteristics should be recorded for the area at and
directly around the sampling point This information may explain results of water analyses or
may provide information about existing chemical processes
Checklist of local findings at surface water sampling locations
Check the information in the master data sheet
Reduction spots darkening on the underside of stones as an indication of poor oxygen availability
and consequent reduction processes
Oil film (visual control) foaming
Recommendations on water monitoring in open-pit coal-mine areas in Mongolia (RWM)
35
water level runoff retention
frozen water table
changes since the last sampling eg agricultural activities earthworks or construction
sedimentation conspicuous surface use visible contamination changes in banks foreign matter
sewage foam discharges discharges
other abnormalities water level development substrate sediment
biocenoses eg waterfowls
weather during sampling eg air temperature precipitation degree of cloudiness or sun exposure
Taking Samples
In the case of surface water local representatives should be careful not to detect wastewater
plumes dead water zones or returbulence Rather the site to be sampled should be where the
largest mass transport is to be expected or where the flow rate is about 1 ms when sampling
from the embankment On the one hand for safety reasons entering the water body should be
avoided as far as possible in order to prevent sedimentation
Water samples from running waters should be taken as single samples using scooping devices
The appropriate sampling equipment is to be thoroughly rinsed with the water to be sampled
several times in advance When sampling bridges and the like care should be taken that no
contaminants get into the scoop When removing the water bottom should not be touched with
the scooping device in order to prevent the sediment being stirred up Likewise the sampling of
floating materials should be avoided
The sampler should be submerged in the upper third of the water body depth (or if necessary
approximately 5-30 cm below the surface of the water) The opening of the ladle or sampling
vessel is held in the direction of flow If several scooping processes are required to fill the
sampling containers the homogeneity of the sample must be ensured
In the case of lakes individual samples from several depth stages are to be taken at the
measuring points for the analysis of the chemical parameters depending on the different
seasonal circulation-stagnation-phases
Recommendations on water monitoring in open-pit coal-mine areas in Mongolia (RWM)
36
6 Data Management
Complete comprehensive and transparent documentation of data is one of the most important
parts of the water monitoring All data about the drilling the construction of monitoring wells
surveying water level and discharge measurements sampling and laboratory results are to be
documented The following tables show the main information for the different processes
Additional information and forms are given in the Annex I
Table 4 Example for the Documentation of the Measurement of Groundwater Levels
No
Name
Coordinate
Easting
Coordinate
Northing
level
of the
head
of the
tube
level
of the
top of
the
screen
level of
the
bottom
of the
screen
bottom
of the
monito-
ring
well
date of the
measure-
ment
depth of
the
water
table
water
level
press-
ure
level
m
asl
m
asl m asl m asl
[m
below
top of
the
tube]
m asl
44-XY-4 10833120 49975110 11041 10840 10800 10780 01042010 1420 108992
44-XY-4 10833120 49975110 11041 10840 10800 10780 29092010 1450 108962
hellip
44-XY-4 10833120 49975110 11041 10840 10800 10780 29032017 1910 108502
The required data for each groundwater monitoring well is given in Annex I Table I-1 The
water level measurements for surface water bodies can be documented in the same way Table 5
contains the required information for the measurement for water levels and flow rates as well
as for surface water sampling The table is to be adapted to the type of surface water
Table 5 Example of a Documentation of measurement point for the Flow Rate of Surface
Water
Item Unit lake
pond Fluid Remark Example
Details about the measurement point
ID (station identification number) x x Unique code system (for whole
Mongolia)
Monitoring ID Number x x Specification for the Monitoring
Program for the mine xy
Type of measurement point x x Example weir staff gauge vane
Type of measured data x x Flow rate
Owner of the station x x Mine basin ministryhellip
Name of the water body or fluid x x
Location
Aimag townvillage location name
location description
x x Link to the photos of location
East Coordinates (m) x x Mongolian grid system
North Coordinates (m) x x Mongolian grid system
Recommendations on water monitoring in open-pit coal-mine areas in Mongolia (RWM)
37
Item Unit lake
pond Fluid Remark Example
Elevation m asl x x Terrain elevation of the monitoring
station type of elevation
determination eg single instr
GPS differential GPS estimation
from topographical maps
Elevation of the reference elevation
for the measurement point
m asl x x
Bottom of water body m asl x
Water level or flow rate measurement
Water level m asl x x
Average depth of the fluidwater body [m] x x
Average width of the fluidwater body [m] x x
Flow rate ls
msup3min
x
Measurement range [m] [L ∙
s-1 msup3 ∙
min-1]
Frequency of Measurement 1Month 1Quarter
Average Velocity Curve exists x yesno
Sampling
Type of sampler x x Boat vessel
Program of sampling x x Spring circulation beginend
summer stagnation autumn
circulation
Depth(s) of the sample m x
Date of (last) sampling x x
Contamination yesno x x
Frequency of sampling x x
Remarks x x (no access possible fluid is dry
lake is frozen)
Documentation for groundwater sampling is given in Table 6 Annex I Table I-2 contains a form
for the documentation of the groundwater sample
Table 6 Example for the documentation of the Water Sampling
Item Unit Remark
Name
ID (station identification Number) Unique code system (for whole Mongolia)
Monitoring ID Number Specification for the Monitoring Program for
the mine xy
IDName of the borehole
Type of the measurement point Example weir staff gauge
Type of measured data Flow rate water level
Owner of the station Mine basin ministryhellip
Location
Aimag townvillage location name
location description
Link to the photos of location
East Coordinates (m) Mongolian grid system
North coordinates (m) Mongolian grid system
Elevation m asl Terrain elevation of the Monitoring station
type of elevation determination eg single
instr GPS differential GPS estimation from
topographical maps
Recommendations on water monitoring in open-pit coal-mine areas in Mongolia (RWM)
38
Item Unit Remark
Elevation of the reference elevation for the
measurement point
m asl
Depth of the monitoring well m depth below terrain elevation
Depth of the screen(s) m asl
Connected Aquifer
Sampling
Sampling date
Static water level m asl before purging
Static water level m asl after purging
Type of purging pump (specification example grundfos MP1)
gathering pallet
Depth of pump setting
Time Startend duration Min
Discharge during sampling l ∙ min-1
Sampling device
Field measurements
EC microScm
mScm
pH
Redox mV
O2 mg∙l-1
T degC
Color
Turbidity NTU
verbal
description
odor fresh putrid septic medicinal sulfur
chemical
Sample treatments Filtration method mesh size
Sample conservation Cooling to +4degC freezing to -20degC
storage Locationdurationconditions of storage
Designationdescription of samples Example
Sample-ID 1240I
Well-ID xc-03-1482
Date 20170915
Additions HCO3
Analysis of Fe-II
Laboratory Nameanalysis date lab identification No
Analytical methods standards
Analysis results entered Namedatefile
Remark Documentation
The high costs of monitoring require that the data be used for multiple purposes Therefore all
results of the monitoring (water level flow rate water analysis) must be clearly assignable to a
date and a location (x y z) as well as to the water body or aquifer and archiving the data has to
be robust Because mining is a very dynamic process lost or unassignable monitoring data is not
reproducible and therefore not replaceable
Recommendations on water monitoring in open-pit coal-mine areas in Mongolia (RWM)
39
7 Interpretation and Analysis of Monitoring Results
Validity Check Visualization and Interpretation of Water Level
Measurements
Validity Check
The purpose of the validity check is to compare with previously collected values (hydrographs)
with the construction details of the observation well Extreme values conflicting values and
outliers can be caused by incorrect metering of the water depth (reading error) Comparison
with former values would show a difference in this case The difference is an even value in case
of a reading error and the data can be adjusted in some cases Secondly the development of
mines and dumps may require a cut of the observation well If a change in the reference point
(head of the observation well) is not taken into account the hydrographs show a step of the
values These values have to be adjusted by the difference of the elevation of the well head
Finally if the groundwater level is below the screen the measured water level shows the water
in the sump pipe of the observation well That means the well is dry and the values are invalid
The quality control of the data is of enormous importance Flawed data can lead to wrong
conclusions (for example concerning mine safety) and thus to wrong decisions or implemented
measures
Visualization of Monitoring Results
Hydrographs
Hydrographs are plotted values of the water level versus time The water level is shown as
meters above sea level (masl) The plot can be created using basic software (eg MS Office)
Time-related changes of the water level can be detected by graphing It may be useful to plot the
water levels together with the graph of the climate water balance or graphs of groundwater
abstraction (dewatering of the mine) The measured values can be used directly
If there is a density difference of the liquid medium (eg very high salinity of the groundwater) a
conversaion into fresh water levels is necessary using the following formula
hfresh = HSW middot (ρsρf)
where hfresh is the equivalent fresh water column [m] HSW is the length of saline water column
above reference level [m] ps is the density of saline water [kgdmsup3] and ρf is the density of fresh
water [kgdmsup3] Flow rates or water levels of surface water can be plotted as hydrographs as
well
Example Interpretation of Hydrographs
The following figure (Figure 7) shows some hydrographs of different groundwater monitoring wells
around a dewatered coal mine together with the values of the climate water balance (CWB) The
values of the groundwater level are shown on the left axis and the values of the CWB on the right
axis
Recommendations on water monitoring in open-pit coal-mine areas in Mongolia (RWM)
40
As shown in the Figure 7 the water level of monitoring well 1 is stable The value of March 1996 is
an error (outlier) which should be corrected Values during the time between June 2015 and
November 2016 are missing Monitoring Well 1 is screened in the upper aquifer in our case That
means this upper aquifer is protected from dewatering of the mine by natural hydraulic barriers
(aquiclude)
However the graphs of the monitoring wells 2 and 3 show a significant drawdown (gt30 m) since
2003 These monitoring wells represent the deeper aquifer which was dewatered The
hydrograph of the monitoring well 3 has been stable since March 2008 At this point there was no
more groundwater in this well The groundwater table was either deeper than the monitoring well
or deeper than the screen of this well The values since March 2008 are not useable
Figure 7 Example of Water Level Hydrographs
Monitoring wells 4 and 5 are located at a large distance from the mine (gt5km) The water level is
directly influenced by the groundwater recharge specifically by the CWB The highly positive CWB
during 20102011 and 2013 caused higher groundwater levels The hydrograph of well 5 shows a
small drawdown in 2014 and 2015 The aquifer near well 5 could be affected by mine dewatering
Mapping of Contour Lines
A water-level contour map is a common tool used by hydrogeologists to indicate groundwater
flow directions and the hydraulic gradient as well as to test the continuum approach From field
measurements of static water levels in wells a water level contour map can be constructed
Anomalously high or low water levels and jagged or discontinuous contours may be evidence
that the continuum approach is not legitimate Water flow directions aid in the delineation of the
source water protection area
Recommendations on water monitoring in open-pit coal-mine areas in Mongolia (RWM)
41
If there is hydraulic contact between surface and groundwater the surface water bodies are to
be considered in the contour maps This applies for standing water bodies and for flowing water
Knowledge of surface water levels is required The basis of the water body added to an
estimated water level can be used in the case of flows The potential level (pressure level) is
used in the case of a confined aquifer It is also standard to use special software (eg SAGA GIS
see below) for designing contour lines A manual design of these lines however is also possible
Mapping the Depths to the Water Table
Mapping the depth of the water table is important for (a) regions with different groundwater
users with wells that are screened at different depths (b) when a hydraulic interaction between
surface water and groundwater occurs or (c) in regions with small distances between terrain
surface and the groundwater table Levels of the terrain levels of groundwater and special
software (eg SAGA GIS see below) are required for creating a map of groundwater depths
Mapping of Table Differences
Maps of groundwater level differences are a suitable tool for showing the impact of mine-
dewatering on the aquifer The groundwater levels in the monitoring wells at different dates are
the base for mapping these differences
Mapping of Monitoring Results
Contour lines describing groundwater level or potential are a suitable tool to plot the dynamics of
groundwater results are the direction of groundwater flow and the hydraulic gradient
Mapping contour lines should be done for the state before dewatering activities starts and for
each year afterward (measured in the same month)
Groundwater level difference maps are a suitable tool to illustrate the effect of mine dewatering
on the aquifers
Suitable reference states for mapping of table differences are (i) state before dewatering activities
and current state (ii) state of previous year and current state (iii) current state and prognosis
state (based on the calculated state from the model) (iv) state before dewatering activities and
prognosis state (v) state before dewatering activities and after dewatering including completed
groundwater increase
If different data sets (measurements model results) are used possible deviations must be
explained and discussed
A suitable software (freeware) is SAGA-GIS httpsaga-gissourceforgeneten
Interpretation of Monitoring Results (Water Level Flow Rates)
Establishing a hypothesis can support the interpretation of monitoring results For the
monitoring of mine dewatering such hypotheses can be the different drawdowns of the
groundwater level or a decrease in the flow rates of fluids because of higher infiltration rates
The climate situation during the monitoring period also is to be focus and part of the
interpretation Changes of groundwater level can be caused by different rates of groundwater
recharge as a consequence of different climate conditions
Recommendations on water monitoring in open-pit coal-mine areas in Mongolia (RWM)
42
Table 7 contains different types of hydraulic conditions The quantification of these conditions
can aid the interpretation of the monitoring results
Table 7 Overview of Hydraulic Conditions
Hydraulic Conditions Method for Quantifying
Precipitation Online-Data from climate stations measurement of
precipitation
Evaporation Online-Data from climate stations measurement of
evaporation from water bodies
Development of the mine Areas of claim (extensions date) Interpretation and
reports of monitoring results should include the
development of the mine during the monitoring period
The spatial development of the dewatering (construction of
well galleries) is to be documented
Development of the dewatering system of the
mine (well galleries pumping from ponds)
Rate well-specific (location depth) breaks of dewatering
begin and end of dewatering
Use of the water in the mine (process water
eg dust fixation irrigation)
Rates (Specific for location and date)
Water abstraction outside of the mine by
other users (eg water supply for livestock)
Rates (Specific for location and date)
Water infiltration (into the Aquifer) or input
(into lakes or ponds)
Rates (Specific for location and date)
Rates of fluids around of the mine Measurement of flow rates
Groundwater levels in and around of the mine Monitoring groundwater designation of water divides
Evaluation of the Hydraulic System
The hydraulic system of the mine is to be described and quantified Parameters for the hydraulic
system include water in- and outputs dewatering precipitation and evaporation among others
Water balances should then be established
The measurement estimation or calculation of parameters in the water cycle allows the
determination of the CWB The following equation describes a local water cycle
0 = P ndash ETP plusmn Qinout plusmn ∆S
where P is precipitation ETP is evapotranspiration Qinout are runoff recharge in- and outputs
(eg from wells) and ∆S is the change of storage volume The difference of precipitation and
evapotranspiration is called climate water balance (CWB)
CWB = P ndash ETP
The equation of the water cycle can be written as
0 = CWB plusmn Qinout plusmn ∆S
Dimension of the Catchment Area (Subterranean Basin)
The dimension of the catchment area is given by the following equation
Acatch = QOut GWR
where Acatch is the area of the catchment area [msup2] QOut the volumetric dewatering rate of the
mine [msup3s] and GWR is the groundwater recharge [msup3(msup2 s)]
Recommendations on water monitoring in open-pit coal-mine areas in Mongolia (RWM)
43
Validity Check Visualization and Interpretation of Water Quality
Measurements
1 Assessment of Outliers
Issue Validity check of analyses results
Goal Outlier change of water quality sampling or analysis errors
Data Requirements Time series of chemical parameters including electrical conductivity pH
and plotted concentration vs date of sampling
Method for the Interpretation of Deviations in a Time Series of Water Analysis Results
The quality of waters can naturally change over time or can be impacted by human activities
Concentration differences lower than 25 are natural in most cases If the difference is greater
than 25 the following causes are possible (a) a serious change of water quality based on
human activities (b) an error in the sampling or transport of samples or (c) an error in the
laboratory analysis
Methods for Comparison with Other Parameters
Comparison with other parameters such as electrical conductivity and pH-value gives two
possible results 1) In the case where the other parameter values have also changed that means
the change of water quality is real or the sampling was erroneous or 2) If one of the other
parameters didnrsquot change the analysis of the sample may have been erroneous The search for
errors can be identified by conducting laboratory quality assurance checks and repeating the
analyses for a retained sample If the results of the repeated analysis show the same result the
sampling is to be repeated a third time The water of the sample is to be analysed at two
different laboratories If these results yield the same concentration there has been a change in
the water quality
Result This method can estimate if a measured value (an outlier) is correct
indicating a change of quality of water or if the result is an error of
sampling or analyzation
Source DGFZ eV Dresdener Grundwasserforschungszentrum eV (GERMAN)
2 Exclusion of Ion Concentrations
Issue Validity check of analysis results
Goal Plausibility checks of analysis results
Data requirements Analysis results of O2 Fe2+ Mn2+ Ca2+ Mg2+ NO2- NH4- H2S NO3- pH-
value (doesnrsquot need to be complete)
Recommendations on water monitoring in open-pit coal-mine areas in Mongolia (RWM)
44
Method
The following concentrations exclude each other
O2 gt 5 mgl exclusion of Fe2+ Mn2+ NO2- NH4- gt 005 mgl H2S gt001 mgl
Fe2+ gt 02 mgl exclusion of NO3- gt 20 mgl
Mn2+ gt 02 mgl exclusion NO3- gt 20 mgl
H2S gt 01 mgl exclusion Fe2+ gt 01 mgl and Mn2+ gt 02 mgl
80 gt pH gt 55 exclusion of Ca2+ Mg2+ gt 1 mmoll
Result This method estimates if analysis results are correct
3 Charge Balance Error (CBE)
Issue Validity check of analysis results
Goal Check of analyses results or completeness of analyses
Data requirements Analysis results of all anions and cations with relevant concentrations
expressed in mol(eq)L
Method
One fundamental law of nature is that aqueous solutions (like water) are electrically neutral
This means that in real solutions the total sum of all the positive charges (cations) must equal
the total sum of all negative charges (anions)
Charge Balance sumcations = sumanions
Analytical errors andor unanalyzed constituents cause electrical imbalances One way to
quantify this imbalance is the charge balance error in percent
CBE = (sumcationsminussumanions)(sumcations+∣sumanions∣)times100
Interpretation of the Charge Balance Error (CBE)
CBE gt plusmn 5 analysis is incomplete (major ions are not measured) or incorrect the analyses are to
be repeated including those of additional (relevant) ions
negative CBE higher concentration of anions than of cations (not all relevant cations are analyzed)
positive CBE higher concentration of cations than of anions (not all relevant anions are analyzed)
using unfiltered samples that contain particulate matter which dissolve upon addition of acid (for
preservation purposes)
A suitable software-tool (freeware) for calculating CBE is
httpswwwlenntechcomcalculatorsaccuracyaccuracy-water-analysishtm
Recommendations on water monitoring in open-pit coal-mine areas in Mongolia (RWM)
45
4 Additional Validity Checks
Correlation of redundant parameters are to be given eg pH value or electrical
conductivity field measurement with laboratory measurement
Correlation of related parameters should be given eg electrical conductivity and
concentration of sulphate
The hydrochemical plausibility should be checked pH and concentration of the metal
ions
Chemical Characterization of Groundwater
The composition of the water is determined by the natural geogenic environment of the water
sources and chemical or biochemical reactions Knowing the sources of abstracted waters is
important for understanding the hydraulic system Possible sources may include precipitation
waters infiltrated waters from surface water bodies infiltrated waste water recharged
groundwater or fossil groundwater The following section shows some possibilities for
visualization of analyzed data from water samples This visualization allows the classification of
different water samples based on sources A special tool is the analysis and interpretation of
isotopes An estimation of the age of groundwater is possible with the results of this analysis For
more information on this topic consult the corresponding literature
1 Classification of the Water Sample by the Electrical Conductivity
Data Requirements Measured electrical conductivity
Method
Comparison of the measured values of the electrical conductivity with values from Table 8
Table 8 Conductivity for Different Types of Water
Type of Water Electrical Conductivity [microScm]
ldquopurerdquo water 0055
Distilled water lt3
Precipitation water 5 - 100
(natural uncontaminated) groundwater 100 ndash 1900
Drinking water 150 - 800
Mineral water 150 - 2000
Sea water (salt water) Round about 50 000
Result Information about the source of a water sample classification of different samples
Recommendations on water monitoring in open-pit coal-mine areas in Mongolia (RWM)
46
Graphical Tool for the Interpretation of Chemical Analyzes
The use of graphical tools can help illustrate the different types of water Different types of water
can indicate different sources (eg catchment areas different aquifers fossil groundwater)
1 Schoeller Plot
Issue Visualization and classification of water analysis results
Goal Classification of different water samples into groups
Data requirements Analysis results of anions and cations of diverse samples expressed in
mol(eq)L (advantage analyses can be incomplete)
Method
Major ion analyses (in milliequivalents per liter) can be plotted semi-logarithmically to indicate
different hydrochemical water types This plot is called Schoeller-plot The plot has the
advantages that unlike trilinear plots incomplete analyses can be used and real parameter
concentrations are displayed
Result Information as to whether there are the same or different (different
sources) types of water for different samples
2 Piperrsquos Trilinear Plot
Issue Visualization of results from water analyses classification typecast
Source GW-Chart (Freeware
httpswaterusgsgovnrpgwsoftwareGW_ChartGW_Charthtml)
Goal Classification of different water samples into groups
Data requirements complete() concentrations of Calcium Sodium Potassium Magnesium
Chloride Sulfate Hydrogen Carbonate and Carbonate expressed in
mol(eq)L
Carbonate can be calculated by the software itself using the water
temperature The TDS (total dissolved solids) are also respected in the
calculation The TDS-value can estimate by 05 ∙ electrical conductivity
Method
To see the changes in groundwater chemistry at different locations and the extent of water rock
interaction data for the ionic composition of the water samples were plotted for both the time
periods using a Piper Trilinear diagram as shown in Figure 8 Piper Diagrams are broadly used
in hydrogeology as they illustrate the hydro-chemical characteristics of groundwater by
representing the percentage of anions and cations (in meq L-1) in separate triangular diagrams
Geochemically-similar waters are clustered in clearly defined areas which indicates water
mixing phenomena precipitation dissolution etc The piper diagram can also be plotted with
the help of software
Recommendations on water monitoring in open-pit coal-mine areas in Mongolia (RWM)
47
Figure 8 Classification by Piper Plots
Source httpswwwhatarilabscom
Result Information about the type and source of water for different samples
Presentation of Data using the Valjashko Diagram
A system for the representation and classification of groundwater based on the ratio of the mean
ions and their hypothethesized dissolved salts on the basis of the publication by Valjashko
(1961) offers information on the origin of the water Compared to other methods (eg PIPER
(1944) or FURTAK amp LANGGUTH (1967)) the system allows for a better description and genetic
interpretation of the chemistry of groundwater The waters can be characterized in their genetic
position in the infiltration cycle and the influence of human activity or salt waters can be
identified
Evaluation of the Suitability of Waters for Different Uses
Drinking Water
The main aim of the water analyses is to evaluate the suitability of water for various uses such
as domestic use irrigation or industrial use In the last few decades there has been a
tremendous increase in the demand for fresh water due to rapid growth of population and the
accelerated pace of industrialization
Irrigation Water
The use of the pumped water for irrigation can be an important possibility for sustainable water
management However potential salinization of the soil limits the use of waters for irrigation
Recommendations on water monitoring in open-pit coal-mine areas in Mongolia (RWM)
48
The following interpretation gives information about the potential hazard of salinization
through salinity or sodium concentration of waters
The sodium adsorption ratio (SAR) is an irrigation-water-quality parameter used in the
management of sodium-affected soils It is an indicator of the suitability of water for use in
agricultural irrigation as determined from the concentrations of the main alkaline and earth
alkaline cations present in the water It is also a standard diagnostic parameter for the sodicity
hazard of a soil as determined from the analysis of pore waters extracted from the soil
Sodium Adsorption Ratio (SAR) Criterion
Sodium absorption ratio is the measurement of sodium content relative to calcium and
magnesium in the soil-water medium and influences soil properties and plant growth The total
soluble salt content of irrigation water is generally measured by determining its electrical
conductivity (EC) reported in microsiemens per centimeter The individual classes are defined
as EC lt 250 microScm ndash Low-Salinity-Water 250 lt EC lt 750 microScm ndash Medium-salinity-water 750 lt
EC lt 2250 microScm ndash high-salinity water and EC gt 2250 microScm ndash very high-salinity water
The sodium or alkali hazard in the use of water for irrigation is determined by the absolute and
relative concentration of cations and is expressed as the sodium adsorption ratio (SAR) The
following formula is used to calculate SAR
= $amp()
where the sodium calcium and magnesium concentrations are expressed in mmolL
The results are shown as a WILCOX-Plot as shown in Figure 9
Figure 9 WILCOX-Plot
Ions in the equation are expressed in milliequivalent per liter (meql) The salinity hazard was
between medium and high for most samples One sample indicated a very high hazard The
sodium hazard was low for the most samples and moderate for one sample
Recommendations on water monitoring in open-pit coal-mine areas in Mongolia (RWM)
49
8 Reporting
The documentation of hydrogeological studies (eg monitoring results) should contain the topics
outlined in the following checklist
Checklist Contents of Hydrogeological Studies
General information about mine company consulting company scoping area period of validity
Description of the study area
Description of monitoring program
Hydrogeological calculations (eg water balances prognoses scenarios)
Interpretation of results
Conclusions and additional measurements if necessary
Details about the several topics are given in Table 9
Table 9 Overview about the documentation of Hydrogeological Studies
Monitoring Results Hydrogeological Calculation
Chapter Content
1 General information
Name amp address of the mining company (incl respons person)
Name amp address of the consulting company name of the responsible specialist
Title of the document
Objective of the study
Name of the mining area and location of the mine (AIMAG coordinates)
Scoping area
Validity period
Name amp signature of the author (expert specialist)
2 Details of the Report
Contents
References
Objectives of the reportstudy
3 Description of the Study
Area
Morphology
Geology
HydrologyHydrography
HydrologyMeteorology
Mining activities (eg development of dewatering)
More details see below the Table 9
4 Water Monitoring
(Quality amp Quantity)
Description of the monitoring
Results of the monitoring
Documentation (values eg in tables Annex I Chapter 6)
Visualization of the results (hydrographs)
More details see below the Table 9
5 Hydrogeological
Calculations
Hydrogeological Calculation
Description of the calculation methodology modeling
Determination Calculation water cycle parameters surface runoff hypodermic
runoff storage change groundwater recharge etc
Identification of the water balances
More details see below the Table 9
6 Interpretation of the
Results of (a) Monitoring
Description of direct mining activities and the impact to groundwater levels surface
water levels or flow rates and groundwater recharge
Recommendations on water monitoring in open-pit coal-mine areas in Mongolia (RWM)
50
Chapter Content
or (b) Description of non-direct impacts of mining activities (eg water quality geotechnical
stability)
Evaluation of the impacts regarding mining safety water supply systems (wells)
groundwater reserve surface waters (rivers) and protected landscape areas
7 Conclusions -
Requested
Measurements
Groundwater drawdown andor groundwater barrage
Wells galleries of wells (measured and planned) pumping rates number and location
of wells placement the filters and advancement of dewatering
Dewatering of the open mine groundwater input into the open mine sealing walls
reach of groundwater drawdown (groundwater cone) water levels in mine dumps
potential level of the confined groundwater (below coal layer) flow rate and influx
via slopes
Surface water (dewatering change of riverbeds)
Change of flow rates artificial lakes etc
mining water cycle (water use for irrigation water fixation of dust)
water quality
Description of realization of requirements from the side of the authorities
Technical measures to minimize impact of mining dewatering and water output eg
treatment of the waters storage of the contaminated water
Adaption and development of water monitoring in future
The description of the study area includes the existing information and data
Morphology
Information about the morphology should contain data of the altitude and the terrain structure
The terrain structure is an indicator for glacial structures the surface runoff or the mining
activities If airborne laser scan data is available it can be plotted to give an overview about the
morphology
Geology
An overview of the geological situation gives a ldquostandard sectionrdquo It contains all existing layers
of the study area The different layers should be described in regard to their distribution
thickness and their characteristics (eg hydraulic characteristics) The layers can be classified
by geological processes or characteristics The different aquifers should be defined Fault zones
and fault lines should be described by their position characteristics and possible hydraulic
impact The visualization can be realised by mapping (distribution of layers) and cross sections
Hydrology
Information about meteorology should include time series averages and extreme values for
precipitation and evaporation This data is a base for calculating water balances The
interpretation of time series can give reasons behind eg of changes of water levels or flow rates
The base data of the meteorological measurement station (position altitude and distance from
study area) should be given
The hydrographic information includes the name of surface waters (flows standing water
bodies) data of measurement (time series of water levels andor flow rates) information about
the measurement stations with the basic values like (average) high- low- and mean- water or
flowrate) and existing uses of waters incl existing legal This basis information are important to
estimate possible impacts of mine activities to the surface waters
Recommendations on water monitoring in open-pit coal-mine areas in Mongolia (RWM)
51
Mining Activities
The aim is to give short information about the development of the mine eg of the explorations
dewatering system (time series of pumping rates depth of water levels) development of dumps
etc This information is important for explaining and understanding the monitoring results (eg
changes of groundwater levels) An overview of the results of former studies should be also
implemented
Description of the Water Monitoring
Components of the documentation of water monitoring are given in the following checklist
Checklist Documentation of Water Monitoring in Reports
Mapping all measurement points (monitoring wells measurement points for flow rates and water
level in surface waters and at the dewatering system of the mine)
Master data about groundwater monitoring wells screened aquifer
Time interval for level measurements and sampling
Tables containing the results of water level measurements and water sampling flow rates
Hydrographs for water levels and selected parameters of water quality
Mapping results ( Chapter 7)
Hydrogeological Calculations
Documentation of Hydrogeological Calculations should contain
the aims of calculation (eg development of the groundwater depression cone over the previous
years reduced volume of the groundwater body prognosis of pumping rates or water balances)
the methods used (eg analytical equations see Chapter 7 numerical models)
the parameters used (see Chapter 9 in the case of modelling)
results (eg mapping)
Recommendations on water monitoring in open-pit coal-mine areas in Mongolia (RWM)
52
9 Implementation of Monitoring Results into a Numerical
Flow Model
Conception of a Numerical Model
Basics
Prediction models of the quantity and impact of the mine dewatering are the basis for technical
and financial planning Knowledge of the impact of dewatering to the aquifer to water balances
and to the surface water bodies is important for the water authority and other users of the
water
Numerical models can be a suitable tool for calculation of scenarios and the future state of the
groundwater dynamic The validity of this calculation is given by the quality of the model The
model quality depends on the information about geology hydrogeology climate conditions
hydraulic boundary conditions (eg in-output flow rates) and the density and the validity of
monitoring results
Some general notes about numerical flow models
The results of a numerical model are not an alternative for the monitoring results
Every numerical model is made for a special task and for a specific region
Every model is designed using the individual experience of the modeller
The information about the design and the quality of the model is to take into consideration if
model results are be reviewed
Modelling is an iterative process that includes definition of goals grid construction and
assignment of properties and boundary conditions steady state and transient calibration
validation of calibrations predictive simulations and sensitivity analysis
Goals of the Numerical Flow Model
There are three major issues related to groundwater in mining projects that need to be
addressed 1) mine dewatering requirements 2) stability of slopes and 3) environmental
impacts on groundwater levels and on groundwater quality during mining and post-mining
periods
Knowing what we want from the model or the model results is one of the first steps of model
development Some common goals of numerical models include
Simulation of the current hydraulic processes (groundwater abstraction dewatering
progress of the mine infiltration from surface waters water input into a surface water)
Calculation of the current (maybe unknown) impacts of mine dewatering to the
groundwater table (groundwater bodies) other groundwater users Outputs are the
calculated change of the water volume over time of an aquifer maps of the differences of
the groundwater level or calculated hydrographs for (monitoring) wells
Recommendations on water monitoring in open-pit coal-mine areas in Mongolia (RWM)
53
Calculated prediction of future state passive inflow to the mine (both in space and time)
active dewatering options (if required) which means necessary abstraction rates
number of wells well-galleries drawdown cone around the mine during the progress of
the mine and the dewatering systems flow direction for determination of the potential
path lines of substance transport flow velocity impact to other groundwater users pore
pressures as input for sloperoof stability analysis (dumps)
Calculation of a post-mining state eg groundwater levels after dewatering water level
in the residual pit (artificial lake)
Calculation of scenerios impact of the design of the dewatering system eg number and
location of dewatering wells required pumping rate for each well ( optimization of
number of wells)
A numerical flow model can be the basis for a simple geochemical mixing model or a
more comprehensive solute transport model to predict quality of water discharge during
the mining or pit-lake water chemistry for post-mining conditions
The addition of further tasks and goals after establishing the numerical model can cause a lot of problems in most cases
Choosing the Method Solver and Software
Numerical groundwater flow models are based on groundwater flow equations which are
differential equations that can often be solved only by approximate methods using a numerical
analysis The most common numerical solutions are the finite difference method and the finite
element method An often-used software for finite difference method is MODFLOW (commercial
and free ware see Table 10) The commercial software FEFLOW (DHI Wasy
httpswwwmikepoweredbydhicomproductsfeflow) is known for the finite element
method
Finite Difference Method or Finite Element Method - Both methods are suitable for calculation
of dewatering in mining The advantages and disadvantages of each numerical method are not
discussed here Each mine and each dewatering system are unique That some general basics are
to be respected as described below
General Notes
3D-Model transient flow groundwater generally flows into open mines three-dimensionally and
variably through time the groundwater system (Aquifer Aquiclude) can only be characterized by a
3D-Model in the most cases
Dewatered mines are characterized by high hydraulic gradients The discritization and solver
should be adapted to meet these conditions
Rewetting option A suitable water balance (eg the required pumping rate) can calculate if a dry
(dewatered) model cell can be rewetted in the numerical process
Modeling of mine dewatering isnlsquot focused on the unsaturated (vadoze) zone in the most cases
A small selection of suitable software for numerical models can be found in the following table
Recommendations on water monitoring in open-pit coal-mine areas in Mongolia (RWM)
54
Table 10 Examples for Suitable Software for Numerical Models
Name Source Description
MODFLOW 2005
httpswwwusgsgovsoftwaremodflow-2005-usgs-three-
dimensional-finite-difference-ground-water-model
three-dimensional-finite-difference-
ground-water-model
MODFLOW OWHM
httpswaterusgsgovogwmodflow-owhm
Borden Carter Gaur Anju Singh Chabungbam R 2016 Water
Resource Software Application Overview and Review World Bank
Washington DC copy World Bank
httpsopenknowledgeworldbankorghandle1098624762 License CC BY 30 IGO
(httphdlhandlenet1098624762)
MODFLOW OWHM (bases on
Modflow-2005 Unification of all
developed tools)
MODFLOW 6
httpswwwusgsgovsoftwaremodflow-6-usgs-modular-
hydrologic-model
Hanson RT Boyce SE Schmid Wolfgang Hughes JD Mehl
SM Leake SA Maddock Thomas III and Niswonger RG
2014 One-Water Hydrologic Flow Model (MODFLOW-OWHM)
US Geological Survey Techniques and Methods 6-A51 120 p
httpdxdoiorg103133tm6A51
MODFLOW6 Parallel developement
to Modflow 2005 Modflow 6 donrsquot
replace Modflow 2005
ModelMuse-A graphical user interface for MODFLOW-2005
httpswwwusgsgovsoftwaremodelmuse-a-graphical-user-
interface-groundwater-models
Winston RB 2009 and PHAST US Geological Survey
Techniques and Methods 6-A29 52 p
MODELMUSE is an open source tool
and recommended for pre- amp
postprocessing (all versions of
Modflow)
FLOWPY
httpsmodflowpygithubioflopydocintroductionhtml
Bakker M Post V Langevin C D Hughes J D White J T
Starn J J and Fienen M N 2016 Scripting MODFLOW Model
Development Using Python and FloPy Groundwater v 54 p 733ndash
739 doi101111gwat12413
FLOWPY is an open source tool and
recommended as additional tool to
modflow (Python-based)
FREEWAT
httpwwwfreewateusoftware-0
Rossetto R De Filippis G Borsi I Foglia L Cannata M Criollo
R Vaacutezquez-Suntildeeacute E 2018 Integrating free and open source tools
and distributed modelling codes in GIS environment for data-
based groundwater management Environmental Modelling amp
Software 107210-230
for pre- und postprocessing in
combination with QGIS FREEWAT
(not for all types of MODFLOW)
Extent of the Model (Temporal and Spatial)
Most of the processes involved are time-related That means a transient flow model is to be
established in the most cases The time before any mining activity should be the ldquostartrdquo of the
simulation period The ldquoendrdquo is defined by the tasks and goals of the model For example after
dewatering the groundwater levels increase and a post-mining quasi-steady-state (only
seasonal impacts to the groundwater level) will be reached a few decades after dewatering The
maximal time increments are given by the modeled processes (change of time related boundary
conditions period of calculation) Time increments of days (between 1 d to 30 d) are
recommended for this type of modeling The duration of the calculation is proportional to the
number of time increments
Recommendations on water monitoring in open-pit coal-mine areas in Mongolia (RWM)
55
Tips for Design of the Horizontal Extent of the Model
The processes to be simulated in connection with the mine must not be influenced by the external
boundary conditions (which are to be defined at the borders of the model)
A simple rule of practice is it is better that the model area is too large than too small
Modeling the whole (subterranean) catchment area The external boundary conditions of the
model are no-flow conditions (groundwater divides) given by hydraulic barriers
Bordering the model at known stable water levels like surface water levels of lakes or known
groundwater levels both outside of the maxima of the range of dewatering
If the subterranean catchment area is completely unknown and if there are no stable known
boundary conditions an estimation of the model extent is possible using the groundwater
recharge and the abstraction rate of dewatering The rate of dewatering gives the necessary size
of the catchment area The model area is to be larger than this because the spatial direction is
unknown
The vertical extension includes all relevant layers aquifers and aquicludes
The cell size is smaller (eg 1m ndash 100 m) in the focussed area and larger outside of it (gt100 m) in
the most cases
Implementation of Boundary Conditions
Hydraulic boundary conditions are water divide dewatering and infiltration wells surface
water bodies (lakes ponds) or streams with hydraulic contact to the aquifer groundwater
recharge and water levels (outside of the focused area) For detailed information see eg
httpswaterusgsgovnrpgwsoftwareModelMuseHelpindexhtmlboundaryconditions5ht
m
Implementation of Monitoring Results
The results of the water monitoring will be used for the calibration and validation of the
numerical model The model calibration means the minimization of the difference between
calculated and measured water levels (potential levels flow rates of fluids) by modification of
the model structure or its parametrization and modification of the boundary conditions
The quality of a numerical model can be shown by
comparing measured and calculated groundwater levels potential levels flow rates (eg
using a scatter-plot)
calculating the statistical parameters (eg mean error root mean square deviation
normalized root mean square deviation)
comparing the measured and calculated hydrographs and
mapping the difference between measured and calculated values
Recommendations on water monitoring in open-pit coal-mine areas in Mongolia (RWM)
56
Evaluation of Model Results
An evaluation of model results can be supported by answering the following questions of the
three parts a) quality of the used database b) validity and results of calibration and c)
plausibility of modeling
Questions for the Evaluation of Model Results
Are there validity databases for the description of the hydrogeological structure and
characteristics the hydraulic boundary conditions and monitoring results
Are the monitoring results clearly allocable in space and time
Are the relevant processes identified and quantified
Are the implemented boundary conditions plausible and sufficiently unrestrictive Are the
boundary conditions chosen to have a minimal impact on key model outcomes How is this
ascertained
Are all available types of observations (water levels flow rates) used for calibration
Is the model calibrated to steady-state pre-mining and transient (initial mine dewatering pump
tests etc) conditions
Are there graphs showing modeled and observed hydrographs at an appropriate scale Follow the
calculated values in the observed trend
Are calibration statistics reported and illustrated in a reasonable manner Is the model sufficiently
calibrated (spatially temporally) Are the calibrated parameters plausible Are the water volumes
and fluxes in the water balance realistic
Are the model predictions designed in a manner that meets the model objectives
Are the scenarios defined in accordance with the model objectives and confidence level
classification Are the pumping stresses similar in magnitude to those of the calibrated model Are
well losses accounted for when estimating maximum pumping rates per well If not Is there
reference made to the associated reduction in model confidence Are the pumping rates assigned
in the input files equal to the modeled pumping rates
Are there any anomalous boundary fluxes due to superposition of head dependent sinks (eg
evapotranspiration) on head dependent boundary cells (Type 1 or 3 boundary conditions) Does
predicted seepage to or from a river exceed measured or expected river flow
Is some qualitative or quantitative measure of uncertainty associated with the prediction reported
together with the prediction Are the sources of uncertainty discussed
Recommendations on water monitoring in open-pit coal-mine areas in Mongolia (RWM)
57
Reporting of Numerical Models
Numerical modeling is an iterative process over month to years Often only the modelers use the
numerical model with all details of in- and output data It isnrsquot possible to check all databases in
the implemented kind (input data files) for example That means the documentation of the
model is the most important way to control model assumptions and model results and to
evaluate the model That means all input data assumptions and results of the calculation
should be containing in the documentation of the model
Checklist Must-haves of Documentation Concerning Numerical Flow Model and Model Results
The model objectives and model confidence level classification have to been clearly stated Are the
objectives satisfied
Definition of space and period (eg flow of groundwater of the aquifers XY within the catchment
area of mine Z from pre-mining until post-mining state)
Description of the conceptional model Is the conceptual model consistent with objectives and
confidence level classification
Description and citation of the used data base and information base
Description of the design of the structure model discritizaion of the space cell size numbers of
model layers parametrization (eg mappimg of the implemented values hydraulic conductivity
the storage coefficient effective and total porosity anisotropy)
Description of the design of boundary conditions discretication of time mapping of the used
types of boundary conditions (including groundwater recharge) and detailed description (time
constant time variable values) mapping of the initial heads of water level (groundwater surface
water)
Information about the method used (finite difference method finite elemnte method) the
software and the solver
Description of the calibration process (a) analysis of the sensitive parameters (calc hydrographs
by different rates of groundwater recharge or hydraulic conductivity anisotropy of hydraulic
parameters) (b) measurement values for the comparision with modeled results (measured
groundwater levels of monitoring wells measured flow rates) (c) results of calibration (differences
between calculated and observed values and its distribution in space and time verbal discussion
of these results (causes of differences is the calibration satisfactory)
Results of the validation
Description of the basics (eg boundary conditions) for the calculation of prognosis andor
scenarios (eg change the number or pumping rates of dewatering wells)
Results of the calculation (mapping) and verbal discussion Are the results plausible Evaluation of
the uncertinity Is the model fit for its purpose
Further useful information about numerical flow modeling documentation of models and evaluation
of models are given at the following pages (in English language)
Recommendations on water monitoring in open-pit coal-mine areas in Mongolia (RWM)
58
About Modeling
ftpftpccrsnrcangccaadEMSAnitaGW_articlesgrwater_modelpdf
Documentation of Models
httpspubsusgsgovtm06a55tm6a55pdf
Evaluation of Models
httpspubsusgsgovsir20045038PDFSIR20045038part2pdf
httpsconsultationdplhwagovaucommunications14d86ef9supporting_documentsCompaniontomod
ellingguidelinespdf
Recommendations on water monitoring in open-pit coal-mine areas in Mongolia (RWM)
59
10 Audit Evaluation and Optimization of Monitoring
Auditing the monitoring program means evaluating and reviewing the methods used in the
monitoring program and identifying additional information required It is important to
recognize that the environmental and water management requirements and driving forces
change from time to time and methods of monitoring improve Monitoring programs must
therefore be updatedmodifiedimproved regularly to reflect these changes or modifications in
practices and procedures The rationalization of the monitoring program is also required to
ensure that the program remains effective and properly focused and that it does not entail
excessive costs
The evaluation of a monitoring program includes
Training of the staff
Certification (Staff laboratory techniques of measurement)
Accreditation of the laboratory
Standardizations (proceedings compliance management)
ISO 14001
Recommendations on water monitoring in open-pit coal-mine areas in Mongolia (RWM)
60
Specific Glossary
Unconfined Aquifer An aquifer which is not overlain by any confining layer but has a
confining layer at its bottom is called unconfined aquifer It is normally exposed to the
atmosphere and its upper portion is partly saturated with water The upper surface of
saturation is called the water table which is under atmospheric pressure Therefore this aquifer
is also called phreatic aquifer
Perched Aquifer This is a special case of an unconfined aquifer This type of aquifer occurs
when an impervious or relatively impervious layer of limited area in the form of a lens is located
in the water-bearing unconfined aquifer The water storage created above the lens is the
perched aquifer and its top layer is called perched water table
Confined Aquifer Also called artesian aquifer this is a type of aquifer overlain as well as
underlain by confining layers The water within the aquifer is therefore held under pressure It
is also sometimes called pressure aquifer If the aquifer has high outcrop laterally then the
ground surface there will have a positive hydrostatic pressure creating the conditions for a
flowing well Water from such well comes to the surface without pumping The imaginary level
up to which the water will rise is called piezometric surface
Leaky Aquifer In nature truly confined aquifers are rare because the confining layers are not
completely impervious An aquifer that is overlain or underlain by a semi-pervious layer
(aquitard) through which vertical leakage takes place due to head difference is called leaky
aquifer or semi-confined aquifer The permeability of the semi-confining layer is usually very
small compared to the permeability of the main aquifer Thus the water which seeps vertically
through the semi-confining layer is diverted internally to proceed horizontally in the main
aquifer
FracturedFissured Rock Aquifer Fractured rock aquifers (bedrock crystalline rock hard
rock and basement) have limited storage capability and transports water along planar breaks
Aquitard A body of rock or stratum of sediment that retards but does not prevent the flow of
groundwater from one aquifer to another
Aquiclude (or aquifuge) is a solid impermeable area underlying or overlying an aquifer
Porosity In soil mechanics and hydrology porosity is defined as the ratio of volume of voids to
the total volume of porous medium The significance of the porosity is that it gives the idea of
water storage capacity in the aquifer Qualitatively porosity less than 5 is considered small
between 5 and 20 as medium and above 20 is considered large
Hydraulic Conductivity is a property of soils and rocks that describes the ease with which a
fluid (usually water) can move through pore spaces or fractures It depends on the intrinsic
permeability of the material the degree of saturation and on the density and viscosity of the
fluid Saturated hydraulic conductivity Ksat describes water movement through saturated media
By definition hydraulic conductivity is the ratio of velocity to hydraulic gradient indicating
permeability of porous media
Recommendations on water monitoring in open-pit coal-mine areas in Mongolia (RWM)
61
The water cycle also known as the hydrologic cycle or the hydrological cycle describes the
continuous movement of water on above and below the surface of the Earth
Groundwater recharge also known as deep drainage or deep percolation is a hydrologic
process where water moves downward from surface water to groundwater Recharge is the
primary method through which water enters an aquifer This process usually occurs in the
vadose zone below plant roots and is often expressed as a flux to the water table surface
Groundwater recharge also encompasses water moving away from the water table further into
the saturated zone Recharge occurs both naturally (through the water cycle) and through
anthropogenic processes (ie artificial groundwater recharge) where rainwater and or
reclaimed water is routed to the subsurface
Climatic Water Balance (CWB) The climatic water balance (CWB) is defined as the difference
between precipitation depth and the depth of potential evapotranspiration at a given site during
a certain time period
Groundwater Monitoring Wells (GWM) Groundwater management point groundwater
observation well both are common synonyms
Water Quantity in this document means water level flow rates and water volume
Groundwater surface Groundwater table pressure table (in case of confined groundwater) are
common synonyms
Recommendations on water monitoring in open-pit coal-mine areas in Mongolia (RWM)
62
Annexes
I Forms
Table I-1 Example for the Documentation of a Monitoring Well
UNIT Example 1 Example 2 Example 3
Number Name of the measurement
point -- 4500123 HY-45-2018 000789 (73L)
ID (well borehole)
Owner of the well
Coordinate Northing -- 5712345 5745678 5756789
Coordinate Easting -- 5412345 5445678 5456789
Location (Aimag village mine)
Elevation (terrain level) -- 10757 11229 10944
Elevation of well head [m asl] 10761 11237 10951
Name of the hydraulic connected
aquifer -- 100 300 111
Water level pressure level [m asl] 10635 10960 10804
Diameter of the casing [mm] 115 115 115
Drilling Method dry Dry dry
Diameter of the borehole [mm] 324 324 324
Bottom of the monitoring well [m asl] 10181 10330 10200
Screen (top ndash bottom) [m asl] 10221 ndash 10201
Material of
construction
blank casing sump
pipe -- PVC-U PE-HD PE-HD
tube of the screen -- PVC-U PE-HD EWD
Length of the
casing
blank casing [m] 540 300 150
tube of the screen [m] 20 20 30
sump pipe [m] 20 10 20
Thickness of filter sand filter gravel [m] 30 30 40
Recommendations on water monitoring in open-pit coal-mine areas in Mongolia (RWM)
63
annulus sand barrier (between
filter sand and clay
seal)
[m] 10 10 10
clay seal [m] 30 100 30
filling sand [m] 510 190 120
Data logger yesno --
Water sampling yesno
Remarks Examples no water no
access observation well destroyed
maintenance repair necessary
Recommendations on water monitoring in open-pit coal-mine areas in Mongolia (RWM)
64
Table I-2 Form for a Water Sample (source LMBV mbH Merkblatt Montanhydrologisches
Monitoring 2019)
JOURNAL for Sampling of Groundwater
Date Time Sample-Ndeg
Object Client
NameNumber
of Moni well
Other Ndeg
Position Easting Northing
Type of Moni Well Single Well
Bundle of Monitoring wells
(please mark) group Construction Material
Measurm point [m asl] Diameter of the Casing cm
Position of screen bottom
Date Level of GW
[m below MP]
top
1 pump m
2 pump m
Depth of the
moni well Constr [m] 3 pump m
sonded [m]
Before sampling
m
After sampling
m
Zone of Sampling mixture Depth of the sample [m]
top central bottom
Type of Sampling Dopple pump
Centrifugal pump
cock suction drawing
Pumping Rate
[Lmin]
Duration [min]
Volume
[msup3]
Analysis in
Field
Temperature of GW [degC]
Air-Temperature
[degC]
pH-Value [-]
el Conductivity [microScm]
Oxygen [mgl]
Redox potential UG1) UH2)
[mV]
perceptions clear white grey yellow Brown
Recommendations on water monitoring in open-pit coal-mine areas in Mongolia (RWM)
65
At the sample Color
no low medium strong
Turbidity
no aromatic putrid sanious chemical
Odor
yes no yes no Chlorine Mineral oil
Out gasing Deposit
Vessel Glass light dark Plastic
Conservation
See
Documentation
cooler refrigerator Date Time
Transportstorage
Delivery
to the
lab
Remarks
Institution
(stamp)
Sampler
(signature)
Recommendations on water monitoring in open-pit coal-mine areas in Mongolia (RWM)
66
II Technical Details
Table II-1 Construction Details for Monitoring Wells (Water Level and Water Quality)
Construction Diameter Pipe Inner Diameter ge DN 50 (2) for water level measurements pipe inner
Diameter ge DN 100 (4rdquo) for water sampling wells
Material of Construction HDPE PVC-U
Length of the Filter Pipe 1- 2 m (in special cases this can also be longer)
Filter Size and Filter Filling
Based on the on-site wet sieving the following filling diameter and filter gap
size are recommended
Composition of the
Aquifer Filling Diameter [mm] Filter Gap Size [mm]
Middle sand and
fine sand fraction 071 - 125 05
Course sand 20 -- 315 15
Solid rock 20 -- 315 15
The use of gravel adhesive filters is excluded In principle the groundwater
measuring well has to be backfilled with a bulk pipe
Length of the fill material should be from about 05 m under the lower edge
of the filter up to about 05 m over the upper edge of the filter
Length of the Counterfilter about 05 m on both sides in direct contact with the upper and lower filter
material
Seals in the Annular Space
1 m (through geophysical methods localizable)
Bothsides in direct contact with the counterfilter as well as 10 m (or
completely) sealed of drilled aquicludes
A missing or incorrectly installed seal can cause a hydraulic short circuit
between hydraulically separated aquifers In doing so the functionality of the
drainage system of the mine can be impaired Furthermore a water
exchange of different aquifers can cause a mixture of different water
qualities Water samples from not right-sealed monitoring wells are not
useable
Sump pipe 1 m with bottom plate
Bottom Closure
Protecting pipe construction as measuring well head ldquohooksrdquo against the
throwing in of solids pouring in of fluids secure cap closure
Installation with spacers and pouring pipe (should be carried along during installation)
Recommendations on water monitoring in open-pit coal-mine areas in Mongolia (RWM)
67
Table II-2 Overview of the Recommended Processes for the Functionality Test of Groundwater
Measuring Points
Analysis Method Parameters to be Measured and Recorded Application Hard (H)
or Loose (L) Rock
Camera Inspection (OPT) Depth profile of the visual contamination of
the inner construction
H L
Caliper and Microcaliper Log (CAL-M) Depth inspection of the inner diameter H L
Gamma Ray Log (GR) Depth profile of the natural radioactivity H L
Gamma-Gamma Log (GG) Depth profile of gamma radiation dispersion
in the rock (Conclusions about back-filling
density)
H L
Neutron-Neutron Log (NN) Depth profile of the neutrons after the
deceleration of fast neutrons (Conclusions
about porosity through the hydrogen
content)
H L
Magnetic-Log (MAG) Depth profile of magnetic susceptibility of
the backfill
Predominately H
Resistance measurement in focused
configuration (FEL)
Depth profile of the electrical backfill
resistance
Predominantly H
Short Pump Trial (KPV) Time-profile of the groundwater level
decrease and pump-out rate
Predominantly L
Packer Flow Meter Measurement
(FW-PACK)
Depth-dependence of the groundwater flow
rate in the groundwater measuring well
H L
Measuring the Salinity (SAL) and
Temperature (TEMP)
Depth profile of the salinity and temperature
of the groundwater in the measuring well
H L
OPTIONAL Filling Test Time profile of the decrease after water
filling the groundwater measuring well
L
OPTIONAL 12-hour well
performance test (like observation
well test)
Dependence of the groundwater level
decrease on the pump flow rate in the
measuring well
L
Recommendations on water monitoring in open-pit coal-mine areas in Mongolia (RWM)
68
Table II-3 Calculation of Flow Rates for Measurement Weirs (Rectangular and V-Notch)
Rectangular
Weir
Q = 23 ∙ micro ∙ b ∙ (2∙g)12 ∙ (he +00011)32
Q = discharge [msup3s]
g = gravitational acceleration (g = 981
ms2)
he = head on the weir [m] measured in
a distance of
3 x he to 4 x he behind the weir
b = length of the weir [m]
micro = weir coefficient micro = 062 sharp
with air ventilation
micro = 05 wide sharp without air
ventilation
Triangular (V-
notch) Weir
Q = 815 ∙ micro ∙ tan(α2) ∙ (2∙g)12 ∙ (he)52
Q = discharge [msup3s]
g = gravitational acceleration (g =
981 ms2)
he = head on the weir [m] measured
in a distance of
3 x he to 4 x he behind the weir
b = length of the weir [m]
micro = weir coefficient micro = 062 sharp
with air ventilation micro = 05 wide
sharp without air ventilation
if α = 90deg than
Q = 1352∙he2483 [msup3s]
preconditions
005 m lt he lt ca 04
Hew lt 04 hebo lt 02 w gt 045 m
Recommendations on water monitoring in open-pit coal-mine areas in Mongolia (RWM)
69
Table II-4 Purge Volume Determination (VP) of the Water Sampling
The Purge Volume Determination (VP) is carried out by calculating the hydraulic criteria and by
measuring the chemical criteria
Hydraulic Criteria
The purge volume can be calculated by the equation
VP = n π4 dsup2 h
With
h = length of water column in the screen of the well [m]
d = diameter of well (borehole) in [m]
V = volume of water [msup3]
n= volume factor
n ge 15 in [17] n = 3 to n = 5
If the pump is installed more than one meter above screen this additional distance is
to be added to the value of h
Chemical Parameter
Stabilization Criteria
Achievement of the chemical stability criteria is the guarantee for a homogeneous
water sample Otherwise the sample would represent a mixture from different
waters and a mixture doesnrsquot represent the quality of the water from the aquifer
With respect to the groundwater chemistry an adequate purge is achieved when the
pH of the groundwater has stabilized within plusmn 01 the specific conductance within plusmn
5 and the turbidity has either stabilized or is below 10 nephelometric turbidity
units (NTUs) The temperature of the groundwater is not suitable for proof the
chemical stability criterion because it changes too rapidily during sampling
especially in extreme climatic regions This data should be noted in the field log
during sampling see ANNEX I Table I-2
For these analyses the pumped volume shouldnrsquot be too high because in this case
the water sample can represent another zone of the aquifer (eg deeperhigher
layers)
Recommendations on water monitoring in open-pit coal-mine areas in Mongolia (RWM)
70
Table II-5 Parameters of Analysis of Water Samples (eg ldquo0-measurementrdquo)
Parameter Groundwater Surface Water Water of streams and in the pit
Quantity
Water level x x x
Flow rate x
Quality
pH-Value x x x
Electrical Conductivity x x x
Oxygen x x x
Redox-potential x x x
Acidity x x x
Alcality x x x
Fe (II) x x x
Sulphate x x x
Sulfide (x)
Chloride x x x
o-Phospate x x x
Phosphate (all) x x x
nitrate x x x
nitrite x
Ammonium x x x
Hardness (total) x x x
Carbonate hardness x x x
DOC X
TOC x x
TIC X X X
Dry residual x
Calium x x x
Sodium x x x
Calcium x x x
Magnese x x x
Manganese x x x
Phytoplancton x
Zoo-Plancton x
Depth of visibility x
Depth profile x
Turbidity x
Recommendations on water monitoring in open-pit coal-mine areas in Mongolia (RWM)
71
Table II-6 Type of Sample-Flagons and Reagents for the StabilizationConservation of Water
Samples
Parameter Type of sample flagons
and reagents
Method for chemical
stabilizationconservation of water
samples
Coloring (SAK-436) turbidity
(TEF) SAK-254 Ammonium
nitrate nitrite calcium
magnesium sulphate chloride
Glass Polyethylene cooling
Oxygen (Winkler) acid-base
capacity phosphate
Glass with grinding
borosilicate glass full plug
cooling
Bore borate silicate sodium
potassium fluoride
Polyethylene cooling
Cyanides Polyethylene pH-Value 9-12 by input NaOH
recommendations of the laboratory
Metal ions (Al Ag As Ba B Ca
Cd Co Cr Cu Fe Li Mg Mn Mo
Ni Pb Sb Si Sr Ti Tl U V Zn)
Polyethylene FEP acidify by HNO3 to pHlt2 for analyzing
of dissolved metal ions filtration in field
(membrane filter 045 microm)
mercury borosilicate glass acidify by HNO3 to pHlt2 add-on
K2Cr2O7 (005)
DOC TOC Brown glass cooling
Recommendations on water monitoring in open-pit coal-mine areas in Mongolia (RWM)
72
III Supporting Websites
Table III-1 Some Online Sources of Basis Information about Geology and Hydrogeology
Topic Website
Hydrogeology httpswwwcommdevorgwp-contentuploads201505IFC008_PPT_
Community_Rev1_FINAL_MON_250517pdf
Water httpirimhenamemgovmnindexphp
httpeicmnwater
httpraisesuiritsukubaacjpnewpressyoushi_sugita9pdf
httpeicmngeodata httpeicmnsurfwater
Meteorology amp
Hydrology
httpirimhenamemgovmnuploadfilesButeel_35-2015pdf
httpeicmnclimate
httpwwwtsag-agaargovmnatmosphere
httpwwwsteelhouseinfoindexphpmn94294-mongolian-weather
Geology httpirimhenamemgovmnuploadfilesButeel_35-2015pdf
Aquifers httpwwweicmngroundwater
httpwwweicmnwaterbasin
httpwwweicmngroundwaterdepositinfo_morephpgid=52
Groundwater
Recharge
httpeicmngroundwatergisphp
httpwwwewa-onlineeuyoung-water-professionals-
conferencehtmlfile=tl
_files_mediacontentdocuments_pdfEvents2016IFAT202016115
0_Sunjimaapdf
Water Basins httpeicmngroundwatergisphp
httpwwwiwrm-
momodedownloadAndrewKausDissertation2018pdf
Groundwater
Monitoring
httpwwwgroundwatermn
httpwwwewa-onlineeuyoung-water-professionals-conference
htmlfile=tl_files_mediacontentdocuments_pdfEvents2016IFAT2
020161150_Sunjimaapdf
Norms httpgreenassessmentmnuploadfiles
httpwwwmnemnwp-contentuploads201709Tailan-pdf-last-1-
ilovepdf-compressed-ilovepdf-compressedpdf
httpswwwcommdevorgwp-
contentuploads201505IFC008_PPT_Community_Rev1_FINAL_MON_250517pdf
Recommendations on water monitoring in open-pit coal-mine areas in Mongolia (RWM)
73
IV Mining Water in Mongolian Laws
(Extractions)
The Law of Mongolia on Water (2012) is one of the most important environmental laws
Especially for the mining sector the law plays an integral role However the current
legislation is only poorly linked to the mining objectives Therefore authorities might
experience difficulties in the decision-making process The specific interaction and
compatibility should be checked and special attention must be paid to ambiguous cases
Art 46 The cabinet members in charge of nature and environment establish a water
resource council and approve the rules and regulations
Water Monitoring Art 6 amp 25 Water monitoring-research network The State
Administrative Central Organization in charge of nature and environment is supposed to
establish and maintain a water monitoring research-integrated network Organizations
and economic entities such as mining companies are a component of this network
Article 8 The State Great Hural (parliament of Mongolia) has the power to determine the
fees for water usage and water pollution
Article 17 The duties and powers of the basin administration include receiving
applications from citizens economic entities and organizations for well and hole drilling
as well as channel and canal building for the purpose of water usage to make
conclusions on water use on the basis of water resource management plans and in
accordance to 284 of the present law and to enter new wells into a database
Additionally the basin administration defines the grounds for water usage and water
pollution fee in accordance with the relevant legislation monitors the potential usable
water resources and water utilization at basin area regularly Licenses for mineral
exploration and exploitation in the relevant basin shall be granted based on the
recommendation of the relevant basin administration
Article 19 The respective soum (second level subdivision below the aimags (province of
Mongolia)) has the power to charge the water usage and pollution fees in accordance
with the legislation and to supervise its payment
The basin councilrsquos tasks are to monitor whether the water user is fulfilling its obligation
set out in article 30 of the present law to monitor whether the water user is fulfilling its
duty to reduce negative impacts elimination of damage and rehabilitation work
Article 21 A license for professional institutions can be issued by the State
Administrative Central Organizations in charge of nature and environment for a period
of five years and could be extended for another five years if the institution fulfilled its
duty in a proper way
Article 24 Protection of water resource against contamination The basin administration
can issue a permit to entities engaged in waste water removal with a quantity exceeding
500 m3 per day or contaminated waste water specified in 10112 of the present law The
governors of the soum and district may also issue permits However only when the
Recommendations on water monitoring in open-pit coal-mine areas in Mongolia (RWM)
74
volume of waste water per does not exceed 50 m3 In case of disregarding of the norms
specified in the permit or repeatedly disregarding the standard procedures the permit
might be subject to cancellation
Article 25 Payment and compensation for water pollution and depletion The permit
holder is responsible for the supervision of the quantity and the quality of the waste
water and the discharge of it after having met the standard requirements The holder is
furthermore liable to pay a water contamination fee If treatments do not meet standard
requirements the permit holder might be subject to a water pollution compensation
which has to be paid to the environment protection fund Water pollution and water
depletion fees are determined according to the law
Water utilization Article 27 and 28 Issuing permission to water users Permissions for
well and hole drilling and digging of channels and canals are issued by the aimag capital
city environment authority Applications to obtain a permit need to be submitted to that
authority and needs to document ie the following information Purpose and volume of
water usage copy of proof of land ownership possession and use information
regarding the wells The aimag capital city environment authority registers the wells and
holes in the water database and issues well passports
Citizens economic entities and organizations need to submit the water usage request to
a legal person specified in 284 of the present law The following documents need to be
annexed to the request A map indicating the water source to be used and its location
exploration and survey reports of water and mineral water resources quality
composition and conclusion on potential usable resources amount of water to be used
per day and its purpose drawings and project of water facilities production capacity
technical and economic indications environmental impact assessment documents In
case of the utilization of water for strategically important mineral deposits the permit
should be valid throughout the duration of the exploitation license
Article 31 Water usage fees Upon usage of water fees are charged which are set by the
law In case of usage of water exceeding the permitrsquos volume escalated rates up to 50
may apply The state administrative central organization will determine the exact rate
which the government needs to approve
Recommendations on water monitoring in open-pit coal-mine areas in Mongolia (RWM)
75
V Regulations concerning Water Monitoring and Water Management in
Mongolian Standards (MNS)
Mongolian standards are stored in httpgreenassessmentmn and httpwwwmnemn
Table V-1 Regulations about water monitoring and water management in Mongolian Standards (MNS)
Task Mongolian Standard (MNS)
Environmental protection and
hydrology general
requirements
MNS 334288 Groundwater protection General requirements Replaced by
MNS 33421982 General requirements for protection of groundwater from
pollution contamination
MNS 0017-1-1-101979 Water use and protection Terms and definition
MNS 0017-1-1-141980 Hydrosphere Classification of water use General
requirements
Water quality general
requirements
MNS 45861998 Water environmental quality General requirements
MNS 49432000 Water quality Waste water
MNS 4943-2011 Effluent treated waste water (Max content of polluting
substances in the waste water released to open nature monitoring
requirements during operation)
MNS 6148-2010 water quality Maximum limit of substance contaminating
the groundwater
MNS 9002005 Environment The human health protection Security Drinking
water Hygienic requirements and quality control
MNS 25731978 Environmental protection Hydrosphere Water quality
indicators
Surface water quality
monitoring procedure
MNS 404788 Environmental protection Hydrosphere
Water sampling MNS (ISO) 48671999 Water quality Sampling Part 3 Recommendation of
sample preparation and storage
MNS (ISO) 5667-12002 Water Quality Sampling Part 1 Guidance on the
design of sampling programs
MNS (ISO) 5667-22001 Water Quality Sampling Part 2Guidance on
sampling techniques
MNS (ISO) 5667-42001 Water Quality Sampling Part 4 Guidance on
sampling procedure of natural lake and reservoir
MNS (ISO) 5667-102001 Water Quality Sampling Part 10 Guidance on
waste water sampling procedure
MNS (ISO) 5667-112000 Water quality Sampling Part 11 Guidance on
groundwater sampling
MNS (ISO) 5667-132001 Water Quality Sampling Part 13 Guidance on
waste water and water treatment facility sludge sampling procedure
Water sampling analysis MNS (ISO) 110832001 Environment Water Quality Determination of
chromium (VI) uing spectrometric method (15-diphenylcarbazide)
MNS 50322001 Water quality Determination of heavy metals using the
Rontgen fluorescence method
MNS (ISO) 119232001 Water quality Determination of suspended solids by
filtration through glass (fibre filters)
MNS (ISO) 48891999 Water quality Determination of electrical conductivity
MNS 44201997 Drinking water Determination of mercury Atomic
absorption method
MNS 44302005 Drinking water Determination of measuring iron
compounds
MNS 43411996 Industrial water Determination of magnesium
concentration
MNS 43481996 Industrial water Determination of copper
Recommendations on water monitoring in open-pit coal-mine areas in Mongolia (RWM)
76
Task Mongolian Standard (MNS)
MNS 44312005 Drinking water Determination of nitrite concentration
MNS 42171994 Drinking water Determination of total nitrate concentration
MNS 39351986 Drinking water General requirement for field testing of
water
MNS 39361986 Drinking water Field analysis methods
MNS 39001986 Drinking water Determination of taste color smell and
turbidity
MNS 39001986 Drinking water Determination of taste color smell and
turbidity
MNS 35321983 Surface water Determination of lead content
MNS 0017-1-5-151980 Environmental protection Hydrosphere
Determination method of oil products in water
MNS 44231997 Drinking water Method of measuring dry residue
MNS 25701978 Method of measuring water purity
MNS 40791988 Water quality terms and definition
MNS (ISO) 78872000 Water quality Determination method of water color
and its checking
MNS 57902007 Water quality Determination of manganese (Mn)
concentration
MNS (ISO) 48171999 Water quality Determination of ammonium
MNS (ISO) 79802003 Water quality Determination of calcium and
magnesium through atom absorption spectrometer method
MNS (ISO) 58142005 Water quality Determination of dissolved oxygen
concentration Electric chemistry method
MNS (ISO) 60602001 Water quality Determination of chemical oxygen
demand
MNS (ISO) 92802001 Water quality Determination of sulphate by barium
chlorine gravimetric method
MNS (ISO) 105232001 Water quality Determination of pH
MNS 56662006 Water biological properties Assessment Determination
method of active sludge of waste water treatment facility
MNS 56682006 Water biological properties assessment Microbiological
analysis method of waste water