Embed Size (px)
Citation preview

Reconciliation Report
in accordance with Ofcom’s Direction under section 49 of the Communications Act
2003 and SMP Services Conditions 13A.4 and 8A.4 setting the requirements in
relation to the reconciliation report
2 December 2015
Contents
Page 1
Reconciliation Report in accordance with Ofcom’s Direction under section 49 of
the Communications Act 2003 and SMP Services Conditions 13A.4 and 8A.4
Section 1 Introduction to the Reconciliation Report ............................................................. 3
Section 1.1 – Introduction ............................................................................................... 4
Section 1.2 – Overall structure of the report .................................................................... 4
Methodology reversals 2015 narrative ....................................................................... 5
Error corrections 2014 narrative ................................................................................ 5
Annex 1 - Methodology reversals 2015 impacts ......................................................... 5
Annex 2 - Error corrections 2014 impacts ................................................................. 5
Section 2 Statement of Responsibility .................................................................................. 7
Section 2.1 Statement of Responsibility .......................................................................... 8
Section 3 Audit Report......................................................................................................... 9
Report of the Independent Auditors to British Telecommunications plc and Ofcom. ...... 10
Section 4 Reconciliation report requirements and content - methodologies ....................... 13
Section 4.1 – BT’s reporting requirements in respect of changes to methodologies ....... 14
Section 4.2 – differences between the Change Control Notification and this
Reconciliation Report .................................................................................................... 14
Section 4.2.1 – Changes not reversed in this Reconciliation Report .......................... 14
Section 4.2.2 – Changes to methodologies in the Change Control Notification ......... 15
Section 5 Explanation of methodology changes made in the revised 2015 RFS .................. 18
Section 5.1 – Methodology reversal impacts summary .................................................. 19
Section 5.2 – Implementation of Regulatory Asset Valuation ........................................ 21
Section 5.3 – 21CN future benefits ............................................................................... 22
Section 5.4 – Allocation of Digital Subscriber Line Access Multiplexer costs between
Market A and Market B .................................................................................................. 23
Section 5.5 – Testing Access Matrix system and Evolutionary Testing Access Matrix asset
life changes ................................................................................................................... 24
Section 5.6 – Cumulo rebate allocation ......................................................................... 25
Section 5.7 – Duct and Fibre allocations to 21CN ......................................................... 26
Section 5.8 – Changes to cost code and sector mappings .............................................. 27
Section 5.9 – Changes to duct cost attribution to NGA tie cables .................................. 29
Section 5.10 – Combined fault and service attribution – utilisation factor changes....... 30
Section 5.11 – Other methodology changes ................................................................. 31
Section 6 Reconciliation report requirements and content – error corrections ................... 33
Section 6.1 – BT’s reporting requirements in respect of changes to methodologies ...... 34
Section 7 Explanation of reported material error corrections ............................................. 35
Section 7.1 – Error correction impacts summary ........................................................... 36
Section 7.2 – Siteconnect Revenue Corrections ............................................................ 38
Section 7.3 – Access fibre - fibres per bearer ................................................................ 39
Section 7.4 – 21CN Ethernet volumes .......................................................................... 40
Section 7.5 – Access cards unit costs ............................................................................ 41
Section 7.6 – Misallocation of Except for Payphones costs............................................ 42
Section 7.7 – SDH plant group to component model..................................................... 43
Section 7.8 – ECC cost component rationalisation ......................................................... 44
Section 7.9 – PPC volumes ............................................................................................ 45
Section 7.10 – WBC internal/external volumes split ...................................................... 46
Section 7.11 – Non-geographic call termination .......................................................... 47
Section 7.12 – Ethernet services ................................................................................... 48
Section 7.13 – Call origination volumes ........................................................................ 49
Section 7.14 – Ethernet accruals .................................................................................. 50
Section 7.15 – OSA Main Links ..................................................................................... 51

Contents
Page 2
Section 7.16 – BT Wholesale cost of sales transfer charges ............................................ 52
Annex 1 Methodology reversal schedules 2015 ............. (published as a separate document)
Section 1 – The illustrative difference of individual methodology changes on costs and
MCE attributed to individual markets (as per section 5.1)
Section 2 – Comparison of the consolidated market results as reported for the year ended
31 March 2015 to the results for those markets had certain changes to attribution and
valuation methodologies not been applied
Section 3 – Comparison of the attribution of wholesale current costs and wholesale
current cost mean capital employed by individual markets as reported for the year ended
31 March 2015 to the results had certain changes to the attribution and valuation
methodologies not been applied
Section 4 – Comparison of the Fully Allocated Cost results of individual markets as
reported for the year ended 31 March 2015, to the results for those markets had certain
changes to the attribution and valuation methodologies not been applied
Section 5 – Comparison of the Network Activity Statement as reported for the year ended
31 March 2015 to the Network Activity Statement had certain changes to the attribution
and valuation methodologies not been applied
Annex 2 Error correction schedules 2014 ….................. (published as a separate document)
Section 1 – The illustrative difference of individual error corrections on costs and MCE
attributed to individual markets (as per section 7.1)
Section 2 – Comparison of the consolidated market results as reported for the year ended
31 March 2014 to the results for those markets had certain error corrections been made
Section 3 – Comparison of the attribution of wholesale current costs and wholesale
current cost mean capital employed by individual markets as reported for the year ended
31 March 2014 to the results for those markets had certain error corrections been made
Section 4 – Compareison of the Fully Allocated Cost results of the individual markets at a
service level as reported for the year ended 31 March 2014, to the results for those
markets had certain errors been corrected
Section 5 – Comparison of the Network Activity Statement as reported for the year ended
31 March 2014 to the Network Activity Statement had certain errors been corrected.

Section 1 – Introduction to the Reconciliation Report
Page 3
Section 1
Introduction to the Reconciliation Report

Section 1 – Introduction to the Reconciliation Report
Page 4
Section 1.1 – Introduction
Ofcom’s Regulatory Financial Reporting Statement of 20 May 2014 directed BT to
prepare a reconciliation report as referred to in condition 8 and as directed by
Ofcom from time to time (the “Reconciliation Report”). This Reconciliation Report
is published in accordance with Ofcom’s Direction under section 49 of the
Communications Act 2003 and SMP Services Conditions 13A.4 and 8A.4
(Directions for Regulatory Financial Reporting, Ofcom Statement of 30 March
2015, Annex 5) (the “30 March 2015 Direction”).
British Telecommunications plc (the “Company”) has, by agreement with BT Group
plc, prepared the Current Cost Financial Statements referred to in this report in
accordance with its Accounting Methodology Documentation and the Regulatory
Accounting Principles set by Ofcom, by disaggregating balances recorded in the
general ledgers and other accounting records of the Group.
This Reconciliation Report sets out changes to regulatory accounting
methodologies for 2014-15 and the impact of such changes on the revised
Current Cost Financial Statements 2015 published on 2 December 2015 (the
“revised 2015 RFS”). This report also sets out the impact of errors subsequently
identified in our Current Cost Financial Statements 2014 published on 15 August
2014 (the “2014 RFS”).
The basis of preparation of this Reconciliation Report is consistent with the basis of
preparation of the revised 2015 RFS and of the 2014 RFS as stated in each of
these RFS, except for the adjustments of methodologies and the corrections of
errors set out in sections 4, 5, 6 and 7 of this report.
For the purposes of this report, Ofcom requires methodology changes and errors to
be included where they are estimated to have an impact of more than the higher of
5% or £1m on any figure in the RFS.
The direction requires BT to publish the reconciliation report by 31 July 2015 (SMP
Conditions 8 and 23). This publication deadline was missed. This Reconciliation
Report has been published on 2 December 2015.
We note that in the revised 2015 RFS there were certain methodology changes
and error corrections that necessitated a restatement of the prior year 2013-14
comparative information. These changes are explained within the revised 2015
RFS in the basis of preparation, along with the main impact upon wholesale
markets. It is noteworthy that not all methodology changes required by Ofcom to
be included in this report are also considered material for the purposes of restating
our 2013-14 results, due to the application of lower materiality thresholds
imposed by Ofcom for this report.
The Reconciliation Report is not a replacement for, nor should it be regarded as an
alternative to, BT’s published revised 2015 RFS. The Reconciliation Report is a
description of the methodology changes detailed in the Reconciliation Report and
an illustration or view of the revised 2015 RFS had those Statements been
produced using 2013-14 methodologies.
We note that due to the complex nature of the report, figures in the impacts
sections are individually rounded to the nearest relevant unit (e.g. £m). Totals and
sub-totals are calculated based on these rounded figures, but average prices are
not. As a result minor summation inconsistencies may arise between schedules.
Minor differences between average costs may exist between “published” and
“methodology reversal” or “error correction” schedules where there are no
apparent changes to fully allocated costs (FAC). These differences are more
pronounced on low volume services and are solely the result of non-material
movements in costs which are eliminated on rounding.
Section 1.2 – Overall structure of the report
The Report follows the structure and layout requested by Ofcom. A description of
each section is provided below:
Section 2 – BT’s directors Statement of Responsibility which
acknowledges that this report has been prepared in accordance with the
30 March 2015 Direction and based upon the published revised 2015
RFS and the 2014 RFS.
Section 3 – provides our auditors’ opinions on the Reconciliation Report,
for both changes made to methodologies and the correction of errors.

Section 1 – Introduction to the Reconciliation Report
Page 5
Methodology reversals 2015 narrative
Section 4 – sets out the reporting requirements for this Reconciliation
Report with regards to methodology reversals and compares this to the
methodology changes set out in the “Change Control Notification in
accordance with SMP Condition 21 of Ofcom’s Regulatory Financial
Reporting Final Statement published on 20 May 2014” published on 31
March 2015 (“Change Control Notification”). We identify here any
differences between the two reports and the reasons for these
differences.
Section 5 – provides an explanation of the reported methodology changes
made in the revised 2015 RFS which have been reversed as part of this
report along with a summary of their impact.
Error corrections 2014 narrative
Section 6 – sets out the reporting requirements for this Reconciliation
Report with regards to the correction of errors subsequently identified in
the 2014 RFS.
Section 7 – provides an explanation of the reported error corrections
along with a summary of their impact.
Annex 1 - Methodology reversals 2015 impacts
Published as a separate document on our website is the methodology reversal
section of this report. This includes the following subsections:
Methodology reversal impacts section 1 – provides the illustrative
difference of individual methodology changes on costs and mean capital
employed (MCE) attributed to individual Fixed Access Markets, Business
Connectivity Markets, Narrowband Markets, Wholesale Broadband Access
Market and the Wholesale Residual Market (as per section 5.1).
Methodology reversal impacts section 2 – compares the consolidated
results of the Fixed Access Markets, Business Connectivity Markets,
Narrowband Markets, Wholesale Broadband Access Market and the
Wholesale Residual Market as reported for the year ended 31 March
2015, to the results for those markets had certain changes to attribution
and valuation methodologies not been applied.
Methodology reversal impacts section 3 – compares the attribution of
wholesale current costs and wholesale current cost MCE by individual
Fixed Access Markets, Business Connectivity Markets, Narrowband
Markets, Wholesale Broadband Access Market and the Wholesale
Residual Market as reported for the year ended 31 March 2015, to the
results had certain changes to the attribution and valuation
methodologies not been applied. Methodology reversal impacts section 4
– compares the Fully Allocated Cost results of the individual Fixed Access
Markets, Business Connectivity Markets, Narrowband Markets, Wholesale
Broadband Access Markets at a service level as reported for the year
ended 31 March 2015, to the results for those markets had certain
changes to the attribution and valuation methodologies not been applied.
Methodology reversal impacts section 5 – compares the Network Activity
Statement as reported for the year ended 31 March 2015 to the Network
Activity Statement had certain changes to the attribution and valuation
methodologies not been applied.
Annex 2 - Error corrections 2014 impacts
Published as a separate document on our website is the error correction section of
this report. This includes the following subsections:
Error correction impacts section 1 – provides the illustrative difference of
individual error corrections on costs and MCE attributed to individual
Fixed Access Markets, Business Connectivity Markets, Narrowband
Markets, Wholesale Broadband Access Markets and the Wholesale
Residual Market (as per section 7.1).
Error correction impacts section 2 – compares the consolidated results of
the Fixed Access Markets, Business Connectivity Markets, Narrowband
Markets, Wholesale Broadband Access Markets and the Wholesale
Residual Market as reported for the year ended 31 March 2014, to the
results for those markets had certain error corrections been made.

Section 1 – Introduction to the Reconciliation Report
Page 6
Error correction impacts section 3 – compares the attribution of
wholesale current costs and wholesale current cost MCE by individual
Fixed Access Markets, Business Connectivity Markets, Narrowband
Markets, Wholesale Broadband Access Markets and the Wholesale
Residual Market as reported for the year ended 31 March 2014, to the
results for those markets had certain error corrections been made.Error
correction impacts section 4 – compares the Fully Allocated Cost results of
the individual Fixed Access Markets, Business Connectivity Markets,
Narrowband Markets, Wholesale Broadband Access Markets at a service
level as reported for the year ended 31 March 2014, to the results for
those markets had certain errors been corrected.
Error correction impacts section 5 – compares the Network Activity
Statement as reported for the year ended 31 March 2014 to the Network
Activity Statement had certain errors been corrected.

Section 2 – Statement of Responsibility
Page 7
Section 2
Statement of Responsibility

Section 2 – Statement of Responsibility
Page 8
Section 2.1 Statement of Responsibility
Ofcom’s Regulatory Financial Reporting Statement of 20 May 2014 directed BT to
prepare a reconciliation report as referred to in condition 8 and as directed by
Ofcom from time to time (the “Reconciliation Report”). This Reconciliation Report
is published in accordance with Ofcom’s Direction under section 49 of the
Communications Act 2003 and SMP Services Conditions 13A.4 and 8A.4
(Directions for Regulatory Financial Reporting, Ofcom Statement of 30 March
2015, Annex 5) (the “30 March 2015 Direction”).
British Telecommunications plc (the “Company”) has, by agreement with BT Group
plc, prepared the Current Cost Financial Statements referred to in this report in
accordance with its Accounting Methodology Documentation and the Regulatory
Accounting Principles set by Ofcom, by disaggregating balances recorded in the
general ledgers and other accounting records of the Group.
This Reconciliation Report addresses the impact of methodology changes made
during the 2014-15 year upon the the revised Current Cost Financial Statements
2015 published on [day] December 2015 (the “revised 2015 RFS”). It also
addresses the impact of errors identified subsequent to publishing the Current Cost
Financial Statements 2014 published on 15 August 2014 (the “2014 RFS”).
The directors confirm to the best of their knowledge that the Reconciliation Report
for the year ended 31 March 2015 has been prepared in accordance with the 30
March 2015 Direction based upon the revised 2015 RFS and upon the 2014 RFS.
The directors are responsible for the maintenance and integrity of the corporate
and financial information included on the Company’s website. The work carried out
by the auditors does not involve consideration of these matters and, accordingly,
we recognise that the auditors accept no responsibility for any changes that may
have occurred to the Reconciliation Report since it was initially presented on the
website. Legislation in the United Kingdom governing the preparation and
dissemination of financial statements may differ from legislation in other
jurisdictions.
Approved by the Board of Directors and signed on its behalf by:
Glyn Parry
Director, British Telecommunications plc
2 December 2015

Section 3 – Audit Report
Page 9
Section 3
Audit Report

Section 3 – Audit Report
Page 10
Report of the Independent Auditors to British Telecommunications plc and
Ofcom issued in accordance with the Ofcom’s Direction dated 20 May 2014
under section 49 of the Communications Act 2003 and SMP Services Conditions
13A.4 and 8A.4 setting requirements in relation to the Reconciliation Report as
amended by the subsequent notifications and directions issued by Ofcom
following consultation as set out below.
1. We have examined the “2015 Reconciliation Report in accordance with Ofcom’s
Direction under section 49 of the Communications Act 2003 and SMP Services
Conditions 13A.4 and 8A.4 setting out requirements in relation to the
reconciliation report” (the “Reconciliation Report”)
2. The Reconciliation Report is prepared by British Telecommunications plc (the
“Company”) under the current cost convention in accordance with:
the “Regulatory Financial Reporting” statement issued by Ofcom on 20
May 2014 and the “Directions for Regulatory Financial Reporting” issued
by Ofcom on 30 March 2015 (together the “Final Statements and
Notifications”);
in respect of information for the year ended 31 March 2015, the
Accounting Methodology Documents and the Wholesale Catalogue dated
31 July 2015 and the methodology changes described in sections 4 and 5
on pages 13 to 32 (the “2015 Basis of Preparation”);
in respect of information for the year ended 31 March 2014, the basis of
preparation described in Sections 6 and 7 on pages 33 to 52 which
incorporates the Primary Accounting Documents dated 15 August 2014,
the Secondary Accounting Documents, namely; the Detailed Attribution
Methods; the Detailed Valuation Methodology and the Wholesale
Catalogue each dated 15 August 2014 (the “2014 Basis of Preparation”).
3. The Reconciliation Report comprises the following:
the Introduction to the Reconciliation Report on pages 3 to 6;
the Reconciliation report requirements and content – methodologies, the
Explanation of methodology changes made in the revised 2015 RFS, the
Reconciliation report requirements and content – error corrections and
the Explanation of reported material error corrections on pages 13 to 52
Annex 1 Section 1 - The illustrative difference of individual methodology
changes on costs and MCE attributed to individual markets;
Annex 1 Sections 2 to 5 - Comparison of the results as reported for the
year ended 31 March 2015 to the results had certain changes to
attribution and valuation methodologies not been applied (the “2015
Methodology Change Schedules”)
Annex 2 Section 1 – The illustrative difference of individual error
corrections on costs and MCE attributed to individual markets; and
Annex 2 Sections 2 to 5 - Comparison of the results as reported for the
year ended 31 March 2014 to the results for those markets had certain
error corrections been made (the “2014 Error Correction Schedules”).
Directors’ responsibility for the Reconciliation Report
4. As described on page 8 the directors are responsible for preparing and approving
the Reconciliation Report.
Auditors’ Responsibility
5. Our responsibility is to audit and express an opinion on the 2015 Methodology
Change Schedules and the 2014 Error Correction Schedules in accordance with the
Final Statements and Notifications, applicable law and International Standards on
Auditing (UK and Ireland) (“ISAs (UK & Ireland)”). Those standards require us to
comply with the Auditing Practices Board’s Ethical Standards for Auditors. This
report, including the opinions, has been prepared for and only for the Company and
Ofcom and for no other purpose. We do not, in giving these opinions, accept or
assume responsibility for any other purpose or to any other person to whom this
report is shown or into whose hands it may come save where expressly agreed by
our prior consent in writing.

Section 3 – Audit Report
Page 11
6. We report our opinions as to whether:
the 2015 Methodology Change Schedules as a whole are properly
prepared in accordance with the 2015 Basis of Preparation and comply
with the requirements of the Final Statements and Notifications. We do
not report on the preparation of any individual market group or market,
or on the impact of individual methodology changes.
the 2014 Error Correction Schedules as a whole are properly prepared in
accordance with the 2014 Basis of Preparation and comply with the
requirements of the Final Statements and Notifications. We do not report
on the preparation of any individual market group or market, or on the
impact of individual error corrections.
7. In addition, we report if in our opinion, the Company has not kept proper
accounting records, if we have not received all the information and explanations
we require for our examination, or if information specified by the form and content
requirements of the Final Statements and Notifications is not disclosed.
8. We read the financial and non-financial information presented in the
Reconciliation Report to identify material inconsistencies with the 2015
Methodology Change Schedules and 2014 Error Correction Schedules and to
identify any information that is apparently materially incorrect based on, or
materially inconsistent with, the knowledge acquired by us in the course of
performing the examination. If we become aware of any apparent material
misstatements or inconsistencies we consider the implications for our report. The
other information in the Reconciliation Report comprises Section 1 - Introduction
to the Reconciliation Report on pages 3 to 6, Section 4 - Reconciliation report
requirements and content – methodologies, Section 5 - Explanation of
methodology changes made in the revised 2015 RFS, Section 6 - Reconciliation
report requirements and content – error corrections and Section 7 - Explanation of
reported material error corrections on pages 13 to 52, Annex 1 Section 1 - The
illustrative difference of individual methodology changes on costs and MCE
attributed to individual markets and Annex 2 Section 1 - The illustrative difference
of individual error corrections on costs and MCE attributed to individual markets.
Basis for opinions
9. As explained in Section 1.1 on page 4 the Company has, by agreement with BT
Group plc, its ultimate parent company, prepared the Reconciliation Report by
disaggregating balances recorded in the general ledgers and other accounting
records of BT Group plc and its subsidiaries ("the Group") maintained in accordance
with the Companies Act 2006 and used, in accordance with that Act, for the
preparation of the Company's statutory consolidated financial statements for the
years ended 31 March 2015 and 31 March 2014 ("the Statutory Financial
Statements").
10. PricewaterhouseCoopers LLP audited the Statutory Financial Statements on
which they expressed unmodified audit opinions. Their audit report on the
Statutory Financial Statements describes the scope of their audit of those
Statutory Financial Statements.
11. In conducting our subsequent examination of the Reconciliation Report, and in
providing the opinions in paragraph 13 below, we have not performed any
additional tests of the transactions and balances which are recorded in the general
ledgers and other accounting records beyond those already performed for the
purpose of the audits of the Statutory Financial Statements.
12. Having regard to the above:
a) we conducted our examination of the Reconciliation Report in accordance
with International Standards on Auditing (UK and Ireland) issued by the
Auditing Practices Board. Our work involved obtaining evidence about the
amounts and disclosures in the Reconciliation Report.
b) we planned and performed our examination of the Reconciliation Report
so as to obtain all the information and explanations which we considered

Section 3 – Audit Report
Page 12
necessary in order to provide us with sufficient evidence to give
reasonable assurance that the 2015 Methodology Change Schedules as a
whole are properly prepared in accordance with the 2015 Basis of
Preparation and that the 2014 Error Correction Schedules as a whole are
properly prepared in accordance with the 2014 Basis of Preparation. In
forming our opinion we also evaluated the overall adequacy of the
presentation of information in the Reconciliation Report in accordance
with the form and content requirements of the Final Statements and
Notifications.
Opinions
13. In our opinion:
a) the 2015 Methodology Change Schedules as a whole have been properly
prepared in accordance with the 2015 Basis of Preparation and comply
with the requirements of the Final Statements and Notifications; and
b) the 2014 Error Correction schedules as a whole have been properly
prepared in accordance with the 2014 Basis of Preparation and comply
with the requirements of the Final Statements and Notifications.
PricewaterhouseCoopers LLP
Chartered Accountants and Registered Auditors
London

Section 4 – Reconciliation report requirements and content - methodologies
Page 13
Section 4
Reconciliation report requirements and content - methodologies

Section 4 – Reconciliation report requirements and content - methodologies
Page 14
Section 4.1 – BT’s reporting requirements in respect of changes to
methodologies
We have been directed to prepare this Reconciliation Report in accordance with
Ofcom’s Direction under section 49 of the Communications Act 2003 and SMP
Services Conditions 13A.4 and 8A.4. The Direction was issued in Annex 5 of
Ofcom’s Directions for Regulatory Financial Reporting (30 March 2015).
The 30 March 2015 Direction provides that BT must prepare a reconciliation
report which sets out:
“i. In relation to changes to the Regulatory Accounting Methodology:
a) each and every change;
b) the impact of all changes on all figures presented in the Regulatory Financial
Statements, by setting out, on an aggregated basis, the difference between the
Current Year Figures and the Current Year Figures had such changes not been
made, expressed as an absolute amount and as a percentage change;
c) the impact of each Material Change at the Markets and Technical Areas Level, by
setting out, for each Material Change separately, the difference between the
Current Year Figures and the Current Year Figures had such Material Change not
been made, expressed as an absolute amount and as a percentage change;
d) the impact of changes which are not Material Changes at the Markets and
Technical Areas Level, by setting out, on an aggregated basis, the difference
between the Current Year Figures and the Current Year Figures had such changes
not been made, expressed as an absolute amount and as a percentage change;”
“Material Change” is defined as follows:
“‘Material Change’ means a change in any element of the Regulatory Accounting
Methodology which results in a change (be it positive or negative) in any figure in
the Regulatory Financial Statements which exceeds the higher of 5% or £1 million.
The percentage change in a figure shall be calculated by taking the value of the
affected figure before the change in the Regulatory Accounting Methodology is
applied, and subtracting from it, the value of the same figure after the change in
the Regulatory Accounting Methodology is applied, and then dividing this result by
the former value;”
We published the ‘Change Control Notification in accordance with SMP Condition
21 of Ofcom’s Regulatory Financial Reporting Final Statement published on 20
May 2014’ (the “Change Control Notification”) on 31 March 2015. In the Change
Control Notification we published a list of each and every methodology change (as
defined by Ofcom) we planned to make for the year ended 31 March 2015.
This Reconciliation Report follows from the Change Control Notification and the
additional changes described below and looks in detail at the impacts of 2014-15
methodology changes by comparing them with how the RFS would look if we had
applied 2013-14 methodologies, using 2014-15 data (e.g. volumes and prices).
Section 4.2 – differences between the Change Control Notification
and this Reconciliation Report
There are some differences between the Change Control Notification and the
Reconciliation Report. These differences and reasons for these are detailed below.
Section 4.2.1 – Changes not reversed in this Reconciliation Report
Market definition changes
In any instance where we have made changes to market definitions as identified in
the Change Control Notification, these have not been reversed in this
Reconciliation Report. We do not consider that these represent a change to our
methodology beyond the presentation of revenues, costs and assets in different
markets. The following change references in the Change Control Notification are
those which have not been reversed on this basis:
3.1 Wholesale Broadband Access Market Structure
3.2 Wholesale Line Access Market Structure
3.3 Wholesale Analogue Exchange Line Services Market Structure
3.4 Internal Ethernet Backhaul Direct and Optical Network Backhaul
Services

Section 4 – Reconciliation report requirements and content - methodologies
Page 15
3.15 IPStream volumes and reporting (note that this was included as a
methodology change in the Change Control Notification, but was
implemented to ensure that our market structure for IPStream aligns with
the charge controls and sub-caps outlined by Ofcom in the Direction.)
3.19 Featurenet volume reclassification
3.27 64kBit/s Trunk out of Low TISBO into Trunk (note that this was
included as a methodology change in the Change Control Notification, but
it only changes where costs, revenues and assets are reported and is not a
change of how we attribute costs. We therefore believe it is appropriate
to treat it as a change to market definition).
Other changes
There are several non-material changes which we included in our Change Control
Notification but which we have not reversed in this report. These, and the
associated rationale for them not being reversed, are discussed in detail in section
5.10.
Section 4.2.2 – Changes to methodologies in the Change Control
Notification
There were a number of changes to our methodologies made after 31 March 2015
and which were included in the revised 2015 RFS. The circumstances of such
changes were:
It was not possible to update our methodologies by 31 March 2015 to
reflect the final Ofcom decisions on regulatory accounting methodologies
in “Directions for Regulatory Financial Reporting” issued on 30 March
2015. We had made changes in line with Ofcom’s consultation on
changes to our methodologies but these were not exactly in line with
Ofcom’s final requirements. In these circumstances, we are required to
make certain methodology changes to ensure compliance with the Final
Statements and Notifications.
We have notified Ofcom, via an exchange of letters, of certain
methodology changes made after 31 March 2015 which are to be
considered as if they were included in the Change Control Notification of
31 March 2015.
Further changes to our methodologies were made as a result of
notifications from our auditors to make sure that errors would not be
introduced into the Current Cost Financial Statements.
Lastly, the presentation of some changes within the Change Control
Notification were clarified or amended.
Each of these post 31 March 2015 methodology changes is described in turn:
Changes made to comply with Ofcom’s 30 March 2015 Direction:
Regulatory Asset Valuation (RAV): We proposed in the Change Control
Notification (section 3.7) to apply RAV in full to copper cables. We
changed this to comply with Ofcom’s Direction, which set out that the
RAV adjustment should not be applied to Copper and only to Access Duct.
A description of the revised RAV methodology – which has been reversed
as part of this Reconciliation Report - is in Section 5.1.
Cumulo rebate allocation: We proposed in the Change Control Notification
(section 3.12) to use data from the 2014 RFS to derive the weighting
element of the Profit Weighted Net Replacement Costs for Cumulo. We
changed this to use component weighted average cost of capital for the
profit weighting element, as set out in Ofcom’s Direction. A description of
the revised Cumulo rebate allocation methodology – which has been
reversed as part of this Reconciliation Report - is in Section 5.5.
BDUK: We made a minor change to create a new plant group and
component which covers all government grants and not BDUK areas only.
This plant group and component only includes the grants received.
Time Related Charges, ISDN30, PSTN Transfers, BES 1000MB Rentals
Internal WECLA, splitting co-mingling rentals between basket and non-
basket services (and implementing associated revenue changes to the
WLA/WFAEL markets): Ofcom directed certain changes to service
reporting which required that these services be reported in the
WFAEL/WLA market. We had not made this change prior to 31 March
2015, but in order to comply with the direction we did so in the revised

Section 4 – Reconciliation report requirements and content - methodologies
Page 16
2015 RFS. These changes were not included in the Change Control
Notification. These changes have not been reversed as part of this
Reconciliation Report as we consider them to be market definition
changes, the treatment of such items has been explained in Section 4.2.1.
Changes notified to Ofcom to be considered as within the 31 March 2015
Change Control Notification report
NGA tie cables: We changed how we attribute duct costs to NGA tie cables
so that it is attributed on the basis of the cumulative capital expenditure
on duct associated with NGA. It was previously attributed to NGA tie
cables based upon the depreciation on the NGA capital expenditure on
duct in the year. This change is described in Section 5.8 of this report.
NGA Development: We changed how we attribute development spend for
NGA between Fibre to the Cabinet (FTTC) and Fibre to the Premises (FTTP)
so that it is on the basis of NGA development spend (it was previously
based on volumes). There was no impact upon figures reported in the
2014-15 RFS and therefore no reversal necessary in this report.
We decided to withdraw the proposed change BT Technology, Service &
Operations Electricity - new methodology for Public Switched Telephone
Network. [Change Control Notification - section 3.20]. In the Change
Control Notification we identified that we would implement a new
methodology for Public Switched Telephone Network power cost
attribution. As a result there is no methodology to reverse in this report.
Following notification from our auditors to avoid the introduction of errors into
the RFS
As changes made to avoid error in the revised 2015 RFS these changes have not
been reversed in this Reconciliation Report. On this basis the final methodology
changes included in the revised 2015 RFS which are reversed in this report are
described in Section 5 below. Where these changes have been identified as
impacting the 2013-14 comparative information they have been included in the
error section of this report, with the section references included below.
7.8 PPC volumes: Internal and external Partial and Private Circuit volumes
are sourced from the Core Transmission costing system (CTCS). We
identified that in 2014-15 local end and main link volumes were
overstated in CTCS due to a number of circuits recorded as live in the
system which are actually ceased and hence not billable. We therefore
used Geneva Genius (billing system) data to produce the revised 2015
RFS.
7.12 Call origination volumes: Non-geographic call origination volumes
were historically retrieved via a system called Powerhouse, which queries
an underlying call data system called CSCS. We identified that Call
origination volumes, sourced directly from CSCS, which we submit to
Ofcom on a quarterly basis are more accurate and lower than those from
Powerhouse. We therefore used CSCS data to populate the revised 2015
RFS.
3.28 ECC component rationalisation: As part of the rationalisation of
components we identified several areas where ECC credits were mis-
mapped and adjusted for this accordingly. We believe this represents the
correction of an error and not a change to our methodology.
Presentational and other clarifications of methodologies within our Change
Control Notification
In some instances we were required to make changes to the methodologies as
reported in the Change Control Notification, either to present the impacts of the
change in more detail, to correct minor errors in the impact analysis, or to no longer
implement the change as described. Where these changes have impacted this
report the relevant section reference has been included.
7.10 Non-geographic call termination reporting: We reported this change
as a market definition change in the Change Control Notification. We have
since determined that as this change should have been effective before
2014-15, its implementation this year represented the correction of an
error. Consequently we reported the change in the error section of this
report. [Change Control Notification – Section 3.5]

Section 4 – Reconciliation report requirements and content - methodologies
Page 17
5.6 Duct and Fibre allocations to 21CN: In this report we split out the
impacts of changes to Fibre to be separate from the impacts of changes to
Duct. Consequently there are two illustrated impacts for this change in
methodology reversal impacts section 1, the net of which relates to the
entry in the Change Control Notification. We further note that the net
impact presented in the Change Control Notification was overstated. We
have corrected this impact for this report with minor impacts to all
markets. [Change Control Notification – Section 3.14]
[5.10] Review of BT Wholesale Managed Services cost allocations: The
impact analysis in the Change Control Notification contained an error. We
have adjusted for this in this report. The impact analysis in the Change
Control Notification showed movements in WBA Market A, but in the
revision the only impact is to Low Bandwidth TISBO. [Change Control
Notification – Section 3.26]
[7.9] Wholesale Broadband Connect (WBC) internal and external volumes:
We reported this change as a methodology change in the Change Control
Notification. We have since determined that this change best represents
the correction of an error as WBC volumes that are used within WBMC are
themselves not sold externally. We have reported the change in the error
section of this report. [Change Control Notification – Section 3.32]

Section 5 – Explanation of methodology changes made in the revised 2015 RFS
Page 18
Section 5
Explanation of methodology changes made in the revised 2015 RFS

Section 5 – Explanation of methodology changes made in the revised 2015 RFS
Page 19
Section 5.1 – Methodology reversal impacts summary
The following two tables summarise the illustrative difference of individual methodology changes on costs and on MCE attributed to individual Fixed Access Markets, Business
Connectivity Markets, Narrowband Markets, Wholesale Broadband Access Market and the Wholesale Residual Market.
WFA
EL
WLA
ISD
N2
ISD
N3
0
Low
Ban
dw
idth
TIS
BO
Me
diu
m B
and
wid
th
TISB
O
Hig
h B
and
wid
th T
ISB
O
TI R
egi
on
al T
run
k
Tech
nic
al a
reas
(P
oin
t
of
Han
do
ver)
AIS
BO
No
n W
ECLA
AIS
BO
WEC
LA
MIS
BO
No
n W
ECLA
Fixe
d c
all o
rigi
nat
ion
Fixe
d g
eo
grap
hic
cal
l
term
inat
ion
Tech
nic
al a
reas
(In
terc
on
ne
ct C
ircu
its)
WB
A -
Mar
ket
A
Wh
ole
sale
Re
sid
ual
(po
st-e
lim
inat
ion
s)
Tota
l Wh
ole
sale
Mar
kets
£m £m £m £m £m £m £m £m £m £m £m £m £m £m £m £m £m £m
Operating costs
Published RFS 2014-15 1,250.0 1,424.0 54.0 82.0 186.0 10.0 12.0 11.0 3.0 390.0 32.0 73.0 98.0 81.0 25.0 202.0 1,722.0 5,655.0
Material methodology changes :
1 Implementation of Regulatory Asset Valuation 46.9 25.1 1.4 0.9 0.7 0.0 0.0 0.0 0.0 4.3 0.2 0.2 0.0 0.0 0.0 0.0 0.3 80.0
2 21CN future benefits 0.0 0.0 0.0 0.0 0.0 0.0 0.0 0.0 0.0 23.9 3.0 4.8 0.0 0.0 0.0 45.6 (77.3) 0.0
3Allocation of Digital Subscriber Line Access Multiplexer costs
between Market A and Market B0.0 0.0 0.0 0.0 0.0 0.0 0.0 0.0 0.0 0.0 0.0 0.0 0.0 0.0 0.0 3.5 (3.5) 0.0
4
Testing Access Matrix system and Evolutionary Testing Access
Matrix asset life changes14.3 20.0 0.0 0.0 0.0 0.0 0.0 0.0 0.0 0.0 0.0 0.0 0.0 0.0 0.0 (3.2) (25.1) 6.0
5 Cumulo rebate allocation 31.9 13.9 0.2 (1.3) (5.7) (0.4) (0.4) (0.5) (0.1) (10.5) (0.3) (1.4) (5.1) (4.0) (0.9) (4.9) (10.5) 0.0
6 Duct and Fibre allocations to 21CN - Fibre 0.0 0.0 0.0 0.0 0.0 0.0 0.0 0.2 0.0 (0.9) 0.0 0.2 (0.1) (0.1) 0.0 0.2 0.5 0.0
7 Duct and Fibre allocations to 21CN - Duct 0.0 0.0 0.0 0.1 1.2 0.1 0.2 0.5 0.0 0.1 (0.1) (1.8) 0.3 0.2 0.1 1.6 (2.5) 0.0
8 Changes to cost code and sector mappings 1.2 3.1 0.0 (0.2) (3.0) (0.3) (0.7) (0.4) 0.0 2.2 0.3 0.7 (0.5) (0.4) (0.2) (4.2) 3.4 1.0
9 Changes to duct cost attribution to NGA tie cables 2.3 (2.7) 0.1 0.0 0.0 0.0 0.0 0.0 0.0 0.3 0.0 0.0 0.0 0.0 0.0 0.0 0.0 (0.0)
10Combined fault and service attribution – utilisation factor
changes(19.2) 20.2 (1.3) 0.0 0.3 0.0 0.0 0.0 0.0 0.0 0.0 0.0 0.0 0.0 0.0 0.0 0.0 0.0
Sub-total - material changes 77.4 79.6 0.4 (0.5) (6.5) (0.6) (0.9) (0.2) (0.1) 19.4 3.1 2.7 (5.4) (4.3) (1.0) 38.6 (114.7) 87.0
Cumulative non-material changes & roundings 38.6 (1.6) 0.6 0.5 0.5 0.6 (0.1) (0.8) 0.1 0.6 (0.1) (0.7) 1.4 0.3 0.0 1.4 23.7 65.0
Disaggregation of non-material changes:
Telephone directories (Change Control Notification Section 3.6) 46.8 0.0 0.0 0.0 0.0 0.0 0.0 0.0 0.0 0.0 0.0 0.0 0.0 0.0 0.0 0.0 10.0 56.8
Deafness provision (Change Control Notification Section 3.9) (9.0) (5.0) 0.0 0.0 0.0 0.0 0.0 0.0 0.0 0.0 0.0 0.0 0.0 0.0 0.0 0.0 14.0 0.0
Others 0.8 3.4 0.6 0.5 0.5 0.6 (0.1) (0.8) 0.1 0.6 (0.1) (0.7) 1.4 0.3 0.0 1.4 (0.3) 8.2
Methodology Reversal RFS 2014-15 1,366.0 1,502.0 55.0 82.0 180.0 10.0 11.0 10.0 3.0 410.0 35.0 75.0 94.0 77.0 24.0 242.0 1,631.0 5,807.0

Section 5 – Explanation of methodology changes made in the revised 2015 RFS
Page 20
WFA
EL
WLA
ISD
N2
ISD
N3
0
Low
Ban
dw
idth
TIS
BO
Me
diu
m B
and
wid
th
TISB
O
Hig
h B
and
wid
th T
ISB
O
TI R
egi
on
al T
run
k
Tech
nic
al a
reas
(P
oin
t
of
Han
do
ver)
AIS
BO
No
n W
ECLA
AIS
BO
WEC
LA
MIS
BO
No
n W
ECLA
Fixe
d c
all o
rigi
nat
ion
Fixe
d g
eo
grap
hic
cal
l
term
inat
ion
Tech
nic
al a
reas
(In
terc
on
ne
ct C
ircu
its)
WB
A -
Mar
ket
A
Wh
ole
sale
Re
sid
ual
(po
st-e
lim
inat
ion
s)
Tota
l Wh
ole
sale
Mar
kets
£m £m £m £m £m £m £m £m £m £m £m £m £m £m £m £m £m £m
Mean Capital Employed
Published RFS 2014-15 4,940.0 3,917.0 173.0 208.0 451.0 31.0 39.0 49.0 6.0 1,576.0 100.0 200.0 177.0 147.0 32.0 439.0 2,140.0 14,625.0
Material methodology changes :
1 Implementation of Regulatory Asset Valuation 392.9 210.5 12.0 7.9 5.9 0.2 0.1 0.0 0.2 36.4 2.0 1.4 0.0 0.0 0.0 0.0 2.2 671.7
2 21CN future benefits 0.0 0.0 0.0 0.0 0.0 0.0 0.0 0.0 0.0 59.6 7.6 11.9 0.0 0.0 0.0 59.0 (138.1) 0.0
3Allocation of Digital Subscriber Line Access Multiplexer costs
between Market A and Market B 0.0 0.0 0.0 0.0 0.0 0.0 0.0 0.0 0.0 0.0 0.0 0.0 0.0 0.0 0.0 5.6 (5.6) 0.0
4
Testing Access Matrix system and Evolutionary Testing Access
Matrix asset life changes 28.0 22.7 0.0 1.0 0.0 0.0 0.0 0.0 0.0 0.0 0.0 0.0 0.0 0.0 0.0 (7.2) (57.5) (13.0)
5 Cumulo rebate allocation 0.0 0.0 0.0 0.0 0.0 0.0 0.0 0.0 0.0 0.0 0.0 0.0 0.0 0.0 0.0 0.0 0.0 0.0
6 Duct and Fibre allocations to 21CN - Fibre 0.0 0.0 0.0 (0.1) (0.2) (0.1) 0.0 0.6 0.0 (1.1) 0.2 2.1 (0.4) (0.3) (0.1) 0.2 (0.8) 0.0
7 Duct and Fibre allocations to 21CN - Duct 0.0 0.0 0.0 0.9 17.3 1.3 2.7 8.1 0.0 1.2 (1.9) (23.5) 3.5 2.8 0.9 23.4 (36.7) 0.0
8 Changes to cost code and sector mappings 0.3 (1.8) 0.0 (0.4) (4.6) (0.3) (1.6) 0.0 0.0 14.5 0.3 0.7 (0.6) (0.4) (0.2) (4.4) (1.5) 0.0
9 Changes to duct cost attribution to NGA tie cables 40.1 (48.8) 1.2 0.8 0.8 0.1 0.0 0.0 0.0 4.5 0.2 0.2 0.1 0.1 0.0 0.3 0.4 0.0
10Combined fault and service attribution – utilisation factor
changes 1.4 (1.5) 0.1 0.0 0.0 0.0 0.0 0.0 0.0 0.0 0.0 0.0 0.0 0.0 0.0 0.0 0.0 0.0
Sub-total - material changes 462.7 181.1 13.3 10.1 19.2 1.2 1.2 8.7 0.2 115.1 8.4 (7.2) 2.6 2.2 0.6 76.9 (237.6) 658.7
Cumulative non-material changes & roundings (51.7) (25.1) (1.3) (1.1) 0.8 (0.2) 0.8 0.3 (0.2) 3.9 0.6 1.2 1.4 1.8 0.4 1.1 72.6 5.3
Disaggregation of non-material changes:
Deafness provision (Change Control Notification Section 3.9) (48.6) (24.2) 0.0 0.0 0.0 0.0 0.0 0.0 0.0 0.0 0.0 0.0 0.0 0.0 0.0 0.0 72.8 0.0
Others (3.1) (0.9) (1.3) (1.1) 0.8 (0.2) 0.8 0.3 (0.2) 3.9 0.6 1.2 1.4 1.8 0.4 1.1 (0.2) 5.3
Methodology Reversal RFS 2014-15 5,351.0 4,073.0 185.0 217.0 471.0 32.0 41.0 58.0 6.0 1,695.0 109.0 194.0 181.0 151.0 33.0 517.0 1,975.0 15,289.0

Section 5 – Explanation of methodology changes made in the revised 2015 RFS
Page 21
Section 5.2 – Implementation of Regulatory Asset Valuation
Reference
number
1
(Change Control Notification 3.7)
Key driver
for change
More consistent with regulatory decisions
Trigger for
change
Regulatory decision
Description
of change
We previously valued our access copper cables and access duct
assets on a current cost accounting (CCA) basis, using an indexed
historic methodology.
We changed the valuation methodology of access duct assets from
CCA to Regulatory Asset Valuation (RAV).
The methodology is applied to the access duct network in the
2014-15 RFS. However the duct asset is common to both the
access network and the core network. We therefore only posted a
proportion of the RAV adjustment relating to duct which is relevant
to the access network.
This was implemented by adjusting the CCA valuation for duct to a
RAV valuation within the activity group AG135 ‘Duct’ used by
Access Cables. This activity plant group then apportions costs and
asset values through plant groups and components to access
services.
Effect of
the change
This change reduces CCA depreciation and MCE for all service and
components using the duct network. The markets impacted are:
WLA, WFAEL, ISDN2, ISDN30, TISBO, AISBO and MISBO.
Support for
the change
This change was directed in Ofcom’s Directions for Regulatory
Financial Reporting (30 March 2015).

Section 5 – Explanation of methodology changes made in the revised 2015 RFS
Page 22
Section 5.3 – 21CN future benefits
Reference
number
2
(Change Control Notification 3.8)
Key driver
for change
More consistent with regulatory decisions
Trigger for
change
Regulatory decision
Description
of change
We no longer use the ‘future benefits’ principle for attributing 21st
Century Network (21CN) costs. The 21CN refers to our modern,
Internet Protocol (IP) based, converged telecommunications
network.
The future benefits principle attributes 21CN costs to services
currently carried on legacy networks on the basis that they, or a
similar replacement service, would be carried over the 21CN in the
future. This was to incentivise the take-up of services on new 21CN
technology rather than loading high costs and low volumes to the
early 21CN based services.
21CN costs that were allocated to IPstream and Datastream on a
future benefits basis are instead allocated to Wholesale Broadband
Connect (WBC) and residual WBA services such as Superfast
Broadband and TV Connect.
Similarly, the 21CN costs which were attributed to Wholesale
Extension Services (WES), Backhaul Extension Services (BES) and
Ethernet Access Direct (EAD) services on a future benefits basis are
now attributed to Wholesale Residual Ethernet services.
To implement this change we amended our 21CN cost attribution
model and made some minor changes to 21CN plant groups and
components.
Effect of the
change
Removal of the IPstream and Datastream allocations reduced costs
in WBA Market A.
The removal of costs from WES, BES and EAD reduced AISBO non-
WECLA and MISBO non-WECLA costs.
Costs are instead allocated to WBC (which has a greater presence in
WBA residual markets rather than WBA Market A), and other
residual WBA and Wholesale Ethernet services.
Support for
the change
This change was directed in Ofcom’s Directions for Regulatory
Financial Reporting (30 March 2015).

Section 5 – Explanation of methodology changes made in the revised 2015 RFS
Page 23
Section 5.4 – Allocation of Digital Subscriber Line Access Multiplexer costs between Market A and Market B
Reference
number
3
(Change Control Notification 3.10)
Key driver
for change
More consistent with regulatory decisions
Trigger for
change
Regulatory decision
Description
of change
Digital Subscriber Line Access Multiplexers (DSLAMs) are sited at the
local exchange or concentrator sites and they enable the provision
of broadband services over the copper access network.
In 2012/13 we introduced a change that apportioned the costs
between WBA markets based on an analysis of which costs are
driven by the number of DSLAMs at each site and which costs are
driven by the number of broadband subscribers connected at each
site.
We reversed this methodology and reverted back to apportioning
the costs by the number of broadband subscribers connected at
each site.
Effect of the
change
This change has reduced costs and MCE allocated to Market A from
components: DSLAM Overheads and DSLAM Depreciation. There is a
corresponding increase in Market B.
Support for
the change
This change was directed in Ofcom’s Directions for Regulatory
Financial Reporting (30 March 2015).

Section 5 – Explanation of methodology changes made in the revised 2015 RFS
Page 24
Section 5.5 – Testing Access Matrix system and Evolutionary Testing Access Matrix asset life changes
Reference
number
4
(Change Control Notification 3.11)
Key driver
for change
More consistent with regulatory decisions
Trigger for
change
Regulatory decision
Description
of change
The two types of Testing Access Matrix systems (TAMS) have
different lives in BT’s statutory accounts. Evolutionary TAMS
(EvoTAMS), used for internal SMPF lines, have a seven year life and
TAMS, used for MPF lines, have a five year life.
We made an accounting adjustment in the RFS to change the
regulatory asset lives of TAMS so that both variants have a seven
year life. This change is not reflected in the 2014-15 statutory
accounts.
We also changed the attribution of EvoTAMS costs so that they are
apportioned to WBC instead of SMPF.
Effect of the
change
Changing the regulatory asset life reduced the deprecation of TAMs
and increased capital employed for the TAMs component, which in
turn impacted the MPF rentals service in the WLA market.
Changing the attribution of EvoTAMS reduced the costs and MCE of
the SMPF rentals service in the WLA market with corresponding
increases in the WBC rentals service in WBA markets A and B.
Support for
the change
This change was directed in Ofcom’s Directions for Regulatory
Financial Reporting (30 March 2015).

Section 5 – Explanation of methodology changes made in the revised 2015 RFS
Page 25
Section 5.6 – Cumulo rebate allocation
Reference
number
5
(Change Control Notification 3.12)
Key driver
for change
More consistent with regulatory decisions
Trigger for
change
Regulatory decision
Description
of change
Cumulo rates are the non-domestic rates we pay on our UK rateable
network assets.
We changed the attribution of Cumulo rates by making two changes
to methodologies:
Rebates were changed to be treated in the same way as the
gross payments; and
The asset valuations used in the calculation were updated to
current values.
We receive a rebate for the loss of revenue resulting from the
migration of customers to MPF lines. This rebate was previously
apportioned in such a way that it was not allocated to copper lines.
We now apportion the costs in exactly the same way that we
apportion the gross charges.
The apportionment methodology basis for the gross Cumulo rates
charge is Profit Weighted Net Replacement Costs (PWNRCs). This
methodology apportions the charge to activity groups and plant
groups in proportion to the profit that the rateable assets are able to
generate. This is calculated by weighting the net replacement costs
(NRC) weighted by the average return on capital employed for each
rateable asset.
We changed this to use current year NRCs and component WACC for
the profit weighting element.
Our previous methodology was to use the NRCs and profit
weightings agreed with the Valuation Office for the current rateable
asset valuation.
Effect of the
change
The change in the attribution of the rebates decreased the costs for
the access copper markets (WLA, WFAEL and ISDN) and increased
costs in the Business Connectivity markets, the Narrowband markets
and the Wholesale Broadband markets.
The updates to NRCs and Profit Weightings caused small increases
for fibre based services and markets and small decreases for copper
based services and markets.
Support for
the change
This change was directed in Ofcom’s Directions for Regulatory
Financial Reporting (30 March 2015).

Section 5 – Explanation of methodology changes made in the revised 2015 RFS
Page 26
Section 5.7 – Duct and Fibre allocations to 21CN
Reference
number
6 & 7
(Change Control Notification 3.14)
Key driver
for change
More complete; more accurate; and more consistent with regulatory
decisions
Trigger for
change
BT judgement following feedback from Ofcom’s Cost Allocation
Review
Description
of change
Previously we apportioned backhaul fibre and core fibre to a total of
five 21CN plant groups. As a result of Ofcom’s Cost Attribution
Review, two issues were identified:
We did not attribute any duct costs to the 21CN fibre plant
groups; and
These plant groups can be readily defined as being part of either
the backhaul network or the core network, but we allocated both
backhaul fibre and core fibre cost to each plant group.
We made three changes to address these issues:
Backhaul fibre is now allocated wholly to the Backhaul Fibre
plant group and Core Fibre is allocated wholly to the Core Fibre
plant group. This resolved the duct allocation issue since these
plant groups already received an appropriate allocation of duct
costs.
We changed our plant group to component apportionment so
that it is attributed to 20CN components and 21CN components
based on the volume of fibre kilometres. This is the same method
as we used previously to apportion costs from class of work to
plant group.
We amended the attribution of Backhaul Fibre and Core Fibre
plant groups so that they only apportion to components that
relate to the corresponding part of the network.
Effect of
the change
The net impact of these changes moved costs and MCE from 20CN
services to 21CN services.
More Duct costs will now be attributed to 21CN services, which are
mostly in the network residual market but also include EBD in the
AISBO and MISBO markets. There was a corresponding reduction to
Duct attributions to markets using the 20CN backhaul and core
networks, principally the TISBO markets but also the Narrowband
markets and main links in the AISBO and MISBO markets.
Less Fibre is attributed to 21CN services and more costs are
attributed to services using the 20CN network, principally TISBO and
main links in the AISBO and MISBO markets.
Support
for the
change
These issues were identified during Ofcom’s current Cost Allocation
Review. Ofcom required us under their Section 135 powers to
provide adjusted information for use in their modelling for the Leased
Lines Charge Control.
The mapping of fibre costs to 21CN backhaul and core networks
aligns with the definition of those networks in BT’s Undertakings to
Ofcom, 2005.

Section 5 – Explanation of methodology changes made in the revised 2015 RFS
Page 27
Section 5.8 – Changes to cost code and sector mappings
Reference
number
8
(Change Control Notification 3.25)
Key driver
for change
More accurate; more cost causal
Trigger for
change
BT judgement
Description
of change
We use F8 codes to group similar general ledger codes into bundles
which are used specifically for regulatory reporting. Sectors are cost
categories used internally by BT, and these changes do not impact
the cost categories in the published RFS.
We made the following changes to F8 codes to sector mapping:
DSLAM assets are mapped to Miscellaneous Capital sector
instead of the Copper Cable sector;
Transmission Assets are mapped to a new sector to be called
Transmission Electronics instead of the Transmission Cable and
Other sector; and
Accounting adjustments for third party electronics are mapped
in the Transmission Electronics sector instead of the Capital
Miscellaneous sector.
The first two changes changed the calculation for the apportionment
of AG102 (BT TSO Managed Assets) to other activity groups, plant
groups and Retail Residual in proportion to core assets. Core assets
are defined as total fixed assets less duct, copper cable, fibre cable,
land and buildings, vehicles and office machinery.
This apportionment is automated and is calculated by analysing fixed
assets but excluding certain sectors. There are benefits from this
simple application but it is limited by issues in the mapping of assets
to sectors. The sector for copper cables is excluded but it also includes
broadband DSLAMs and the sector for core and backhaul cables is
excluded but also includes transmission electronics.
Following from the above change, in the RFS we now identify third
party equipment depreciation and report it on a separate line in the
TISBO markets. This depreciation is calculated by taking revenue for
third party equipment and calculating the depreciation based on an
asset life of four years.
The third change did not impact cost allocations at all but it did
impact the calculation of LRICs and DSACs. We now map transmission
assets and accounting adjustments to the same sector.
Our asset values for transmission electronics include equipment on
third party premises for which the costs have already been recovered
in a connection charge. To account for these assets and to ensure that
they are not recovered twice, we make an adjustment to our
deprecation and asset values for these assets.
The transmission assets and accounting adjustments were previously
mapped to different sectors so they were assigned different cost
volume relationships in our LRIC model. This caused distortions in the
calculation of LRIC and DSACs for services using transmission
electronics. Our change has resolved this issue and made the
calculation of LRIC and DSAC more accurate.
Effect of
the change
The change in the calculation of AG102 BT TSO Managed Assets
apportions more costs to services using DSLAMs, in WBA Markets A
and B, and more costs to services using transmission electronics,
principally TISBO.
The change in sector for third party equipment accounting

Section 5 – Explanation of methodology changes made in the revised 2015 RFS
Page 28
adjustments did not impact the reporting of costs and MCE.
Support
for the
change
These changes were identified as part of an internal review following
the implementation of the REFINE system. These changes increased
the accuracy of the RFS and improve cost causality.

Section 5 – Explanation of methodology changes made in the revised 2015 RFS
Page 29
Section 5.9 – Changes to duct cost attribution to NGA tie cables
Reference
number
9
(Not included in Change Control Notification)
Key driver
for change
More accurate; more cost causal
Trigger for
change
BT judgement
Description
of change
We changed how we attribute duct costs to NGA tie cables so that it
is attributed on the basis of depreciation derived from the cumulative
capital expenditure on duct associated with NGA. It was previously
attributed to NGA tie cables on the basis of depreciation derived from
the in-year capital expenditure on duct associated with NGA.
Effect of
the change
The main impact was to the Duct base PDTLMD where NGA Plant
Group PG192A (NGA E Side Copper Capital) now receives a higher
apportionment of the same cost base than Access Duct and Backhaul
Duct.
MCE in the WLA market was increased with corresponding decreases
in other markets, primarily WFAEL.
Support
for the
change
This change improved cost causality in the RFS.
It is logical to assume that all capital expenditure influences the
attribution of duct costs as in year depreciation is not reflective of the
whole life of the asset.

Section 5 – Explanation of methodology changes made in the revised 2015 RFS
Page 30
Section 5.10 – Combined fault and service attribution – utilisation factor changes
Reference
number
10
(Change Control Notification 3.13)
Key driver
for change
More consistent with regulatory decisions
Trigger for
change
Regulatory decision
Description
of change
We changed our component usage factors for copper repair
components to those directed by Ofcom’s Directions for Regulatory
Financial Reporting (30 March 2015).
The usage factors relate to a combination of fault rate and service
level and apply to the following components: D-side Copper Current,
E-Side Copper Current, Local Exchanges, Residential Public Switched
Telephone Network (PSTN) Drop Maintenance and DSLAM Capital
/Maintenance.
Effect of
the change
This change moved costs from WLA to WFAEL.
Support
for the
change
This change was directed in Ofcom’s Directions for Regulatory
Financial Reporting (30 March 2015).

Section 5 – Explanation of methodology changes made in the revised 2015 RFS
Page 31
Section 5.11 – Other methodology changes
As part of the requirement to produce this reconciliation report, we are required to
reverse all methodologies which were implemented in 2014-15. In many instances
the impacts do not meet Ofcom’s definition of material and we are therefore not
presenting the impacts or explanatory text for them separately in this report.
The changes from the Change Control Notification which have been reversed in
aggregate are as follows:
3.6 Changes in the treatment of BT Retail costs to account for a regulatory
decision on the treatment of Telephone Directories
3.9 Deafness provision allocation
3.16 Group overheads allocation to overseas subsidiaries
3.18 Property sub-letting income & Facility Management cost allocations
3.21 Group methodology alignment – Flexible Resource Unit
3.23 Broadband Development UK funded investments
3.24 21CN cost allocation model - volumes
3.26 Review of BT Wholesale Managed Services cost allocations
NGA tie cables (described in Section 4.2.2 of this Reconciliation Report)
We note that there are three material changes included in the Change Control
Notification which have not been reversed as part of this report. These are:
3.5 Non-geographic call termination reporting;
3.28 ECC component rationalisation; and
3.32 Wholesale Broadband Connect (WBC) internal and external volumes.
In all instances, as referenced in Section 4.2.2 of this Reconciliation Report, we
consider that these changes reflect the correction of errors and have included them
within the error correction section of this report. We have not reversed these as to
do so would be to re-introduce error into the RFS figures.
We also note that there are several non-material changes which we included in our
Change Control Notification but which we have not reversed in this report. The
changes not reversed and the reasons for their omission are:
3.17 Changes in the treatment of BT Retail costs to account for an
Organisational Unit change: This change represents a re-organisation of
the business and to reverse it would be to incorrectly present a function of
our business.
3.22 BT TSO methodologies update and OUC changes: This change
represents a re-organisation of the business and to reverse it would be to
incorrectly present a function of our business.
3.23 – Broadband Development UK funded investments: The previous
apportionment of BDUK operating expenditure did not align to the
treatment of BDUK capital expenditure, but should have. We believe that
aligning the methodologies best represents the correction of an error. The
change does not meet the materiality criteria for error corrections and
therefore is not included in the error section of this report.
3.28 ECC component rationalisation: A distinct part of this change in the
Change Control Notification relates to the introduction of a £548 charge
in the connection price for ECCs effective from 2014-15. We introduced a
methodology to reflect the treatment of this new charge and we present
the ECC information as a note in the RFS. We have not restated the ECC
note for this change as there was no comparative 2013-14 methodology.
This is separate to the aspect of the change being treated as an error and
reported in section 7.7 of this report.
3.29 Supercomponent mapping: The changes to Supercomponent
mapping improve the clarity of our reporting only and do not change our
attribution methods.
3.30 Changes to the cost allocations for Group Functions: This change
represents a re-organisation of the business and to reverse it would be to
incorrectly present a function of our business.
3.31 Long Run Incremental Cost (LRIC) model update: The changes to our
LRIC model are more to correct errors or inconsistencies than to change
our methodologies. We have published revised LRIC figures for 2013-14
on our website to show the impact of the error corrections already. For the
purposes of the error report, we will publish LRIC and DSAC information
where already presented in the 2014 RFS. This information will be based
upon the corrected LRIC/DSAC information previously published adjusted

Section 5 – Explanation of methodology changes made in the revised 2015 RFS
Page 32
for movements in the underlying FAC values, rather than completely re-
performing the LRIC calculation.
3.33 Treatment of BT Group Central Business Services: This change
represents a re-organisation of the business and to reverse it would be to
incorrectly present a function of our business.
3.34 Wholesale Broadband Access non-equivalence of input service
rationalisation: We have rationalised and aggregated Wholesale non-EOI
services, with no impact on published services.
3.35 RFS eliminations and goodwill: These changes only impact goodwill
and the reconciliation statement. This change does not impact fully
allocated costs.
3.36 Revenue and Volume data source for Openreach: The prior year data
source no longer exists and therefore this change could not be feasibly
reversed. We do not believe that the implementation of ARC had an impact
on market figures.
3.37 Openreach reorganisation: This change represents a re-organisation
of the business and to reverse it would be to incorrectly present a function
of our business.

Section 6 - Reconciliation report requirements and content – error corrections
Page 33
Section 6
Reconciliation report requirements and content – error corrections

Section 6 - Reconciliation report requirements and content – error corrections
Page 34
Section 6.1 – BT’s reporting requirements in respect of changes to
methodologies
We have been directed to prepare this Reconciliation Report in accordance with
Ofcom’s 30 March 2015 Direction. The Direction provides that BT must prepare a
reconciliation report which sets out:
“ii. in relation to Material Errors identified since the publication of the previous
Financial Year’s Regulatory Financial Statements:
a) for each Material Error, a description of the Material Error, the circumstances of
discovery of the Material Error, the reason for the Material Error, and whether such
Material Error has been corrected in the restated Prior Year Comparatives;
b) the impact of all Material Errors on all figures presented in the Regulatory
Financial Statements for the previous Financial Year, by setting out, on an
aggregated basis:
i. the Current Year Figures set out in the Regulatory Financial Statements
for the previous Financial Year had such Material Errors been corrected in
the previous Financial Year (“the Corrected Previous Year Figures”); and
ii. the difference as an absolute amount and as a percentage change
between the Current Year Figures set out in the Regulatory Financial
Statements for the previous Financial Year and the Corrected Previous
Year Figures.
c) the impact of each Material Error at the Markets and Technical Areas Level, by
setting out, for each Material Error, the difference as an absolute amount and as a
percentage change between:
i. the Current Year Figures set out in the Regulatory Financial Statements
for the previous Financial Year; and
ii. the Current Year Figures set out in the Regulatory Financial Statements
for the previous Financial Year had such Material Error been corrected in
the previous Financial Year.”
”Material Error” is defined by Ofcom as follows:
“‘Material Error’ means an Error which:
i. results in a correction (be it positive or negative) in any figure in the
Regulatory Financial Statements which exceeds the higher of 5% or £1
million. The percentage correction in a figure shall be calculated by taking
the value of the affected figure in the Regulatory Financial Reporting
before the error is corrected, and subtracting from it, the value of the same
figure after the error is corrected, and then dividing this result by the
former value; and
ii. fulfils at least one of the following conditions set out in paragraphs (ii)(a)
and (ii)(b) below:
a. the error has arisen within the Regulatory Attribution System;
b. the error has been brought to the attention of the Audit and Risk
Committee by the Regulatory Auditor.”
The purpose of this section of the report is to identify and explain where we have
corrected the 2014 RFS for errors identified subsequent to publication. This report
focuses on the 2014 RFS as published compared to the 2014 RFS with certain
errors corrected.
The Reconciliation Report sets out the data required in paragraph 1.ii of the
Direction.

Section 7 - Explanation of reported material error corrections
Page 35
Section 7
Explanation of reported material error corrections

Section 7 - Explanation of reported material error corrections
Page 36
Section 7.1 – Error correction impacts summary
The following two tables summarise the illustrative difference of individual error corrections on costs and MCE attributed to individual Fixed Access Markets, Business
Connectivity Markets, Narrowband Markets, Wholesale Broadband Access Markets and the Wholesale Residual Market.
WFA
EL
WLA
ISD
N2
ISD
N3
0
Low
Ban
dw
idth
TIS
BO
Me
diu
m B
and
wid
th
TISB
O
Hig
h B
and
wid
th T
ISB
O
Tech
nic
al a
reas
(P
oin
t
of
Han
do
ver)
TI R
egi
on
al T
run
k
AIS
BO
No
n W
ECLA
AIS
BO
WEC
LA
MIS
BO
No
n W
ECLA
Fixe
d c
all o
rigi
nat
ion
Tech
nic
al a
reas
(In
terc
on
ne
ct C
ircu
its)
Fixe
d g
eo
grap
hic
cal
l
term
inat
ion
WB
A -
Mar
ket
1
WB
A -
Mar
ket
2
Wh
ole
sale
Re
sid
ual
Ro
un
din
gs
Tota
l Wh
ole
sale
Mar
kets
£m £m £m £m £m £m £m £m £m £m £m £m £m £m £m £m £m £m £m £m
Operating costs
Published 2013-14 RFS 1,345.0 861.0 58.0 72.0 228.0 13.0 14.0 4.0 10.0 359.0 32.0 36.0 110.0 25.0 93.0 312.0 119.0 2,092.0 - 5,783.0
Material error corrections - - - - - - - - - - - - - - - - - - - -
1 Siteconnect services - - - - - - 0.6 - - - - - - - - - - (0.6) - -
2 Access fibre - fibres per bearer - - - 3.5 0.5 - (0.1) - - (3.4) (0.2) (0.1) - - - - - (0.2) - -
3 21CN Ethernet volumes - - - - - - - - - 6.7 0.9 1.5 - - - (3.6) (2.1) (3.4) - -
4 Access cards unit costs - - - - - - - - - (2.4) 0.7 1.2 - - - - - 0.5 - -
5 Misallocation of Except for Payphones costs - - - - - - - - - - - - (3.2) - - - - 3.2 - -
6 SDH plant group to component model - - - (0.1) (2.2) (0.3) (0.2) - (0.2) 3.6 0.1 0.2 (0.3) - (0.2) (0.3) (0.1) - 0.0 -
7 ECC cost component rationalisation - - - - 0.1 - - (0.1) - 0.2 0.4 (0.2) - - - - - (0.4) - -
8 PPC volumes - - - - (0.2) - 0.4 (0.1) 0.4 - - - - - - - - (0.5) - -
9 WBC internal/external volumes split - - - - - - - - - - - - - - - - - - - -
10 Non-geographic call termination - - - - - - - - - - - - - - (8.3) - - 8.3 - -
11 Ethernet services - - - 0.4 0.4 - - - - (7.9) (1.0) 6.4 - - - - - 1.7 - -
12 Call origination volumes - - - - - - - - - - - - (4.8) - 4.2 - - 0.6 - -
13 Ethernet accruals - - - - 0.1 - - - - 1.1 0.2 (1.5) - - - - - 0.1 (0.0) -
14 OSA Main links - - - - - - - - - - - 0.3 - - - - - (0.3) - -
15 BT Wholesale cost of sales transfer charges - - - - (4.8) (0.3) (0.4) - (0.3) - - - (1.5) (0.7) (1.6) (1.8) (0.9) 12.5 (0.2) -
Sub-total - - - 3.8 (6.1) (0.6) 0.3 (0.2) (0.1) (2.1) 1.1 7.8 (9.8) (0.7) (5.9) (5.7) (3.1) 21.5 (0.2) -
Non-material differences & roundings - - (1.0) 0.2 0.1 (0.4) (0.3) 0.2 0.1 0.1 (0.1) 0.2 0.8 0.7 (0.1) (0.3) 0.1 0.5 0.2 1.0
Corrected 2013-14 RFS 1,345.0 861.0 57.0 76.0 222.0 12.0 14.0 4.0 10.0 357.0 33.0 44.0 101.0 25.0 87.0 306.0 116.0 2,114.0 - 5,784.0

Section 7 - Explanation of reported material error corrections
Page 37
WFA
EL
WLA
ISD
N2
ISD
N3
0
Low
Ban
dw
idth
TIS
BO
Me
diu
m B
and
wid
th
TISB
O
Hig
h B
and
wid
th T
ISB
O
Tech
nic
al a
reas
(P
oin
t
of
Han
do
ver)
TI R
egi
on
al T
run
k
AIS
BO
No
n W
ECLA
AIS
BO
WEC
LA
MIS
BO
No
n W
ECLA
Fixe
d c
all o
rigi
nat
ion
Tech
nic
al a
reas
(In
terc
on
ne
ct C
ircu
its)
Fixe
d g
eo
grap
hic
cal
l
term
inat
ion
WB
A -
Mar
ket
1
WB
A -
Mar
ket
2
Wh
ole
sale
Re
sid
ual
Ro
un
din
gs
Tota
l Wh
ole
sale
Mar
kets
£m £m £m £m £m £m £m £m £m £m £m £m £m £m £m £m £m £m £m £m
Mean Capital Employed
Published 2013-14 RFS 5,836.0 2,763.0 205.0 210.0 615.0 48.0 60.0 10.0 59.0 1,619.0 91.0 95.0 211.0 36.0 200.0 483.0 131.0 2,852.0 - 15,524.0
Material error corrections - - - - - - - - - - - - - - - - - - - -
1 Siteconnect services - - - - - - 2.6 - - - - - - - - - - (2.6) - -
2 Access fibre - fibres per bearer - - - 23.4 3.2 (0.2) (0.6) 0.1 - (22.6) (1.2) (0.7) - (0.1) - - - (1.3) 0.0 -
3 21CN Ethernet volumes - - - - - - - - - 11.1 1.4 2.5 - - - (5.9) (3.4) (5.7) - -
4 Access cards unit costs - - - - - - - - - (3.9) 1.1 1.9 - - - - - 0.8 0.1 -
5 Misallocation of Except for Payphones costs - - - - - - - - - - - - 1.3 - - - - (1.3) - -
6 SDH plant group to component model - - - (1.6) (34.9) (5.2) (3.4) - (2.8) 57.7 1.1 2.5 (4.0) (0.4) (3.8) (4.3) (0.8) (0.2) 0.1 -
7 ECC cost component rationalisation - - - - 2.7 - - (2.8) - 4.1 9.6 (4.4) - - - (0.7) (0.4) (8.2) 0.1 -
8 PPC volumes - - - - (0.2) - 1.2 (0.2) 2.7 - - - - - - - - (3.6) 0.1 -
9 WBC internal/external volumes split - - - - - - - - - - - - - - - - - - - -
10 Non-geographic call termination - - - - - - - - - - - - - - (17.6) - - 17.6 - -
11 Ethernet services - - - 2.4 2.7 0.1 - 0.1 - (18.4) (0.9) 10.6 - - - - - 3.2 0.2 -
12 Call origination volumes - - - - - - - - - - - - (6.0) - 2.0 - - 4.0 - -
13 Ethernet accruals - - - 0.3 0.4 - - - - 1.7 0.4 (3.0) - - - - - 0.3 (0.1) -
14 OSA Main links - - - - - - - - - - - 4.3 - - - - - (4.3) - -
15 BT Wholesale cost of sales transfer charges - - - - - - - - - - - - - - - - - - - -
Sub-total - - - 24.5 (26.1) (5.3) (0.2) (2.8) (0.1) 29.7 11.5 13.7 (8.7) (0.5) (19.4) (10.9) (4.6) (1.3) 0.5 -
Non-material differences & roundings (3.0) - - (0.5) 0.1 0.3 0.2 (0.2) 0.1 (2.7) 0.5 0.3 (2.3) (0.5) (1.6) 0.9 (0.4) (2.7) (0.5) (12.0)
Corrected 2013-14 RFS 5,833.0 2,763.0 205.0 234.0 589.0 43.0 60.0 7.0 59.0 1,646.0 103.0 109.0 200.0 35.0 179.0 473.0 126.0 2,848.0 - 15,512

Section 7 - Explanation of reported material error corrections
Page 38
Section 7.2 – Siteconnect Revenue Corrections
Reference
number
1
Description of
error
Siteconnect is a 3G radio mast backhaul service, similar to the
Radio Backhaul Service (RBS). It is sold as three main services:
major and remote site linkages (connections), subsequent remote
site linkages with one to three year pricing plans (connections)
and bandwidth charges where the prices are dependent on the
bandwidth and the distance of the backhaul circuits (rental). In
addition there are ancillary services like standard PC/PPC services
such as excess construction charge and Time Related Charges.
In correcting this error Siteconnect 155Mbit/s will be reported in
the High Bandwidth TISBO market, not Wholesale Residual. We
have ensured that the prices reflect the BT Wholesale Carrier Price
List (“CPL”) and the volume of circuits reflect the updated
2013/14 data taken from billing data.
Circumstances
of discovery
This error was identified whilst preparing a response to a Business
Connectivity Market Review section 135 request.
Restatement
impact
This error impacts revenue in the High TISBO market by more than
5% of the reported market value. In the 2015 RFS we restated
for the correction of this error in the prior year comparatives.

Section 7 - Explanation of reported material error corrections
Page 39
Section 7.3 – Access fibre - fibres per bearer
Reference
number
2
Description of
error
Access Fibre is apportioned to Ethernet products as well as older
Time Division Multiplexing (TDM) products that consume it. The
number of fibres is derived from the number of TDM bearers from
the Core Transmission Costing System (CTCS) and the number of
fibres per bearer which is obtained from the Integrated Network
System (INS).
The number of fibres per bearer obtained for each bandwidth for
the TDM products in 2013-14 was incorrect. The data obtained
from INS was obtained via a query written in an interface system,
Network Decision Support (NDS). It was found that the outputs of
the query were incorrect due to the query’s logic sourcing
incorrect information from CTCS.
Circumstances
of discovery
We identified that the query’s logic was flawed when responding
to a query as part of Ofcom’s ‘Review of BT’s cost attribution
methodologies’ published 12 June 2015 (the “Cost Attribution
Review”).
Restatement
impact
This error impacts costs in the ISDN30 market by 4.9% of the
reported market value. To ensure that the impact of changes not
restated for is less than 5% for all market totals, in the revised
2015 RFS we restated for the correction of this error in the prior
year comparatives.

Section 7 - Explanation of reported material error corrections
Page 40
Section 7.4 – 21CN Ethernet volumes
Reference
number
3
Description of
error
In 2013-14 the future benefits methodology was applied for
both Broadband and Ethernet. Our methodology was to use
combined totals of 21CN and 20CN volumes to attribute costs to
components, before splitting the apportionment between 20CN
and 21CN services.
In 2013-14 there were two errors relating to Ethernet:
only 21CN volumes were used to apportion costs to Ethernet
components; and
These costs were then only apportioned to 20CN services and
so no 21CN costs were apportioned to Managed Ethernet
Access and Harmonised Ethernet services.
Circumstances
of discovery
We identified the errors whilst undertaking a review of our future
benefits methodology in 2014-15 at the request of Ofcom.
Restatement
impact
We restated the revised 2015 RFS prior year comparatives to
reflect that we no longer use the future benefits principle for
attributing 20CN costs. This methodology reversal is covered in
Section 7.2 of this report.
In reversing and restating for this methodology change, we have
consequently eliminated this error as the 21CN methodology is no
longer applied to 20CN products and services.
The error impact is itself less than 5% of any market cost, revenue
or mean capital employed; therefore it would not otherwise have
required restatement.

Section 7 - Explanation of reported material error corrections
Page 41
Section 7.5 – Access cards unit costs
Reference
number
4
Description of
error
In 2013-14 as part of our cost attribution methodology we
apportioned Ethernet services costs based on bandwidth using
the ‘21CN ETHER’ base. The methodology multiplied the number
of Ethernet circuits by an indexed bandwidth per circuit factor, in
order to calculate the bandwidth volumes used for the cost
attribution.
The smallest bandwidth circuit to be apportioned costs was
10Mbit/s and therefore services of this size used an indexed
factor of 1. Consequently 100Mbit/s services used a factor of 10
and 1Gbit/s services used a factor of 100 and so on.
We identified that for the service ‘WES 100Mbit/s Rentals -
Internal - Non WECLA’ we used a factor of 100 rather than 10 in
its calculation. It therefore received c.10 times too much cost. All
other Ethernet service costs were understated.
Circumstances
of discovery
This error was identified as part of Ofcom’s review of the 2014
RFS and was subsequently published in our errata report.
Restatement
impact
We restated the 2014-15 prior year comparatives to reflect that
we no longer use the future benefits principle for attributing
20CN costs. This methodology reversal is covered in Section 7.2
of this Reconciliation Report.
In reversing and restating for this methodology change, we have
consequently eliminated this error as the 21CN methodology is no
longer applied to 20CN products and services.
The error impact is itself less than 5% of any market cost, revenue
or mean capital employed; therefore it would not otherwise have
required restatement.
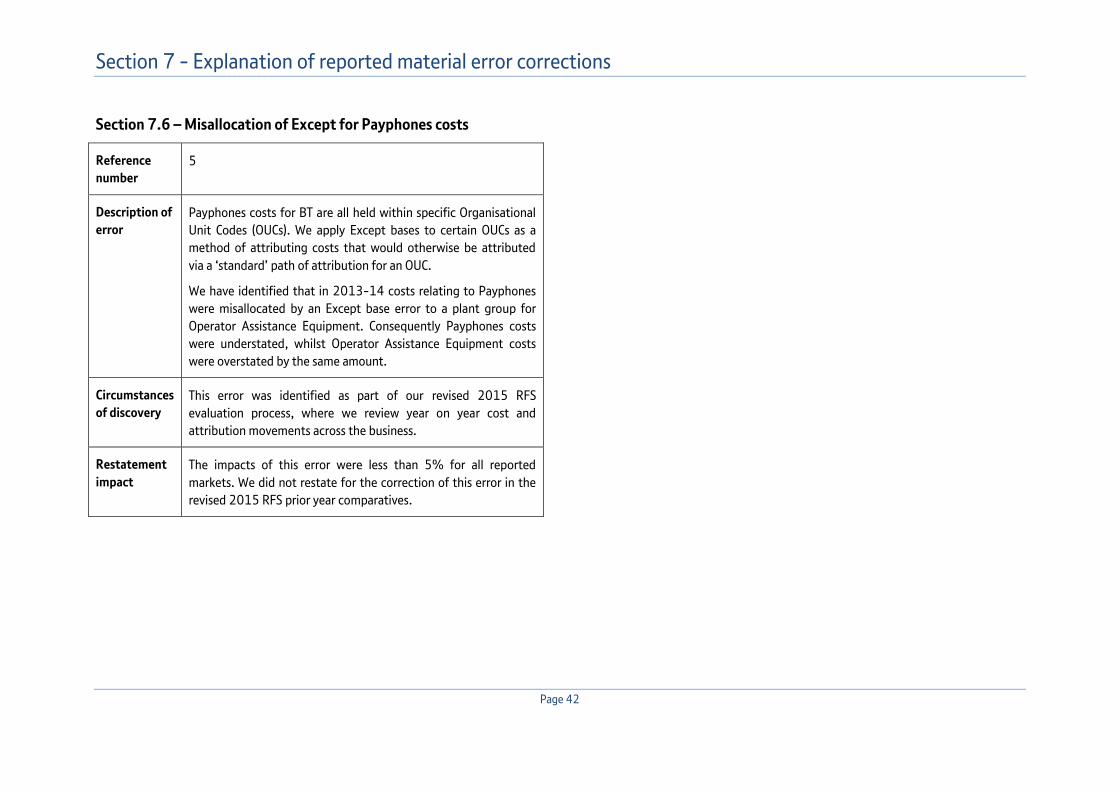
Section 7 - Explanation of reported material error corrections
Page 42
Section 7.6 – Misallocation of Except for Payphones costs
Reference
number
5
Description of
error
Payphones costs for BT are all held within specific Organisational
Unit Codes (OUCs). We apply Except bases to certain OUCs as a
method of attributing costs that would otherwise be attributed
via a ‘standard’ path of attribution for an OUC.
We have identified that in 2013-14 costs relating to Payphones
were misallocated by an Except base error to a plant group for
Operator Assistance Equipment. Consequently Payphones costs
were understated, whilst Operator Assistance Equipment costs
were overstated by the same amount.
Circumstances
of discovery
This error was identified as part of our revised 2015 RFS
evaluation process, where we review year on year cost and
attribution movements across the business.
Restatement
impact
The impacts of this error were less than 5% for all reported
markets. We did not restate for the correction of this error in the
revised 2015 RFS prior year comparatives.
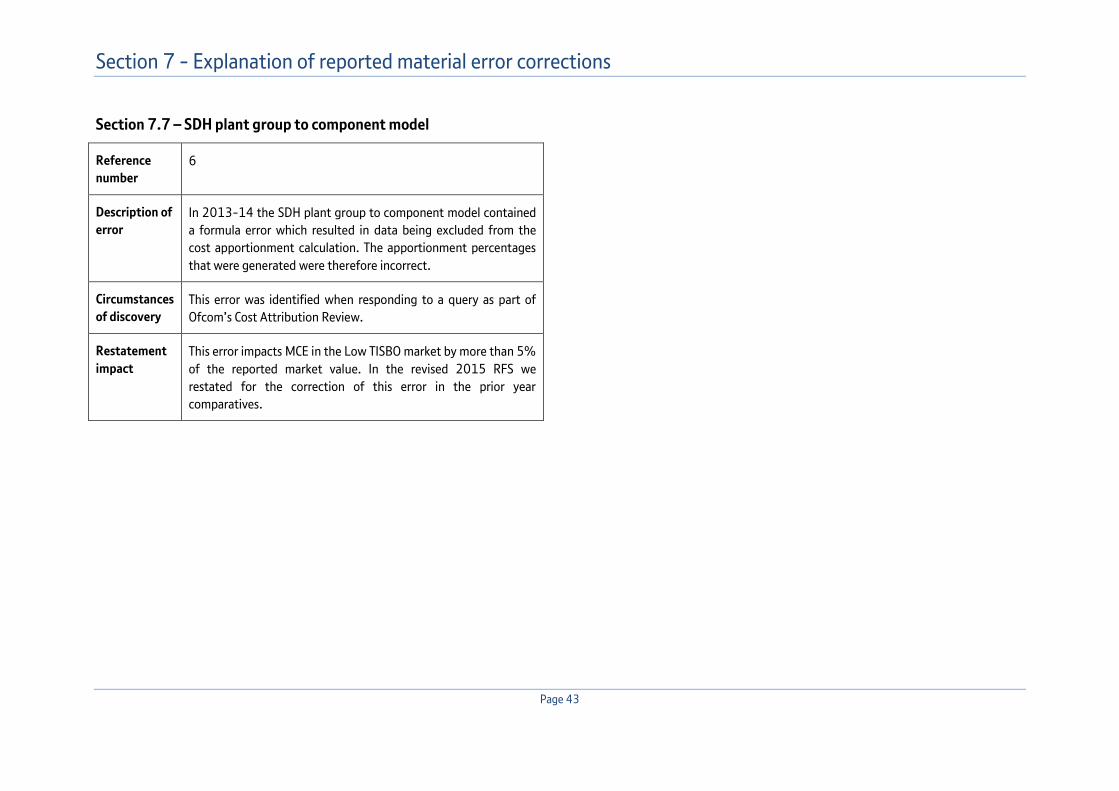
Section 7 - Explanation of reported material error corrections
Page 43
Section 7.7 – SDH plant group to component model
Reference
number
6
Description of
error
In 2013-14 the SDH plant group to component model contained
a formula error which resulted in data being excluded from the
cost apportionment calculation. The apportionment percentages
that were generated were therefore incorrect.
Circumstances
of discovery
This error was identified when responding to a query as part of
Ofcom’s Cost Attribution Review.
Restatement
impact
This error impacts MCE in the Low TISBO market by more than 5%
of the reported market value. In the revised 2015 RFS we
restated for the correction of this error in the prior year
comparatives.

Section 7 - Explanation of reported material error corrections
Page 44
Section 7.8 – ECC cost component rationalisation
Reference
number
7
Description of
error
Excess construction charges (ECCs) are levied when the capital
investment required to provide a new connection exceeds a
certain amount. In these cases the costs are recovered upfront via
an ECC. However the construction costs incurred in providing
these new connections are capitalised in the same way for normal
network construction i.e. under class of works for fibre and duct.
This means that our duct and fibre costs include costs that have
already been recovered from the customer as an ECC.
In 2014-15 we undertook an exercise to rationalise the number
of components used for the ECC apportionment process. We have
reduced the number of specific components used for ECCs. The
implementation of this change identified an error that the
previous method did not map ECC credits to all services using fibre
and duct, when the correct method is to map ECC credits to all
such services.
Circumstances
of discovery
The error was identified after undertaking the component
rationalisation exercise which changed the attribution of costs to
relevant services.
Restatement
impact
This error impacts AISBO WECLA MCE by more than 5% of the
reported market value. In the revised 2015 RFS we restated for
the correction of this error in the prior year comparatives.
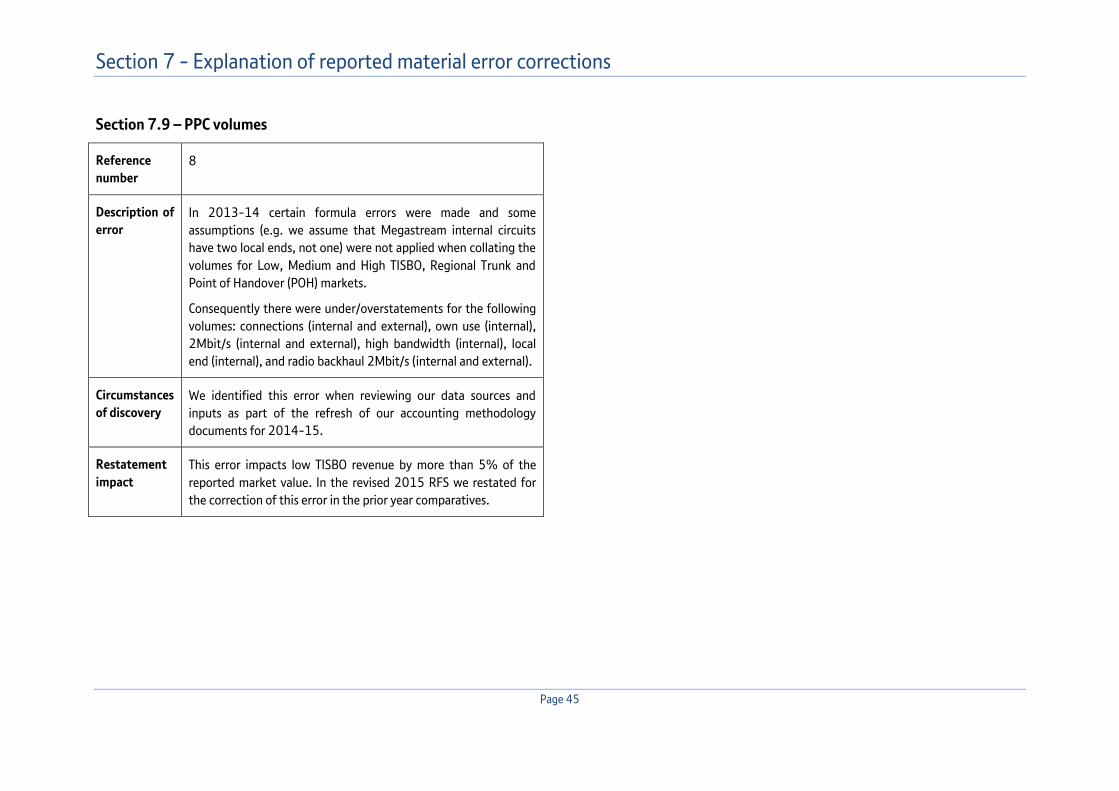
Section 7 - Explanation of reported material error corrections
Page 45
Section 7.9 – PPC volumes
Reference
number
8
Description of
error
In 2013-14 certain formula errors were made and some
assumptions (e.g. we assume that Megastream internal circuits
have two local ends, not one) were not applied when collating the
volumes for Low, Medium and High TISBO, Regional Trunk and
Point of Handover (POH) markets.
Consequently there were under/overstatements for the following
volumes: connections (internal and external), own use (internal),
2Mbit/s (internal and external), high bandwidth (internal), local
end (internal), and radio backhaul 2Mbit/s (internal and external).
Circumstances
of discovery
We identified this error when reviewing our data sources and
inputs as part of the refresh of our accounting methodology
documents for 2014-15.
Restatement
impact
This error impacts low TISBO revenue by more than 5% of the
reported market value. In the revised 2015 RFS we restated for
the correction of this error in the prior year comparatives.

Section 7 - Explanation of reported material error corrections
Page 46
Section 7.10 – WBC internal/external volumes split
Reference
number
9
Description of
error
Wholesale Broadband Connect (WBC) is a service that is sold by BT
Wholesale as well as an input to the Wholesale Broadband
Managed Connect (WBMC) service that is also sold by BT
Wholesale.
The volumes of Wholesale Broadband Connect (WBC) that are
used as in input to Wholesale Broadband Managed Connect
(WBMC) should be reported as internal WBC volumes. However in
2013-14, they were reported as internal or external depending
on the final user of the WBMC service. The WBC volumes that are
used within WBMC are themselves not sold externally as WBC.
Therefore they should always be reported as internal. This impact
changes the presentation of WBC internal and external volumes in
Wholesale Broadband Market A but has no overall impact on the
market.
Circumstances
of discovery
This error was identified as part of work to inform Ofcom’s
preliminary investigation into WBC Distributed Standalone Costs
(DSAC) risks for 2013-14.
Restatement
impact
The error only affects the WBC related services within WBA
Market A and B, reclassifying costs as internal rather than
external, so costs do not move between markets and unit costs
remain the same.
We did not restate for the correction of this error in the revised
2015 RFS prior year comparatives.

Section 7 - Explanation of reported material error corrections
Page 47
Section 7.11 – Non-geographic call termination
Reference
number
10
Description of
error
We have removed non-geographic fixed call terminations from
the Fixed geographic call termination market and reallocated the
costs, assets and volumes to Residual markets in line with Ofcom’s
Narrowband Market Review (September 2013).
Circumstances
of discovery
This error was identified whilst reviewing the market structures
for the 2014-15 RFS.
Restatement
impact
This error impacts the fixed call termination market by more than
5% of the reported market value. In the revised 2015 RFS we
restated for the correction of this error in the prior year
comparatives.

Section 7 - Explanation of reported material error corrections
Page 48
Section 7.12 – Ethernet services
Reference
number
11
Description of
error
We identified three errors relating to 2013-14 Ethernet services:
Wholesale Extension Services (WES) other bandwidth rentals
internal Non-WECLA has sub-products that are a mixture of
different bandwidths. In 2013-14 we omitted 2Mbit/s
circuits from this service.
We identified that some Optical Ethernet 10Gbit/s services
incorrectly used a WES/BES 10Gbit/s price when calculating
the component to service factors. Consequently costs were
understated for optical services.
We did not take account of the fact that Local Access (LA)
variants of Ethernet Access Direct (EAD) can have resilience
options. Resilience ensures that two fibre routes between
service end points are kept as diverse from each other as
possible. Resilience options generate additional fibres and
therefore costs for EAD LA variants would have been
attributed higher costs.
Circumstances
of discovery
This error was identified as part of our 2014-15 RFS evaluation
process, where we review year on year cost and attribution
movements across the business.
Restatement
impact
This error impacts the MISBO non-WECLA market by more than
5% of the reported market value. In the revised 2015 RFS we
restated for the correction of this error in the prior year
comparatives.

Section 7 - Explanation of reported material error corrections
Page 49
Section 7.13 – Call origination volumes
Reference
number
12
Description of
error
Non-geographic call origination volumes were, in 2013-14,
sourced from a system called Powerhouse (a system which sources
data from our Call Statistics Centralisation System (CSCS)). The
Powerhouse system volumes for 2013-14 have been found to be
overstated due to an error in a Powerhouse query used to extract
data from CSCS.
Circumstances
of discovery
We submit call origination volumes to Ofcom on a quarterly basis
and non-geographic volumes which make up a portion of this
submission.
In 2014-15 we identified that the volumes sourced from
Powerhouse were higher than those used for the Ofcom
submission. We were able to perform a similar comparison for the
2013-14 volumes data.
Restatement
impact
This error impacts the call origination market by more than 5% of
the reported market value. In the revised 2015 RFS we restated
for the correction of this error in the prior year comparatives.

Section 7 - Explanation of reported material error corrections
Page 50
Section 7.14 – Ethernet accruals
Reference
number
13
Description of
error
In 2013-14 there were several revenue accrual adjustments
applied to Ethernet services in the Openreach management
accounts. These accruals were reflected in the RFS service
revenues. Volumes were derived for these accruals using average
prices.
We subsequently identified that there should not have been any
adjustment made to volumes. Non-WECLA volumes for AISBO
Ethernet Access Direct (EAD) connection and rental services, non-
WECLA volumes for MISBO Backhaul Extension Services (BES)
rentals and Optical Spectrum Access (OSA) connection services
were subsequently misstated. There were cost over- and under-
statements as a result of these volume misstatements.
Circumstances
of discovery
In 2014-15 we reviewed the 2013-14 RFS inputs and identified
that there should not have been any adjustments made to
volumes.
Restatement
impact
The impacts of this error were less than 5% for all reported
markets. We did not restate for this error correction in the revised
2015 RFS prior year comparatives.

Section 7 - Explanation of reported material error corrections
Page 51
Section 7.15 – OSA Main Links
Reference
number
14
Description of
error
We identified that in 2013-14 we used incorrect average main
link lengths for WECLA Ethernet OSA Wavelength services.
Consequently the WECLA Ethernet volumes and revenue were
inflated. The inflated WECLA volumes and revenues were offset by
a corresponding reduction in non-WECLA volumes.
Circumstances
of discovery
In 2014-15, we further reviewed the inputs for 2013-14 and
identified these errors.
Restatement
impact
The impacts of this error were less than 5% for all reported
markets. We did not restate for this error correction in the revised
2015 RFS prior year comparatives.

Section 7 - Explanation of reported material error corrections
Page 52
Section 7.16 – BT Wholesale cost of sales transfer charges
Reference
number
15
Description of
error
Costs relating to BT Wholesale cost of sale transfer charges were
in 2013-14 treated as an overhead of BT Wholesale activities.
These costs of sale are incurred by BT Wholesale in providing non-
regulated services.
Circumstances
of discovery
This error was identified when responding to a query as part of
Ofcom’s Cost Attribution Review.
Restatement
impact
This error impacted costs across various markets by less than 5%
of all reported market values. However, to ensure that the impact
of changes not restated for is less than 5% for all market totals, In
the revised 2015 RFS we restated for the correction of this error
in the prior year comparatives.