Embed Size (px)
Citation preview
ILLINOIS INSTITUTE FOR ENVIRONMENTAL QUALITY
RECONNAISSANCE STUDY OF FINAL CUT IMPOUNDMENTS
Document No. 78/25
IIEQ DOC. No. 78/25 June, 1978
RECONNAISSANCE STUDY OF FINAL CUT IMPOUNDMENTS
by
James P. Gibb Associate Engineer
and
Ralph L. Evans Head, Water Quality Section Illinois State Water Survey Urbana, Illinois 61801
PROJECT OFFICER: Marie Lauricella Project No. 80.096
Frank Beal, Director State of Illinois
Institute for Environmental Quality 309 West Washington Street Chicago, Illinois 60606
NOTE
This report has been reproduced as received from the contractor. No editorial or other changes have been made. Conclusions expressed are those of the contractor.
Printed by Authority of the State of Illinois
Date Printed: June, 1978 Quantity Printed: 300
This document has been cataloged as follows:
Gibb, James P. Reconnaissance study of final cut impoundments /
by James P. Gibb and Ralph L. Evans. -- Chicago : Illinois Institute for Environmental Quality, 1978
v, 101 p. ; 28 cm. -- (IIEQ Doc. No. 78/25)
1. Strip mine impoundments - Illinois 2. Strip mine lands - hydrology - Illinois 3. Strip mine lakes - Illinois 4. Strip mining - coal - Illinois
IIEQ Enviornmental Information Center
Illinois Institute for Environmental Quality 309 West Washington Street
Chicago, IL 60606 (312) 793-3870
ii
CONTENTS
Page Acknowledgments v
Abstract 1
Introduction 2
Physical features of the lakes 6
Lake selection 6
Volume and area determinations 7
Yield determinations 8
Groundwater yields 8
Surface water yields 10
Summary of lake physical features 13
Regional water needs and resources 16
Water quality 19
Methods and materials 19
Dissolved oxygen, temperature, and pH 21
Total dissolved solids, hardness, sulfate, alkalinity. 21
Chloride, nitrate, and fluoride 26
Sodium and potassium 26
Iron and manganese 26
Heavy metals 28
Sediments 28
Summary 30
Chemical suitability 32
Public water supply 32
Irrigation 33
Livestock watering 35
Summary 36
Recommendations 37
Potential use recommendations 37
Recommendations for further study 39
Appendix. Lake summaries 41
References 101
iii
ACKNOWLEDGMENTS
The authors wish to thank the private clubs and coal companies that
permitted studies to be conducted on lakes on their property. The co
operation of Coal City Area No. 1 Club, South Wilmington Sportsman Club,
Amax Coal Company, Consolidated Coal Company, Peabody Coal Company, and
Southwestern Coal Company is greatly appreciated. Special thanks go to
Al Grandt and Jack Lowery of Peabody Coal Company for their assistance
in arranging the pump test on the Middle Grove impoundment. Mr. Gene
Filer, Department of Mines and Minerals, arranged for the flight over
the strip mine areas and provided support of the project from its begin
ning.
Field measurements and calculations of lake volumes and yields were
made by William C. Bogner, Assistant Hydrologist, with the assistance of
Steve Wirth and Ken Smith, Hydrology Assistants. Water quality measure
ments and samples were collected by Donald Roseboom and Tom Hill, Assistant
Biologists, and Jack Williams, Technical Assistant. Analyses of water
samples were conducted at the Peoria and Urbana laboratories of the
Illinois State Water Survey.
The project was conducted under the general supervision of John B.
Stall, Engineer Emeritus and former Head of Hydrology, and Richard J.
Schicht, Head of Hydrology, Illinois State Water Survey. Schicht also
reviewed the final manuscript. The art work was prepared by June Blake
and William Motherway, Jr. The draft and final manuscripts were typed by
Diane Stelter and Janny Travers. J. Loreena Ivens and Patricia A. Motherway
edited the final report, and Diane Stelter prepared the camera copy.
v
ABSTRACT
Twelve representative final cut impoundments were selected and
studied to determine their volumes and estimated yield potentials.
The volumes range from 97 to 3488 acre-feet and average 812 acre-feet.
Estimated yield potentials at a 2-year recurrence interval range from
0.15 to 3.98 million gallons per day and average 0.86 million gallons per
day. Projections of these estimates to lakes inventoried through June 30,
1971, were made and presented as county totals. The potential water supply
from final cut impoundments for the 40 surface mining counties in Illinois
range from 0 to 75.66 mgd. For 10 counties the estimated yield potential
from final cut impoundments exceeds the estimated 2020 water demands.
Based on published water quality requirements and data collected
during this study, only 2 of the 12 lakes studied have water quality
suitable as a source for public water supply. Three are suitable for
irrigation and all 12 are suitable for livestock watering. However, the
quality of water from these impoundments is treatable and often comparable
to the quality of alternative water sources. Each lake should be evaluated
more closely in terms of yield, quality, and the economics of development
as compared with other available water resources.
2
INTRODUCTION
The first commercial surface coal mine in the United States was opened
near Danville, Illinois, in 1866. Horsedrawn scrapers were used to remove
shallow overburden materials and the underlying coal (1). The development
of a large steam-powered stripping shovel in 1911, followed by continued de
velopment of larger and more efficient equipment, has greatly expanded the
surface mining industry (2). Surface mining now is a major method used in
producing the nation's coal needs. In 1977, coal production in Illinois
totaled approximately 53.9 million tons, of which about 45 percent (24.3
million tons) was from surface mining (preliminary figures from the
Illinois Department of Mines and Minerals).
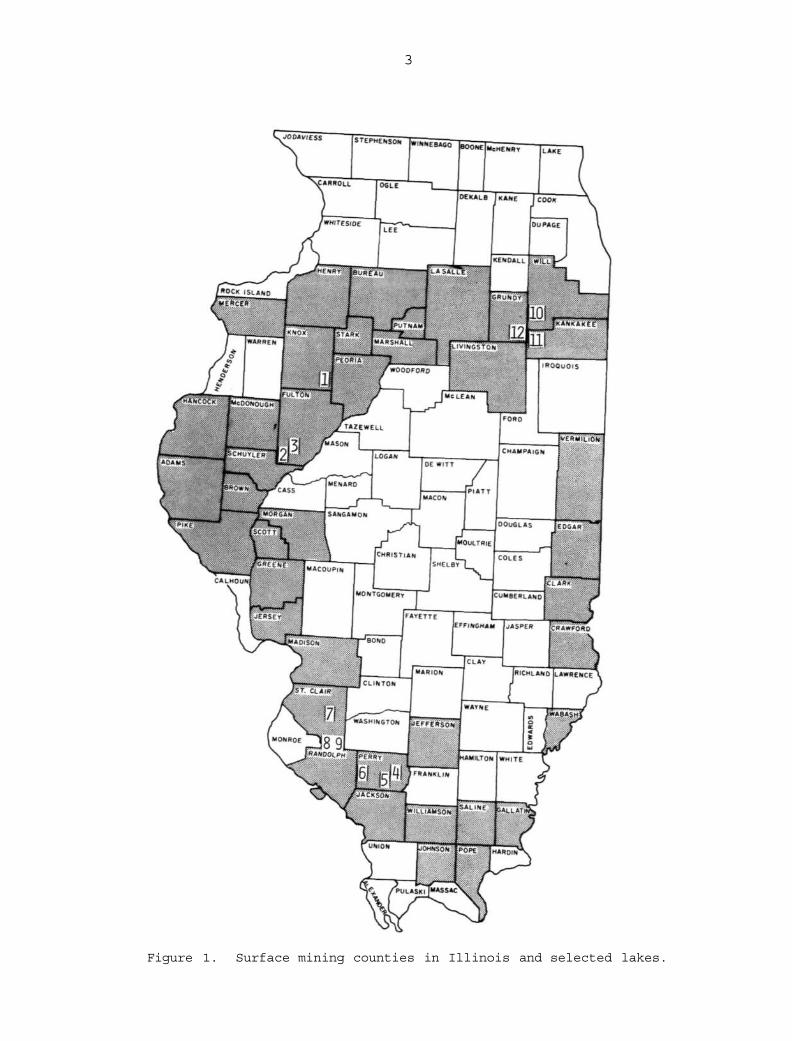
Surface mining for coal in Illinois occurs in 40 counties (see figure
1). Strippable bituminous coal reserves (coal seams at least 18 inches
thick and less than 150 feet below land surface) are the largest in the
United States (3). Excluding two areas not yet mapped, Simon and Smith
(3) reported an estimated 19 billion tons underlying 2.3 million acres of
Illinois land.
As of June 30, 1971, a total of 163,643 acres (only 7 percent of the
potential strippable area) of Illinois land had been surface mined for
coal. Twelve counties contained 90 percent of the mined acreage: Fulton
40,524; Perry 20,317; Knox 17,350; Williamson 12,701; St. Clair 12,482;
Saline 9504; Grundy 7134; Peoria 6187; Will 6067; Randolph 5425;
Vermilion 5297; and Jackson 4899 acres (4).
Water on surface-mined lands totaled 14,243 acres of which 12,149
3
Figure 1. Surface mining counties in Illinois and selected lakes.
4
acres are lakes developed in abandoned pits resulting from the final cut
and the haulage roads (4).
There is extensive literature concerning strip raining of coal in
Illinois. Most reports discuss the coal reserves suitable for surface
mining, the reclamation of land after mining, and acid drainage problems
resulting from mine activities. Recreational use of strip-mined lands
and their waters also has received considerable attention. However, very
little work has been done to better understand the hydrology of strip-
mined lands or to evaluate the potential resource of the water bodies
contained in strip-mined areas.
Federal legislation in the Coal Surface Mine Regulation Act now re
quires that strip mine impoundments or water bodies be filled. This
action has alerted officials in the state of Illinois to the fact that
the potential resources offered by these lakes may be destroyed. Per
sonnel of the Department of Mines and Minerals particularly were concerned
and supportive of a study of these potential resources. Because so little
is known of the character of final cut impoundments this reconnaissance-
type investigation-was undertaken. The purpose of the study was to evalu
ate the usefulness of final cut impoundments for public water supply,
irrigation, and other consumptive uses.
Four general study areas, Grundy, St. Clair, Fulton, and Perry
Counties were selected. In each study area, 3 lakes of representative
size and geologic-hydrologic setting were chosen for detailed study. Each
lake was surveyed to determine its area and capacity. An estimate of the
sustained yield of each lake also was made. Water samples for chemical
5
analysis were collected from each lake at three time intervals to deter
mine the chemical, physical, and biological quality of the water as it
relates to the proposed uses.
On the basis of results of the sample lake studies and available
maps of all lakes in the 40 counties where surface mining exists, estimates
of the water resource from final cut impoundments were made. A general
inventory of other water resources and projected needs for these counties
also is presented. The potential uses of final cut lakes are discussed
from the basis of water quality, quantity available, and the estimated
needs of the area.
Recommendations concerning further study of final cut impoundments
also are made.
6
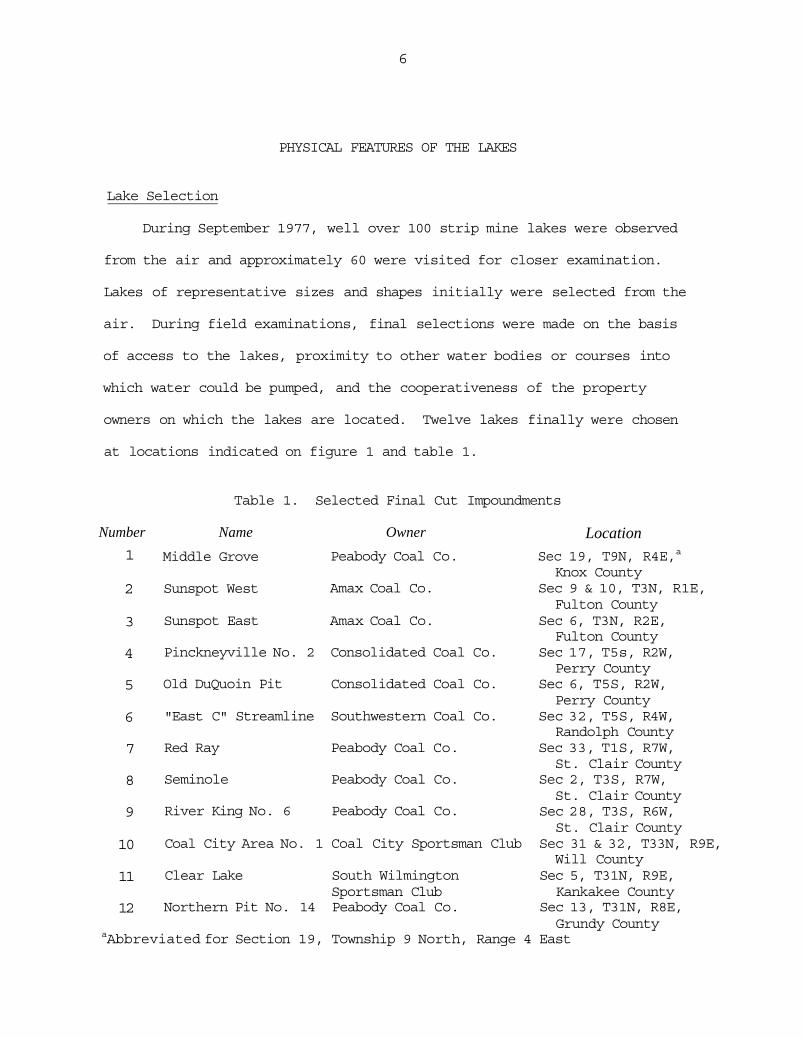
PHYSICAL FEATURES OF THE LAKES
Lake Selection
During September 1977, well over 100 strip mine lakes were observed
from the air and approximately 60 were visited for closer examination.
Lakes of representative sizes and shapes initially were selected from the
air. During field examinations, final selections were made on the basis
of access to the lakes, proximity to other water bodies or courses into
which water could be pumped, and the cooperativeness of the property
owners on which the lakes are located. Twelve lakes finally were chosen
at locations indicated on figure 1 and table 1.
Table 1. Selected Final Cut Impoundments
Number Name Owner Location 1 Middle Grove Peabody Coal Co. Sec 19, T9N, R4E,a
Knox County 2 Sunspot West Amax Coal Co. Sec 9 & 10, T3N, R1E,
Fulton County 3 Sunspot East Amax Coal Co. Sec 6, T3N, R2E,
Fulton County 4 Pinckneyville No. 2 Consolidated Coal Co. Sec 17, T5s, R2W,
Perry County 5 Old DuQuoin Pit Consolidated Coal Co. Sec 6, T5S, R2W,
Perry County 6 "East C" Streamline Southwestern Coal Co. Sec 32, T5S, R4W,
Randolph County 7 Red Ray Peabody Coal Co. Sec 33, T1S, R7W,
St. Clair County 8 Seminole Peabody Coal Co. Sec 2, T3S, R7W,
St. Clair County 9 River King No. 6 Peabody Coal Co. Sec 28, T3S, R6W,
St. Clair County 10 Coal City Area No. 1 Coal City Sportsman Club Sec 31 & 32, T33N, R9E,
Will County 11 Clear Lake South Wilmington
Sportsman Club Sec 5, T31N, R9E, Kankakee County
12 Northern Pit No. 14 Peabody Coal Co. Sec 13, T31N, R8E, Grundy County
aAbbreviated for Section 19, Township 9 North, Range 4 East
7
Two of the selected lakes, Pinckneyville No. 2 (lake 4) and "East C"
Streamline (lake 6), were still in the process of filling after the con
clusion of mining. It was hoped that data collected on these lakes would
prove useful in determining the yield capabilities of these lakes.
Volume and Area Determinations
Aerial photographs were obtained for each lake to determine surface
areas and to select the locations of range lines along which depth measure
ments were to be made. Depth measurements were taken along each range
line at 50 foot intervals using a Lowrance model LFG 360 depth sounder.
This sounding device operates on sonar principles at a frequency of 192
kilohertz. The transducer emits a 22-degree signal resulting in a 12
foot diameter circle at a depth of 30 feet. Proper reading of the dial
and suppression of false signals permitted obtaining depth measurements
within 1 foot of mechanically measured depths.
The six lakes in the southern part of the state (lakes 4-9) were
measured in the fall of 1977 from a boat during periods of open water.
A marked polyethylene cable was used to determine the horizontal spacings
of readings along the range line. The lakes located in western and
northern Illinois (lakes 1-3 and 10-12) were measured during the winter
months through ice ranging in thickness from about 6 to 18 inches. The
horizontal spacings of readings along these range lines were determined
by using a steel tape. At the time of each lake survey the water level
of the lake above mean sea level was determined by running a line of
levels from the nearest U. S. Geological Survey bench mark.
8
After the depth measurements were completed, cross-sectional profiles
for each range line were plotted. Representative profiles for each lake
are presented in the Appendix of Lake Summaries in this report. Lake
volumes were calculated by the average end area method. Volume and area
calculations at various water level stages permitted the development of
stage-volume and stage-area curves for each lake.
Yield Determinations
Groundwater Yields
In the original study proposal, it was planned that several lakes
would be pumped and the recovery rates after pumping would be monitored
to determine the yield capability of each lake. It also was planned that
piezometers would be installed at each lake that was pumped to allow for
analysis of the surrounding groundwater regime. After determining the
costs associated with pumping the large amounts of water required to lower
the lake levels just 2 feet, it was decided to attempt to pump only 1 lake
and install piezometers in the spoil material surrounding it. Peabody
Coal Company offered their assistance and the use of one of their pumps
at the Middle Grove lake, and it was chosen to be pumped. The data gather
ed from that work are also given in the Lake Summaries Appendix. Water
balance analyses of the data showed groundwater contributions to the lake
varying from about 200 to 500 gallons per minute (gpm) during the pumping
test. In general, the larger values were experienced during the early
stages of the test. Small errors in reading lake levels from the staff
gage due to wave action on the lake were particularly sensitive during
this period. Immediately after the pumping test, during a period of no
9
rain, analysis of lake level recovery data indicated groundwater contri
butions to the lake at about 200 gallons per minute.
Two other lakes (Pinckneyville No. 2 and "East C" Streamline) were
selected for study because data were available describing the rates they
filled after the mines closed. Two years of data existed for the "East C"
lake and the Pinckneyville pit was just in the process of filling and
could be monitored. The pumping attempts and monitoring of lakes while
filling both were designed to obtain information on the groundwater con
tribution capabilities of the spoil materials surrounding these lakes.
Water balance analyses of the data for the "East C" and Pinckneyville
lakes proved to be instructive but did not provide the answers desired.
The results of the water balance analysis for the two lakes are presented
in the Lake Summaries.
Several factors influence the groundwater contribution capabilities
of strip mine spoil. The character of the premining overburden, the ratio
of drift materials to underlying rock overburden, the method of handling
the materials, the equipment used, and the age of the spoil all affect the
final hydrologic character of strip mine spoil. In dragline operations
(commonly used in Illinois), spoil from the dragline is cast into the pre
ceding trench in a series of intersecting cones. The bucket is dumped at
one point until a large cone is built up. The bucket then moves back
several feet and continues operating, casting materials onto the side of
the previous pile, creating a long continuous spoil pile with cone-shaped
peaks.
10
This handling procedure promotes the formation of a gravity-sorted
rubble layer. The larger spoil fragments that have been fractured and
broken by blasting and handling tend to roll to the bottom of the pile
forming a coarse-grained rubble base (5) . The formation of such a basal
layer has been noted in mining operations in southern Illinois where
limestone and consolidated shale are common in the overburden materials.
In western and northern Illinois the overburden materials are primarily
drift and soft fissel shale and this phenomenon usually does not occur.
Because of the various factors that can affect the hydrologic charac
ter of spoil materials, groundwater data from one strip mine area are not
transferable to other areas. In this study, it is fortunate that the
lake chosen for the pumping test is located in an area where the over
burden materials were drift and soft fissel shale. The resulting spoil
material therefore is likely to be among the least permeable in the state.
Groundwater yield data obtained at this lake therefore should be conserva
tive when applied to lakes in more permeable geologic settings. To esti
mate lake yields at all sites studied, 200 gpm ÷ 5500 feet (the length
of the Middle Grove lake) or 0.036 gpm per foot of lake was used.
Surface Yields
To estimate the surface water yield of the lakes studied, runoff from
the individual watersheds and an estimate of lake evaporation were con
sidered. The U. S. Soil Conservation Service (SCS) method for determining
runoff from small agricultural watersheds was used to estimate runoff (6).
11
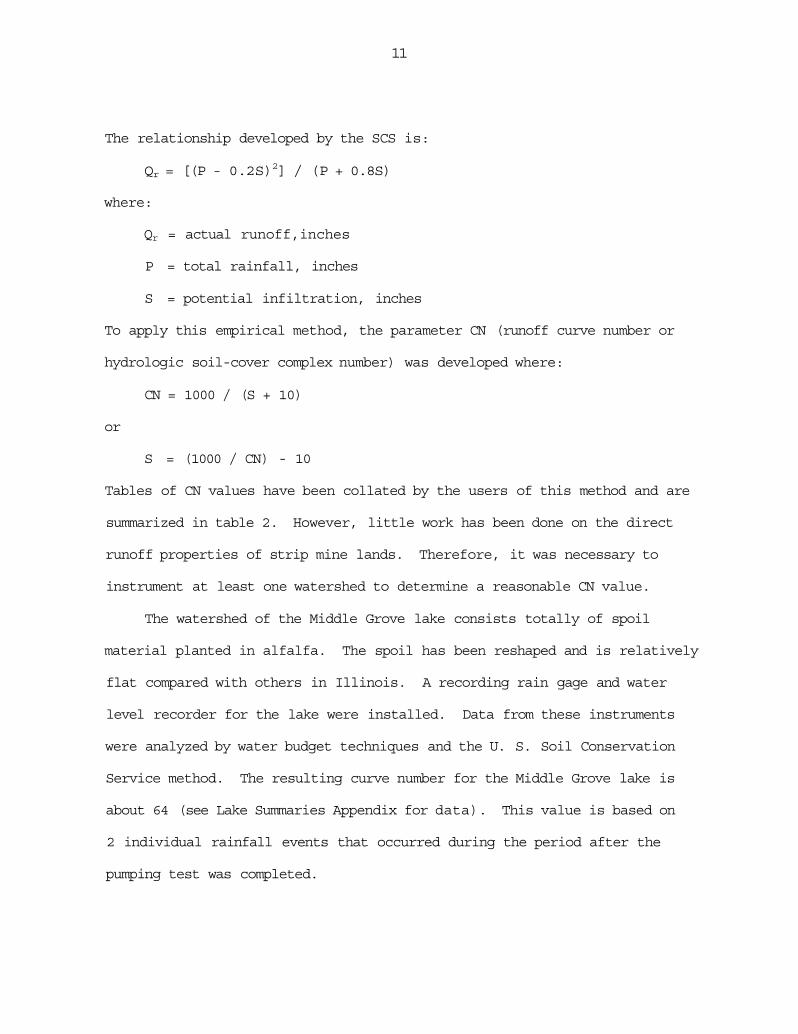
The relationship developed by the SCS is:
Qr = [(P - 0.2S)2] / (P + 0.8S)
where:
Qr = actual runoff,inches
P = total rainfall, inches
S = potential infiltration, inches
To apply this empirical method, the parameter CN (runoff curve number or
hydrologic soil-cover complex number) was developed where:
CN = 1000 / (S + 10)
or
S = (1000 / CN) - 10
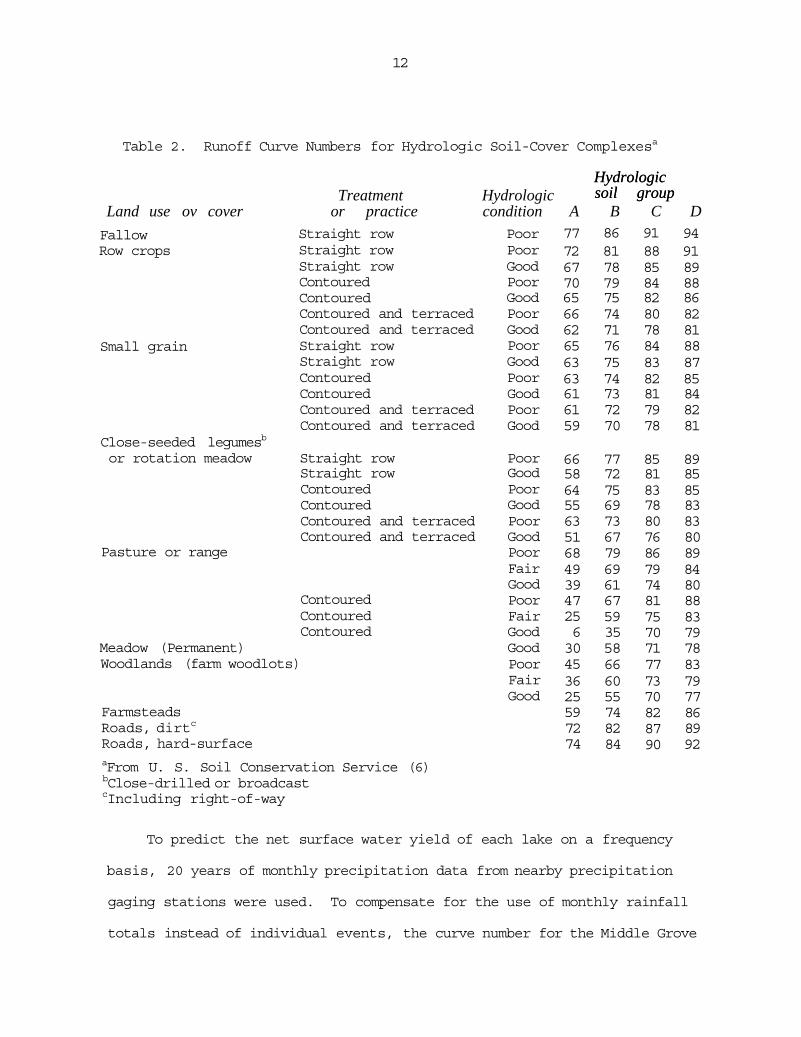
Tables of CN values have been collated by the users of this method and are
summarized in table 2. However, little work has been done on the direct
runoff properties of strip mine lands. Therefore, it was necessary to
instrument at least one watershed to determine a reasonable CN value.
The watershed of the Middle Grove lake consists totally of spoil
material planted in alfalfa. The spoil has been reshaped and is relatively
flat compared with others in Illinois. A recording rain gage and water
level recorder for the lake were installed. Data from these instruments
were analyzed by water budget techniques and the U. S. Soil Conservation
Service method. The resulting curve number for the Middle Grove lake is
about 64 (see Lake Summaries Appendix for data). This value is based on
2 individual rainfall events that occurred during the period after the
pumping test was completed.
12
Table 2. Runoff Curve Numbers for Hydrologic Soil-Cover Complexesa
Hydrologic soil group Treatment Hydrologic Hydrologic soil group
Land use ov cover or practice condition A B C D Fallow Straight row Poor 77 86 91 94 Row crops Straight row Poor 72 81 88 91
Straight row Good 67 78 85 89 Contoured Poor 70 79 84 88 Contoured Good 65 75 82 86 Contoured and terraced Poor 66 74 80 82 Contoured and terraced Good 62 71 78 81
Small grain Straight row Poor 65 76 84 88 Straight row Good 63 75 83 87 Contoured Poor 63 74 82 85 Contoured Good 61 73 81 84 Contoured and terraced Poor 61 72 79 82 Contoured and terraced Good 59 70 78 81
Close-seeded legumesb
or rotation meadow Straight row Poor 66 77 85 89 Straight row Good 58 72 81 85 Contoured Poor 64 75 83 85 Contoured Good 55 69 78 83 Contoured and terraced Poor 63 73 80 83 Contoured and terraced Good 51 67 76 80
Pasture or range Poor 68 79 86 89 Fair 49 69 79 84 Good 39 61 74 80
Contoured Poor 47 67 81 88 Contoured Fair 25 59 75 83 Contoured Good 6 35 70 79
Meadow (Permanent) Good 30 58 71 78 Woodlands (farm woodlots) Poor 45 66 77 83
Fair 36 60 73 79 Good 25 55 70 77
Farmsteads 59 74 82 86 Roads, dirtc 72 82 87 89 Roads, hard-surface 74 84 90 92 aFrom U. S. Soil Conservation Service (6) bClose-drilled or broadcast cIncluding right-of-way
To predict the net surface water yield of each lake on a frequency
basis, 20 years of monthly precipitation data from nearby precipitation
gaging stations were used. To compensate for the use of monthly rainfall
totals instead of individual events, the curve number for the Middle Grove
13
lake was adjusted downward to 60. Curve numbers for the other lakes were
chosen on the basis of the relative condition of each watershed as compared
with that at Middle Grove. The percentages of farm land and spoil and the
condition of the spoil were considered in selecting the final curve num
bers.
Net surface water yields for each lake were calculated for the years
1958 through 1977 by applying the average monthly lake evaporation to each
month's calculated runoff. Monthly evaporation rates for each lake were
taken directly from state maps presented by Roberts and Stall (7). Net
annual runoff totals were ranked and the values exceeded 90, 50, 20, and
10 percent of the time are presented for each lake. These values corre
spond to recurrence intervals of 1.1, 2, 5, and 10 years, respectively.
Summary of Lake Physical Features
A summary of the physical features of the 12 lakes studied is present
ed in table 3. Surface areas at the surveyed pool elevations range from
5.83 to 112 acres and average 34.97 acres. On the basis of the observed
sizes of other final cut lakes in Illinois, we feel that the lakes selected
for study are representative of such lakes in Illinois. Lake 6 was ob
viously among the largest observed in the initial screening from the air
and lake 7 was among the smallest.
The volumes of the 12 lakes studied range from 97 to 3488 acre-feet
and average 812 acre-feet. The volumes are a function of the surface area
and depth. Average depths of the lakes range from 13.5 to 31.1 feet.
Lakes 6 and 11 have average depths greater than 30 feet. No regional
trends were noted concerning lake areas, volumes, or depths.
14
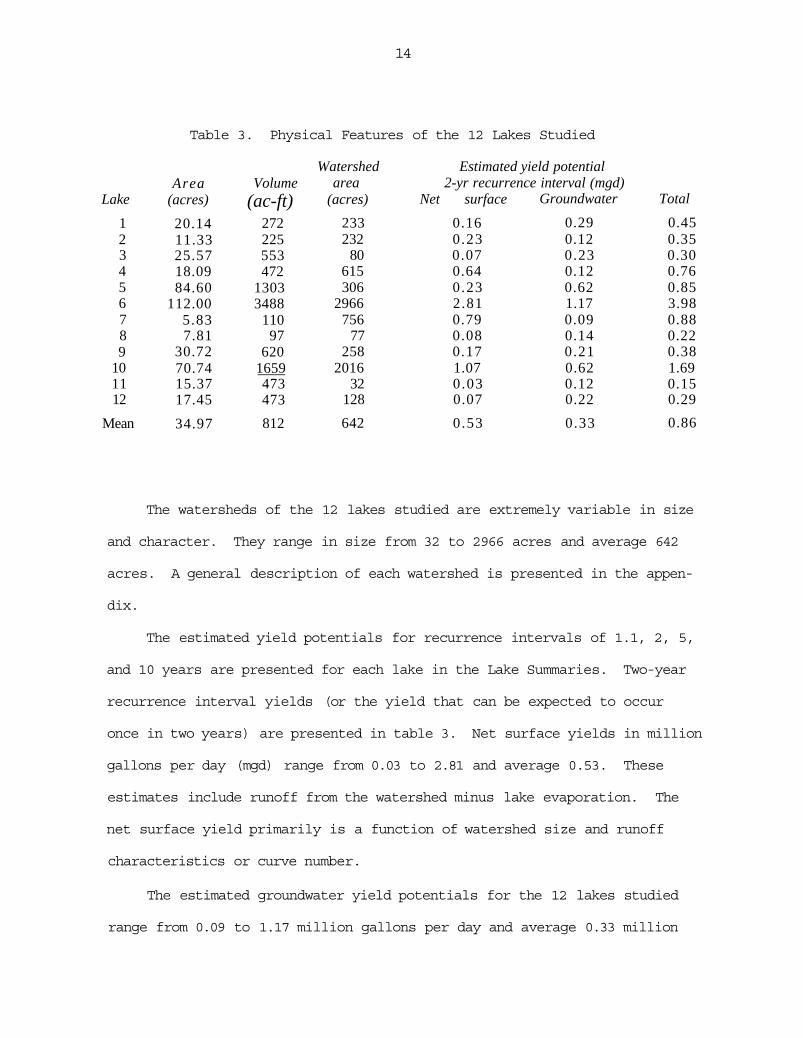
Table 3. Physical Features of the 12 Lakes Studied
Watershed Estimated yield potential Area Volume area 2-yr recurrence interval (mgd)
Lake (acres) (ac-ft) (acres) Net surface Groundwater Total
1 20.14 272 233 0.16 0.29 0.45 2 11.33 225 232 0.23 0.12 0.35 3 25.57 553 80 0.07 0.23 0.30 4 18.09 472 615 0.64 0.12 0.76 5 84.60 1303 306 0.23 0.62 0.85 6 112.00 3488 2966 2.81 1.17 3.98 7 5.83 110 756 0.79 0.09 0.88 8 7.81 97 77 0.08 0.14 0.22 9 30.72 620 258 0.17 0.21 0.38
10 70.74 1659 2016 1.07 0.62 1.69 11 15.37 473 32 0.03 0.12 0.15 12 17.45 473 128 0.07 0.22 0.29
Mean 34.97 812 642 0.53 0.33 0.86
The watersheds of the 12 lakes studied are extremely variable in size
and character. They range in size from 32 to 2966 acres and average 642
acres. A general description of each watershed is presented in the appen
dix.
The estimated yield potentials for recurrence intervals of 1.1, 2, 5,
and 10 years are presented for each lake in the Lake Summaries. Two-year
recurrence interval yields (or the yield that can be expected to occur
once in two years) are presented in table 3. Net surface yields in million
gallons per day (mgd) range from 0.03 to 2.81 and average 0.53. These
estimates include runoff from the watershed minus lake evaporation. The
net surface yield primarily is a function of watershed size and runoff
characteristics or curve number.
The estimated groundwater yield potentials for the 12 lakes studied
range from 0.09 to 1.17 million gallons per day and average 0.33 million
15
gallons per day. These estimates are based solely on the data collected at
the Middle Grove lake site. However, as stated earlier, these estimates
probably are conservative. It is very likely that lakes 4, 5, 6, 8, and
9 Would be capable of yielding larger quantities of groundwater than esti
mated. The overburden materials for these lakes all contained significant
quantities of limestone and consolidated shales that could result in a
more permeable spoil and perhaps a very permeable rubble base.
The total estimated yield potential of the 12 lakes for a recurrence
interval of 2 years ranges from 0.15 to 3.98 million gallons per day and
averages 0.86 million gallons per day. These values are conservative
estimates and are functions of the individual characteristics of each
lake. These estimates also do not allow for any drawdown in lake levels
(the lakes would theoretically always be full). Direct application of
these values to other lakes is not recommended, and if a lake is to be
used for a consumptive use, a more detailed yield analysis should be
undertaken. No regional trends were noted in the yield estimates com
pleted for the 12 lakes studied.
16
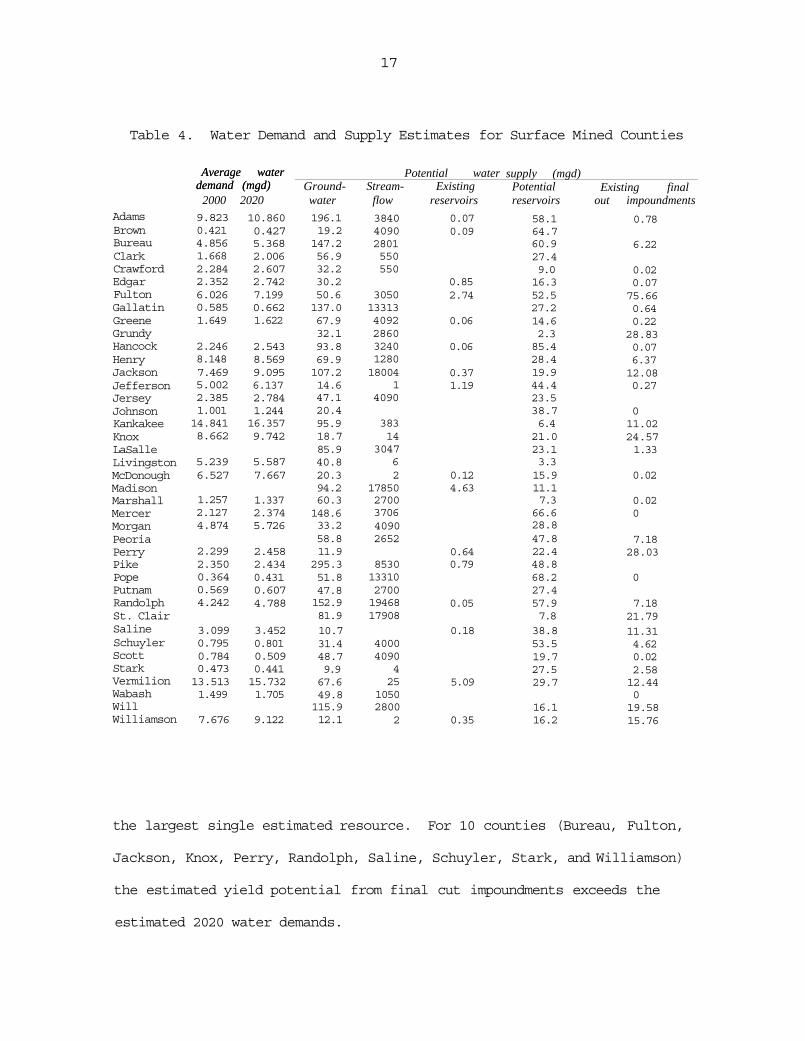
REGIONAL WATER NEEDS AND RESOURCES
One of the stated purposes of this project was to estimate the total
potential water resource offered by final cut impoundments in Illinois.
Because of the extreme variability of estimated individual lake yields and
of chemical quality, to be discussed later, only very general regional
estimates were made. Data assembled by Csallany and others (8) include
estimates of potential water resources from groundwater, streamflow,
existing man-made reservoirs, and potential reservoirs. Table 4 presents
those data for the 40 counties in Illinois where surface mining of coal
exists. For comparison, an estimate was made of water available from all
final cut impoundments inventoried by Haynes and Klimstra (4). It should
be noted that their inventory included lakes in existence through June 30,
1971.
The estimated 2000 and 2020 average water demands for each county
were made by the formula developed by Roberts and others (9) and population
projections of the Illinois Bureau of the Budget (10). No estimates were
made for Grundy, LaSalle, Madison, Peoria, St. Clair, or Will Counties as
the formula used is not applicable to industrialized areas such as these.
The total acreages of final cut impoundments for each county were
multiplied by an average yield-surface area ratio (0.025 mgd/acre) obtained
from the 12 lakes studied. These estimates are presented in table 4.
Assuming that the water quality from these impoundments is suitable,
there appears to be significant amounts of water available from this re
source in Fulton, Grundy, Knox, Perry, St. Clair, Will, and Williamson
Counties. For Knox and Perry Counties, the final cut impoundments offer
17
Table 4. Water Demand and Supply Estimates for Surface Mined Counties
Average water demand (mgd)
Potential water supply (mgd) Average water demand (mgd) Ground Stream- Existing Potential Existing final
2000 2020 water flow reservoirs reservoirs out impoundments Adams 9.823 10.860 196.1 3840 0.07 58.1 0.78 Brown 0.421 0.427 19.2 4090 0.09 64.7 Bureau 4.856 5.368 147.2 2801 60.9 6.22 Clark 1.668 2.006 56.9 550 27.4 Crawford 2.284 2.607 32.2 550 9.0 0.02 Edgar 2.352 2.742 30.2 0.85 16.3 0.07 Fulton 6.026 7.199 50.6 3050 2.74 52.5 75.66 Gallatin 0.585 0.662 137.0 13313 27.2 0.64 Greene 1.649 1.622 67.9 4092 0.06 14.6 0.22 Grundy 32.1 2860 2.3 28.83 Hancock 2.246 2.543 93.8 3240 0.06 85.4 0.07 Henry 8.148 8.569 69.9 1280 28.4 6.37 Jackson 7.469 9.095 107.2 18004 0.37 19.9 12.08 Jefferson 5.002 6.137 14.6 1 1.19 44.4 0.27 Jersey 2.385 2.784 47.1 4090 23.5 Johnson 1.001 1.244 20.4 38.7 0 Kankakee 14.841 16.357 95.9 383 6.4 11.02 Knox 8.662 9.742 18.7 14 21.0 24.57 LaSalle 85.9 3047 23.1 1.33 Livingston 5.239 5.587 40.8 6 3.3 McDonough 6.527 7.667 20.3 2 0.12 15.9 0.02 Madison 94.2 17850 4.63 11.1 Marshall 1.257 1.337 60.3 2700 7.3 0.02 Mercer 2.127 2.374 148.6 3706 66.6 0 Morgan 4.874 5.726 33.2 4090 28.8 Peoria 58.8 2652 47.8 7.18 Perry 2.299 2.458 11.9 0.64 22.4 28.03 Pike 2.350 2.434 295.3 8530 0.79 48.8 Pope 0.364 0.431 51.8 13310 68.2 0 Putnam 0.569 0.607 47.8 2700 27.4 Randolph 4.242 4.788 152.9 19468 0.05 57.9 7.18 St. Clair 81.9 17908 7.8 21.79 Saline 3.099 3.452 10.7 0.18 38.8 11.31 Schuyler 0.795 0.801 31.4 4000 53.5 4.62 Scott 0.784 0.509 48.7 4090 19.7 0.02 Stark 0.473 0.441 9.9 4 27.5 2.58 Vermilion 13.513 15.732 67.6 25 5.09 29.7 12.44 Wabash 1.499 1.705 49.8 1050 0 Will 115.9 2800 16.1 19.58 Williamson 7.676 9.122 12.1 2 0.35 16.2 15.76
the largest single estimated resource. For 10 counties (Bureau, Fulton,
Jackson, Knox, Perry, Randolph, Saline, Schuyler, Stark, and Williamson)
the estimated yield potential from final cut impoundments exceeds the
estimated 2020 water demands.
18
Based totally on availability, the resource potential offered by the
existence of final cut impoundments is certainly worth further investiga
tion. The fact that these water bodies already exist is of economic
significance and many are located in relatively water poor areas, particu
larly groundwater poor areas.
19
WATER QUALITY
Methods and Materials
Each lake was visited on three occasions to perform field measurements
and collect samples. Visits were made during November-December 1977, and
February and April 1978. Because of low water temperatures, the samples
collected were representative of minimal biological activity. Water sam
ples were collected at three depths, i.e., near the surface, at mid-depth,
and about two feet from the bottom. Field measurements included those for
dissolved oxygen, temperature, pH, conductivity, and alkalinity. Dissolved
oxygen, temperature, and conductivity determinations were made at intervals,
depending on water depth, of 2 to 5 feet in the water column. Determina
tions for pH and alkalinity were performed on the three water samples col
lected at the varying water depths previously noted.
Laboratory analyses were performed on all water samples for total
dissolved solids, hardness, sulfate, chloride, nitrate, fluoride, sodium,
potassium, iron, and manganese. In addition, analyses were performed for
certain heavy metals such as lead, cadmium, copper, zinc, mercury, boron,
arsenic, selenium, silver, chromium, and barium. The analytical procedures
used are listed in table 5. Analyses were performed on unfiltered samples
and the results are therefore for total concentrations.
All water quality data are included in the Appendix of Lake Summaries.
Except for lakes 6 and 7 there was no significant chemical stratification.
Under these circumstances, reliance is placed on the concentration of
mineral and heavy metal constituents observed at the mid-depth of each
20
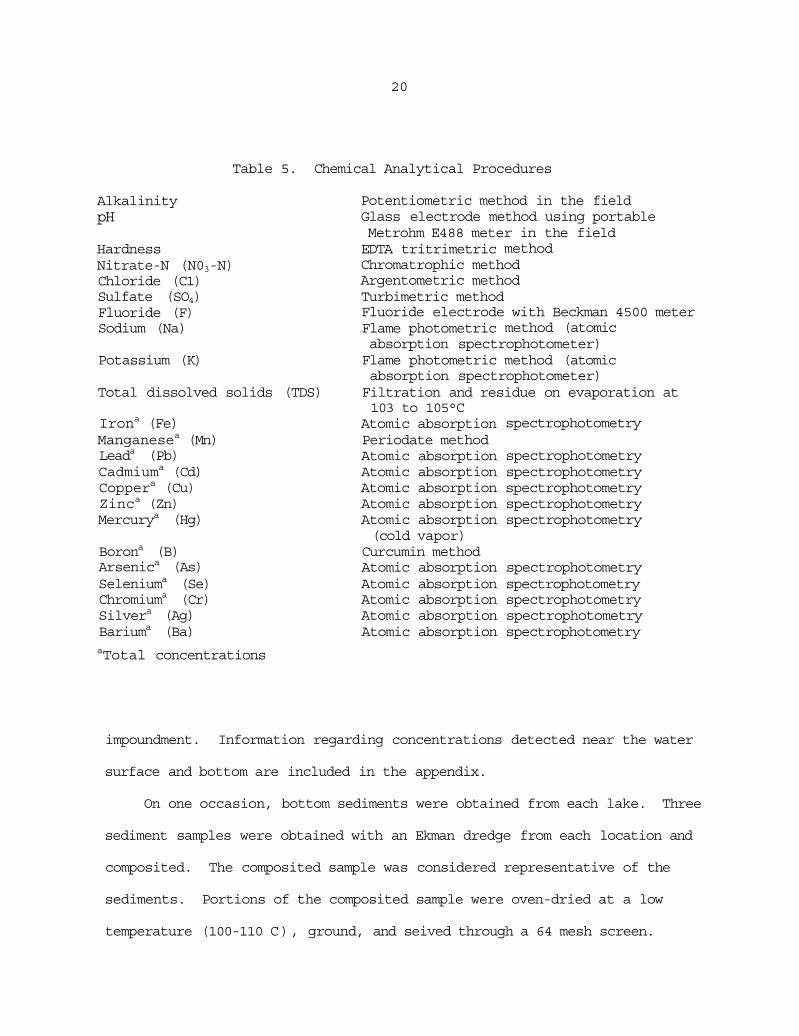
Table 5. Chemical Analytical Procedures
Alkalinity Potentiometric method in the field pH Glass electrode method using portable
Metrohm E488 meter in the field Hardness EDTA tritrimetric method Nitrate-N (N03-N) Chromatrophic method Chloride (C1) Argentometric method Sulfate (SO4) Turbimetric method Fluoride (F) Fluoride electrode with Beckman 4500 meter Sodium (Na) Flame photometric method (atomic
absorption spectrophotometer) Potassium (K) Flame photometric method (atomic
absorption spectrophotometer) Total dissolved solids (TDS) Filtration and residue on evaporation at
103 to 105°C Irona (Fe) Atomic absorption spectrophotometry Manganesea (Mn) Periodate method Leada (Pb) Atomic absorption spectrophotometry Cadmiuma (Cd) Atomic absorption spectrophotometry Coppera (Cu) Atomic absorption spectrophotometry Zinca (Zn) Atomic absorption spectrophotometry Mercurya (Hg) Atomic absorption
(cold vapor) spectrophotometry
Borona (B) Curcumin method Arsenica (As) Atomic absorption spectrophotometry Seleniuma (Se) Atomic absorption spectrophotometry Chromiuma (Cr) Atomic absorption spectrophotometry Silvera (Ag) Atomic absorption spectrophotometry Bariuma (Ba) Atomic absorption spectrophotometry aTotal concentrations
impoundment. Information regarding concentrations detected near the water
surface and bottom are included in the appendix.
On one occasion, bottom sediments were obtained from each lake. Three
sediment samples were obtained with an Ekman dredge from each location and
composited. The composited sample was considered representative of the
sediments. Portions of the composited sample were oven-dried at a low
temperature (100-110 C), ground, and seived through a 64 mesh screen.
21
That material passing the seive was digested and analyzed for iron, lead,
copper, zinc, mercury, and arsenic.
Dissolved Oxygen, Temperature, and pH
Significant stratification of dissolved oxygen concentrations and
temperature occurred in only two lakes (6 and 7) during the period of
sampling. Because of the rather constant temperature (9-12°C) and low
dissolved oxygen maintained near the bottom of these particular impound
ments, coupled with the chemical stratification occurring in them also, it
is surmised that groundwater inflow governs the water quality in the lower
stratum. At mid-depth the ranges observed for all lakes were:
dissolved oxygen 3.1 - 15.0 mg/l temperature 1.2 - 12°C pH 7.2-8.5
Following the disappearance of ice in April, the top 10 feet of the
water column warmed to a temperature of 15 to 17°C in the impoundments
located in the southern part of the state. During the same period, the
lakes in the northern part ranged from 10 to 12°C. With the exception of
lakes 6 and 7 the dissolved oxygen concentrations generally exceed 6
milligrams per liter (mg/1) in the water column. The values for pH are
not unlike those observed in many water impoundments in Illinois.
Total Dissolved Solids, Hardness, Sulfate, Alkalinity
Total dissolved solids at mid-depth ranged from 349 to 2870 milligrams
per liter. Table 6 lists the average concentrations at mid-depth for each
of the 12 impoundments. A distribution of the concentrations observed for
total dissolved solids is depicted in figure 2. Close examination of the
22
Table 6. Average Chemical Concentrations at Mid-Depth
(In milligrams per liter)
Lake number 1 2 3 4 5 6
Total dissolved solids 1795 709 409 676 2502 2774 Alkalinity* 223 232 124 97 104 234 Hardness* 1263 519 342 406 1233 1187 Sulfate 1135 356 164 331 1705 1834 Chloride 3 7 3 15 42 28 Nitrate-N 0.35 0.80 0.16 1.05 0.09 0.25 Fluoride 0.20 0.23 0.30 0.31 0.31 0.57 Sodium 41 39 12 44 239 364 Potassium 6 4 2 4 5 9 Iron 0.17 0.06 0.17 0.43 0.10 0.16 Manganese 0.26 0.09 0.05 0.18 0.10 0.90
7 8 9 10 11 12
Total dissolved solids 775 1996 1576 944 444 1564 Alkalinity* 207 184 132 182 118 76 Hardness* 486 1335 684 697 359 1057 Sulfate 334 1376 972 563 217 1074 Chloride 31 5 34 18 3 7 Nitrate-N 0.64 0.17 0.15 0.36 0.18 0.37 Fluoride 0.32 0.40 0.42 0.20 0.21 0.43 Sodium 59 78 190 28 11 56 Potassium 5 5 3 5 3 7 Iron 0.11 0.21 0.12 0.19 0.10 0.39 Manganese 1.16 0.53 0.07 0.06 0.02 0.13 aas CaCO3
plotted data indicates two basic populations. Lakes 2, 3, 4, 7, 10, and
11 generally contain total dissolved solids less than 1000 milligrams per
liter; the other six lakes contain total dissolved solids in excess of
1000 milligrams per liter.
Hardness concentrations were also excessive with values ranging from
258 to 1445 milligrams per liter as calcium carbonate (CaCO3). Average
concentrations at mid-depths are shown in table 6, and distribution of the
data for hardness is shown in figure 2. Here it seems the line of best fit
23
Figure 2. Probability distributions for total dissolved solids, total hardness, and sulfate at mid-depths.
24
is fairly representative for all impoundments and that hardness concentra
tions equal to or less than 700 milligrams per liter are likely to occur in
final cut impoundments about 50 percent of the time.
Sulfate concentrations were often high ranging from 153 to 1984 milli
grams per liter. Average values for mid-depth conditions are included in
table 6, and a probability distribution of the sulfate data is shown in
figure 2. Here, as in the case of total dissolved solids, the data seem
to consist of two populations. The population of lower concentration has
a limit of about 600 milligrams per liter and the lakes within that popula
tion are identical to those for the lower range of total dissolved solids.
Because of this apparent relationship a regression analysis was performed
for total dissolved solids and sulfate (figure 3). The equation developed
is:
Total dissolved solids = 224 + 1.34 sulfate
To further explore the chemical constituents responsible for total
dissolved solids a step-wise regression was performed incorporating, in
addition to sulfate concentrations, the observed concentrations of total
hardness. The equation developed is:
Total dissolved solids = 198 + 0.086 hardness + 1.287 sulfate
From statistical coefficients the constituents of hardness (calcium
and magnesium) together with sulfate account for 98 percent of the varia
tion in total dissolved solids concentrations.
The alkalinity of the impoundment waters consist mainly of bicarbon-
ates (HCO3). The concentrations range from 69 to 255 milligrams per liter
as CaCO3. Average concentrations at mid-depth are included in table 6.
25
Figure 3. Relationship of total dissolved solids and sulfates at mid-depths of 12 impoundments.
As in the case of total dissolved solids, sulfates, and hardness, the im
poundments cannot be classified on a geographical basis for alkalinity
either. However, they can be grouped according to concentration, as
follows:
Alkalinity < 150 mg/l - Lakes 2, 4, 5, 9, 11, 12 Alkalinity > 150 mg/l - Lakes 1, 3, 6, 7, 8, 10
Step-wise regression techniques were used to determine relationships
between hardness (Ca++ and Mg++ ) and alkalinity (HCO3-) and sulfate (SO4
=).
The following equation was developed.
Hardness = 192 + 0.69 alkalinity + 0.59 sulfate
26
Statistical coefficients suggest that alkalinity and sulfate account
for 92 percent of the variation in hardness concentrations.
Chloride, Nitrate, and Fluoride
The variation in concentrations of chloride, nitrate-N, and fluoride
in the 12 impoundments is not significant. The following ranges were
observed:
Chloride 2-4 mg/l Nitrate-N 0.02-1.2 mg/1 Fluoride 0.17-0.64 mg/1
Average concentrations at mid-depth are included in table 6.
Sodium and Potassium
Sodium concentrations varied widely, ranging from 10 to 400 milli
grams per liter. Potassium concentrations were more limited ranging from
2 to 11 milligrams per liter. Average concentrations at the mid-depth of
each lake are included in table 6. A distribution of the sodium data is
shown in figure 4. Here the data suggest that the impoundments, without
regard to geographical location, fall in three categories based on sodium
content. The grouping and ranges are:
10-13 mg/l -- Lakes 2, 11 25-80 mg/l -- Lakes 1, 3, 4, 7, 8, 10, 12 160-400 mg/l-- Lakes 5, 6, 9
Iron and Manganese
Iron and manganese concentrations ranged from 0.01 to 0.96 and 0.01 to
1.58 milligrams per liter, respectively, at mid-depth. Average values are
shown in table 6. Near bottom samples reflected very high concentrations
of these substances in lakes 6 and 7. For lake 6, iron concentrations
27
Figure 4. Probabili ty dis t r ibut ions for sodium, t o t a l i ron, and t o t a l manganese at mid-depths.
28
ranged from 20.2 to 24.3 milligrams per liter; corresponding manganese
concentrations were 5.9 and 4.65 milligrams per liter. Near the bottom of
lake 7 the iron concentrations ranged from 0.20 to 2.02 milligrams per liter,
whereas manganese concentrations ranged from 5.4 to 9.2 milligrams per
liter.
The data distribution for iron and manganese concentrations at mid-
depth are shown in figure 4. On the basis of these probability plots,
the mid-depth concentrations of iron and manganese (in mg/l) are antici
pated to be equal to or less than the following values at the designated
frequencies:
10% 25% 50% 75% 90% Iron 0.038 0.07 0.13 0.25 0.45 Manganese 0.017 0.034 0.13 0.37 0.95
Heavy Metals
The range of concentrations observed for 11 heavy metals at mid-depth
are included in table 7. Concentrations of chromium and silver were not
detected. Selenium concentrations were always less than 0.001 milligrams
per liter and barium concentrations were always less than 0.1 milligrams
per liter. Except for the higher range of cadmium and lead concentrations,
the heavy metal content of the impoundment waters was not unlike that
found in other Illinois surface waters.
Sediments
The concentrations of iron, lead, copper, zinc, cadmium, mercury, and
arsenic found in composited samples of sediment from the final cut impound
ments are summarized in table 8. Whether or not these values are typical
29
of water basins developed in strip mining areas is not known. However,
there are sufficient data at hand to compare the concentrations of these
trace elements, except cadmium, with those observed in other Illinois
impoundments.
Table 7. Range of Heavy Metal Concentrations at Mid-Depths mg/l
Cadmium 0.00-0.04 Copper 0.01-0.08 Zinc 0.02-0.10 Boron 0.10-0.50 Lead 0.00-0.17 Arsenic <0.001-0.005 Selenium <0.001 Chromium ND Silver ND Barium <0.1 Mercury 0.04-0.88a
aµg/l
Table 8. Heavy Metals in Sedimentsa
(In parts per million)
Lake Iron Lead Copper Zinc Cadmium Arsenic 1 27,710 46 48 89 3 0.50 2 17,430 27 27 48 0 0.33 3 23,760 28 27 48 2 0.40 4 25,120 28 15 54 1 0.46 5 18,530 28 14 55 0 0.33 6 23,760 34 18 74 2 0.46 7 19,430 41 30 78 3 0.46 8 23,111 46 18 68 5 0.45 9 24,030 28 23 54 1 0.41
10 25,820 68 40 820 18 0.68 11 32,680 35 34 82 3 0.21 12 29,400 46 44 70 4 0.56
aComposite of 3 samples
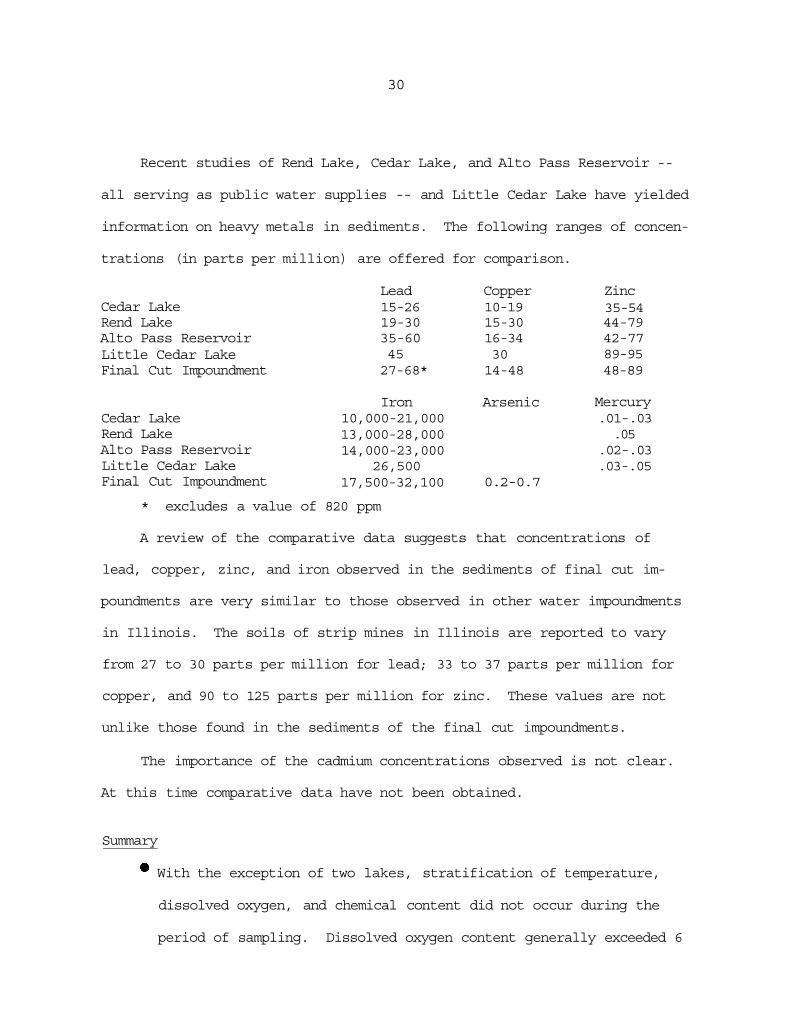
30
Lead Copper Zinc Cedar Lake 15-26 10-19 35-54 Rend Lake 19-30 15-30 44-79 Alto Pass Reservoir 35-60 16-34 42-77 Little Cedar Lake 45 30 89-95 Final Cut Impoundment 27-68* 14-48 48-89
Iron Arsenic Mercury Cedar Lake 10,000-21,000 .01-.03 Rend Lake 13,000-28,000 .05 Alto Pass Reservoir 14,000-23,000 .02-.03 Little Cedar Lake 26,500 .03-.05 Final Cut Impoundment 17,500-32,100 0.2-0.7
Recent studies of Rend Lake, Cedar Lake, and Alto Pass Reservoir --
all serving as public water supplies -- and Little Cedar Lake have yielded
information on heavy metals in sediments. The following ranges of concen
trations (in parts per million) are offered for comparison.
* excludes a value of 820 ppm
A review of the comparative data suggests that concentrations of
lead, copper, zinc, and iron observed in the sediments of final cut im
poundments are very similar to those observed in other water impoundments
in Illinois. The soils of strip mines in Illinois are reported to vary
from 27 to 30 parts per million for lead; 33 to 37 parts per million for
copper, and 90 to 125 parts per million for zinc. These values are not
unlike those found in the sediments of the final cut impoundments.
The importance of the cadmium concentrations observed is not clear.
At this time comparative data have not been obtained.
Summary
With the exception of two lakes, stratification of temperature,
dissolved oxygen, and chemical content did not occur during the
period of sampling. Dissolved oxygen content generally exceeded 6
31
milligrams per liter and pH values were not unlike other Illinois
surface waters.
Concentrations of total dissolved solids, hardness, and sulfates
are excessive.
The variation in total dissolved solids content is principally a
function of hardness and sulfate concentrations.
Most of the hardness is in non-carbonate form.
Although the lakes can be grouped according to ranges of value for
certain water quality characteristics such as total dissolved
solids, sulfate, alkalinity, and sodium, they cannot be classified
in terms of water quality on the basis of geographical location.
Concentrations of chloride, nitrate, fluoride, sodium, and potassium
were not found in excessive quantities.
Manganese concentrations generally exceeded those found in the sur
face waters of Illinois.
Iron content, except in the bottom water stratum, was not excessive.
With the exception of lead and cadmium levels, the heavy metal con
tent was not significantly different from other Illinois surface
waters.
If significant dissolved oxygen stratification occurs during the
warm months, it is likely that anoxic conditions will be created
in the lower water strata resulting in the production of hydrogen
sulfide and the introduction of certain heavy metals into the water
column.
32
CHEMICAL SUITABILITY
The water quality of the final cut impoundments has been evaluated
to determine the suitability of each location as a source for potable
water, irrigation, and livestock watering. Reliance has been placed on the
regulations in Illinois for evaluating use of the waters as public water
supplies (11). The recommendations developed by a committee of the
National Academy of Sciences and the National Academy of Engineering (12)
were used for assessing the fitness of the impounded waters for irrigation
and livestock watering. The water quality requirements for each use, for
those elements examined during the study, are included in the tables for
each use. The average values derived at mid-depth for each impoundment
are used to ascertain the suitability of their waters for the uses pre
viously noted.
Public Water Supply
The water quality requirements in table 9 for a public water supply
source are predicated on the assumption that the source of water being
considered will be usable with no more than routine forms of water treat
ment, i.e., coagulation, sedimentation, sand filtration, and disinfection.
The limitations established for each constituent are based on several con
siderations. These include adverse physiological effects on humans, taste
preferences, aesthetic considerations, user preference, and toxicity to
humans.
Where physiological and toxic effects on humans are the principal
motives for establishing a limitation in concentration for a particular
33
element, there is no latitude for ignoring the limitation. However, in
cases where taste, aesthetics, and user preference are the prime reasons
for a limitation, some judgment can be applied in permitting use of the
water, despite concentrations in excess of the limitation. Such judgment
could be applied for elements such as chloride, sulfate, total dissolved
solids, iron, and manganese. Nevertheless, for the purposes of this re
port, the waters of each impoundment were deemed satisfactory or unsatis
factory solely on the basis of existing standards and recommendations. The
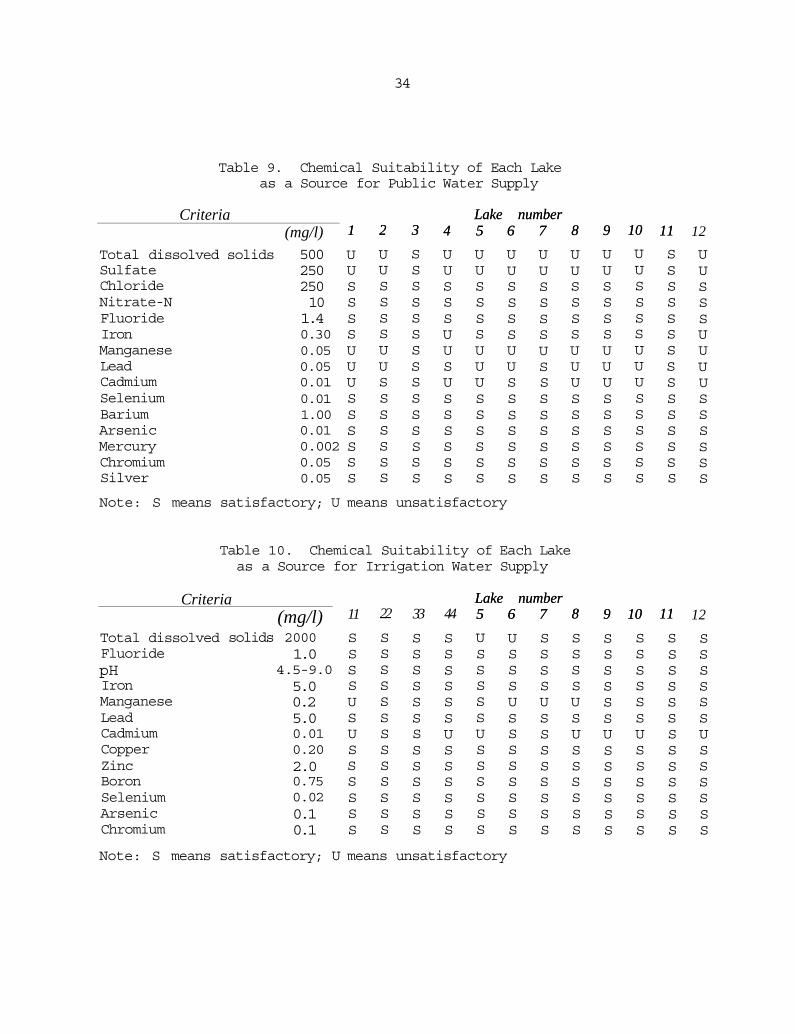
findings are given in table 9.
Only two impoundments maintain water quality satisfactory as a source
of potable water. These are lakes 3 and 11. All of the other 10 loca
tions contain water exceeding the limits on total dissolved solids, sulfate,
and manganese; eight exceed standards for lead; seven exceed standards for
cadmium; and two exceed standards for iron.
Irrigation
The water quality considerations for irrigation are not well defined.
The effects are directly related to soil characteristics, age and type of
plants, frequency of application, and crop tolerance. For evaluation pur
poses guidelines for salinity and trace element tolerances were relied
upon and are shown in table 10.
In the case of salinity a concentration of 2000 milligrams per liter
total dissolved solids was considered the upper limit. Concentrations be
tween 500 to 2000 milligrams per liter may have a detrimental effect upon
sensitive crops, but with careful management a limit of 2000 milligrams per
34
Table 9. Chemical Suitability of Each Lake as a Source for Public Water Supply
Criteria 1 2 3 4
Lake number 5 6 7 8 9 10 11 (mg/l) 1 2 3 4 Lake number 5 6 7 8 9 10 11 12
Total dissolved solids 500 U U S U U U U U U U S U Sulfate 250 U U S U U U U U U U S U Chloride 250 S S S S S S S S S S S S Nitrate-N 10 S S S S S S S S S S S S Fluoride 1.4 S S S S S S S S S S S S Iron 0.30 S S S U S S S S S S S U Manganese 0.05 U U S U U U U U U U S U Lead 0.05 U U S S U U S U U U S U Cadmium 0.01 U S S U U S S U U U S U Selenium 0.01 S S S S S S S S S S S S Barium 1.00 S S S S S S S S S S S S Arsenic 0.01 S S S S S S S S S S S S Mercury 0.002 S S S S S S S S S S S S Chromium 0.05 S S S S S S S S S S S S Silver 0.05 S S S S S S S S S S S S
Note: S means satisfactory; U means unsatisfactory
Table 10. Chemical Suitability of Each Lake as a Source for Irrigation Water Supply
Criteria 1 2 3 4
Lake number 5 6 7 8 9 10 11 (mg/l) 1 2 3 4 Lake number 5 6 7 8 9 10 11 12
Total dissolved solids 2000 S S S S U U S S S S S S Fluoride 1.0 S S S S S S S S S S S S pH 4.5-9.0 S S S S S S S S S S S S Iron 5.0 S S S S S S S S S S S S Manganese 0.2 U S S S S U U U S S S S Lead 5.0 S S S S S S S S S S S S Cadmium 0.01 U S S U U S S U U U S U Copper 0.20 S S S S S S S S S S S S Zinc 2.0 S S S S S S S S S S S S Boron 0.75 S S S S S S S S S S S S Selenium 0.02 S S S S S S S S S S S S Arsenic 0.1 S S S S S S S S S S S S Chromium 0.1 S S S S S S S S S S S S
Note: S means satisfactory; U means unsatisfactory
35
liter seems reasonable. The limits on trace elements are predicated on waters
being applied continuously on all soils. The findings are given in table 10.
There are also limits of 0.2 and 5 milligrams per liter for nickel and alum
inum, respectively, but these were not assessed in this study.
Only three lakes contain water suitable for irrigation. They are
locations 2, 3, and 11. The remaining nine impoundments are considered
unsuitable mainly because of excess concentrations of total dissolved
solids, manganese, or cadmium.
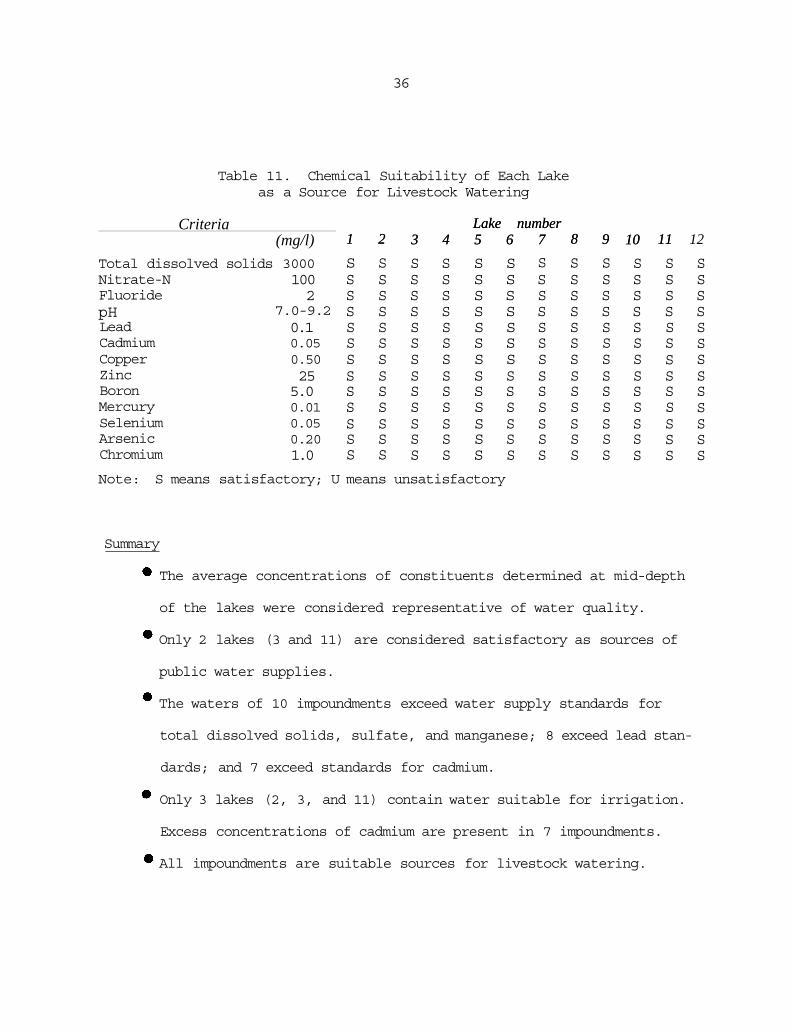
Livestock Watering
The animals considered as livestock include beef and dairy cattle,
sheep, swine, horses, and poultry. As in the case of other water uses, the
concentrations of the elements which may render a water unsuitable for use
by livestock are quite variable (table 11). These are affected by age,
sex, species, and the physiological condition of the animals; water intake;
diet and its composition; the chemical form of the element; and the tem
perature of the environment. Therefore the development of recommendations
for safe concentrations of substances in water is difficult. The criteria
used have an appropriate margin of safety and are considered reasonable for
most conditions. Levels of 5 and 0.1 milligrams per liter for aluminum and
vanadium, respectively, also were not assessed in this study.
The evaluation of the 12 impounded waters for livestock water sources
is summarized in table 11. All impoundments contain water satisfactory
for livestock watering based upon the analyses performed.
36
Table 11. Chemical Suitability of Each Lake as a Source for Livestock Watering
Criteria 1 2 3 4
Lake number 5 6 7 8 9 10 11 (mg/l) 1 2 3 4 Lake number 5 6 7 8 9 10 11 12
Total dissolved solids 3000 S S S S S S S S S S S S Nitrate-N 100 S S S S S S S S S S S S Fluoride 2 S S S S S S S S S S S S pH 7.0-9.2 S S S S S S S S S S S S Lead 0.1 S S S S S S S S S S S S Cadmium 0.05 S S S S S S S S S S S S Copper 0.50 S S S S S S S S S S S S Zinc 25 S S S S S S S S S S S S Boron 5.0 S S S S S S S S S S S S Mercury 0.01 S S S S S S S S S S S S Selenium 0.05 S S S S S S S S S S S S Arsenic 0.20 S S S S S S S S S S S S Chromium 1.0 S S S S S S S S S S S S
Note: S means satisfactory; U means unsatisfactory
Summary
The average concentrations of constituents determined at mid-depth
of the lakes were considered representative of water quality.
Only 2 lakes (3 and 11) are considered satisfactory as sources of
public water supplies.
The waters of 10 impoundments exceed water supply standards for
total dissolved solids, sulfate, and manganese; 8 exceed lead stan
dards; and 7 exceed standards for cadmium.
Only 3 lakes (2, 3, and 11) contain water suitable for irrigation.
Excess concentrations of cadmium are present in 7 impoundments.
All impoundments are suitable sources for livestock watering.
37
RECOMMENDATIONS
Potential Use Recommendations
The estimated yield potential of final cut impoundments in Illinois is
significant. On a regional or county basis, it has been shown that these
lakes can produce large quantities of water. At the local level, the po
tential use of these resources appears even more appealing.
On the basis of the chemical quality of the lakes studied and pub
lished water quality standards, the potential uses do not look as promising.
Only 2 lakes are considered satisfactory for public water supply use, 3 for
irrigation use, and all 12 are satisfactory for livestock watering. How
ever, before dismissing the use of these lakes based solely on published
water quality standards, the water quality of the impoundments should be
compared with the water quality of alternative sources of water.
As an example, the village of Astoria in the southern tip of Fulton
County began using a final cut impoundment as a source of public water
supply in late 1976. This move was part of a continuing effort by the
town to find a chemically acceptable and reliable water supply.
The first public water supply for Astoria was obtained from a 1660-
foot deep well drilled in 1897. Use of this water was limited because of
its poor quality.
In 1924 the well was abandoned and water was obtained from an earthen
dam reservoir constructed northeast of the town. Water from the reservoir
was of good quality (see table 12) but the capacity of the lake was in
sufficient. In the early 1950s a pipeline was constructed to carry water
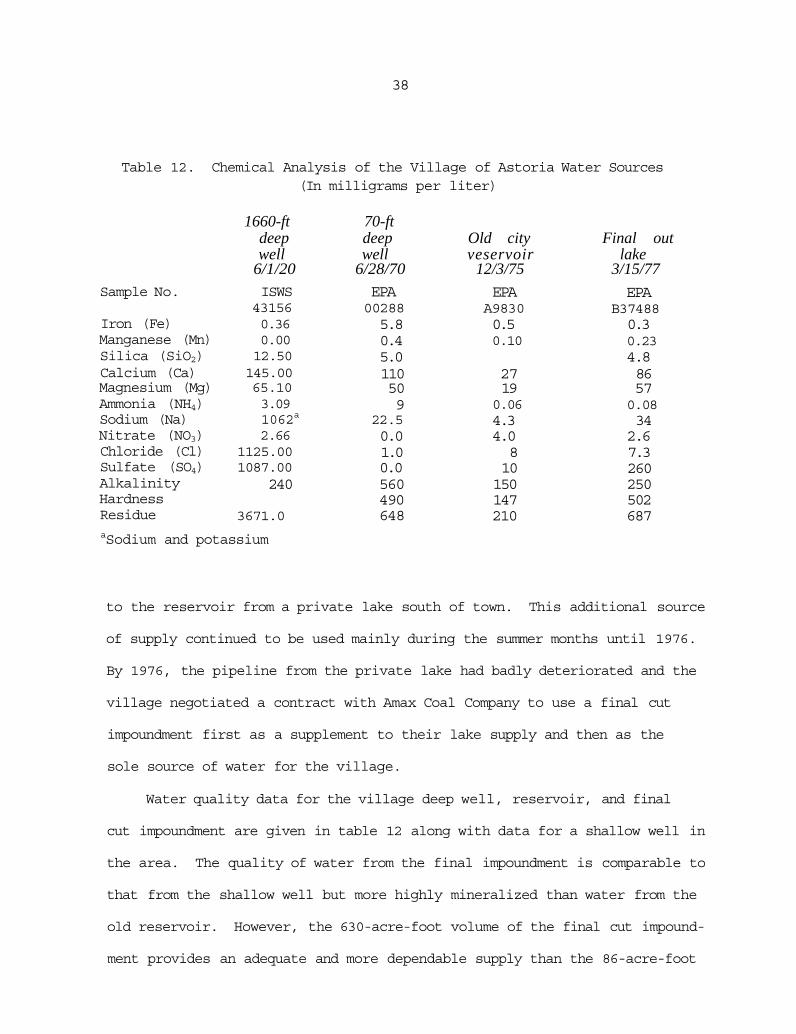
38
Table 12. Chemical Analysis of the Village of Astoria Water Sources (In milligrams per liter)
1660-ft 70-ft deep deep Old city Final out well well veservoir lake
6/1/20 6/28/70 12/3/75 3/15/77 Sample No. ISWS EPA EPA EPA
43156 00288 A9830 B37488 Iron (Fe) 0.36 5.8 0.5 0.3 Manganese (Mn) 0.00 0.4 0.10 0.23 Silica (SiO2) 12.50 5.0 4.8 Calcium (Ca) 145.00 110 27 86 Magnesium (Mg) 65.10 50 19 57 Ammonia (NH4) 3.09 9 0.06 0.08 Sodium (Na) 1062a 22.5 4.3 34 Nitrate (NO3) 2.66 0.0 4.0 2.6 Chloride (Cl) 1125.00 1.0 8 7.3 Sulfate (SO4) 1087.00 0.0 10 260 Alkalinity 240 560 150 250 Hardness 490 147 502 Residue 3671.0 648 210 687 aSodium and potassium
to the reservoir from a private lake south of town. This additional source
of supply continued to be used mainly during the summer months until 1976.
By 1976, the pipeline from the private lake had badly deteriorated and the
village negotiated a contract with Amax Coal Company to use a final cut
impoundment first as a supplement to their lake supply and then as the
sole source of water for the village.
Water quality data for the village deep well, reservoir, and final
cut impoundment are given in table 12 along with data for a shallow well in
the area. The quality of water from the final impoundment is comparable to
that from the shallow well but more highly mineralized than water from the
old reservoir. However, the 630-acre-foot volume of the final cut impound
ment provides an adequate and more dependable supply than the 86-acre-foot
39
(original capacity) reservoir.
Because of the relatively abundant groundwater resources in north
eastern Illinois and the active development of final cut impoundments for
private recreational uses in the region, we suggest that the recreational
uses continue to have priority. In western and southern Illinois, the use
of final cut impoundments for consumptive water uses should be investigated
at the local level on an individual basis. Regional planning commissions,
consulting engineers, and village officials should be made aware of the
potential final cut impoundment resources in their areas and encouraged to
investigate the economics and suitability of their use.
Recommendations for Further Study
On the basis of the results of this project and general knowledge of
strip mine related problems, the following suggestions for further study
are made:
1. One or more final cut impoundments and watersheds should be prop
erly instrumented and data gathered for a two or three year
period to more accurately determine runoff-infiltration relation
ships and the response of groundwater to recharge events.
2. More detailed analysis of the groundwater regimes of spoil materi
als is needed. A series of wells and observation wells for pump
ing tests and analysis in spoil materials of varying geologic
parentage is needed.
3. If final cut impoundments are to be considered a water resource,
the sedimentation rates experienced by these lakes need to be
determined. Estimates of soil losses from strip mine lands also
40
are needed to assess the effects of these lands on regional water
quality parameters.
4. To more accurately characterize the quality of final cut impound
ment waters, samples need to be collected for a minimum period of
one year.
5. On the basis of the apparent differences in quality of runoff
waters and groundwater in some final cut impoundments, an assess
ment of the effects of pumping a lake on water quality should be
undertaken.
6. Regional assessment of water needs and resources should be examined in
more detail. This probably should be accomplished at the local or
county level.
41
APPENDIX. LAKE SUMMARIES
1 -- Middle Grove Lake
Middle Grove lake is located in Section 19, T9N, R4E, Knox County.
The lake and surrounding property are owned by Peabody Coal Company who
opened the mine in 1950 and closed it in 1952. The Springfield (No. 5)
coal was mined with a 40 cubic yard Marion shovel. The coal was overlain
by 50 to 75 feet of overburden materials of which 20 to 30 feet was pre
dominately clay. The rock overburden was a black shale with isolated
fossiliferous dark limestone concretions (13).
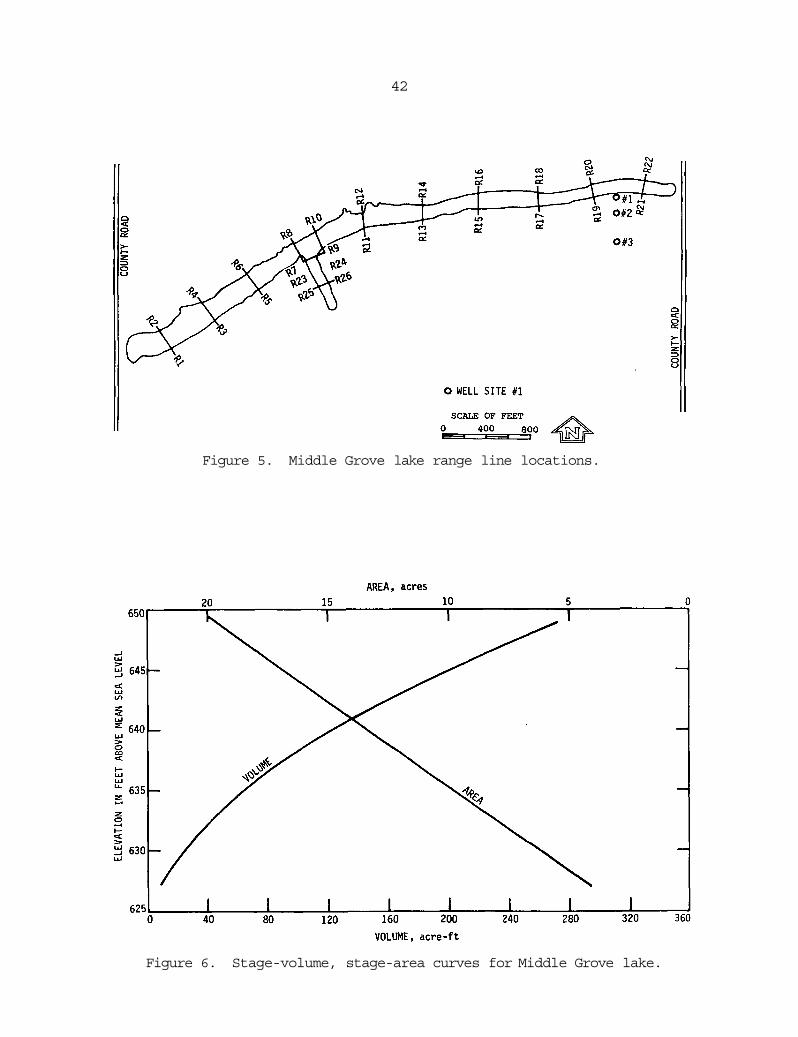
The general shape of the lake and location of range lines where depth
measurements were taken are shown in figure 5. The area and volume of the
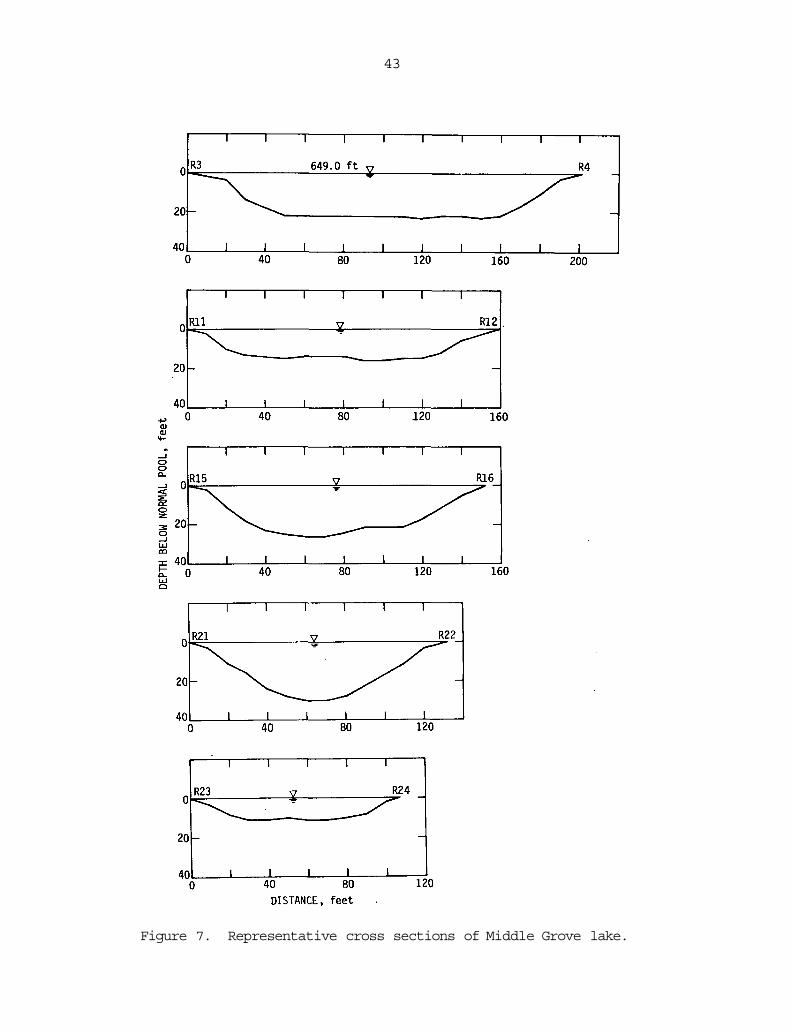
lake at elevation 649 feet above mean sea level are 20.14 acres and 272
acre-feet, respectively. Stage-volume and stage-area curves for the lake
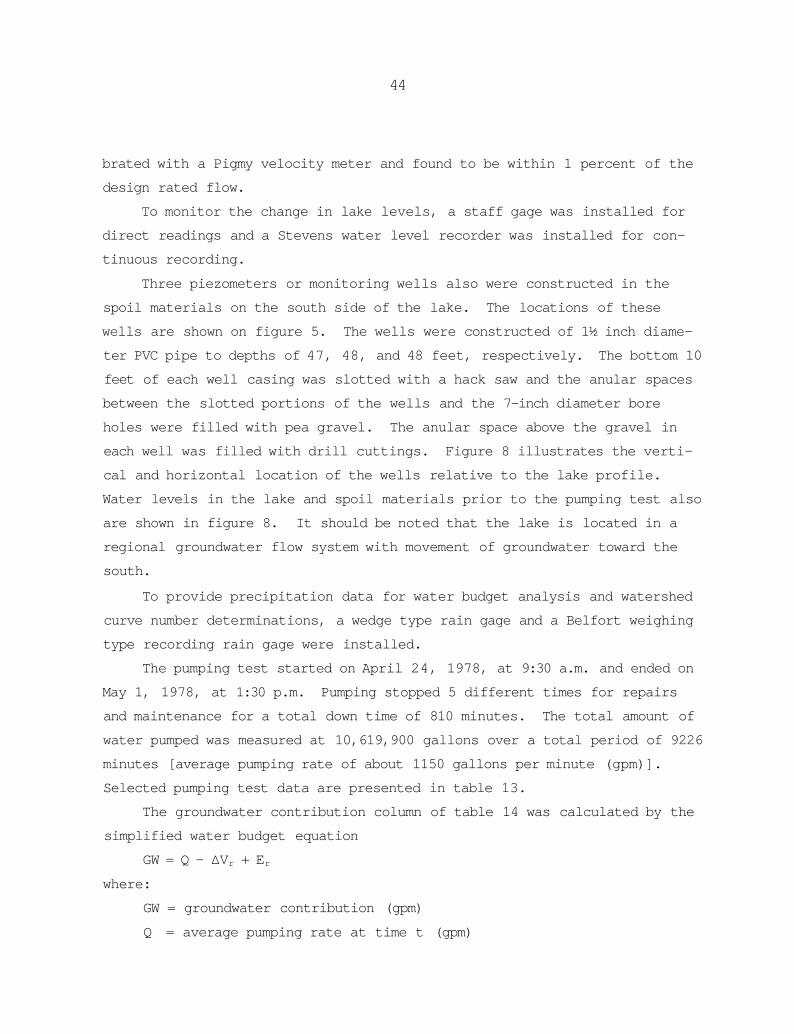
are presented in figure 6. The maximum measured and calculated average
depths are 30 and 13.5 feet, respectively. Representative cross sections
illustrating the general lake profile are shown in figure 7. Cross sec
tions R3-R4, R11-R12, and R21-R22 are for the final cut portion of the
lake and R23-R24 is for the incline or haul road portion.
The watershed of this lake is limited to within ½ mile of the lake and
covers approximately 233 acres. The entire watershed consists of reclaimed
spoil material that is relatively flat and planted in alfalfa.
The pumping test conducted on Middle Grove lake provided the data on
which all other groundwater contribution estimates are based. A propane
powered Ford V-8 engine driving a Berkley pump (Model No. B4EYPMBHCW) was
used during the test. The pump was set up at the east end of the lake and
the pump discharge pipe extended about 250 feet south over the crest of an
emergency spillway cut into the spoil materials. To monitor the pumping
rate, a Parshall flume was constructed in the downstream portion of the
emergency spillway. The channel between the pump discharge pipe and flume
was lined with 6 mil polyethylene to insure that all water pumped passed
through the flume. During the pumping test, the Parshall flume was cali-
42
Figure 5. Middle Grove lake range line locations.
Figure 6. Stage-volume, stage-area curves for Middle Grove lake.
43
Figure 7. Representative cross sections of Middle Grove lake.
44
brated with a Pigmy velocity meter and found to be within 1 percent of the design rated flow.
To monitor the change in lake levels, a staff gage was installed for direct readings and a Stevens water level recorder was installed for continuous recording.
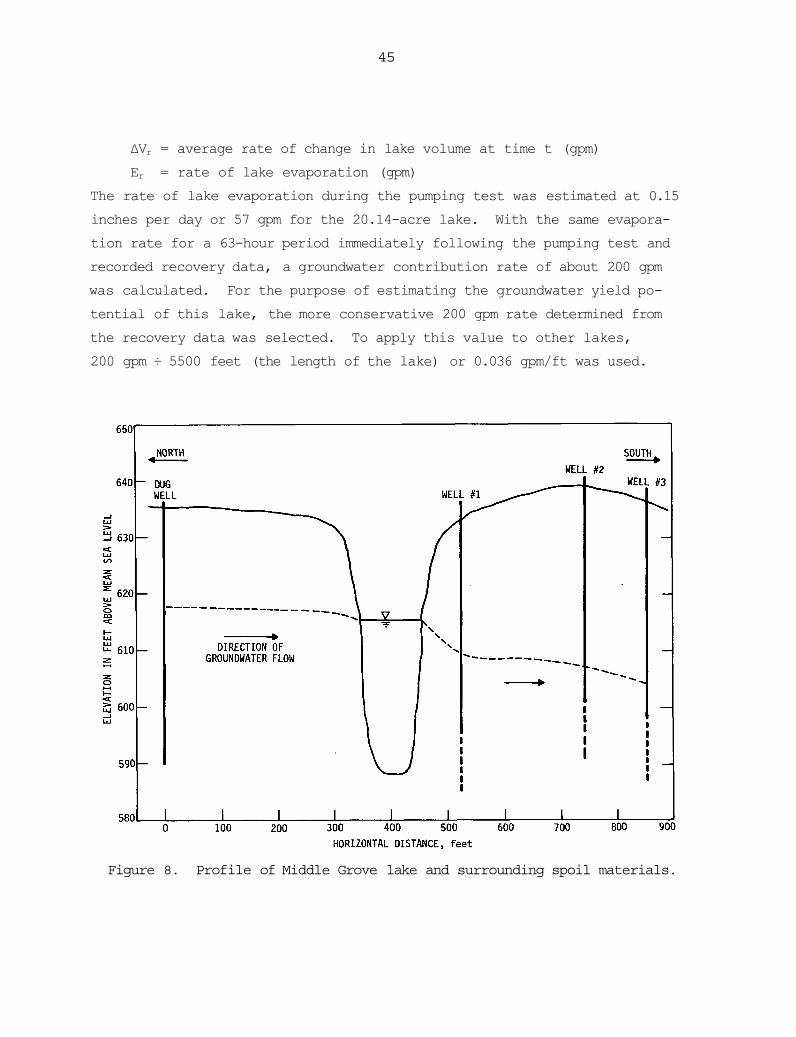
Three piezometers or monitoring wells also were constructed in the spoil materials on the south side of the lake. The locations of these wells are shown on figure 5. The wells were constructed of 1½ inch diameter PVC pipe to depths of 47, 48, and 48 feet, respectively. The bottom 10 feet of each well casing was slotted with a hack saw and the anular spaces between the slotted portions of the wells and the 7-inch diameter bore holes were filled with pea gravel. The anular space above the gravel in each well was filled with drill cuttings. Figure 8 illustrates the vertical and horizontal location of the wells relative to the lake profile. Water levels in the lake and spoil materials prior to the pumping test also are shown in figure 8. It should be noted that the lake is located in a regional groundwater flow system with movement of groundwater toward the south.
To provide precipitation data for water budget analysis and watershed curve number determinations, a wedge type rain gage and a Belfort weighing type recording rain gage were installed.
The pumping test started on April 24, 1978, at 9:30 a.m. and ended on May 1, 1978, at 1:30 p.m. Pumping stopped 5 different times for repairs and maintenance for a total down time of 810 minutes. The total amount of water pumped was measured at 10,619,900 gallons over a total period of 9226 minutes [average pumping rate of about 1150 gallons per minute (gpm)]. Selected pumping test data are presented in table 13.
The groundwater contribution column of table 14 was calculated by the simplified water budget equation
GW = Q - ΔVr + Er where:
GW = groundwater contribution (gpm) Q = average pumping rate at time t (gpm)
45
Figure 8. Profile of Middle Grove lake and surrounding spoil materials.
ΔVr = average rate of change in lake volume at time t (gpm) Er = rate of lake evaporation (gpm)
The rate of lake evaporation during the pumping test was estimated at 0.15 inches per day or 57 gpm for the 20.14-acre lake. With the same evaporation rate for a 63-hour period immediately following the pumping test and recorded recovery data, a groundwater contribution rate of about 200 gpm was calculated. For the purpose of estimating the groundwater yield potential of this lake, the more conservative 200 gpm rate determined from the recovery data was selected. To apply this value to other lakes, 200 gpm ÷ 5500 feet (the length of the lake) or 0.036 gpm/ft was used.
Table 13. Selected Pumping Test Data, Middle Grove Lake
Elapsed Total Total
change in
Groundwater
oontri-sr time Lake Well Well Well pumpage lake volume bution ion
Date Time (minutes) levela #1b #2b #3b (gallons) (gallons) (gpm) 4/24 9:30 A 4.38 24.37 32.08 31.52
10:00 A 30 4.37 24.38 32.10 31.54 38,379 65,620 11:00 A 90 4.36 24.37 32.08 31.54 115,110 131,240 12:00 P 150 4.36 24.38 32.10 31.54 191,850 131,240 461 2:00 P 270 4.34 24.38 32.11 31.55 345,330 262,480 364 4:00 P 390 4.33 24.39 32.13 31.58 498,810 328,110 495 6:00 P 510 4.29 24.42 32.14 31.57 649,290 590,600 172 8:00 P 630 4.28 24.44 32.14 31.58 799,770 656,220 285
10:00 P 750 4.27 24.45 32.15 31.55 953,250 721,840 365 4/25 12:00 A 870 4.25 24.48 32.16 31.56 1,106,730 853,080 349
4:00 A 1120 4.22 24.50 32.16 31.54 1,413,690 1,049,950 382 10:00 A 1480 4.17 24.61 32.20 31.52 1,682,280 1,378,060 263
8:00 2080 4.12 24.69 32.21 31.49 2,296,200 1,706,170 340 4/26 8:00 A 2800 4.00 24.81 32.25 31.48 3,217,080 2,493,632 315
8:00 P 3520 3.90 24.94 32.29 31.45 4,131,960 3,149,852 336 4/27 8:00 A 4240 3.87 25.01 32.36 31.47 4,451,730 3,346,720 318
4:00 P 4720 3.80 25.11 32.39 31.50 5,002,100 3,609,200 352 8:45 P 5005 3.77 25.17 32.42 31.52 5,321,860 3,806,070 359
4/28 12:00 P 5920 3.62 25.33 32.51 31.58 6,474,150 4,987,270 308 5/1 1:30 P 9226 3.18 26.00 32.97 31.85 10,619,870 7,874,630 355 aStaff gage reading, feet bFeet below measuring point
47
A watershed curve number (CN) value for this lake was determined with data from 2 storm events that occurred the week following the pumping test. During the first event 0.92 inches of precipitation fell during a 31-hour period resulting in a 0.11 foot rise in lake level. During the second event 2.13 inches of precipitation fell during a 38-hour period resulting in a 0.35 foot rise in lake level.
Total runoff amounts for each storm were calculated with the water budget equation
R = ΔV - PA - GW + E
where: R = runoff ΔV = change in lake P = precipitation
A = area of the lake GW = groundwater contribution E = evaporation from the lake
These runoff values were set equal to the SCS equation for determining runoff and CN values of 64 and 65 were determined, respectively. Since these values were determined from single rainfall events and monthly rainfall totals are being used for runoff analysis, a CN value of 60 was selected for this lake. Precipitation data from Canton were used to simulate the 20 years of runoff.
On the basis of the calculated net runoff values and a groundwater contribution capability of 0.036 gpm/ft x 5500 ft or 200 gpm, the estimate yields presented in table 14 were determined.
Chemical analysis data for water samples collected December 1977 and February and April 1978 are presented in table 15.
Table 14. Estimated Yield Potential of Middle Grove Lake
Yield 1.1
(mgd) for given 2
recurrence interval (yr) 5 10
Net surface yield Groundwater contribution
0.06 0.29
0.16 0.29
0.22 0.25 0.29 0.29
Total 0.35 0.45 0.51 0.54
48
Table 15. Chemical Analysis Data, Middle Grove Lake
Field Conductivity Depth Temp DO pH alk at 25°C TDS Hard Cl F SO4 NO3-N December 1977, 4 to 6 inch ice
0 1.0 15.0 8.1 220 2004 1287 6 0.19 1115 0.23 5 2.0 15.0 10 2.0 14.9 15 2.2 14.9 8.0 217 1888 1313 0 0.17 1148 0.21 20 3.0 14.4 25 3.5 11.3 30 3.8 10.6 8.0 217 1876 1273 0 0.20 1156 0.18
February 1978, 12 inch ice 0 0.1 9.3 7.4 235 2700 1851 1320 3 0.25 1241 0.25 5 2.1 9.4 2720 10 3.0 9.4 2656 15 3.8 8.1 7.4 237 2754 1868 1300 5 0.24 1254 0.24 20 4.0 6.7 2754 25 4.2 6.2 2752 30 4.5 6.2 7.25 263 2752 1895 1294 4 0.25 1271 0.27
April 1978 0 12.0 10.0 8.1 216 2070 1647 1175 6 0.2 985 0.51 5 12.0 10.0 2070 10 12.0 10.0 2070 15 12.0 10.0 8.1 216 2070 1630 1175 5 0.2 1004 0.60 20 12.0 10.0 2070 25 12.0 9.9 2070 30 6.0 6.1 7.6 228 2219 1772 1265 7 0.2 1075 0.55
December 1977 February 1978 April 1978 Surface Middle Bottom Surface Middle Bottom Surface Middle Bottom
Fe 0.31 0.26 0.24 0.11 0.06 0.17 0.20 0.19 0.23 Mn 0.08 0.05 0.57 0.32 0.29 0.63 0.45 0.45 0.54 Pb 0.08 0.07 0.08 0.17 0.17 0.17 ND ND ND Cd 0.03 0.03 0.04 0.02 0.02 0.02 ND ND ND Hg 0.49 0.48 0.40 0.38 0.81 0.46 0.11 0.08 0.08 K 5.8 5.5 5.5 4.5 4.5 4.6 6.0 5.8 6.2 Na 46 42 42 35 35 30 46 45 49 Cu 0.02 0.02 0.02 0.01 0.02 0.02 ND 0.02 0.02 Zn 0.06 0.05 0.06 0.05 0.06 0.06 0.01 0.03 0.05 As <0.001 <0.001 <0.001 <0.002 <0.002 <0.002 <0.001 <0.001 <0.001 Se <0.001 <0.001 <0.001 <0.001 <0.001 <0.001 <0.001 <0.001 <0.001 Ag ND ND ND ND ND ND 0.01 ND ND Cr ND ND ND ND ND ND ND ND ND Ba <0.1 <0.1 <0.1 <0.1 <0.1 <0.1 <0.1 <0.1 <0.1 B 0.4 0.4 0.5 0.4 0.4 0.4 0.3 0.3 0.3
Note: Temperature, °Celsius; conduçtivity, µ mhos; Hg, µg/l; all other values except pH, mg/l
49
2 -- Sunspot West Lake
Sunspot West is located in Section 9 and 10, T3N, R1E, Fulton County.
The lake and surrounding property is owned by Amax Coal Company who opened
the mine in 1963 and closed it in 1965. The Colchester (No. 2) coal was
mined with a 5761 Marion shovel. The coal was overlain by 50 to 75 feet of
overburden materials of which 30 to 40 feet was clay and till. The rock
overburden was a gray sandy shale (13).
The general shape of the lake and locations of range lines where depth
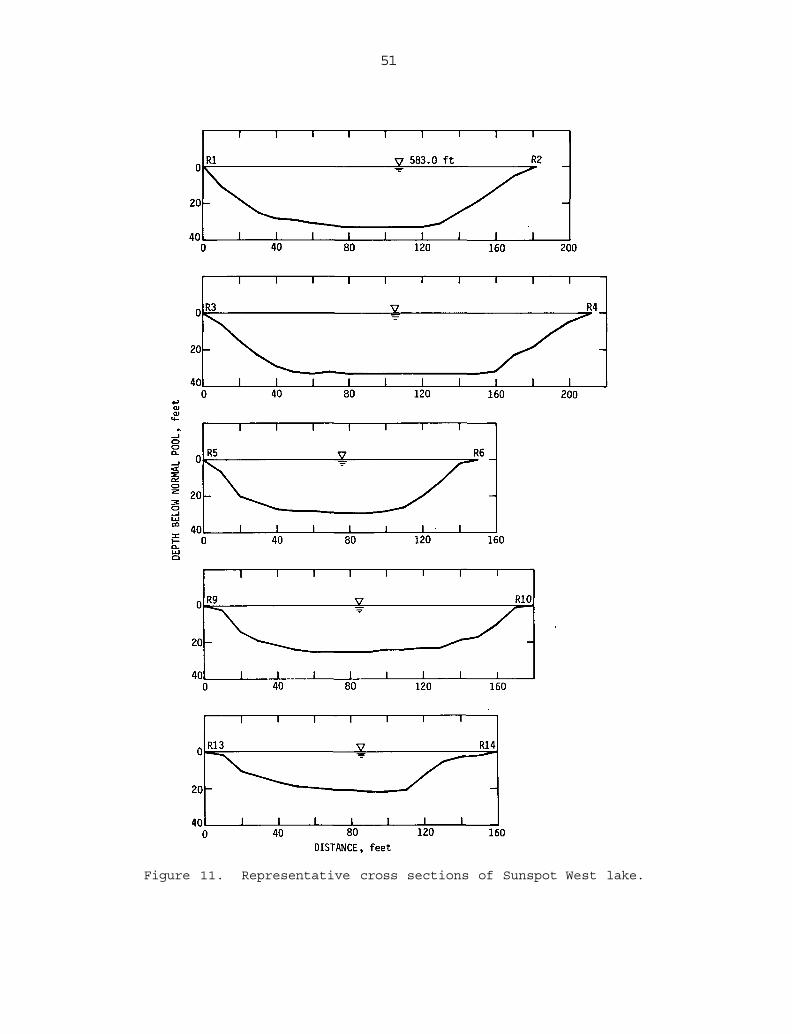
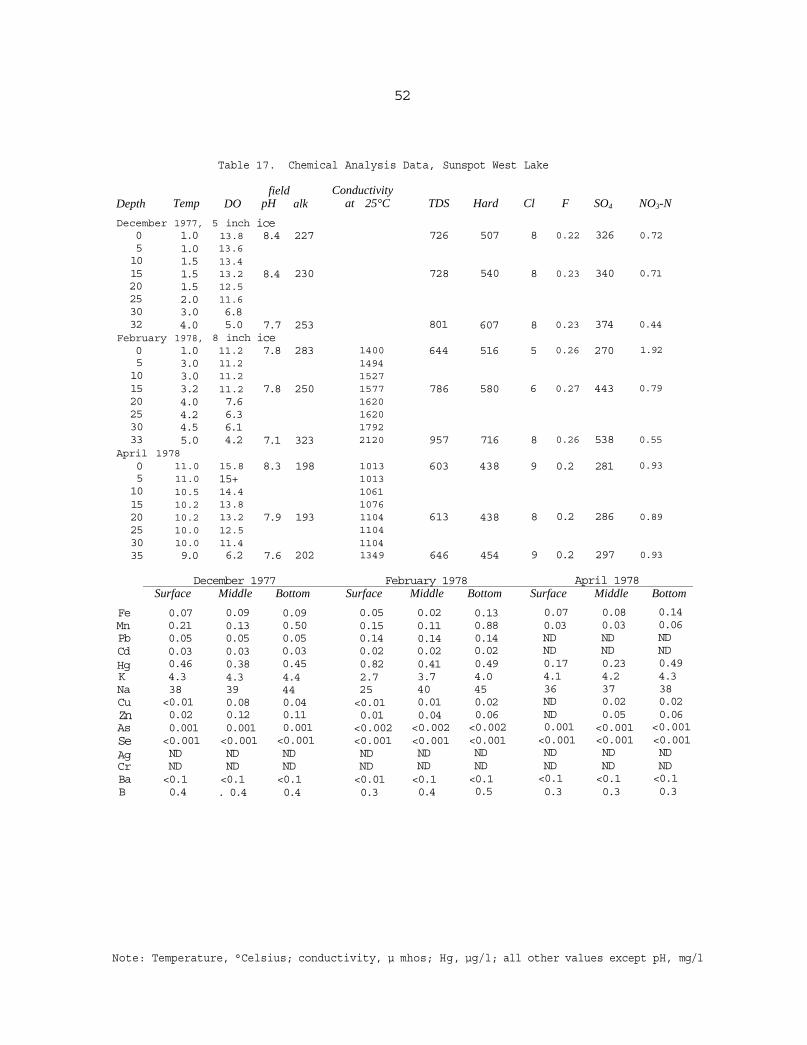
measurements were taken are shown in figure 9. The area and volume of the
lake at elevation 583 feet above mean sea level are 11.33 acres and 225
acre-feet, respectively. Stage-volume and stage-area curves for the lake
are presented in figure 10. The maximum measured and calculated average
depths are 33 and 19.9 feet, respectively. Representative cross sections
illustrating the lake profile are shown in figure 11.
The watershed of this lake extends approximately 1 mile to the west
and covers about 232 acres. About 30 percent of the watershed consists of
spoil material while the remainder is cultivated farm land. Because of
the high percentage of farm land a curve number (CN) value of 70 was se
lected for runoff calculations. Precipitation data from Canton were used
for the 20 years of simulated runoff.
On the basis of the calculated net runoff values and a groundwater
contribution of 0.036 gpm/ft x 2400 feet (the approximate length of the
lake), the estimated yields presented in table 16 were determined.
Chemical analysis data for water samples collected December 1977 and
February and April 1978 are presented in table 17.
Table 16. Estimated Yield Potential of Sunspot West Lake
Yield 1.1
(mgd) for given 2
recurrence interval (yr) 5 10
Net surface yield Groundwater contribution
0.12 0.12
0.23 0.12
0.30 0.33 0.12 0.12
Total 0.24 0.35 0.42 0.45
50
Figure 9. Sunspot West lake range line locations.
Figure 10. Stage-volume, stage-area curves for Sunspot West lake.
51
Figure 11. Representative cross sections of Sunspot West lake.
52
Table 17. Chemical Analysis Data, Sunspot West Lake
field Conductivity Depth Temp DO pH alk at 25°C TDS Hard Cl F SO4 NO3-N December 1977, 5 inch ice
0 1.0 13.8 8.4 227 726 507 8 0.22 326 0.72 5 1.0 13.6 10 1.5 13.4 15 1.5 13.2 8.4 230 728 540 8 0.23 340 0.71 20 1.5 12.5 25 2.0 11.6 30 3.0 6.8 32 4.0 5.0 7.7 253 801 607 8 0.23 374 0.44
February 1978, 8 inch ice 0 1.0 11.2 7.8 283 1400 644 516 5 0.26 270 1.92 5 3.0 11.2 1494 10 3.0 11.2 1527 15 3.2 11.2 7.8 250 1577 786 580 6 0.27 443 0.79 20 4.0 7.6 1620 25 4.2 6.3 1620 30 4.5 6.1 1792 33 5.0 4.2 7.1 323 2120 957 716 8 0.26 538 0.55
April 1978 0 11.0 15.8 8.3 198 1013 603 438 9 0.2 281 0.93 5 11.0 15+ 1013 10 10.5 14.4 1061 15 10.2 13.8 1076 20 10.2 13.2 7.9 193 1104 613 438 8 0.2 286 0.89 25 10.0 12.5 1104 30 10.0 11.4 1104 35 9.0 6.2 7.6 202 1349 646 454 9 0.2 297 0.93
December 1977 February 1978 April 1978 Surface Middle Bottom Surface Middle Bottom Surface Middle Bottom
Fe 0.07 0.09 0.09 0.05 0.02 0.13 0.07 0.08 0.14 Mn 0.21 0.13 0.50 0.15 0.11 0.88 0.03 0.03 0.06 Pb 0.05 0.05 0.05 0.14 0.14 0.14 ND ND ND Cd 0.03 0.03 0.03 0.02 0.02 0.02 ND ND ND Hg 0.46 0.38 0.45 0.82 0.41 0.49 0.17 0.23 0.49 K 4.3 4.3 4.4 2.7 3.7 4.0 4.1 4.2 4.3 Na 38 39 44 25 40 45 36 37 38 Cu <0.01 0.08 0.04 <0.01 0.01 0.02 ND 0.02 0.02 Zn 0.02 0.12 0.11 0.01 0.04 0.06 ND 0.05 0.06 As 0.001 0.001 0.001 <0.002 <0.002 <0.002 0.001 <0.001 <0.001 Se <0.001 <0.001 <0.001 <0.001 <0.001 <0.001 <0.001 <0.001 <0.001 Ag ND ND ND ND ND ND ND ND ND Cr ND ND ND ND ND ND ND ND ND Ba <0.1 <0.1 <0.1 <0.01 <0.1 <0.1 <0.1 <0.1 <0.1 B 0.4 . 0.4 0.4 0.3 0.4 0.5 0.3 0.3 0.3
Note: Temperature, °Celsius; conductivity, µ mhos; Hg, µg/l; all other values except pH, mg/l
53
3 -- Sunspot East Lake
Sunspot East lake is located in Section 6, T3N, R2E, Fulton County.
The lake and surrounding property is owned by Amax Coal Company who opened
the mine in 1969 and closed it in 1971. The Colchester (No. 2) coal was
mined with a 5761 Marion shovel. The coal was overlain by 50 to 75 feet of
overburden materials of which 30 to 40 feet are clay, till, and sandy clay.
The rock overburden was a soft gray sandy shale (13).
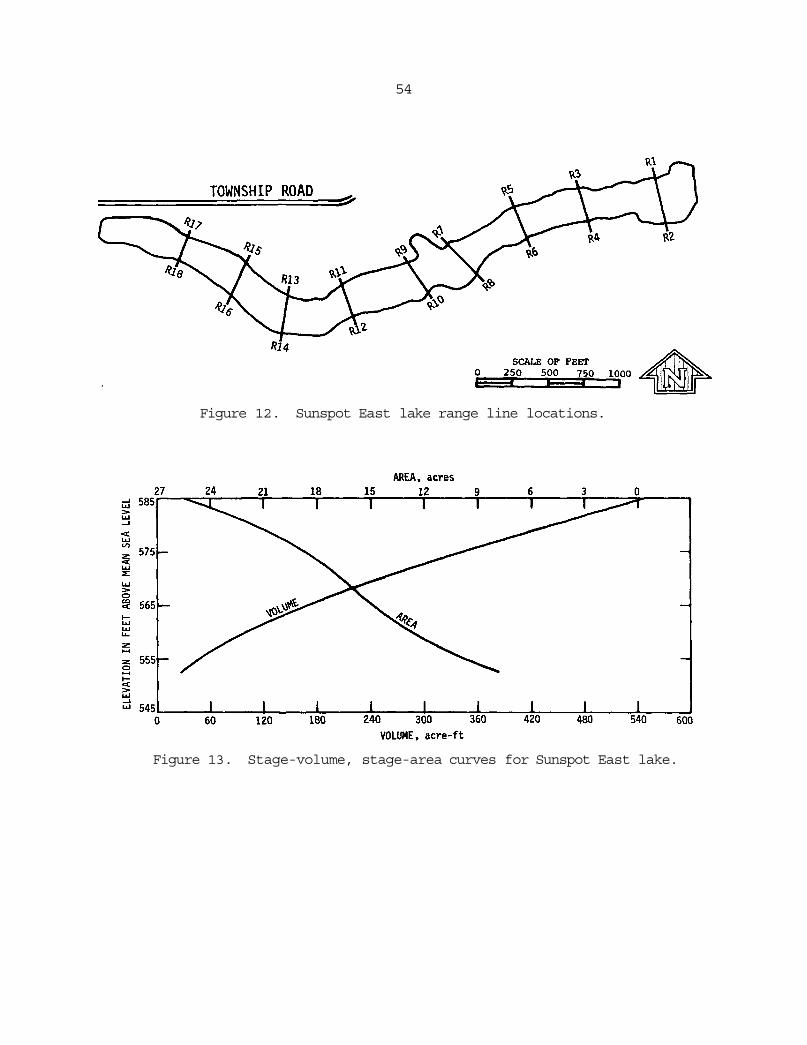
The general shape of the lake and location of range lines where depth
measurements were taken are shown in figure 12. The area and volume of the
lake at elevation 585 feet above mean sea level are 25.57 acres and 553
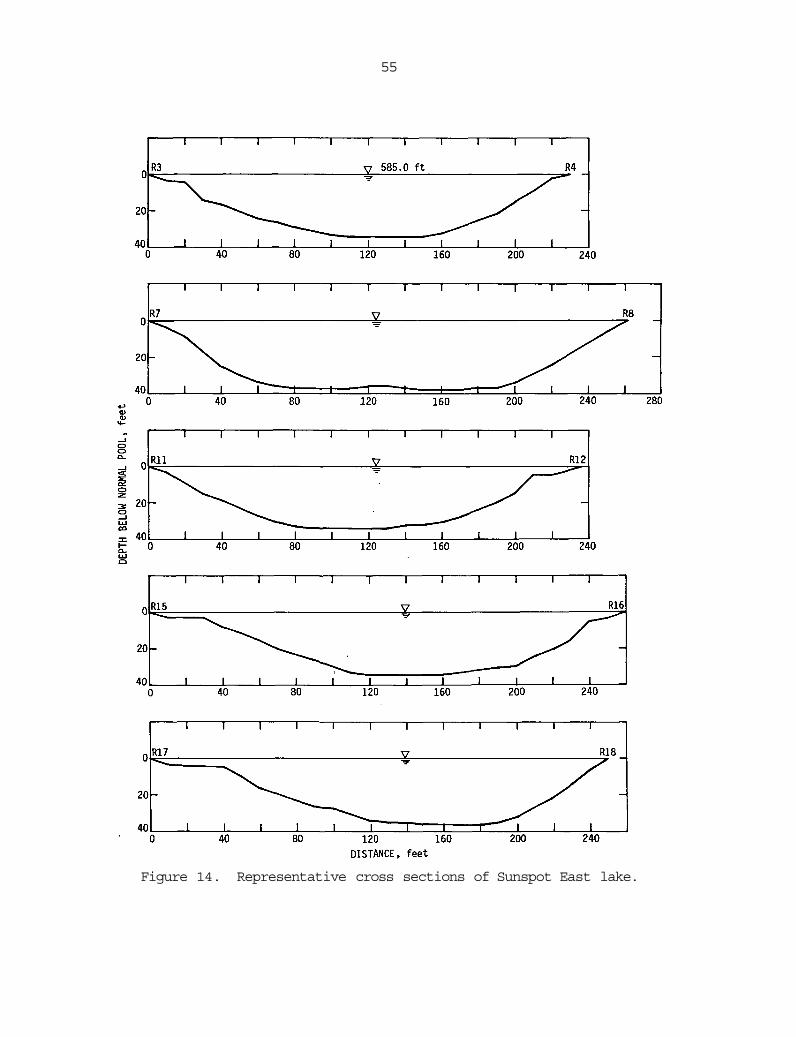
acre-feet, respectively. Stage-volume and stage-area curves for the lake
are presented in figure 13. The maximum measured and calculated average
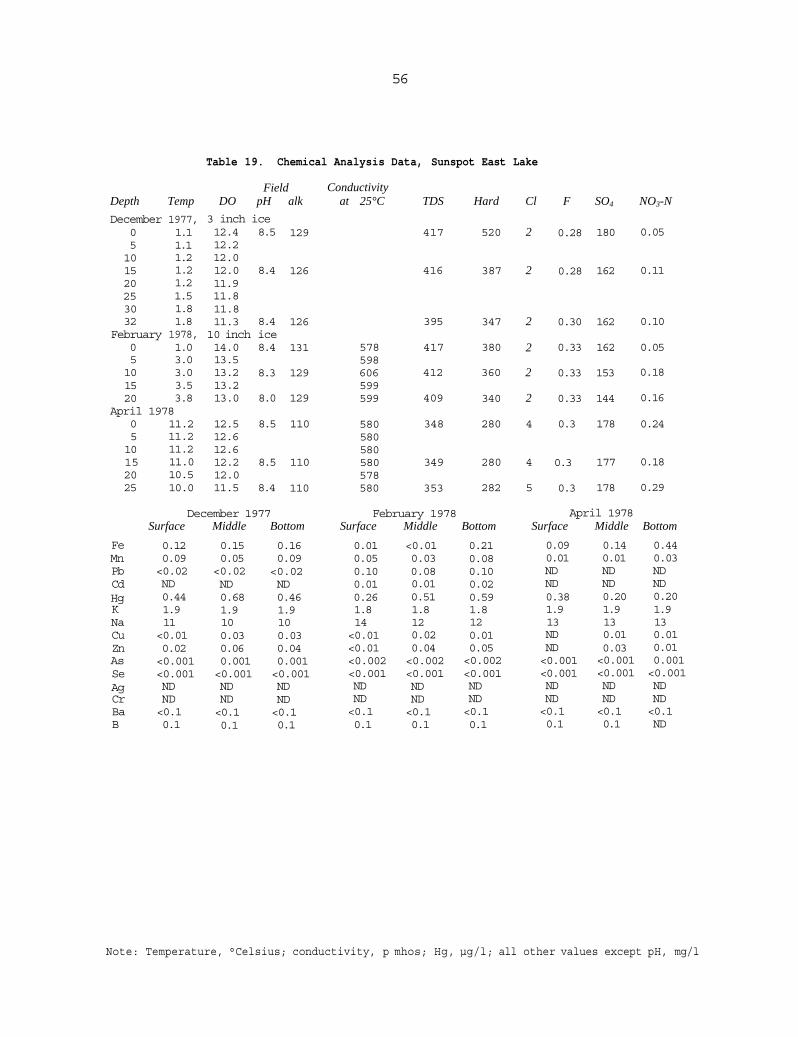
depths are 38 and 21.6 feet, respectively. Representative cross sections
illustrating the lake profile are shown in figure 14.
The watershed of this lake is limited to the immediate lake area and
covers about 80 acres. All of the watershed is reclaimed spoil planted in
clover and grass. The relatively steep slopes encountered in this water
shed as compared with those at Middle Grove resulted in selecting a curve
number (CN) of 65 for this watershed. Precipitation data from Canton were
used to simulate runoff for the 20 years of interest.
On the basis of the calculated net runoff values and a groundwater
contribution of 0.036 gpm/ft x 4400 ft (the approximate length of the lake),
the estimated yields presented in table 18 were determined.
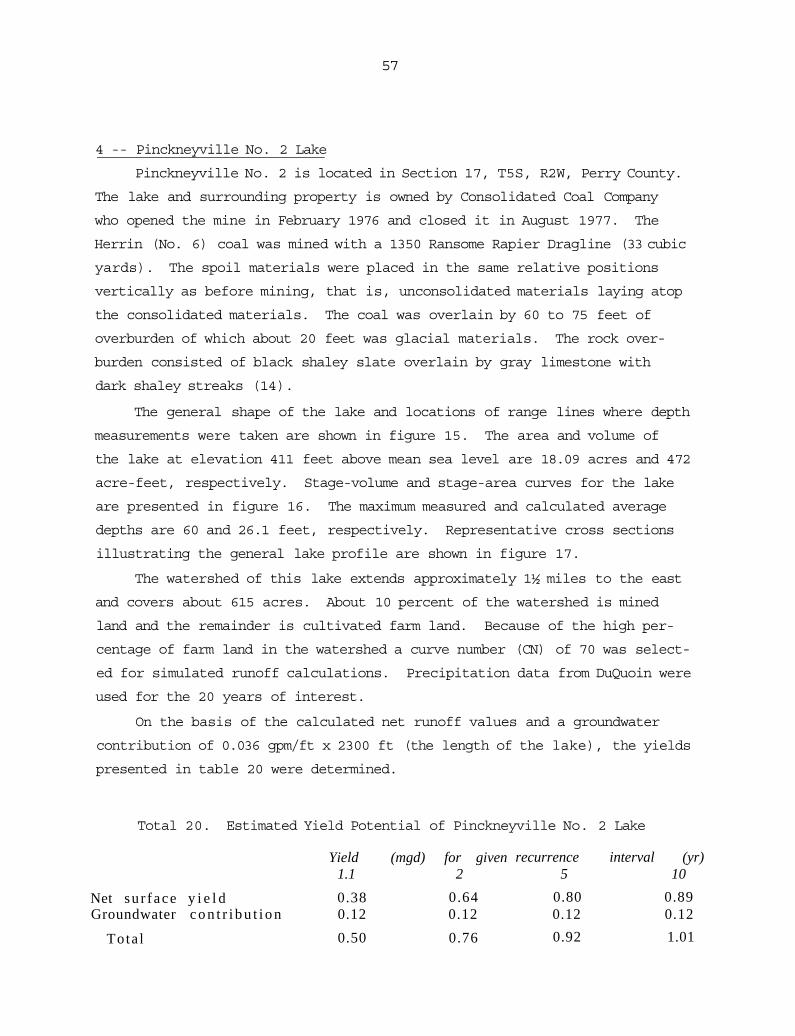
Chemical analysis data for water samples collected December 1977 and
February and April 1978 are presented in table 19.
Table 18. Estimated Yield Potential of Sunspot East Lake
Yield 1.1
(mgd) for given 2
recurrence interval (yr) 5 10
Net surface yield Groundwater contribution
0.02 0.23
0.07 0.23
0.10 0.12 0.23 0.23
Total 0.25 0.30 0.33 0.35
54
Figure 12. Sunspot East lake range line locations.
Figure 13. Stage-volume, stage-area curves for Sunspot East lake.
55
Figure 14. Representative cross sections of Sunspot East lake.
56
Table 19. Chemical Analysis Data, Sunspot East Lake
Field Conductivity Depth Temp DO pH alk at 25°C TDS Hard Cl F SO4 NO3-N December 1977, 3 inch ice
0 1.1 12.4 8.5 129 417 520 2 0.28 180 0.05 5 1.1 12.2 10 1.2 12.0 15 1.2 12.0 8.4 126 416 387 2 0.28 162 0.11 20 1.2 11.9 25 1.5 11.8 30 1.8 11.8 32 1.8 11.3 8.4 126 395 347 2 0.30 162 0.10
February 1978, 10 inch ice 0 1.0 14.0 8.4 131 578 417 380 2 0.33 162 0.05 5 3.0 13.5 598 10 3.0 13.2 8.3 129 606 412 360 2 0.33 153 0.18 15 3.5 13.2 599 20 3.8 13.0 8.0 129 599 409 340 2 0.33 144 0.16
April 1978 0 11.2 12.5 8.5 110 580 348 280 4 0.3 178 0.24 5 11.2 12.6 580 10 11.2 12.6 580 15 11.0 12.2 8.5 110 580 349 280 4 0.3 177 0.18 20 10.5 12.0 578 25 10.0 11.5 8.4 110 580 353 282 5 0.3 178 0.29
December 1977 February 1978 April 1978 Surface Middle Bottom Surface Middle Bottom Surface Middle Bottom
Fe 0.12 0.15 0.16 0.01 <0.01 0.21 0.09 0.14 0.44 Mn 0.09 0.05 0.09 0.05 0.03 0.08 0.01 0.01 0.03 Pb <0.02 <0.02 <0.02 0.10 0.08 0.10 ND ND ND Cd ND ND ND 0.01 0.01 0.02 ND ND ND Hg 0.44 0.68 0.46 0.26 0.51 0.59 0.38 0.20 0.20 K 1.9 1.9 1.9 1.8 1.8 1.8 1.9 1.9 1.9 Na 11 10 10 14 12 12 13 13 13 Cu <0.01 0.03 0.03 <0.01 0.02 0.01 ND 0.01 0.01 Zn 0.02 0.06 0.04 <0.01 0.04 0.05 ND 0.03 0.01 As <0.001 0.001 0.001 <0.002 <0.002 <0.002 <0.001 <0.001 0.001 Se <0.001 <0.001 <0.001 <0.001 <0.001 <0.001 <0.001 <0.001 <0.001 Ag ND ND ND ND ND ND ND ND ND Cr ND ND ND ND ND ND ND ND ND Ba <0.1 <0.1 <0.1 <0.1 <0.1 <0.1 <0.1 <0.1 <0.1 B 0.1 0.1 0.1 0.1 0.1 0.1 0.1 0.1 ND
Note: Temperature, °Celsius; conductivity, p mhos; Hg, µg/l; all other values except pH, mg/l
57
4 -- Pinckneyville No. 2 Lake
Pinckneyville No. 2 is located in Section 17, T5S, R2W, Perry County.
The lake and surrounding property is owned by Consolidated Coal Company
who opened the mine in February 1976 and closed it in August 1977. The
Herrin (No. 6) coal was mined with a 1350 Ransome Rapier Dragline (33 cubic
yards). The spoil materials were placed in the same relative positions
vertically as before mining, that is, unconsolidated materials laying atop
the consolidated materials. The coal was overlain by 60 to 75 feet of
overburden of which about 20 feet was glacial materials. The rock over
burden consisted of black shaley slate overlain by gray limestone with
dark shaley streaks (14).
The general shape of the lake and locations of range lines where depth
measurements were taken are shown in figure 15. The area and volume of
the lake at elevation 411 feet above mean sea level are 18.09 acres and 472
acre-feet, respectively. Stage-volume and stage-area curves for the lake
are presented in figure 16. The maximum measured and calculated average
depths are 60 and 26.1 feet, respectively. Representative cross sections
illustrating the general lake profile are shown in figure 17.
The watershed of this lake extends approximately 1½ miles to the east
and covers about 615 acres. About 10 percent of the watershed is mined
land and the remainder is cultivated farm land. Because of the high per
centage of farm land in the watershed a curve number (CN) of 70 was select
ed for simulated runoff calculations. Precipitation data from DuQuoin were
used for the 20 years of interest.
On the basis of the calculated net runoff values and a groundwater
contribution of 0.036 gpm/ft x 2300 ft (the length of the lake), the yields
presented in table 20 were determined.
Total 20. Estimated Yield Potential of Pinckneyville No. 2 Lake
Yield (mgd) for given recurrence interval (yr) 1.1 2 5 10
Net su r face y i e l d 0.38 0.64 0.80 0.89 Groundwater c o n t r i b u t i o n 0.12 0.12 0.12 0.12
Tota l 0.50 0.76 0.92 1.01
58
Figure 15. Pinckneyville No. 2 lake and range line locations.
Figure 16. Stage-volume, stage-area curves for Pinckneyville No. 2 lake.
59
Figure 17. Representative cross sections of Pinckneyville No. 2 lake.
60
As noted earlier this lake was chosen for study because mining had
just stopped and the final cut pit was in the process of filling. Water
level measurements were made at regular intervals and a water budget anal
ysis was attempted to delineate the groundwater contribution to the lake.
For this analysis precipitation data from DuQuoin, pan evaporation data
from Carlyle, and a CN of 70 were used. Table 21 summarizes the results
of this effort.
Because of the relatively small size of the mine operation in the
immediate lake area and the short life of the mining activity, a relatively
small area of spoil material around the pit probably was dewatered. When
the pit was first observed, another lake just across the haul road at the
north end of the lake had a water level 52 feet higher than the water level
in this pit. A significant seepage zone near the base of the road fill be
tween the 2 lakes also was noted. It is likely that seepage through the
road fill and rapid recharging of the spoil materials accounts for the
almost constant groundwater inflow into the lake. However, these rates
probably are not representative of groundwater yields that would be ex
perienced under pumped conditions.
Chemical analysis data for water samples collected December 1977 and
February and April 1978 are presented in table 22.
Table 21. Water Budget Analysis of Pinckneyville No. 2 Lake and Watershed
GroundLake Lake Lake water level volume Precip. Runoff evap. contrib.
Date (MSL) (ac-ft) (inches) (inches) (inches) (gpm/ft) 10/11/77 356.58 9 10/24/77 357.60 11 0.24 0 1.15 0.02 11/11/77 359.80 15 1.90 0.1 0.68 -0.01 11/21/77 362.45 22 1.66 0.1 0.23 0.02 11/30/77 364.00 26 0.91 0 0 0.04 12/13/77 377.79 90 3.44 1.0 0 0.08 1/4/78 384.33 140 0.59 0 0 0.22 1/23/78 384.88 145 0.95 0 0 0.02 2/6/78 384.79 144 0.19 0 0 -0.01 3/15/78 405.01 377
61
Table 22. Chemical Analysis Data, Pinckneyville No. 2 Lake
Field Conductivity Depth Temp DO pH alk at 25°C TDS Hard Cl F SO4 NO3 -N
December 1977 , i c e c o v e r 0 2 . 0 1 1 . 9 7 . 8 103 864 433 12 0 . 2 9 342 0 . 9 5 2 2 . 0 1 1 . 9 4 2 . 0 1 1 . 9 6 2 . 0 1 1 . 9 8 2 . 0 1 1 . 8
10 2 . 0 1 1 . 8 12 2 . 0 1 1 . 5 7 . 8 108 870 487 13 0 . 4 2 373 1.02 14 2 . 0 1 1 . 5 16 2 . 5 1 1 . 4 18 2 . 5 1 1 . 1 20 2 . 5 1 1 . 0 22 3 . 0 9 . 8 7 . 8 121 984 513 15 0 . 3 3 433 1.00
F e b r u a r y 1978 , 9 i n c h i c e 0 1.0 1 6 . 3 8 . 7 101 1050 739 472 21 0 . 3 5 391 0 . 7 2 2 3 . 0 1 6 . 4 1079 4 3 . 8 1 3 . 5 1102 6 4 . 0 1 2 . 8 1134 8 4 . 0 1 2 . 4 1134
10 4 . 0 1 2 . 3 1134 12 4 . 0 1 2 . 3 1134 14 4 . 0 1 2 . 3 1134 16 4 . 0 1 2 . 2 7 . 7 106 1134 756 472 22 0 . 3 1 378 0 . 9 4 20 4 . 0 1 2 . 0 1134 25 4 . 0 1 2 . 0 1166 30 5 . 0 7 . 5 7 . 7 106 1303 770 472 21 0 . 2 9 378 1.14
A p r i l 1978 0 1 7 . 0 1 0 . 2 8 . 7 78 732 424 258 12 0 . 2 243 1.06 5 1 7 . 0 1 0 . 2 732
10 1 5 . 8 1 0 . 0 738 15 9 . 6 1 0 . 1 763 20 8 . 5 1 0 . 2 785 25 8 .0 1 0 . 3 796 30 7 . 0 1 0 . 5 7 . 6 78 775 432 258 11 0 . 2 243 1.22 35 6 . 9 1 0 . 5 775 40 6 . 7 1 0 . 4 785 45 6 . 5 1 0 . 4 785 55 6 . 5 1 0 . 4 800 60 6 . 8 9 . 3 7 . 6 78 901 434 274 12 0 . 2 243 1.36
December 1977 F e b r u a r y 1978 Ap r i l 1978 Surface Middle Bottom Surface Middle B o t t o m Surface Middle Bottom
Fe 0 . 8 5 0 . 6 5 0 . 7 5 0 . 3 0 0 . 3 6 0 . 9 8 0 . 1 0 . 2 8 1.03 Mn 0 . 3 8 0 . 2 3 0 . 2 5 0 . 2 7 0 . 2 7 0 . 2 5 0 . 0 4 0 . 0 5 0 . 1 1 Pb 0 . 0 8 0 . 0 5 0 . 0 5 0 . 1 1 0 . 1 1 0 . 1 3 ND ND ND Cd 0 . 0 3 0 . 0 3 0 . 0 3 0 . 0 1 0 . 0 2 0 .02 ND ND ND Hg 0 . 3 2 0 . 3 8 0 . 4 4 0 . 5 6 0 . 5 4 0 . 4 0 0 . 0 7 0 . 0 4 0 . 1 1 K 4 . 5 4 . 5 4 . 3 3 .9 3 . 9 4 . 1 3 . 8 3 . 7 3 .8 Na 50 51 58 50 50 50 33 32 33 Cu 0 . 0 3 0 . 0 2 0 . 0 1 < 0 . 0 1 0 . 0 2 0 . 0 1 0 . 0 1 0 . 0 1 0 . 0 1 Zn 0 . 0 6 0 . 0 4 0 . 0 3 0 . 0 1 0 . 0 6 0 . 0 4 ND 0 . 0 2 0 .02 As <0 .002 <0 .002 <0.002 <0.002 <0 .002 <0.002 < 0 . 0 0 1 <0 .001 <0 .001 Se < 0 . 0 0 1 <0 .001 <0 .001 <0 .001 < 0 . 0 0 1 <0 .001 <0 .001 <0 .001 <0 .001 Ag ND ND ND ND ND ND ND ND ND Cr ND ND ND ND ND ND ND ND ND Ba < 0 . l <0.1 <0.1 <0.1 < 0 . 1 <0 . l <0.1 <().l <().l B 0 . 1 0 . 1 0 . 1 0.1 0 . 1 0 .2 0 . 1 0 . 1 0 . 1
Note: Temperature, °Celsius; conductivity, µ mhos; Hg, µg/l; all other values except pH, mg/l
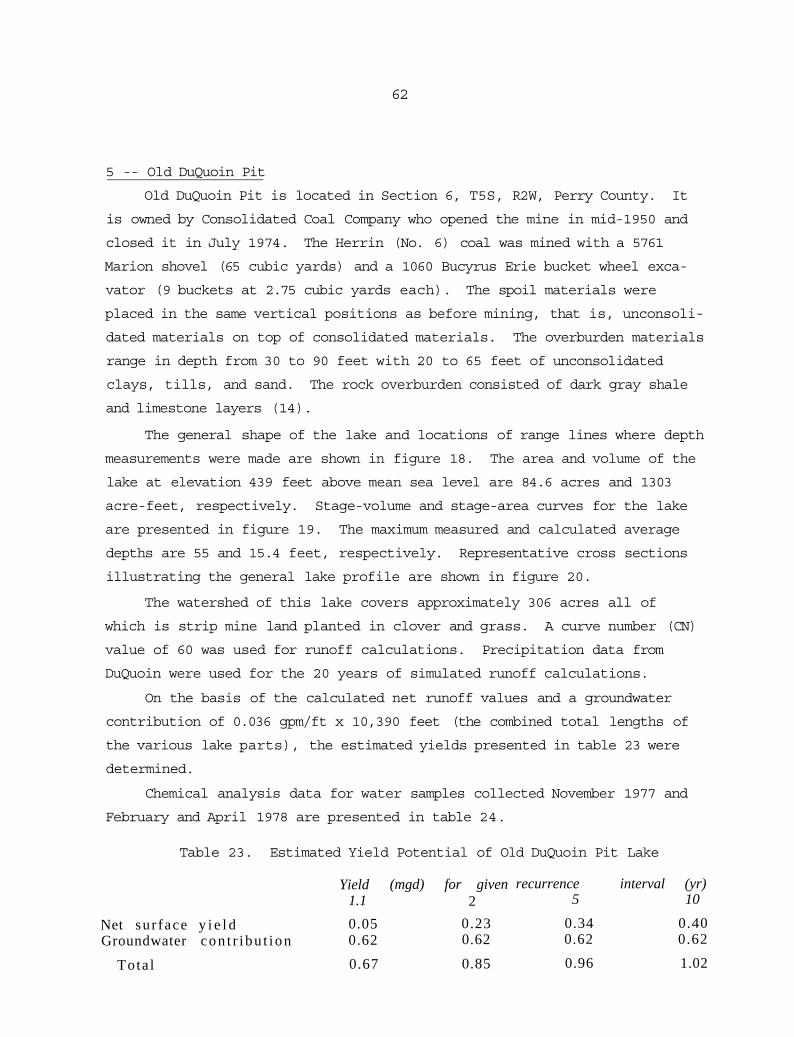
62
5 -- Old DuQuoin Pit
Old DuQuoin Pit is located in Section 6, T5S, R2W, Perry County. It
is owned by Consolidated Coal Company who opened the mine in mid-1950 and
closed it in July 1974. The Herrin (No. 6) coal was mined with a 5761
Marion shovel (65 cubic yards) and a 1060 Bucyrus Erie bucket wheel exca
vator (9 buckets at 2.75 cubic yards each). The spoil materials were
placed in the same vertical positions as before mining, that is, unconsoli
dated materials on top of consolidated materials. The overburden materials
range in depth from 30 to 90 feet with 20 to 65 feet of unconsolidated
clays, tills, and sand. The rock overburden consisted of dark gray shale
and limestone layers (14).
The general shape of the lake and locations of range lines where depth
measurements were made are shown in figure 18. The area and volume of the
lake at elevation 439 feet above mean sea level are 84.6 acres and 1303
acre-feet, respectively. Stage-volume and stage-area curves for the lake
are presented in figure 19. The maximum measured and calculated average
depths are 55 and 15.4 feet, respectively. Representative cross sections
illustrating the general lake profile are shown in figure 20.
The watershed of this lake covers approximately 306 acres all of
which is strip mine land planted in clover and grass. A curve number (CN)
value of 60 was used for runoff calculations. Precipitation data from
DuQuoin were used for the 20 years of simulated runoff calculations.
On the basis of the calculated net runoff values and a groundwater
contribution of 0.036 gpm/ft x 10,390 feet (the combined total lengths of
the various lake parts), the estimated yields presented in table 23 were
determined.
Chemical analysis data for water samples collected November 1977 and
February and April 1978 are presented in table 24.
Table 23. Estimated Yield Potential of Old DuQuoin Pit Lake
Yield 1.1
(mgd) for given 2
recurrence interval (yr) 5 10
Net su r face y i e l d Groundwater con t r i bu t i on
0.05 0.62
0.23 0.62
0.34 0.40 0.62 0.62
Tota l 0.67 0.85 0.96 1.02
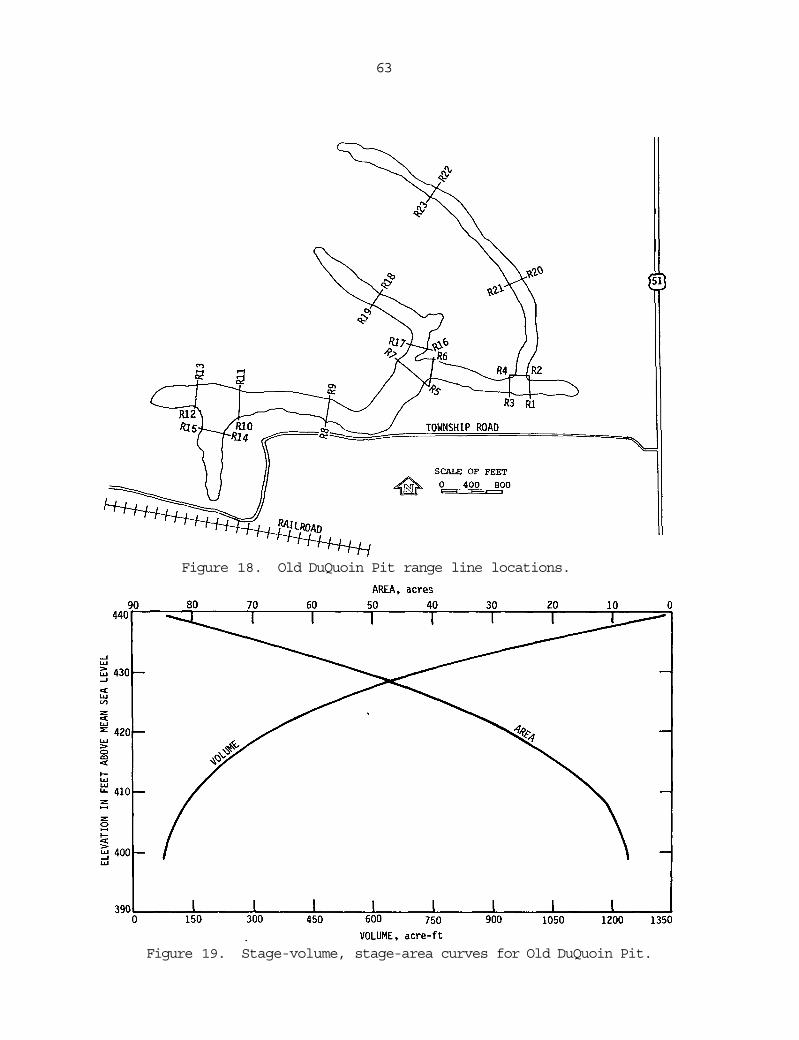
63
Figure 18. Old DuQuoin Pit range line locations.
Figure 19. Stage-volume, stage-area curves for Old DuQuoin Pit.
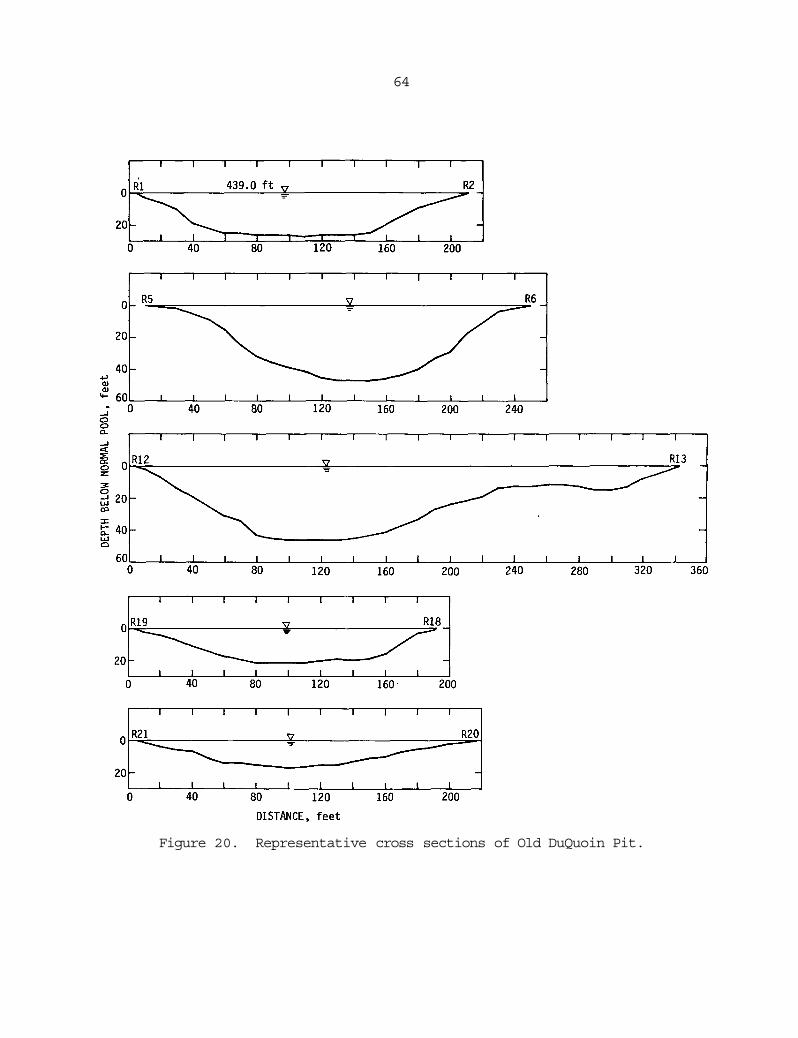
64
Figure 20. Representative cross sections of Old DuQuoin Pit.
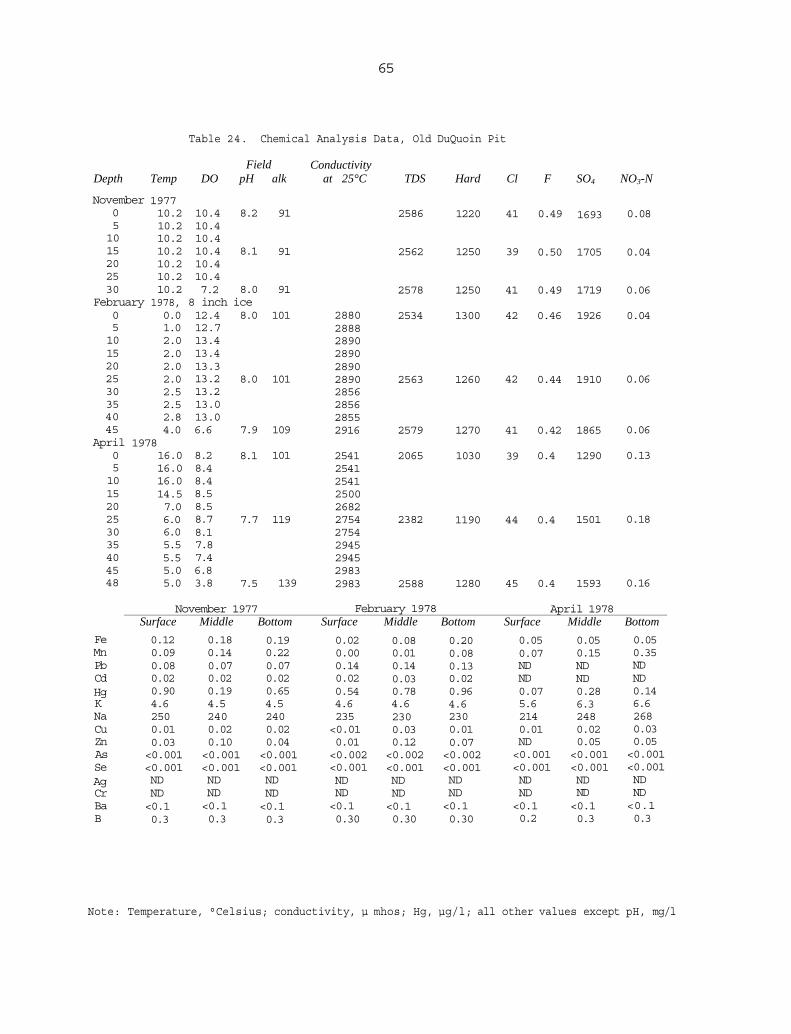
65
Table 24. Chemical Analysis Data, Old DuQuoin Pit
Field Conductivity Depth Temp DO pH alk at 25°C TDS Hard Cl F SO4 NO3-N
November 1977 0 10.2 10.4 8.2 91 2586 1220 41 0.49 1693 0.08 5 10.2 10.4 10 10.2 10.4 15 10.2 10.4 8.1 91 2562 1250 39 0.50 1705 0.04 20 10.2 10.4 25 10.2 10.4 30 10.2 7.2 8.0 91 2578 1250 41 0.49 1719 0.06
February 1978, 8 inch ice 0 0.0 12.4 8.0 101 2880 2534 1300 42 0.46 1926 0.04 5 1.0 12.7 2888 10 2.0 13.4 2890 15 2.0 13.4 2890 20 2.0 13.3 2890 25 2.0 13.2 8.0 101 2890 2563 1260 42 0.44 1910 0.06 30 2.5 13.2 2856 35 2.5 13.0 2856 40 2.8 13.0 2855 45 4.0 6.6 7.9 109 2916 2579 1270 41 0.42 1865 0.06
April 1978 0 16.0 8.2 8.1 101 2541 2065 1030 39 0.4 1290 0.13 5 16.0 8.4 2541 10 16.0 8.4 2541 15 14.5 8.5 2500 20 7.0 8.5 2682 25 6.0 8.7 7.7 119 2754 2382 1190 44 0.4 1501 0.18 30 6.0 8.1 2754 35 5.5 7.8 2945 40 5.5 7.4 2945 45 5.0 6.8 2983 48 5.0 3.8 7.5 139 2983 2588 1280 45 0.4 1593 0.16
November 1977 February 1978 April 1978 Surface Middle Bottom Surface Middle Bottom Surface Middle Bottom
Fe 0.12 0.18 0.19 0.02 0.08 0.20 0.05 0.05 0.05 Mn 0.09 0.14 0.22 0.00 0.01 0.08 0.07 0.15 0.35 Pb 0.08 0.07 0.07 0.14 0.14 0.13 ND ND ND Cd 0.02 0.02 0.02 0.02 0.03 0.02 ND ND ND Hg 0.90 0.19 0.65 0.54 0.78 0.96 0.07 0.28 0.14 K 4.6 4.5 4.5 4.6 4.6 4.6 5.6 6.3 6.6 Na 250 240 240 235 230 230 214 248 268 Cu 0.01 0.02 0.02 <0.01 0.03 0.01 0.01 0.02 0.03 Zn 0.03 0.10 0.04 0.01 0.12 0.07 ND 0.05 0.05
As <0.001 <0.001 <0.001 <0.002 <0.002 <0.002 <0.001 <0.001 <0.001 Se <0.001 <0.001 <0.001 <0.001 <0.001 <0.001 <0.001 <0.001 <0.001 Ag ND ND ND ND ND ND ND ND ND Cr ND ND ND ND ND ND ND ND ND Ba <0.1 <0.1 <0.1 <0.1 <0.1 <0.1 <0.1 <0.1 <0.1 B 0.3 0.3 0.3 0.30 0.30 0.30 0.2 0.3 0.3
Note: Temperature, °Celsius; conductivity, µ mhos; Hg, µg/l; all other values except pH, mg/l
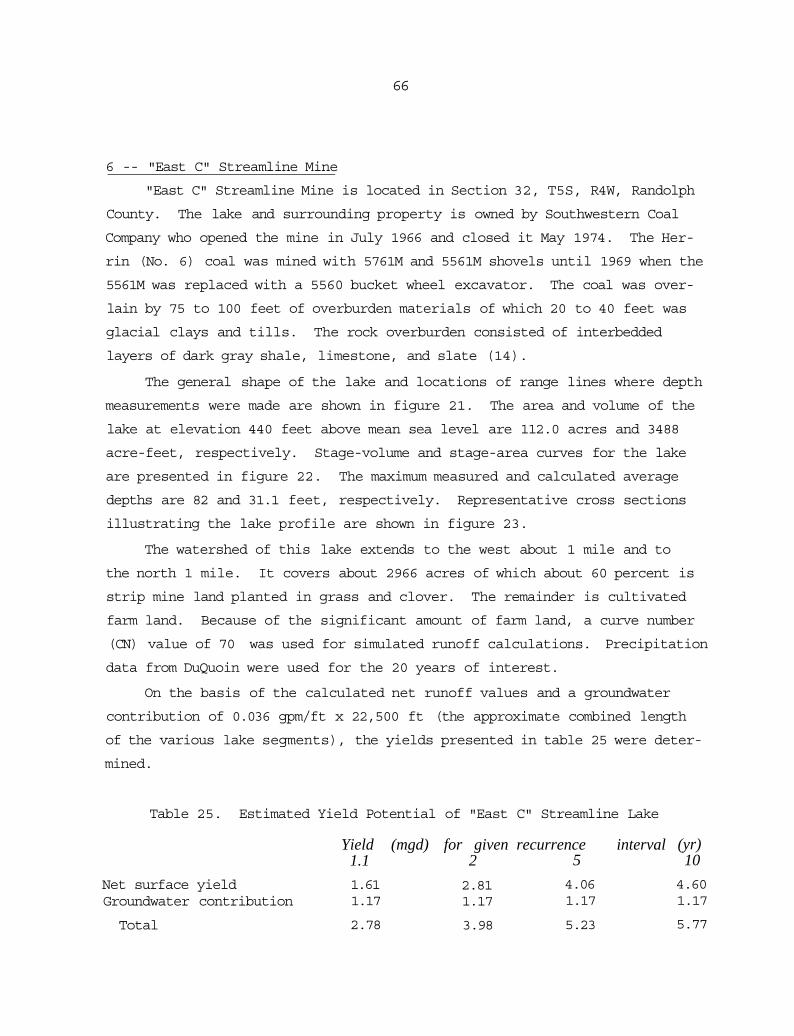
66
6 -- "East C" Streamline Mine
"East C" Streamline Mine is located in Section 32, T5S, R4W, Randolph
County. The lake and surrounding property is owned by Southwestern Coal
Company who opened the mine in July 1966 and closed it May 1974. The Her-
rin (No. 6) coal was mined with 5761M and 5561M shovels until 1969 when the
5561M was replaced with a 5560 bucket wheel excavator. The coal was over
lain by 75 to 100 feet of overburden materials of which 20 to 40 feet was
glacial clays and tills. The rock overburden consisted of interbedded
layers of dark gray shale, limestone, and slate (14).
The general shape of the lake and locations of range lines where depth
measurements were made are shown in figure 21. The area and volume of the
lake at elevation 440 feet above mean sea level are 112.0 acres and 3488
acre-feet, respectively. Stage-volume and stage-area curves for the lake
are presented in figure 22. The maximum measured and calculated average
depths are 82 and 31.1 feet, respectively. Representative cross sections
illustrating the lake profile are shown in figure 23.
The watershed of this lake extends to the west about 1 mile and to
the north 1 mile. It covers about 2966 acres of which about 60 percent is
strip mine land planted in grass and clover. The remainder is cultivated
farm land. Because of the significant amount of farm land, a curve number
(CN) value of 70 was used for simulated runoff calculations. Precipitation
data from DuQuoin were used for the 20 years of interest.
On the basis of the calculated net runoff values and a groundwater
contribution of 0.036 gpm/ft x 22,500 ft (the approximate combined length
of the various lake segments), the yields presented in table 25 were deter
mined.
Table 25. Estimated Yield Potential of "East C" Streamline Lake
Yield 1.1
(mgd) for given 2
recurrence interval 5
(yr) 10
Net surface yield Groundwater contribution
1.61 1.17
2.81 1.17
4.06 1.17
4.60 1.17
Total 2.78 3.98 5.23 5.77
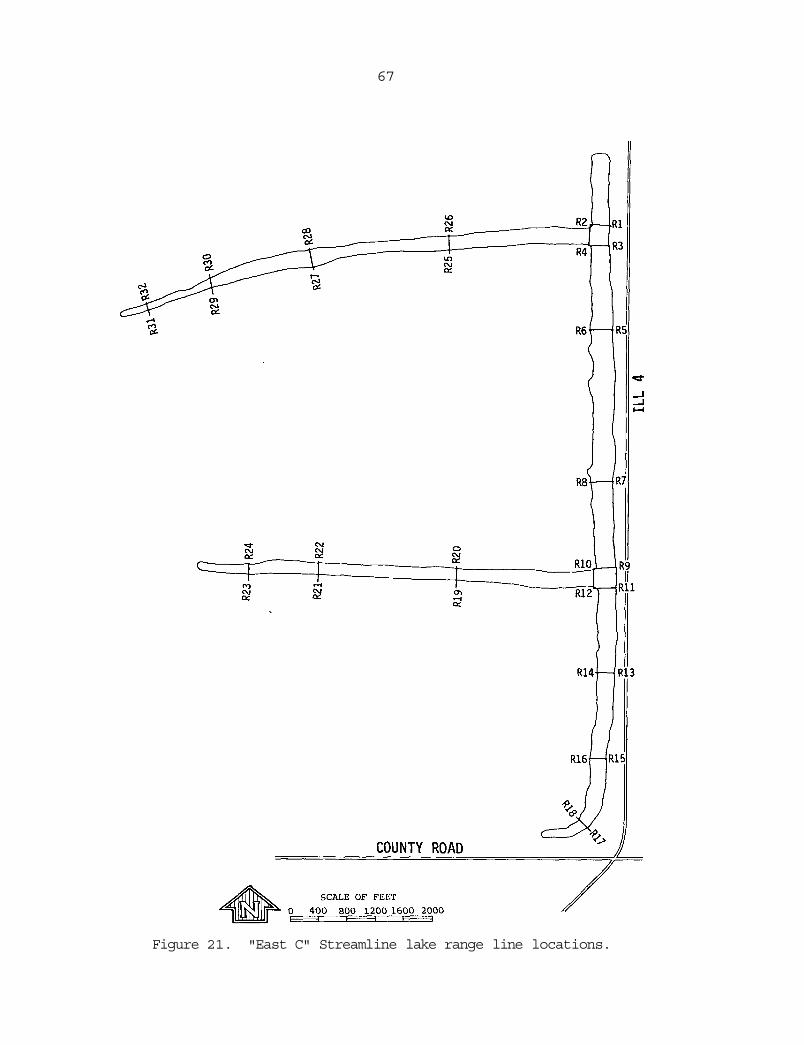
67
Figure 21. "East C" Streamline lake range line locations.
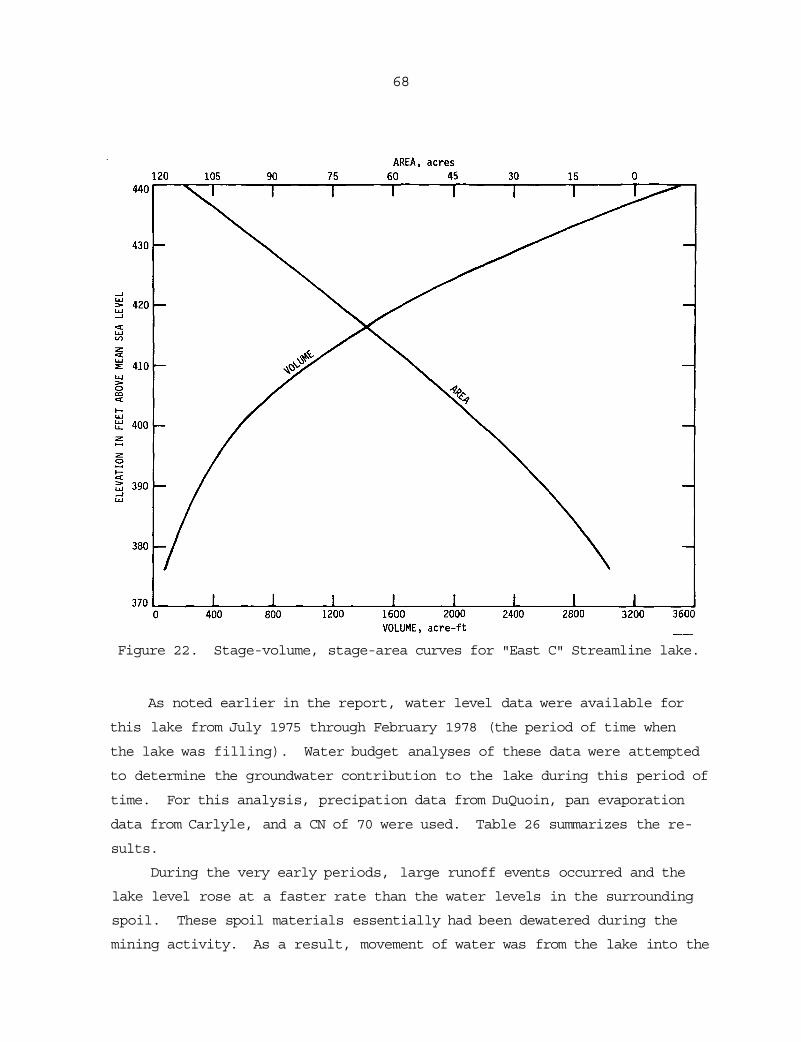
68
Figure 22. Stage-volume, stage-area curves for "East C" Streamline lake.
As noted earlier in the report, water level data were available for
this lake from July 1975 through February 1978 (the period of time when
the lake was filling). Water budget analyses of these data were attempted
to determine the groundwater contribution to the lake during this period of
time. For this analysis, precipation data from DuQuoin, pan evaporation
data from Carlyle, and a CN of 70 were used. Table 26 summarizes the re
sults.
During the very early periods, large runoff events occurred and the
lake level rose at a faster rate than the water levels in the surrounding
spoil. These spoil materials essentially had been dewatered during the
mining activity. As a result, movement of water was from the lake into the
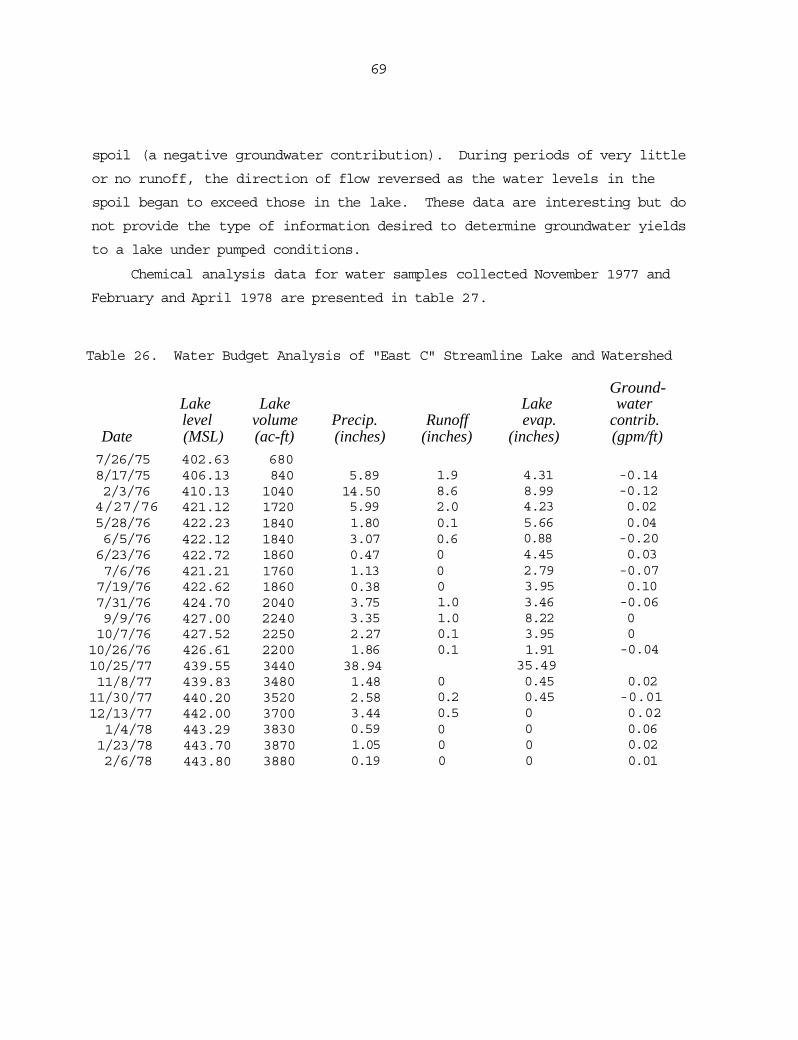
69
spoil (a negative groundwater contribution). During periods of very little
or no runoff, the direction of flow reversed as the water levels in the
spoil began to exceed those in the lake. These data are interesting but do
not provide the type of information desired to determine groundwater yields
to a lake under pumped conditions.
Chemical analysis data for water samples collected November 1977 and
February and April 1978 are presented in table 27.
Table 26. Water Budget Analysis of "East C" Streamline Lake and Watershed
GroundLake Lake Lake water level volume Precip. Runoff evap. contrib.
Date (MSL) (ac-ft) (inches) (inches) (inches) (gpm/ft) 7/26/75 402.63 680 8/17/75 406.13 840 5.89 1.9 4.31 -0.14 2/3/76 410.13 1040 14.50 8.6 8.99 -0.12 4/27/76 421.12 1720 5.99 2.0 4.23 0.02 5/28/76 422.23 1840 1.80 0.1 5.66 0.04 6/5/76 422.12 1840 3.07 0.6 0.88 -0.20 6/23/76 422.72 1860 0.47 0 4.45 0.03 7/6/76 421.21 1760 1.13 0 2.79 -0.07 7/19/76 422.62 1860 0.38 0 3.95 0.10 7/31/76 424.70 2040 3.75 1.0 3.46 -0.06 9/9/76 427.00 2240 3.35 1.0 8.22 0 10/7/76 427.52 2250 2.27 0.1 3.95 0 10/26/76 426.61 2200 1.86 0.1 1.91 -0.04 10/25/77 439.55 3440 38.94 35.49 11/8/77 439.83 3480 1.48 0 0.45 0.02 11/30/77 440.20 3520 2.58 0.2 0.45 -0.01 12/13/77 442.00 3700 3.44 0.5 0 0.02 1/4/78 443.29 3830 0.59 0 0 0.06 1/23/78 443.70 3870 1.05 0 0 0.02 2/6/78 443.80 3880 0.19 0 0 0.01
70
Figure 23a. Representative cross sections of "East C" Streamline lake.
71
Figure 23b. Representative cross sections of "East C" Streamline lake.
72
Table 27. Chemical Analysis Data, "East C" Streamline Lake
Field Conductivity Depth Temp DO pH alk at 25°C TDS Hard Cl F SO4 NO3-N November 1977
0 11.0 9.7 8.0 225 2868 1224 38 0.58 1826 0.09 5 11.0 9.5 10 11.2 9.0 15 11.2 9.0 20 11.2 9.0 25 11.3 8.8 30 11.3 8.8 35 11.5 8.7 40 11.5 8.6 8.0 220 2870 1200 27 0.58 1856 0.10 45 11.5 0.9 50 11.3 0.7 55 11.0 0.6 60 11.0 0.4 65 11.0 0.4 70 11.2 0.3 75 12.0 0.3 80 12.0 0.2 7.0 740 5978 2125 161 0.79 3247 0.11
February 1978, 6 inch ice 0 0.5 14.2 7.85 222 2670 2670 1160 26 1.05 1917 0.24 5 1.0 14.4 3010 10 1.0 14.6 3150 15 1.0 14.2 3150 20 1.0 14.1 3150 25 1.0 14.1 3150 30 1.0 14.0 3150 35 1.0 13.6 3185 40 1.5 13.5 3182 45 2.0 12.6 7.75 227 3230 2685 1160 27 0.64 1984 0.21 50 2.0 12.0 3315 55 2.5 11.6 3326 60 2.5 11.4 3360 65 6.2 1.6 3519 70 8.5 0.6 5328 75 9.5 0.3 5880 80 11.0 0.0 7370 83 11.8 0.0 6.75 785 7260 5903 2120 155 0.79 3483 0.12
April 1978 0 15.1 12.4 8.55 152 2349 1829 800 19 0.40 1138 0.24 5 15.1 12.9 2349 10 15.1 12.7 2349 15 14.9 12.1 2343 20 10.2 9.4 2629 25 5.0 7.3 2983 30 4.0 7.0 3094 35 4.0 6.8 3159 40 4.0 6.6 3232 45 4.0 6.1 7.25 255 3248 2768 1200 30 0.50 1663 0.44 50 4.0 5.8 3370 55 4.0 5.6 3410 60 4.0 5.2 3499 65 4.5 4.3 3680 70 5.5 2.9 3860 75 8.0 0.1 5256 80 10.0 0.1 5920 85 11.0 0.1 6.80 659 6200 5298 2050 114 0.70 3083 0.17
Concluded on next page
73
Table 27. Concluded
November 1977 February 1978 April 1978 Surface Middle Bottom Surface Middle Bottom Surface Middle Bottom
Fe 0.31 0.34 21.10 0.18 0.06 24.3 0.05 0.09 20.2 Mn 0.69 0.75 3.40 0.66 0.81 4.65 0.51 1.14 5.9 Pb 0.07 0.08 0.08 0.11 0.11 0.11 N D N D N D Cd 0.02 0.02 0.04 0.02 0.02 0.03 N D N D N D Hg 0.08 0.22 0.74 0.80 0.66 0.64 0.16 0.23 0.30 K 8.20 8.10 8.40 8.5 8.5 12.8 8.8 11.0 17.7 Na 220 400 1000 305 310 425 261 382 875 Cu 0.01 0.03 0.08 <0.01 0.01 0.04 0.01 0.02 0.04 Zn 0.11 0.10 0.20 0.02 0.05 0.27 ND 0.05 0.18 As <0.001 <0.001 0.008 <0.002 <0.002 <0.002 <0.001 <0.001 0.01 Se <0.001 <0.001 <0.001 <0.001 <0.001 <0.001 <0.001 <0.001 <0.001 Ag N D N D N D N D N D N D N D ND N D Cr N D N D N D N D N D N D N D N D N D Ba <0.1 <0.1 <0.1 <0.1 <0.1 <0.1 <0.1 <0.10 <0.1 6 0.5 0 .5 1.3 0.5 0.5 1.4 0.30 0.50 1.2
Note: Temperature, °Celsius; conductivity, µ mhos; Hg, µg/l; all other values except pH, mg/l
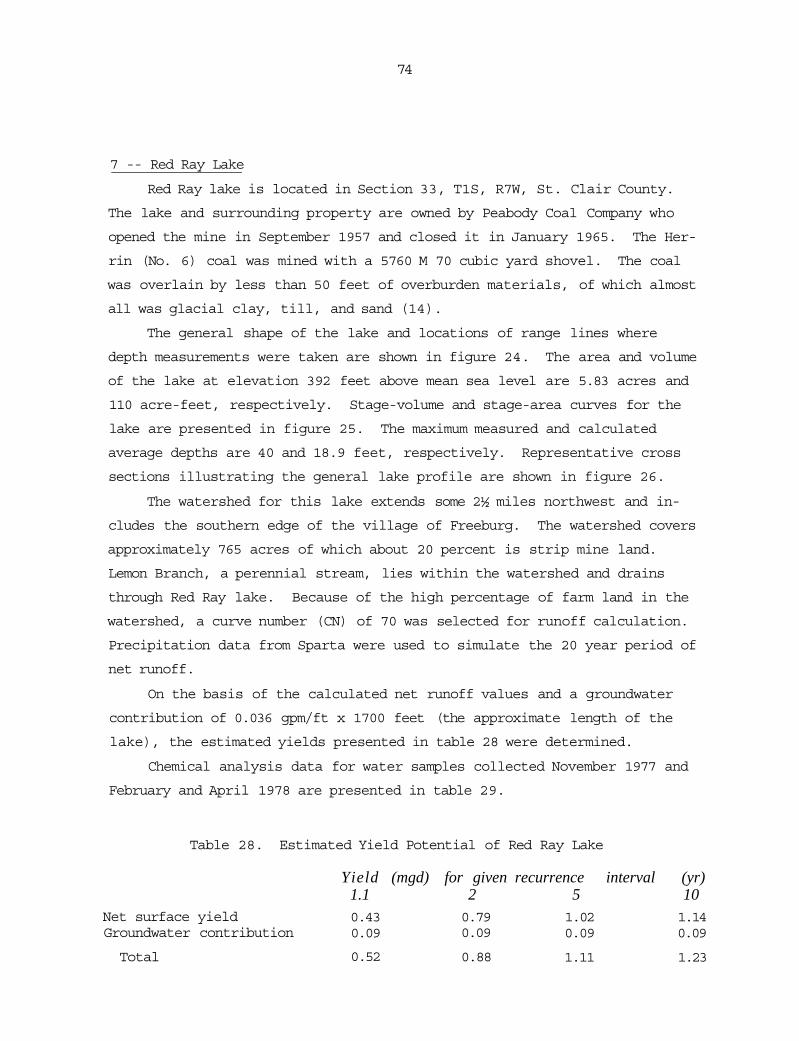
74
7 -- Red Ray Lake
Red Ray lake is located in Section 33, T1S, R7W, St. Clair County.
The lake and surrounding property are owned by Peabody Coal Company who
opened the mine in September 1957 and closed it in January 1965. The Her-
rin (No. 6) coal was mined with a 5760 M 70 cubic yard shovel. The coal
was overlain by less than 50 feet of overburden materials, of which almost
all was glacial clay, till, and sand (14).
The general shape of the lake and locations of range lines where
depth measurements were taken are shown in figure 24. The area and volume
of the lake at elevation 392 feet above mean sea level are 5.83 acres and
110 acre-feet, respectively. Stage-volume and stage-area curves for the
lake are presented in figure 25. The maximum measured and calculated
average depths are 40 and 18.9 feet, respectively. Representative cross
sections illustrating the general lake profile are shown in figure 26.
The watershed for this lake extends some 2½ miles northwest and in
cludes the southern edge of the village of Freeburg. The watershed covers
approximately 765 acres of which about 20 percent is strip mine land.
Lemon Branch, a perennial stream, lies within the watershed and drains
through Red Ray lake. Because of the high percentage of farm land in the
watershed, a curve number (CN) of 70 was selected for runoff calculation.
Precipitation data from Sparta were used to simulate the 20 year period of
net runoff.
On the basis of the calculated net runoff values and a groundwater
contribution of 0.036 gpm/ft x 1700 feet (the approximate length of the
lake), the estimated yields presented in table 28 were determined.
Chemical analysis data for water samples collected November 1977 and
February and April 1978 are presented in table 29.
Table 28. Estimated Yield Potential of Red Ray Lake
Yield (mgd) for given recurrence interval (yr) 1.1 2 5 10
Net surface yield 0.43 0.79 1.02 1.14 Groundwater contribution 0.09 0.09 0.09 0.09
Total 0.52 0.88 1.11 1.23
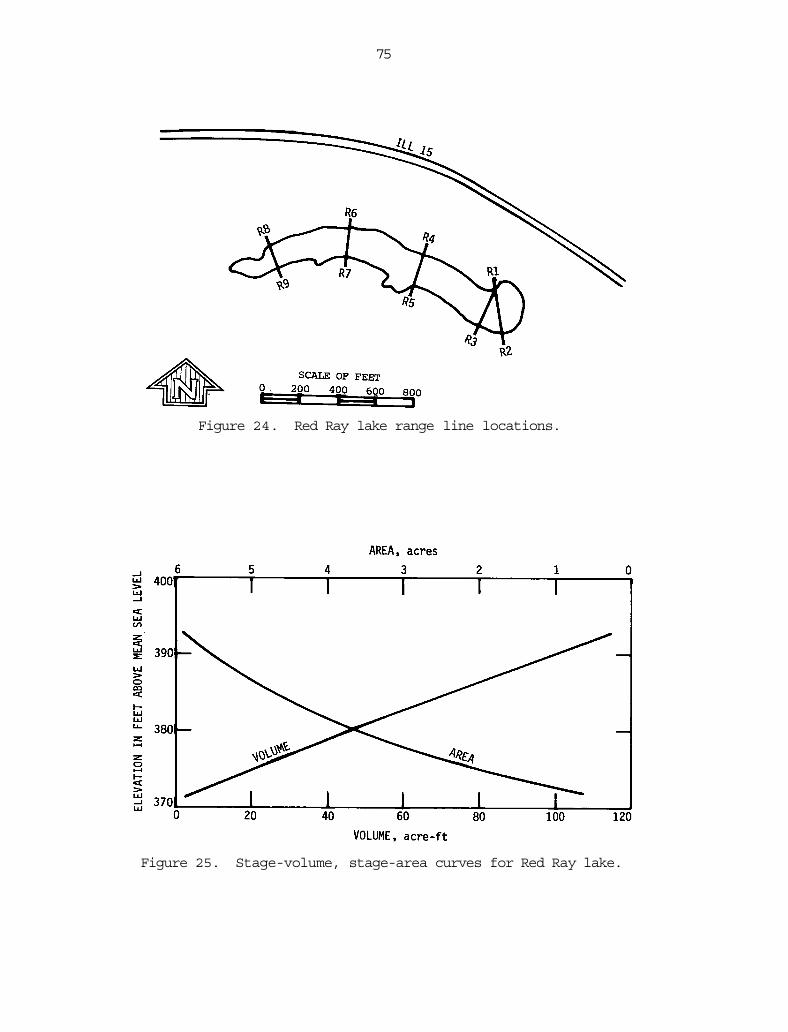
75
Figure 24. Red Ray lake range line locations.
Figure 25. Stage-volume, stage-area curves for Red Ray lake.
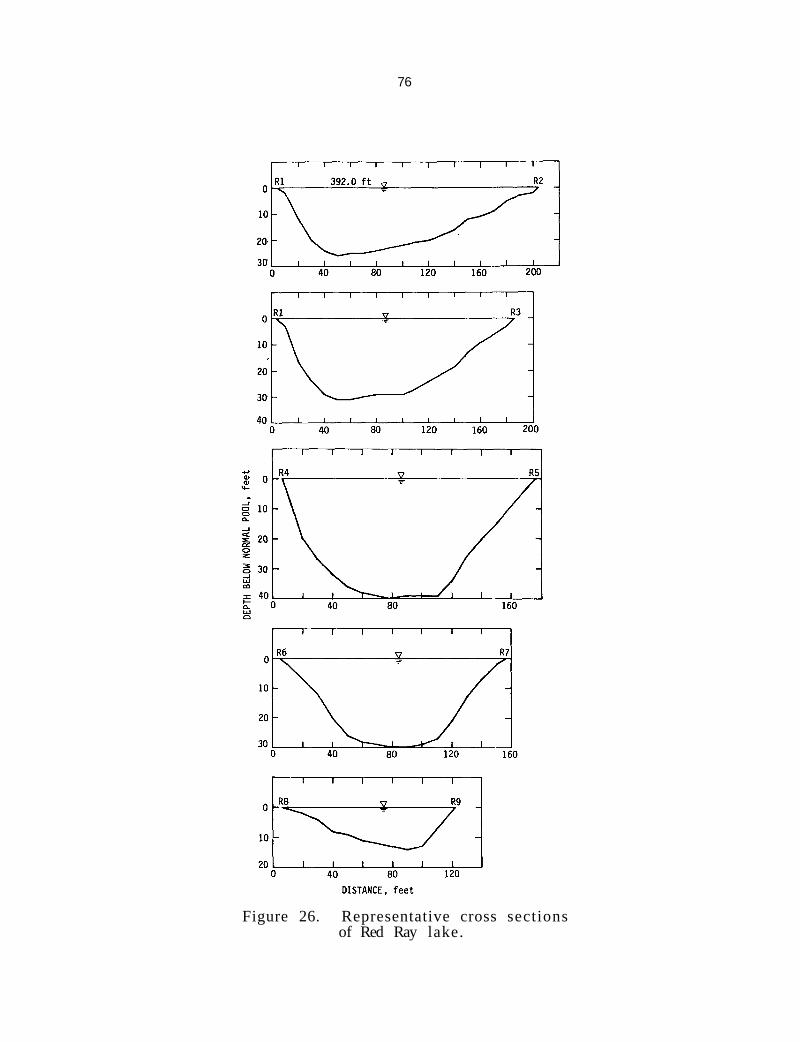
76
Figure 26. Representative cross sections of Red Ray lake.
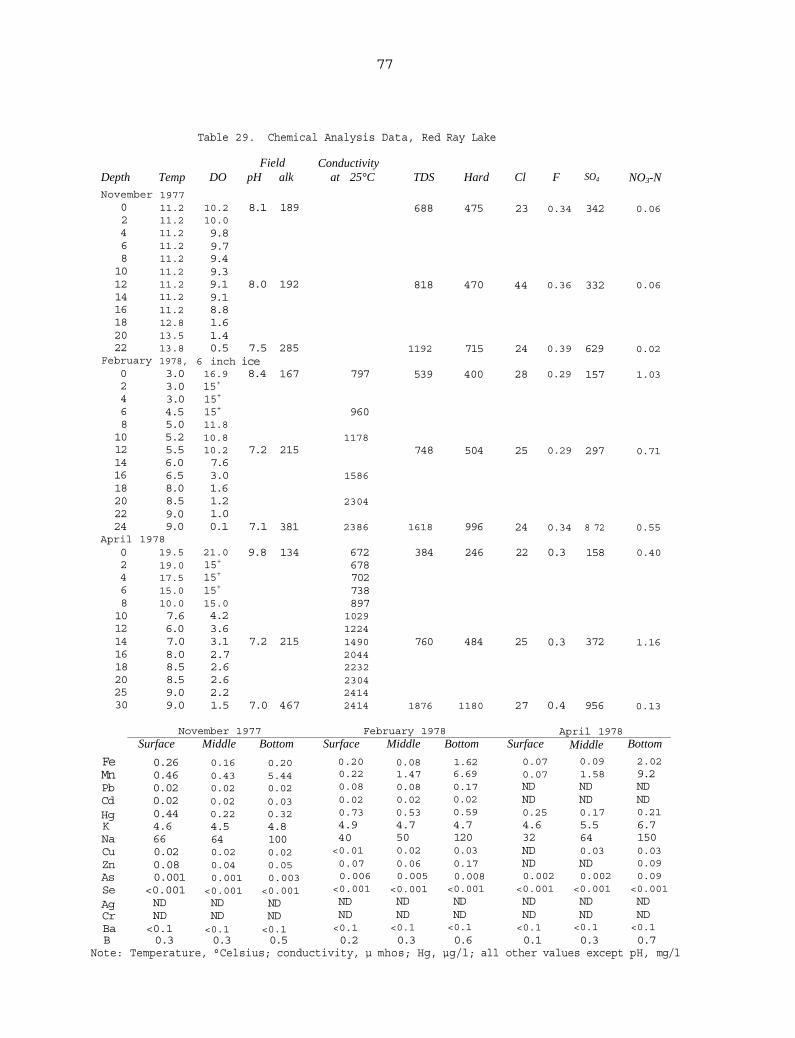
77
Table 29. Chemical Analysis Data, Red Ray Lake
Field Conductivity Depth Temp DO pH alk at 25°C TDS Hard Cl F SO4 NO3-N November 1977
0 11.2 10.2 8.1 189 688 475 23 0.34 342 0.06 2 11.2 10.0 4 11.2 9.8 6 11.2 9.7 8 11.2 9.4 10 11.2 9.3 12 11.2 9.1 8.0 192 818 470 44 0.36 332 0.06 14 11.2 9.1 16 11.2 8.8 18 12.8 1.6 20 13.5 1.4 22 13.8 0.5 7.5 285 1192 715 24 0.39 629 0.02
February 1978, 6 inch ice 0 3.0 16.9 8.4 167 797 539 400 28 0.29 157 1.03 2 3.0 15+
4 3.0 15+
6 4.5 15+ 960 8 5.0 11.8 10 5.2 10.8 1178 12 5.5 10.2 7.2 215 748 504 25 0.29 297 0.71 14 6.0 7.6 16 6.5 3.0 1586 18 8.0 1.6 20 8.5 1.2 2304 22 9.0 1.0 24 9.0 0.1 7.1 381 2386 1618 996 24 0.34 8 72 0.55
April 1978 0 19.5 21.0 9.8 134 672 384 246 22 0.3 158 0.40 2 19.0 15+ 678 4 17.5 15+ 702 6 15.0 15+ 738 8 10.0 15.0 897 10 7.6 4.2 1029 12 6.0 3.6 1224 14 7.0 3.1 7.2 215 1490 760 484 25 0.3 372 1.16 16 8.0 2.7 2044 18 8.5 2.6 2232 20 8.5 2.6 2304 25 9.0 2.2 2414 30 9.0 1.5 7.0 467 2414 1876 1180 27 0.4 956 0.13
November 1977 February 1978 April 1978 Surface Middle Bottom Surface Middle Bottom Surface Middle Bottom
Fe 0.26 0.16 0.20 0.20 0.08 1.62 0.07 0.09 2.02 Mn 0.46 0.43 5.44 0.22 1.47 6.69 0.07 1.58 9.2 Pb 0.02 0.02 0.02 0.08 0.08 0.17 ND ND ND Cd 0.02 0.02 0.03 0.02 0.02 0.02 ND ND ND Hg 0.44 0.22 0.32 0.73 0.53 0.59 0.25 0.17 0.21 K 4.6 4.5 4.8 4.9 4.7 4.7 4.6 5.5 6.7 Na 66 64 100 40 50 120 32 64 150 Cu 0.02 0.02 0.02 <0.01 0.02 0.03 ND 0.03 0.03 Zn 0.08 0.04 0.05 0.07 0.06 0.17 ND ND 0.09 As 0.001 0.001 0.003 0.006 0.005 0.008 0.002 0.002 0.09 Se <0.001 <0.001 <0.001 <0.001 <0.001 <0.001 <0.001 <0.001 <0.001
Ag ND ND ND ND ND ND ND ND ND Cr ND ND ND ND ND ND ND ND ND Ba <0.1 <0.1 <0.1 <0.1 <0.1 <0.1 <0.1 <0.1 <0.1 B 0.3 0.3 0.5 0.2 0.3 0.6 0.1 0.3 0.7
Note: Temperature, °Celsius; conductivity, µ mhos; Hg, µg/l; all other values except pH, mg/l
78
8 -- Seminole Lake
Seminole lake is located in Section 2, T3S, R7W, St. Clair County.
The lake and surrounding property is owned by Peabody Coal Company who
opened the mine in October 1950 and closed it in March 1954. The Herrin
(No. 6) coal was mined with a 5480 Marion 20 cubic yard shovel and 7800
Marion 30 cubic yard dragline. The coal was overlain by 50 to 75 feet of
overburden of which only 20 to 30 feet was glacial materials. The rock
overburden consisted of black slaty shale overlain by interbedded gray
shale, clay, and limestone beds (14).
The general shape of the lake and locations of range lines where depth
measurements were taken are shown in figure 27. The area and volume of the
lake at elevation 416 feet above mean sea level are 7.81 acres and 97 acre-
feet, respectively. Stage-volume and stage-area curves for the lake are
presented in figure 28. The maximum measured and calculated average depths
are 23 and 12.4 feet, respectively. Representative cross sections illus
trating the general lake profile are shown in figure 29.
The watershed of this lake is contained within ½ mile of the lake and
covers about 77 acres. Approximately 50 percent is spoil material and is
grown up in shrubs and small trees. The remainder is cultivated farm land.
A curve number (CN) value of 70 was selected for simulated runoff calcula
tions. Precipitation data from Sparta were used for the 20 years simula
tion.
On the basis of the calculated net runoff values and a groundwater
contribution of 0.036 gpm/ft x 2700 feet (the combined total length of the
lake) the estimated yields presented in table 30 were determined.
Chemical analysis data for water samples collected November 1977 and
February and April 1978 are presented in table 31.
Table 30. Estimated Yield Potential of Seminole Lake
Yield 1.1
(mgd) for given 2
recurrence interval (yr) 5 10
Net sur face y i e l d Groundwater c o n t r i b u t i o n
0.04 0.14
0.08 0.14
0.11 0.12 0.14 0.14
Total 0.18 0.22 0.25 0.26
79
Figure 27. Seminole lake range line locations.
Figure 28. Stage-volume, stage-area curves for Seminole lake.
80
Figure 29. Representative cross sections of Seminole lake.
81
Table 31. Chemical Analysis Data, Seminole Lake
Field Conductivity Depth Temp DO pH alk at 25°C TDS Hard Cl F SO4 NO3-N November 1977
0 12.0 10.1 8.2 139 1746 1175 5 0.42 1297 0.02 2 12.0 10.1 4 12.0 10.2 6 12.0 10.2 8 12.0 10.2 10 12.0 10.2 8.2 139 1820 1190 4 0.43 1294 0.02 12 12.0 10.2 14 12.0 10.2 16 12.0 10.2 18 12.0 10.0 20 12.2 1.2 8.2 136 1832 1140 3 0.43 1280 0.04
February 1978, 6 inch ice 0 0.2 15.8 8.1 164 2196 1833 1240 4 0.42 1370 0.12 2 0.5 15+ 2172 4 4.0 15+ 2268 6 5.2 15+ 2355 8 5.5 15.0 2325 10 5.5 12.5 7.8 177 2325 2021 1370 6 0.36 1506 0.24 12 5.5 12.0 2356 , 14 5.5 8.8 2356 16 6.0 5.2 2479 18 7.0 3.1 7.3 210 2533 2158 1420 5 0.37 1596 0.21
April 1978 0 15.0 8.3 8.1 66 544 333 212 2 0.4 187 0.27 2 15.0 8.3 544 4 7.5 8.4 2822 6 5.0 2732 8 4.5 2752 10 4.0 11.8 7.4 237 2786 2148 1445 6 0.4 1327 0.27 12 4.0 2786 14 4.0 2786 16 4.0 3013 18 4.0 10.1 7.3 247 3175 2234 1500 6 0.4 1377 0.26
November 1977 February 1978 April 1978 Surface Middle Bottom Surface Middle Bottom Surface Middle Bottom
Fe 0.15 0.15 0.22 0.03 0.05 0.20 0.29 0.29 0.47 Mn 0.27 0.24 0.21 0.06 0.08 0.42 0.13 0.92 1.60 Pb 0.08 0.08 0.08 0.14 0.14 0.13 ND ND ND Cd 0.03 0.03 0.03 0.02 0.02 0.03 ND ND ND Hg 0.85 0.56 0.44 0.41 0.45 0.67 0.03 0.14 0.20 K 4.2 4.2 4.1 4.4 4.2 4.3 1.8 5.6 5.8 Na 80 80 80 65 65 70 19 83 85 Cu 0.01 0.02 0.02 <0.01 0.02 0.02 ND 0.01 0.02 Zn 0.04 0.06 0.05 0.02 0.07 0.08 ND 0.03 0.06 As 0.001 0.001 0.001 <0.002 <0.002 0.003 0.001 0.001 0.001 Se <0.001 <0.001 <0.001 <0.001 <0.001 <0.001 <0.001 <0.001 <0.001 Ag ND ND ND ND ND ND ND ND ND Cr ND ND ND ND ND ND ND ND ND Ba <0.1 <0.1 <0.1 <0.1 <0.1 <0.1 <0.1 <0.1 <0.1 B 0.3 0.3 0.3 0.3 0.3 0.3 0.1 0.3 0.4
Note: Temperature, °Celsius; conductivity, µ mhos; Hg, µg/l; all other values except pH, mg/l
82
9 -- River King No. 6 Lake
River King No. 6 is located in Section 28, T3S, R6W, St. Clair County.
The lake and surrounding property is owned by Peabody Coal Company who
opened the mine in January 1967 and closed it in December 1970. The Herrin
(No. 6) coal was mined with a 3850B 140 cubic yard shovel. The coal was
overlain by 50 to 75 feet of overburden of which about 20 to 25 feet was
glacial clays and tills. The rock overburden consisted of black slaty
shale overlain by interbedded gray shale, clay, and limestone beds (14).
The general shape of the lake and locations of range lines where depth
measurements were taken are shown in figure 30. The area and volume of the
lake at elevation 429 feet above mean sea level are 30.72 acres and 620
acre-feet, respectively. Stage-volume and stage-area curves for the lake
are presented in figure 31. The maximum measured and calculated average
depths are 55 and 20.2 feet, respectively. Representative cross sections
illustrating the general lake profile are shown in figure 32.
The watershed of this lake covers approximately 258 acres of which
about 90 percent is strip mine land covered with grass and small trees.
The remaining 10 percent is cultivated farm land. The relatively poor
drainage characteristics of the spoil materials as compared with those at
Middle Grove were assumed to offset the increased drainage from the small
agricultural portion of the watershed. A curve number (CN) value of 60
was selected for simulated runoff calculations. Precipitation data from
Sparta were used for the 20 years of interest.
On the basis of the calculated net runoff values and a groundwater
contribution of 0.036 gpm/ft x 4100 ft (the approximate combined length of
the various lake sections), the yields presented in table 32 were deter
mined.
Chemical analysis data for water samples collected December 1977 and
February and April 1978 are presented in table 33.
Table 32. Estimated Yield Potential of River King No. 6 Lake
Yield 1.1
(mgd) for given 2
recurrence interval (yr) 5 10
Net surface yield Groundwater contribution
0.06 0.21
0.17 0.21
0.25 0.29 0.21 0.21
Total 0.27 0.38 0.46 0.50
83
Figure 30. River King No. 6 lake range line locations.
84
Figure 31. Stage-volume, stage-area curves for River King No. 6 lake.
85
Figure 32. Representative cross sections of River King No. 6 lake.
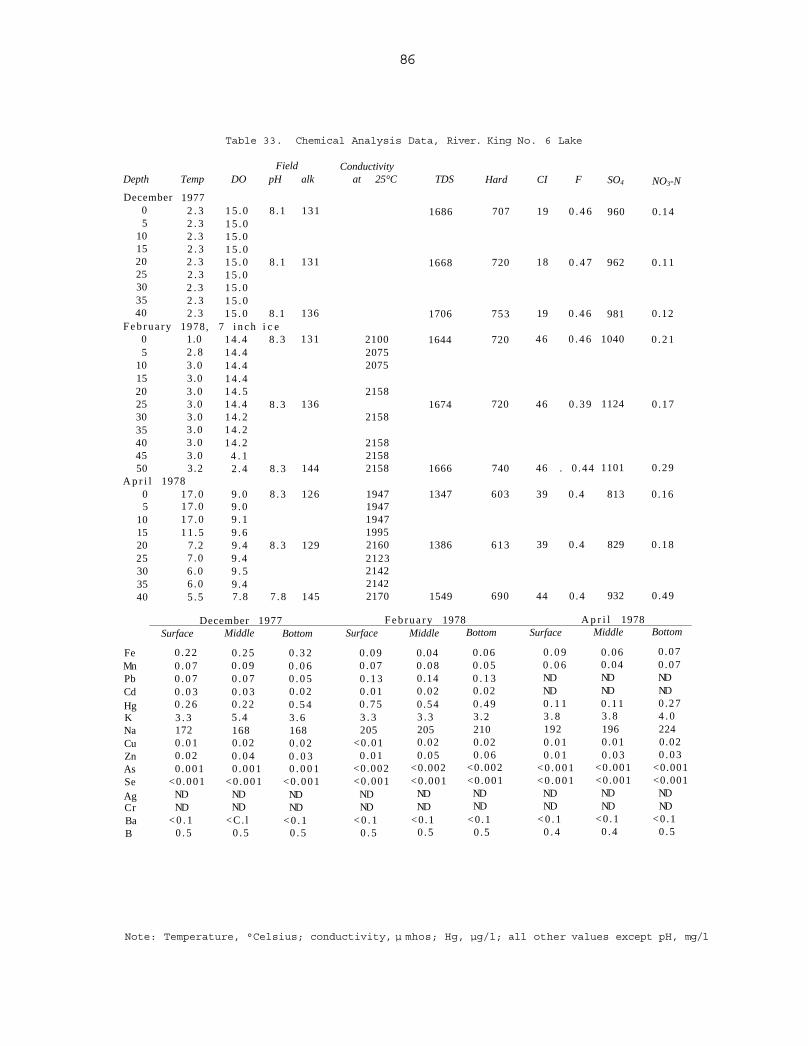
86
Table 33. Chemical Analysis Data, River. King No. 6 Lake
Field Conductivity Depth Temp DO pH alk at 25°C TDS Hard CI F SO4 NO3-N December 1977
0 2 . 3 1 5 . 0 8 . 1 131 1686 707 19 0 . 4 6 960 0 .14 5 2 . 3 1 5 . 0
10 2 . 3 1 5 . 0 15 2 . 3 1 5 . 0 20 2 . 3 1 5 . 0 8 . 1 131 1668 720 18 0 . 4 7 962 0 .11 25 2 . 3 1 5 . 0 30 2 . 3 1 5 . 0 35 2 . 3 1 5 . 0 40 2 . 3 1 5 . 0 8 .1 136 1706 753 19 0 . 4 6 981 0.12
F e b r u a r y 1978, 7 i n c h i c e 0 1.0 1 4 . 4 8 . 3 131 2100 1644 720 46 0 . 4 6 1040 0 . 2 1 5 2 . 8 1 4 . 4 2075
10 3 .0 1 4 . 4 2075 15 3 .0 1 4 . 4 20 3 .0 1 4 . 5 2158 25 3 .0 1 4 . 4 8 . 3 136 1674 720 46 0 . 3 9 1124 0 .17 30 3 .0 1 4 . 2 2158 35 3 .0 1 4 . 2 40 3 .0 1 4 . 2 2158 45 3 .0 4 . 1 2158 50 3 .2 2 . 4 8 . 3 144 2158 1666 740 46 . 0 .44 1101 0 .29
A p r i l 1978 0 1 7 . 0 9 . 0 8 . 3 126 1947 1347 603 39 0 .4 813 0 .16 5 17 .0 9 . 0 1947
10 1 7 . 0 9 . 1 1947 15 1 1 . 5 9 . 6 1995 20 7.2 9 .4 8 . 3 129 2160 1386 613 39 0 .4 829 0 .18 25 7 .0 9 .4 2123 30 6 . 0 9 . 5 2142 35 6 .0 9 .4 2142 40 5 . 5 7 .8 7 .8 145 2170 1549 690 44 0 .4 932 0 .49
December 1977 F e b r u a r y 1978 A p r i l 1978 Surface Middle Bottom Surface Middle Bottom Surface Middle Bottom
Fe 0 .22 0 . 2 5 0 . 3 2 0 .09 0.04 0 .06 0 . 0 9 0 .06 0 .07 Mn 0 . 0 7 0 . 0 9 0 . 0 6 0 . 0 7 0 . 0 8 0 . 0 5 0 . 0 6 0 .04 0 .07 Pb 0 . 0 7 0 . 0 7 0 . 0 5 0 . 1 3 0.14 0 . 1 3 ND ND ND Cd 0 . 0 3 0 . 0 3 0 .02 0 . 0 1 0 .02 0 .02 ND ND ND Hg 0 . 2 6 0 .22 0 . 5 4 0 . 7 5 0 .54 0 . 4 9 0 . 1 1 0 . 1 1 0 .27 K 3 . 3 5 .4 3 . 6 3 . 3 3 . 3 3 .2 3 . 8 3 . 8 4 . 0 Na 172 168 168 205 205 210 192 196 224 Cu 0 . 0 1 0 .02 0 . 0 2 <0 .01 0.02 0 .02 0 . 0 1 0 .01 0.02 Zn 0 .02 0 . 0 4 0 . 0 3 0 . 0 1 0 .05 0 . 0 6 0 . 0 1 0 . 0 3 0 . 0 3 As 0 .001 0 . 0 0 1 0 . 0 0 1 <0.002 <0.002 <0.002 < 0 . 0 0 1 <0 .001 <0.001 Se <0 .001 <0 .001 < 0 . 0 0 1 <0 .001 <0 .001 <0 .001 < 0 . 0 0 1 <0.001 <0.001 Ag ND ND ND ND ND ND ND ND ND Cr ND ND ND ND ND ND ND ND ND Ba < 0 . 1 <C. l < 0 . 1 < 0 . 1 <0 .1 <0 .1 < 0 . 1 <0 .1 <0 .1 B 0 . 5 0 . 5 0 . 5 0 . 5 0 .5 0 .5 0 . 4 0 . 4 0 . 5
Note: Temperature, °Celsius; conductivity, µ mhos; Hg, µg/l; all other values except pH, mg/l
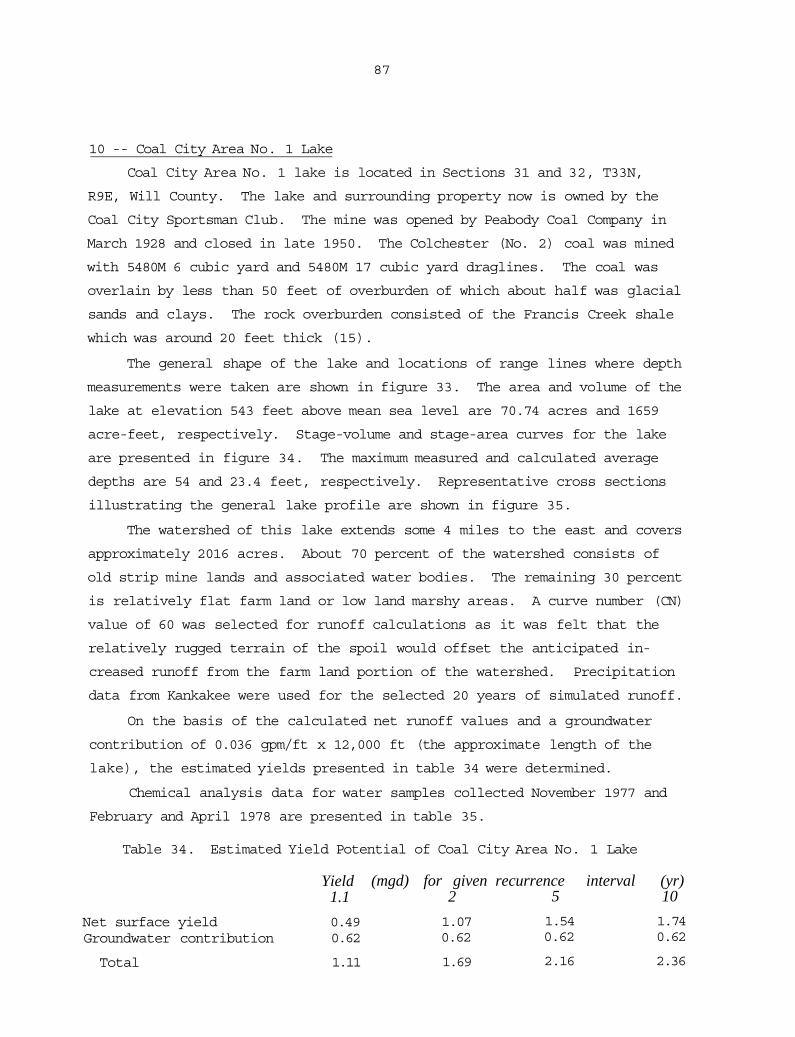
87
10 -- Coal City Area No. 1 Lake
Coal City Area No. 1 lake is located in Sections 31 and 32, T33N,
R9E, Will County. The lake and surrounding property now is owned by the
Coal City Sportsman Club. The mine was opened by Peabody Coal Company in
March 1928 and closed in late 1950. The Colchester (No. 2) coal was mined
with 5480M 6 cubic yard and 5480M 17 cubic yard draglines. The coal was
overlain by less than 50 feet of overburden of which about half was glacial
sands and clays. The rock overburden consisted of the Francis Creek shale
which was around 20 feet thick (15).
The general shape of the lake and locations of range lines where depth
measurements were taken are shown in figure 33. The area and volume of the
lake at elevation 543 feet above mean sea level are 70.74 acres and 1659
acre-feet, respectively. Stage-volume and stage-area curves for the lake
are presented in figure 34. The maximum measured and calculated average
depths are 54 and 23.4 feet, respectively. Representative cross sections
illustrating the general lake profile are shown in figure 35.
The watershed of this lake extends some 4 miles to the east and covers
approximately 2016 acres. About 70 percent of the watershed consists of
old strip mine lands and associated water bodies. The remaining 30 percent
is relatively flat farm land or low land marshy areas. A curve number (CN)
value of 60 was selected for runoff calculations as it was felt that the
relatively rugged terrain of the spoil would offset the anticipated in
creased runoff from the farm land portion of the watershed. Precipitation
data from Kankakee were used for the selected 20 years of simulated runoff.
On the basis of the calculated net runoff values and a groundwater
contribution of 0.036 gpm/ft x 12,000 ft (the approximate length of the
lake), the estimated yields presented in table 34 were determined.
Chemical analysis data for water samples collected November 1977 and
February and April 1978 are presented in table 35.
Table 34. Estimated Yield Potential of Coal City Area No. 1 Lake
Yield 1.1
(mgd) for given 2
recurrence interval (yr) 5 10
Net surface yield Groundwater contribution
0.49 0.62
1.07 0.62
1.54 1.74 0.62 0.62
Total 1.11 1.69 2.16 2.36
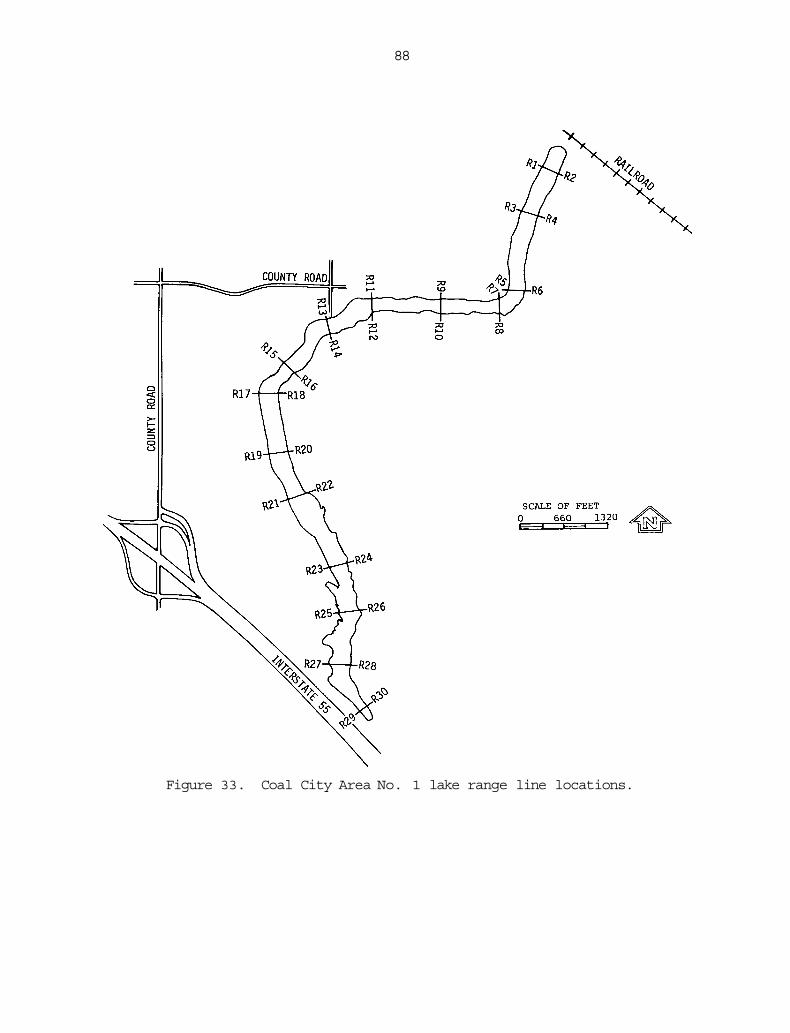
88
Figure 33. Coal City Area No. 1 lake range line locations.
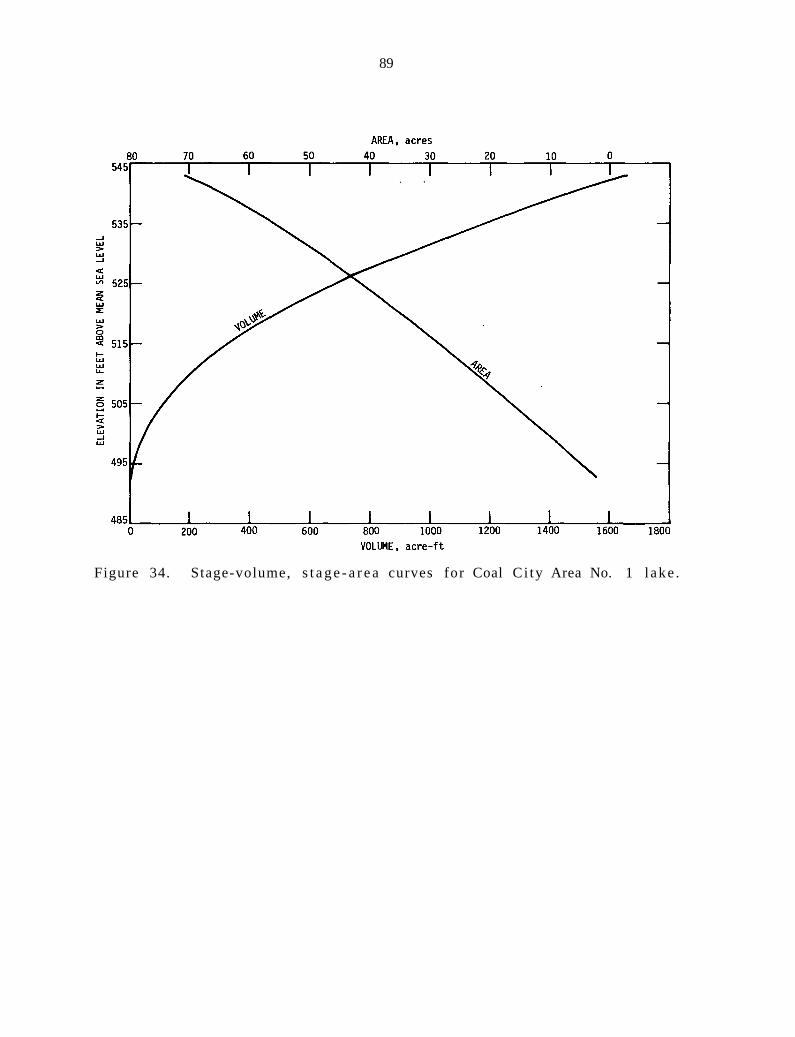
89
Figure 34. Stage-volume, s t a g e - a r e a curves for Coal C i ty Area No. 1 l ake .
90
Figure 35. Representative cross sections of Coal City Area No. 1 lake.
91
Table 35. Chemical Analysis Data, Coal City Area No. 1 Lake
Field Conductivity Depth Temp DO pH alk at 25°C TDS Hard Cl F SO4 NO3-N
November 1977, 1 inch i c e 0 4 . 0 12.2 8 . 2 177 1208 733 16 0.15 577 0.21 2 4 . 2 12.1 4 4 . 5 12.0 6 4 . 8 11.8 8 . 2 177 1036 760 16 0.17 638 0.23 8 5 . 0 11.6
10 5 . 0 11.4 12 5 . 0 11.3 8 . 2 177 1078 773 16 0.16 615 0.26
February 1978, 10 inch i c e 0 0 . 5 15.7 8 . 4 174 1638 848 656 17 0.27 536 0.28 2 0 . 8 15.8 1663 4 2 . 0 15.4 1700 6 2 . 8 14.8 8 .2 197 1826 920 684 20 0.27 575 0.34 8 3 .2 13.2 1909
10 3 . 8 11.8 1863 12 4 . 0 10.8 1912 13 4 . 2 9 . 6 7 . 9 212 1944 1075 770 18 0.27 692 0.31
April 1978 0 12.5 9 . 6 8 . 1 172 1365 877 648 18 0.20 473 0.49 2 12.2 9 . 7 1386 4 11.8 9 . 7 1353 6 11.2 9 . 7 1357 8 10.5 9 . 7 8 . 1 172 1367 876 648 17 0.20 477 0.51
10 10.0 9 . 7 1380 12 9 . 9 9 . 7 1380 14 9 . 9 9 . 6 8 . 0 177 1380 882 653 18 0.20 478 0.47
November 1977 February 1978 April 1978 Surface Middle Bottom Surface Middle Bottom Surface Middle Bottom
Fe 0.16 0.41 0.31 0.01 0.04 0.40 0.08 0.11 0.09 Mn 0.09 0.08 0.09 0.02 0.05 0.26 0.05 0.06 0.06 Pb 0.04 0.05 0.05 0.14 0.13 0.14 ND ND ND Cd 0.03 0.03 0.03 0.02 0.02 0.02 ND ND ND Hg 0.53 0.40 0.29 0.25 0.32 0.41 0.11 0.09 0.56 K 5 . 2 5 . 5 5 . 5 4 . 2 4 . 3 5 . 0 5 .4 5 .4 5 . 5 Na 60 30 36 26 27 40 25 26 26 Cu 0.01 0.03 0.02 <0.01 0.02 0.02 0.01 0.02 0.02 Zn 0.02 0.05 0.05 0.01 0.08 0.07 ND 0.05 0.04 As 0.001 0.001 0.001 <0.002 <0.002 <0.002 0.001 <0.001 <0.001 Se <0.001 <0.001 <0.001 <0.001 <0.001 <0.001 <0.001 <0.001 <0.001 Ag ND ND ND ND ND ND ND ND ND Cr ND ND ND ND ND ND ND ND ND Ba <0.1 <0 .1 <0.1 <0.1 <0 .1 <0.1 <0.1 <0.1 <0 .1 B 0 . 3 0 . 3 0 .4 0 . 3 0 . 3 0 .4 0 . 3 0 . 3 0 . 3
Note: Temperature, °Celsius; conductivity, µ mhos; Hg, µg/l; all other values except pH, mg/l
92
11 -- Clear Lake
Clear Lake is located in Section 5, T31N, R9E, Kankakee County. The
lake and surrounding property now is owned by the South Wilmington Sports
man Club. The mine was opened by Peabody Coal Company in September 1950
and closed in July 1963. The Colchester (No. 2) coal was mined with a
Page 10 cubic yard dragline. The coal was overlain by less than 50 feet
of overburden of which 20 to 30 feet was sand and sandy clay. The rock
overburden consisted of the Francis Creek shale (15).
The general shape of the lake and locations of range lines where depth
measurements were taken are shown in figure 36. The area and volume of the
lake at elevation 590 feet above mean sea level are 15.37 acres and 473
acre-feet, respectively. Stage-volume and stage-area curves for the lake
are presented in figure 37. The maximum measured and calculated average
depths are 53 and 30.8 feet, respectively. Representative cross sections
illustrating the general lake profile are shown in figure 38.
The watershed of this lake is extremely limited to the immediate area.
It covers some 32 acres of which about 1/3 is strip mine spoil. The re
maining 20 acres is farm land and park area covered with pine trees. A
curve number (CN) value of 70 was selected for runoff calculations because
of the high percentage of farm land in the watershed. Precipitation data
from Kankakee were used for the selected 20 years of simulated runoff.
On the basis of the calculated net runoff values and a groundwater
contribution of 0.036 gpm/ft x 2250 ft (the approximate length of the lake),
the estimated yields presented in table 36 were determined.
Chemical analysis data for water samples collected November 1977 and
February and April 1978 are presented in table 37.
Table 36. Estimated Yield Potential of Clear Lake
Yield 1.1
(mgd) for given 2
recurrence interval (yr) 5 10
Net surface yield Groundwater contribution
0.01 0.12
0.03 0.12
0.04 0.05 0.12 0.12
Total 0.13 0.15 0.16 0.17
93
Figure 36. Clear lake range lines.
Figure 37. Stage-volume, stage-area curves for Clear lake.
94
Figure 38. Representative cross sections of Clear lake.
95
Table 37. Chemical Analysis Data, Clear Lake
Field Conductivity Depth Temp DO pH alk at 25°C TDS Hard CI F SO4 NO3-N
November 1977 0 5 . 5 1 2 . 2 8 . 3 114 424 327 3 0 . 1 9 188 0.15 5 5 . 5 1 2 . 0
10 5 . 5 1 1 . 5 15 5 . 5 1 1 . 4 20 5 . 5 1 0 . 8 25 5 . 5 9 . 8 8 . 3 114 462 387 2 0 . 1 9 186 0.13 30 5 . 5 9 . 6 35 5 . 5 9 . 6 40 5 . 5 9 . 5 45 5 . 5 9 . 4 50 5 . 5 8 . 7 8 . 3 116 436 380 3 0 . 1 9 185 0.17
February 1 9 7 8 , 6 i n c h i c e 0 0 . 0 9 . 8 8 . 1 114 567 316 288 4 . 9 0 . 2 4 134 0.29 5 2 . 0 1 3 . 7 680
10 2 . 2 1 4 . 2 688 15 2 . 8 1 3 . 8 681 20 3 . 0 1 3 . 8 681 25 3 . 0 1 3 . 8 8 .4 121 689 440 350 3 .9 0 . 2 4 242 0.14 30 3 . 2 1 3 . 6 689 35 3 . 8 1 2 . 4 697 40 4 . 0 1 1 . 3 712 42 4 . 2 1 0 . 0 8 . 3 126 721 447 370 3 .9 0 . 2 2 234 0.15
April 1978 0 1 1 . 8 9 . 9 8 .4 90 601 380 300 3 0 . 2 198 0.31 5 1 1 . 5 9 . 9 612
10 1 1 . 5 1 0 . 0 612 15 1 0 . 2 9 . 9 635 20 7 . 2 1 0 . 0 656 25 6 . 0 1 0 . 2 8 .0 120 681 431 340 3 0 . 2 224 0.27 30 6 . 0 1 0 . 3 689 35 5 . 5 1 0 . 4 713 40 5 . 5 9 . 6 716 45 5 . 5 9 . 2 729 50 5 . 5 6 . 2 7 . 8 120 767 458 358 3 0 . 2 233 0.36
November 1977 February 1978 April 1978 Surface Middle Bottom Surface Middle Bottom Surface Middle Bottom
Fe 0.15 0.19 0.44 0.05 0.02 <0.01 0.15 0.07 0.08 Mn 0.03 0.02 0.03 0.06 0.02 0.02 0.03 0.02 0.02 Pb 0.05 0.05 0.04 0.07 0.11 0.11 ND ND ND Cd ND ND <0.01 0.01 0.01 0.01 ND ND ND Hg 0.82 0.88 0.75 0.12 0.18 0.16 0.10 0.16 0.11 K 2 . 8 2 . 8 2 . 7 2 . 0 2 . 8 2 . 7 3 3 . 3 3 . 3 Na 10 10 8 11 12 13 9 11 12 Cu <0.01 0.02 0.02 <0.01 0.02 0.01 ND 0.02 0.01 Zn 0.02 0.06 0.05 <0.01 0.03 0.01 ND 0.02 0.02 As <0.001 <0.001 0.001 <0.002 <0.002 <0.002 <0.001 <0.001 <0.001 Se <0.001 <0.001 <0.001 <0.001 <0.001 <0.001 <0.001 <0.001 <0.001 Ag ND ND ND ND ND ND ND ND ND Cr ND ND ND ND ND ND ND ND ND Ba <0.1 <0.1 <0.1 <0.1 <0.1 <0.1 <0.1 <0.1 <0.1 B 0 . 1 0 . 1 0 . 1 0 . 1 0 . 1 0 . 1 0 .2 0 .2 0 .2
Note: Temperature, °Celsius; conductivity, µ mhos; Hg, µg/l; all other values except pH, mg/l
96
12 -- Northern Pit No. 14
Northern Pit No. 14 is located in Section 13, T31N, R8E, Grundy County.
The lake and surrounding property are owned by Peabody Coal Company who
opened the mine in September 1969 and closed it in November 1973. The
Summum (No. 4) coal was mined with a 7800 Marion 30 cubic yard dragline.
The coal was overlain by 50 to 75 feet of overburden of which almost all
was glacial drift. These materials consisted predominately of clay and
sandy clay (15).
The general shape of the lake and locations of range lines where depth
measurements were taken are shown in figure 39. The area and volume of the
lake at 576 feet above mean sea level are 17.45 acres and 473 acre-feet,
respectively. Stage-volume and stage-area curves for the lake are present
ed in figure 40. The maximum measured and calculated average depths of the
lake are 65 and 27.1 feet, respectively. Representative cross sections
illustrating the general lake profile are shown in figure 41.
The watershed of this lake consists of about 2/3 of the total spoil
area from this mine and covers approximately 128 acres. The entire water
shed is planted in clover and grass. A curve number (CN) value of 60 was
selected for runoff calculations since this watershed is similar to that
for Middle Grove. Precipitation data from Kankakee were used for the se
lected 20 years of simulated runoff.
On the basis of the calculated net runoff values and a groundwater
contribution of 0.036 gpm/ft x 4200 ft (the approximate total length of
the various portions of the lake), the estimated yields presented in table
38 were determined.
Chemical analysis data for water samples collected December 1977 and
February and April 1978 are presented in table 39.
Table 38. Estimated Yield Potential of Northern Pit No. 14
Yield 1.1
(mgd) for given 2
recurrence interval (yr) 5 10
Net surface yield Groundwater contribution
0.03 0.22
0.07 0.22
0.11 0.12 0.22 0.22
Total 0.25 0.29 0.33 0.34
97
Figure 39. Northern Pit No. 14 and range lines.
98
Figure 40. Stage-volume, stage-area curves for Northern Pit No. 14.
99
Figure 41. Representative cross sections of Northern Pit No. 14.
100
Table 39. Chemical Analysis Data, Northern Pit No. 14
Field Conductivity Depth Temp DO pH alk at 25°C TDS Hard Cl F so4 NO3-N
November 1977 0 4.5 11.2 8.2 76 1552 1107 7 0.41 1040 0.37 5 4.5 11.6 10 4.5 11.6 15 4.5 11.6 25 4.5 11.6 30 4.5 11.3 8.1 76 1590 1113 6 0.42 1088 0.28 35 4.5 11.2 40 4.5 11.0 45 4.5 11.0 55 4.5 10.8 58 4.5 9.0 8.0 76 1600 1080 7 0.42 1077 0.36
February 1978 0 0.0 16.4 8.0 83 2700 1616 1090 8 0.44 1213 0.37 5 1.5 16.4 2666 10 1.5 16.4 2718 15 1.5 16.4 2718 20 1.5 16.4 2718 25 1.5 16.4 2752 35 1.8 16.2 8.0 83 2720 1624 1070 8 0.46 1163 0.28 40 2.0 16.1 2720 50 2.0 15.5 2754 55 2.5 14.8 2822 60 3.2 12.5 2955 65 4.0 2.4 7.0 134 4212 1998 1170 13 0.48 1334 0.36
April 1978 0 9.5 10.3 8.0 64 1750 1485 990 8 0.4 973 0.58 5 9.1 10.3 1832 10 8.9 10.3 1832 15 8.7 10.3 1832 20 8.6 10.3 1858 25 8.5 10.3 1872 35 8.5 10.3 8.0 69 1872 1479 990 7 0.4 971 0.53 40 8.4 10.3 1872 50 7.8 10.1 1898 55 6.0 10.7 1928 60 5.6 10.5 2000 65 6.1 0.5 7.7 80 4284 1519 1010 8 0.4 997 0.44
November 1977 February 1978 April 1978 Surface Middle Bottom Surface Middle Bottom Surface Middle Bottom
Fe 0.13 0.96 0.19 0.04 0.01 2.51 0.16 0.19 0.16 Mn 0.05 0.28 0.06 0.08 0.05 0.38 0.04 0.05 0.07 Pb 0.08 0.07 0.06 0.17 0.17 0.17 ND ND ND Cd 0.03 0.04 0.04 0.02 0.02 0.02 ND ND ND Hg 0.76 0.56 0.48 0.19 0.31 0.19 0.17 0.20 0.10 K 6.4 6.6 5.8 6 6 8 7.6 7.8 7.9 Na 54 54 52 62 62 120 52 53 57 Cu 0.01 0.03 0.02 0.01 0.01 0.02 0.01 0.02 0.02 Zn 0.02 0.06 0.05 0.02 0.04 0.07 ND 0.05 0.04 As <0.001 <0.001 <0.001 <0.002 <0.002 <0.002 <0.001 <0.001 <0.001 Se <0.001 <0.001 <0.001 <0.001 <0.001 <0.001 <0.001 <0.001 <0.001 Ag ND ND ND ND ND ND ND ND ND Cr ND ND ND ND ND ND ND ND ND Ba <0.1 <0.1 <0.1 <0.1 <0.1 <0.1 <0.1 <0.1 <0.1 B 0.3 0.3 0.3 0.3 0.3 0.5 0.3 0.3 0.3
Note: Temperature, °Celsius; conductivity, µ mhos; Hg, µg/l; all other values except pH, mg/l
101
REFERENCES
1. Reclamation of strip mined land in Illinois. 1972. Pages 1-16 in Illinois Blue Book 1971-1972 (J. W. Lewis, ed.). State of Illinois. 856 pp.
2. Grandt, A. F., and A. L. Lang. 1958. Reclaiming Illinois strip coal land with legumes and grasses. University of Illinois Agricultural Experiment Station Bulletin 628. 64 pp.
3. Simon, J. A., and W. H. Smith. 1968. An evaluation of Illinois coal reserve estimates. Proceedings Illinois Mining Institute 76:57-68.
4. Haynes, R. J., and W. D. Klimstra. 1975. Illinois lands surface mined for coal. Cooperative Wildlife Research Laboratory, Southern Illinois University at Carbondale. 201 pp.
5. Hamilton, David A., and John L. Wilson. 1977. A generic study of strip mining impacts on groundwater resources. Ralph M. Parsons Laboratory for Water Resources and Hydrodynamics Report No. 229.
6. Soil Conservation Service. 1972. National Engineering Handbook, Section 4, Hydrology. U. S. Department of Agriculture, Washington, D. C.
7. Roberts, W. J., and John B. Stall. 1967. Lake evaporation in Illinois. Illinois State Water Survey Report of Investigation 57.
8. Csallany, S. C., W. J. Roberts, and N. G. Towery. April 1969. Illinois P-260 State Water Resources Planning Project Progress Report, Part 1, Appendix A. In Technical Appendix to the Report on Priority and Planning Elements for Developing Illinois Water Resources, Illinois Department of Business and Economic Development, Springfield.
9. Roberts, W. J., S. C. Csallany, and N. G. Towery. 1970. Forecasting water demands and system capabilities. Proceedings, ASCE, v. 96 (SA6): 1349-1360.
10. Bureau of the Budget. 1977. Illinois population projections 1970-2025. Springfield, Illinois.
11. Illinois Environmental Protection Agency. 1972. Water pollution regulations of Illinois. Springfield, Illinois, March 7.
12. National Academy of Sciences and National Academy of Engineering. 1972. Water quality criteria 1972. Report of the Committee on Water Quality Criteria. 594 pp.
13. Smith, W. H., and D. J. Berggren. 1963. Strippable coal reserves of Illinois, Part 5A. Illinois State Geological Survey Circular 348.
14. Smith, W. H. 1958. Strippable coal reserves of Illinois, Part 2. Illinois State Geological Survey Circular 260.
15. Smith, W. H. 1968. Strippable coal reserves of Illinois, Part 6. Illinois State Geological Survey Circular 419.