Embed Size (px)
Citation preview
Reconstructing signaling and
dynamic regulatory networks
02-710
Computational Genomics
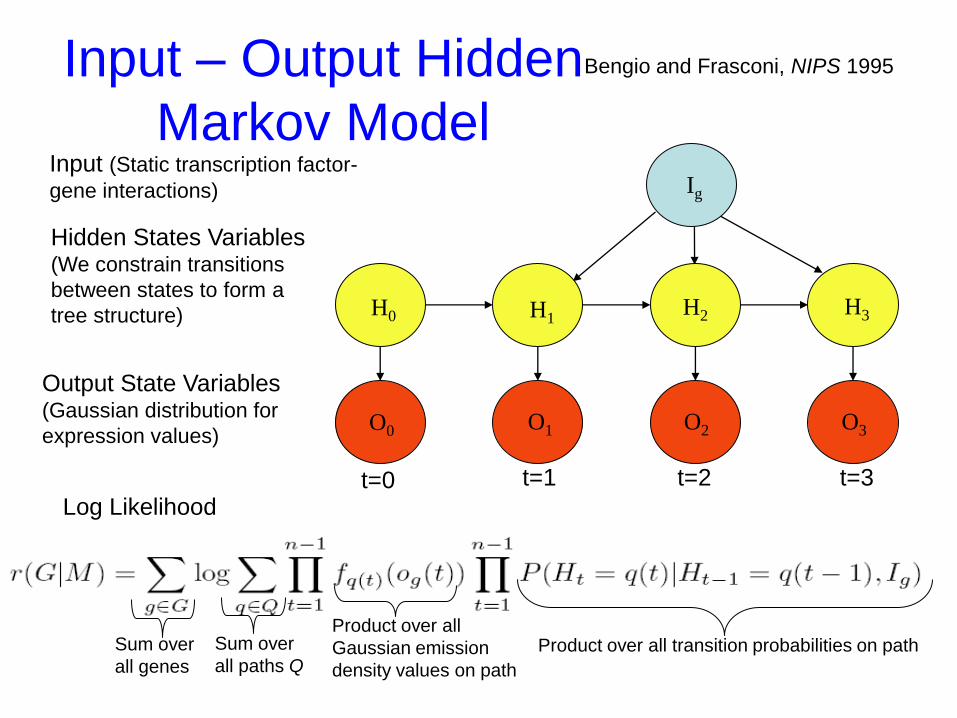
Sum over
all genes
Sum over
all paths Q
Product over all
Gaussian emission
density values on path
Product over all transition probabilities on path
Input – Output Hidden
Markov Model Input (Static transcription factor-
gene interactions)
Hidden States Variables (We constrain transitions
between states to form a
tree structure)
Output State Variables (Gaussian distribution for
expression values)
Ig
t=0 t=1 t=2 t=3
H0 H1 H2 H3
O0 O1 O2 O3
Bengio and Frasconi, NIPS 1995
Log Likelihood
1 2
3
4
5
6 7 8
9
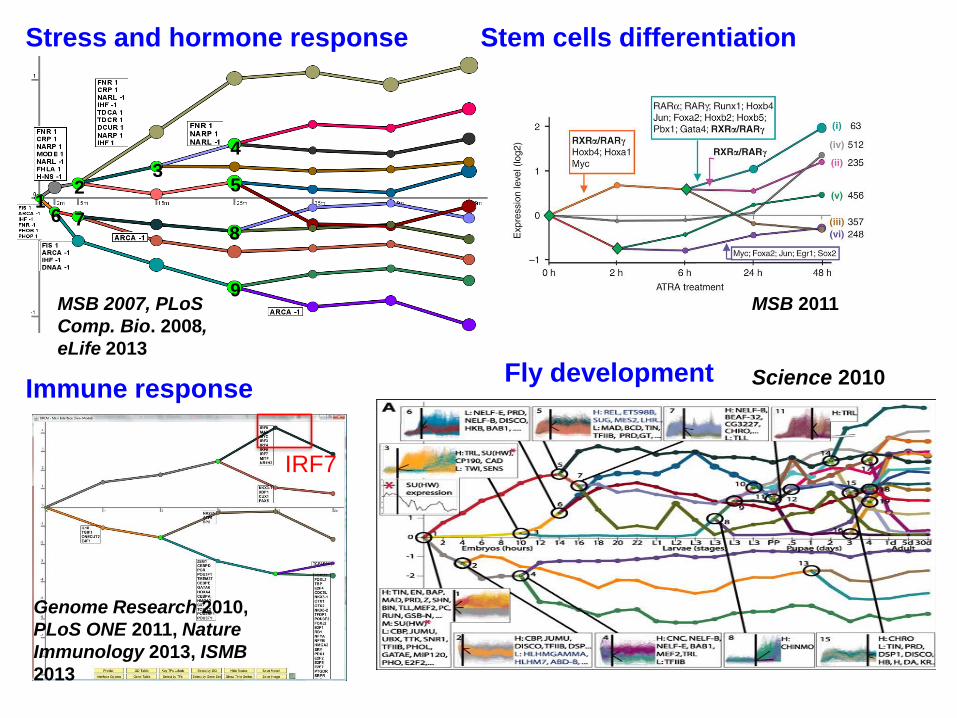
Stress and hormone response
MSB 2007, PLoS
Comp. Bio. 2008,
eLife 2013
MSB 2011
IRF7
Fly development Science 2010
Genome Research 2010,
PLoS ONE 2011, Nature
Immunology 2013, ISMB
2013
Immune response
Stem cells differentiation
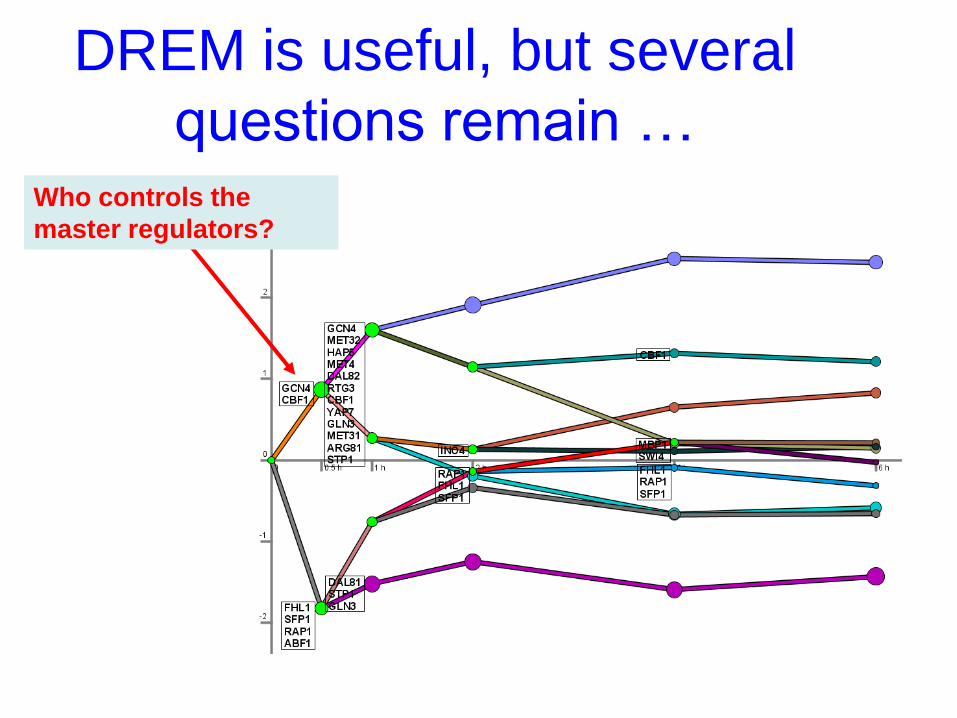
DREM is useful, but several
questions remain … Who controls the
master regulators?
Who controls the
master regulators?
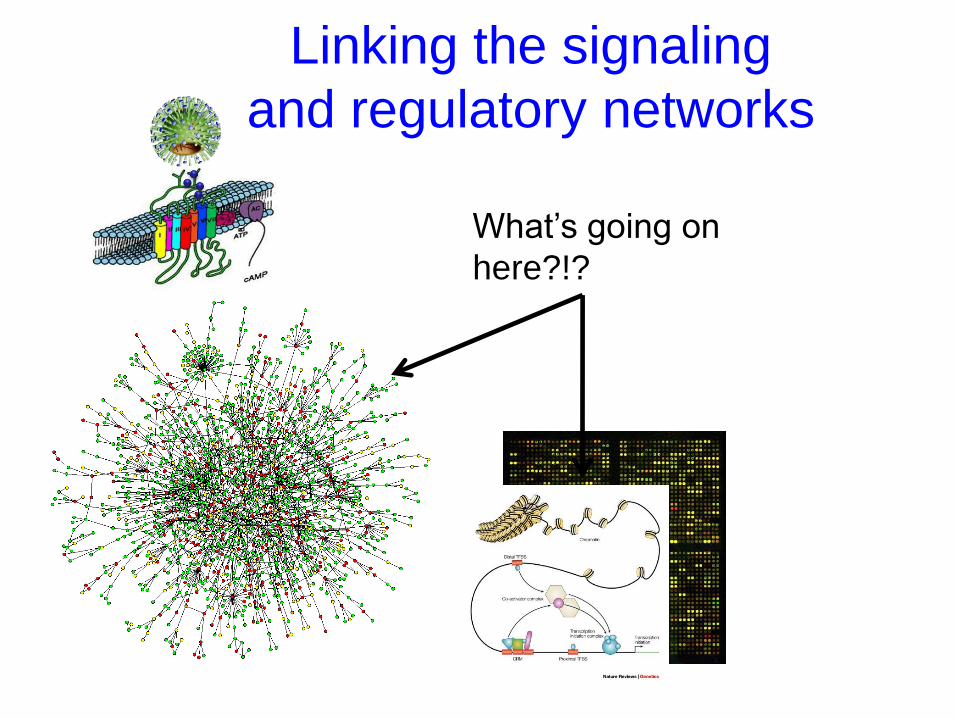
Linking the signaling
and regulatory networks
What’s going on
here?!?
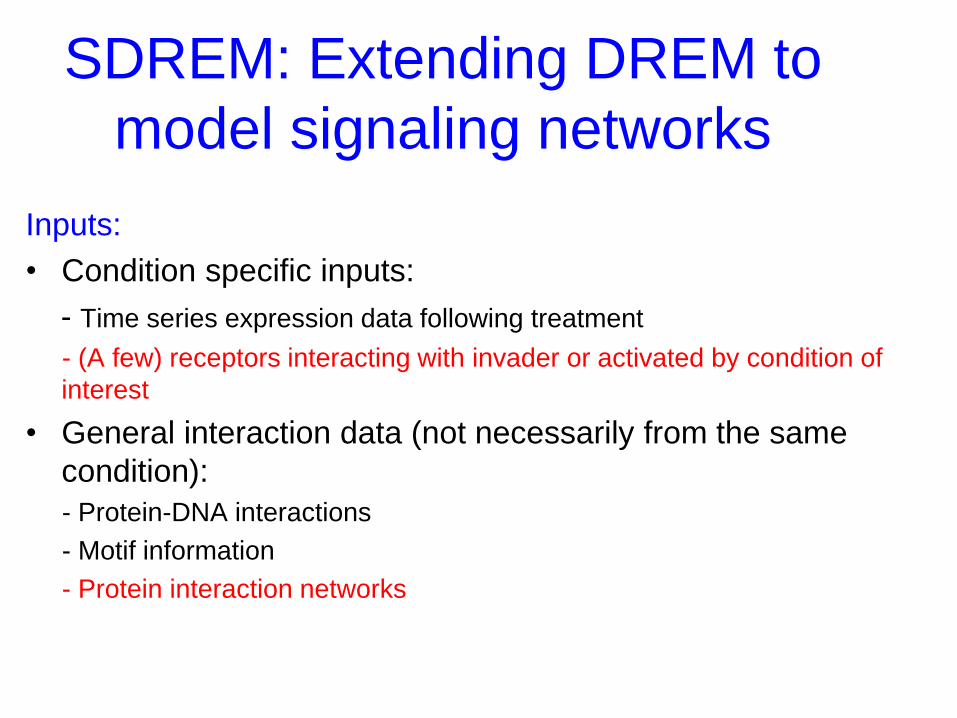
SDREM: Extending DREM to
model signaling networks
Inputs:
• Condition specific inputs:
- Time series expression data following treatment
- (A few) receptors interacting with invader or activated by condition of
interest
• General interaction data (not necessarily from the same
condition):
- Protein-DNA interactions
- Motif information
- Protein interaction networks
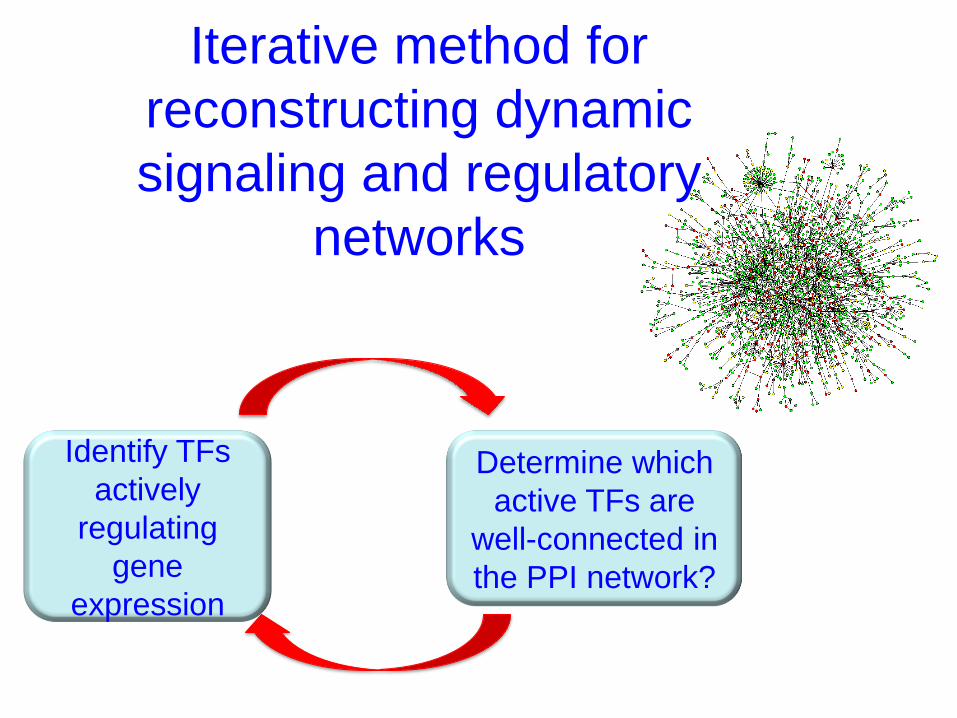
Iterative method for
reconstructing dynamic
signaling and regulatory
networks
Identify TFs
actively
regulating
gene
expression
Determine which
active TFs are
well-connected in
the PPI network?
How do we orient the network?
• We are given the receptors / sensing proteins and the TFs
• We need to determine an appropriate path from receptors to
TFs
• The orientation should
– Use short source-target pathways
– Prefer high-confidence interactions
– Encourage parallel pathways
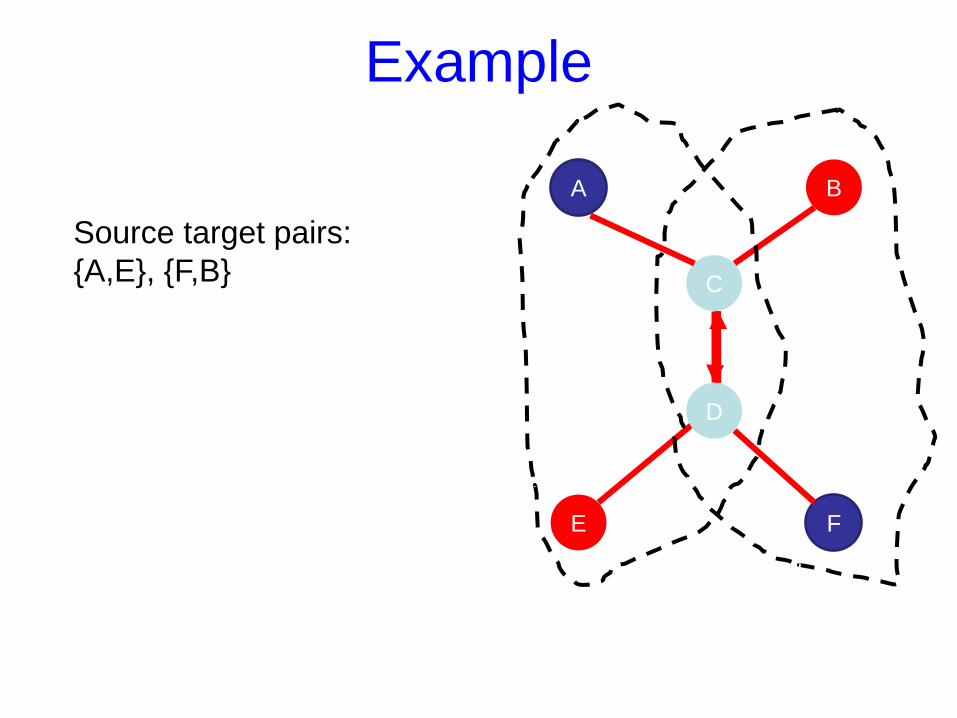
Example
A
C
F
B
D
E
Source target pairs:
{A,E}, {F,B}
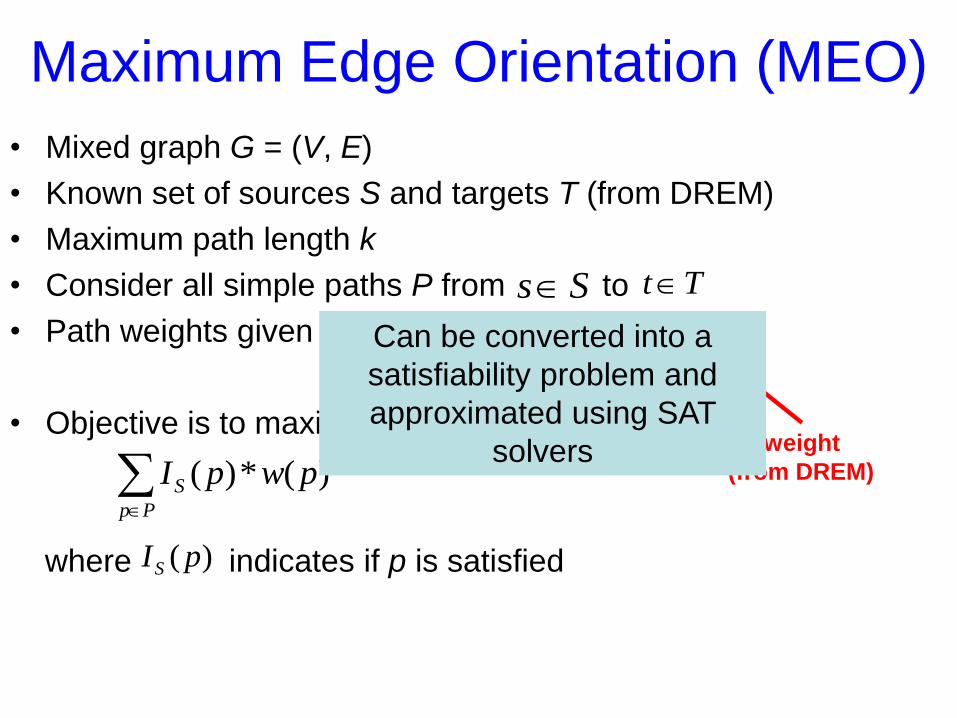
• Mixed graph G = (V, E)
• Known set of sources S and targets T (from DREM)
• Maximum path length k
• Consider all simple paths P from to
• Path weights given by
• Objective is to maximize
where indicates if p is satisfied
Maximum Edge Orientation (MEO)
ptpv
twvwpw )(*)()(
Ss Tt
Pp
S pwpI )(*)(
)( pIS
edge weight TF weight
(from DREM)
Can be converted into a
satisfiability problem and
approximated using SAT
solvers
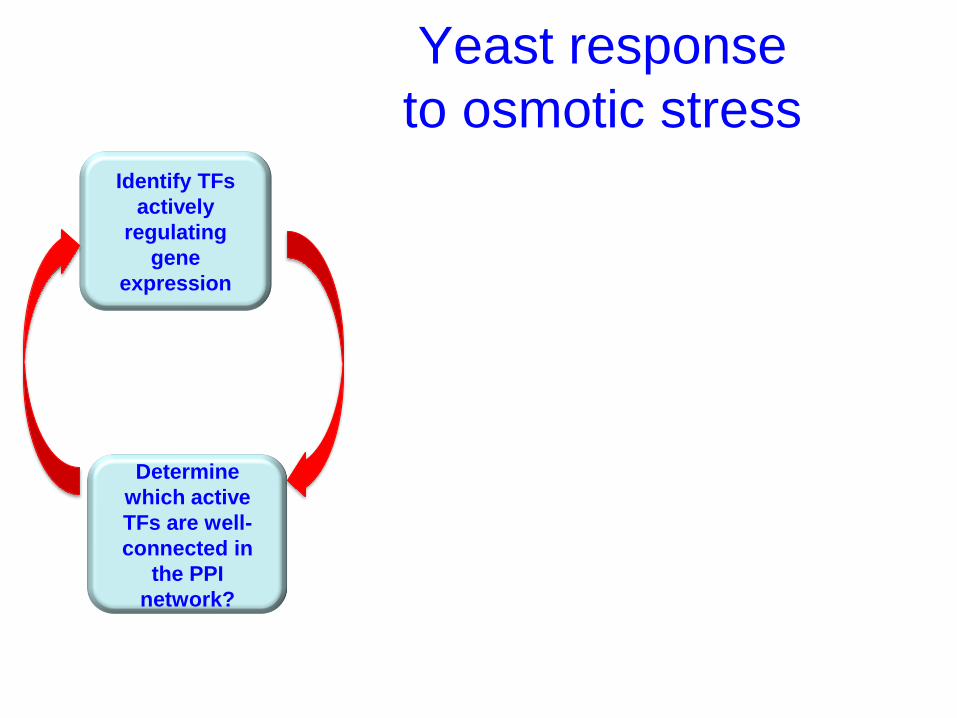
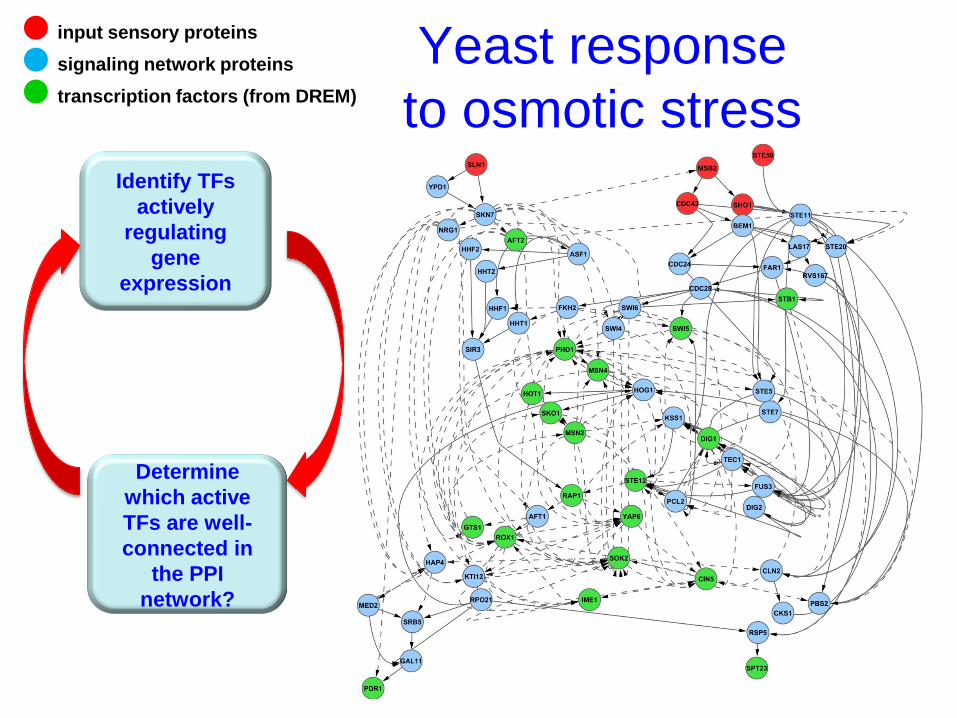
Yeast response
to osmotic stress Identify TFs
actively
regulating
gene
expression
Determine
which active
TFs are well-
connected in
the PPI
network?
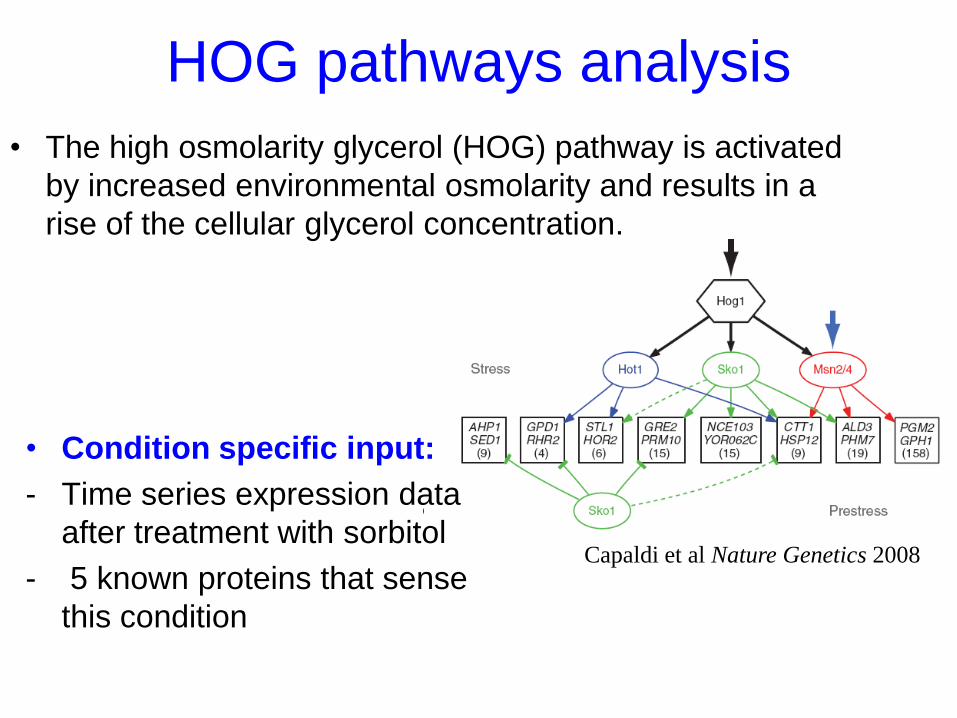
HOG pathways analysis
• The high osmolarity glycerol (HOG) pathway is activated
by increased environmental osmolarity and results in a
rise of the cellular glycerol concentration.
• Condition specific input:
- Time series expression data
after treatment with sorbitol
- 5 known proteins that sense
this condition
Capaldi et al Nature Genetics 2008
Yeast response
to osmotic stress
input sensory proteins
transcription factors (from DREM)
signaling network proteins
Identify TFs
actively
regulating
gene
expression
Determine
which active
TFs are well-
connected in
the PPI
network?
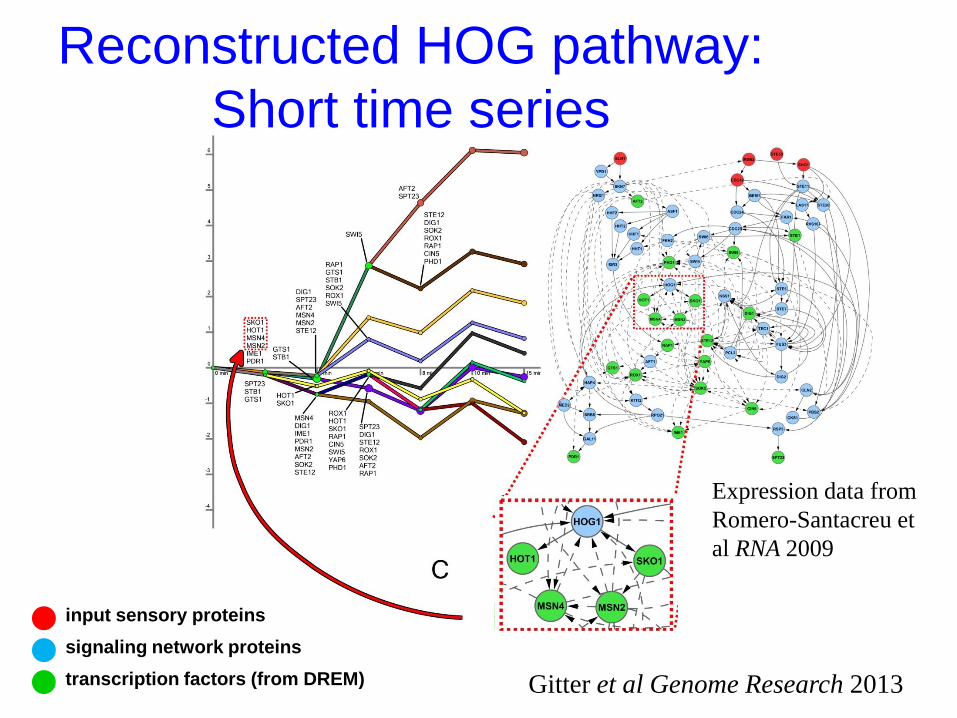
Reconstructed HOG pathway:
Short time series
input sensory proteins
transcription factors (from DREM)
signaling network proteins
Expression data from
Romero-Santacreu et
al RNA 2009
Gitter et al Genome Research 2013
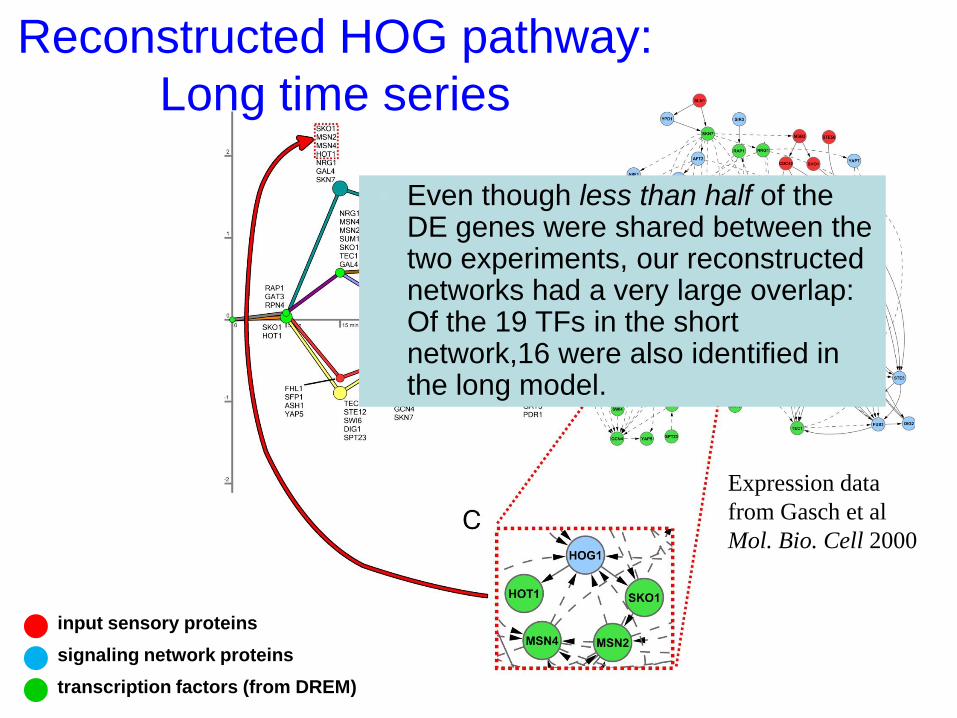
Reconstructed HOG pathway:
Long time series
input sensory proteins
transcription factors (from DREM)
signaling network proteins
Expression data
from Gasch et al
Mol. Bio. Cell 2000
Even though less than half of the DE genes were shared between the two experiments, our reconstructed networks had a very large overlap: Of the 19 TFs in the short network,16 were also identified in the long model.
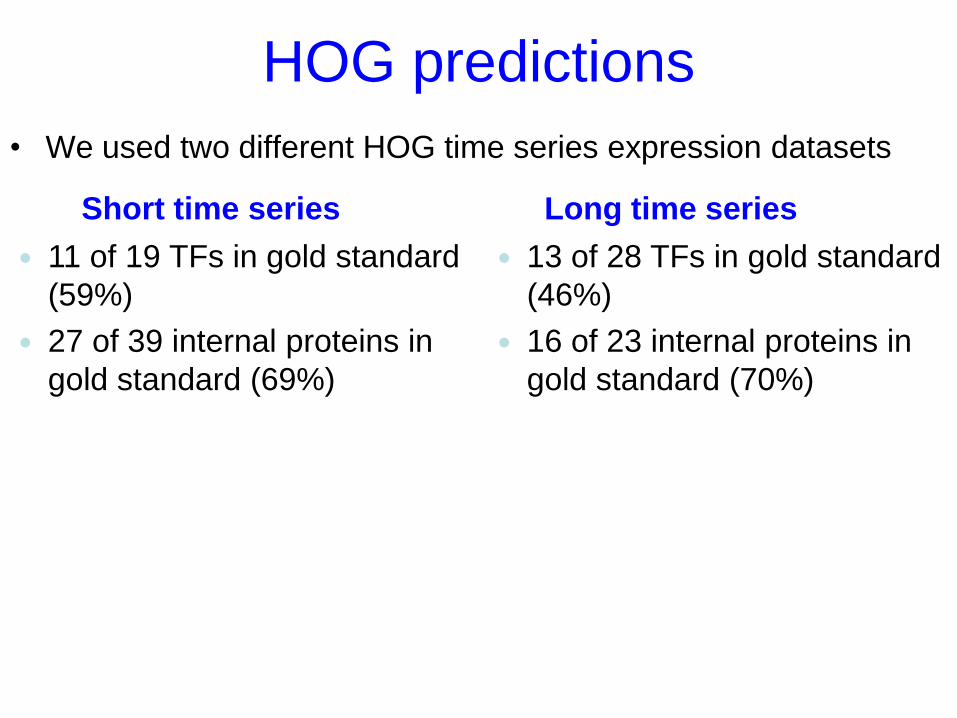
11 of 19 TFs in gold standard
(59%)
27 of 39 internal proteins in
gold standard (69%)
HOG predictions
• We used two different HOG time series expression datasets
13 of 28 TFs in gold standard
(46%)
16 of 23 internal proteins in
gold standard (70%)
Short time series Long time series
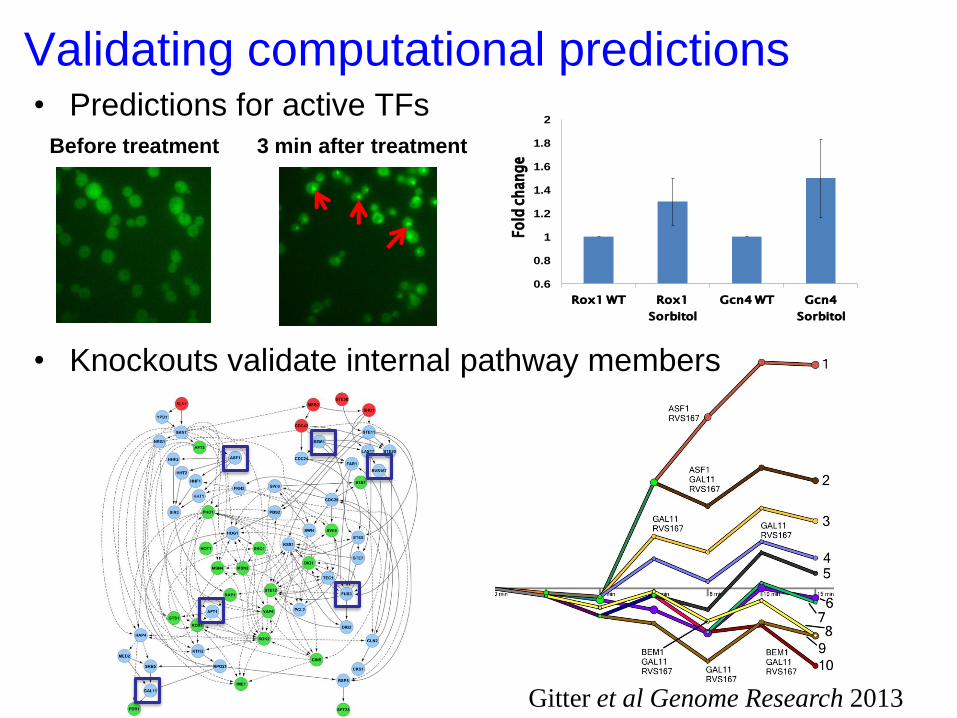
0.6
0.8
1
1.2
1.4
1.6
1.8
2
Rox1 WT Rox1
Sorbitol
Gcn4 WT Gcn4
Sorbitol
Fold
ch
ang
e
Before treatment 3 min after treatment
• Knockouts validate internal pathway members
• Predictions for active TFs
Validating computational predictions
Gitter et al Genome Research 2013
Applications of SDREM to
immune response
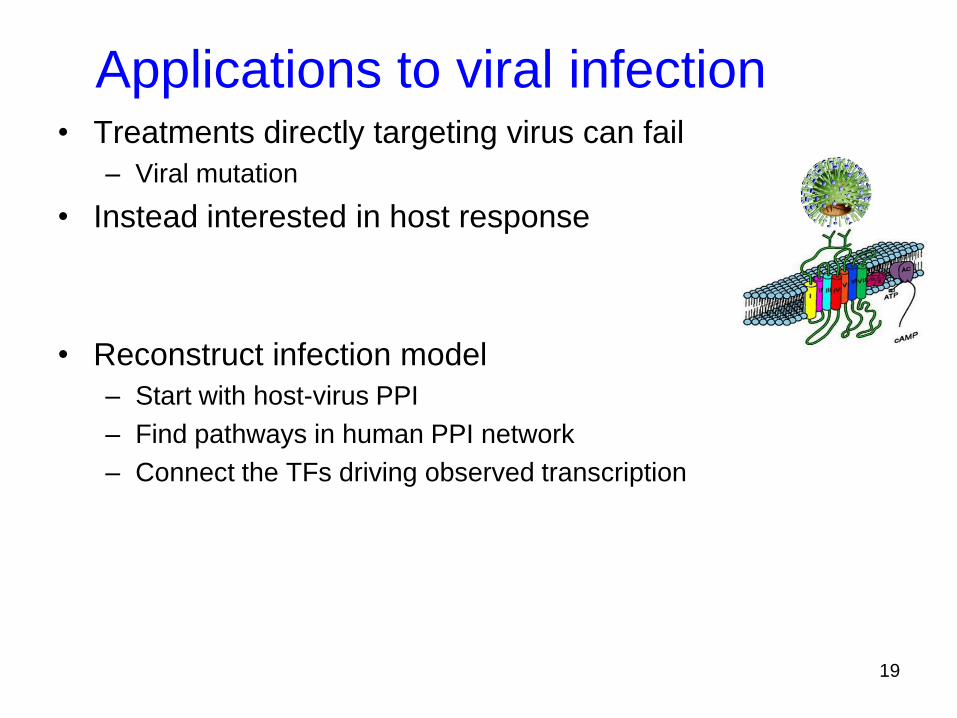
• Treatments directly targeting virus can fail
– Viral mutation
• Instead interested in host response
• Reconstruct infection model
– Start with host-virus PPI
– Find pathways in human PPI network
– Connect the TFs driving observed transcription
Applications to viral infection
19
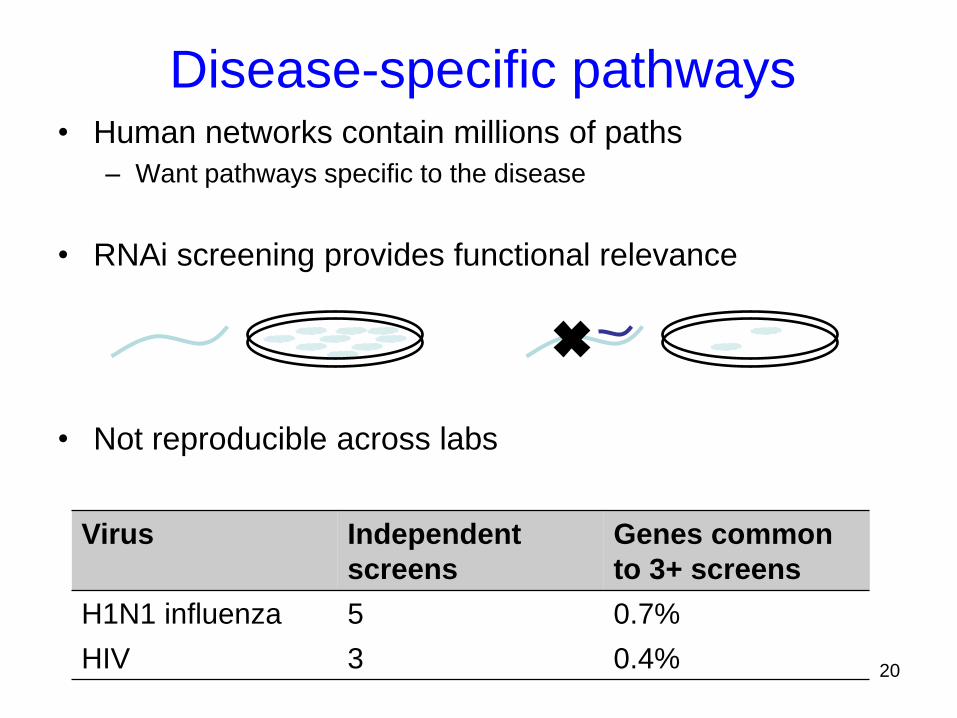
• Human networks contain millions of paths
– Want pathways specific to the disease
• RNAi screening provides functional relevance
• Not reproducible across labs
Disease-specific pathways
20
Virus Independent
screens
Genes common
to 3+ screens
H1N1 influenza 5 0.7%
HIV 3 0.4%
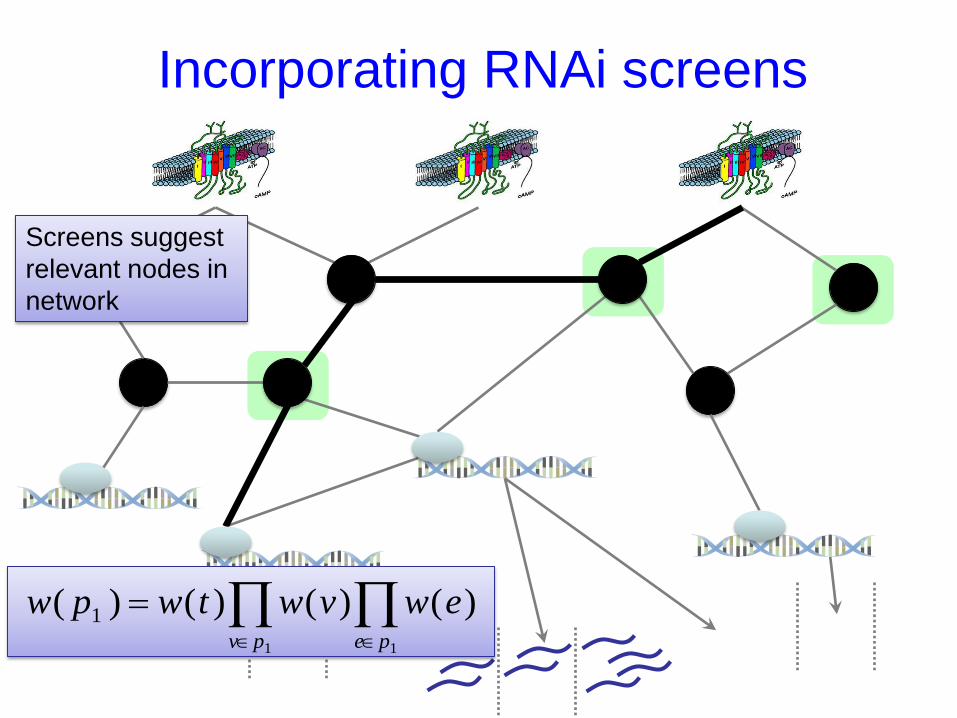
Incorporating RNAi screens
Screens suggest
relevant nodes in
network
11
)()()()( 1
pepv
ewvwtwpw
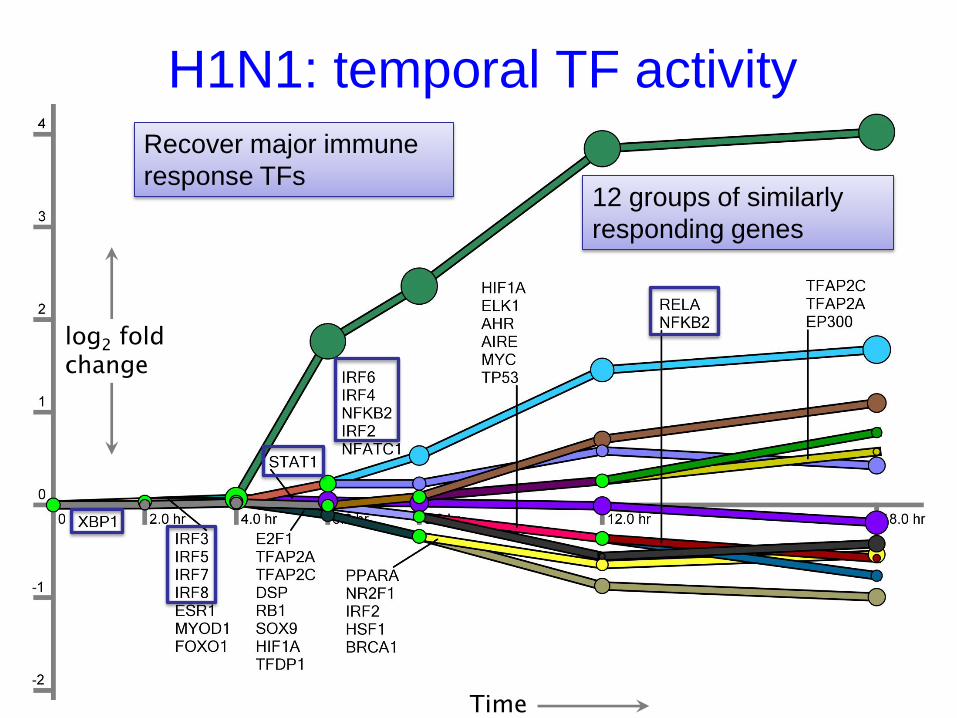
H1N1: temporal TF activity
22
Recover major immune
response TFs
Time
log2 fold change
12 groups of similarly
responding genes
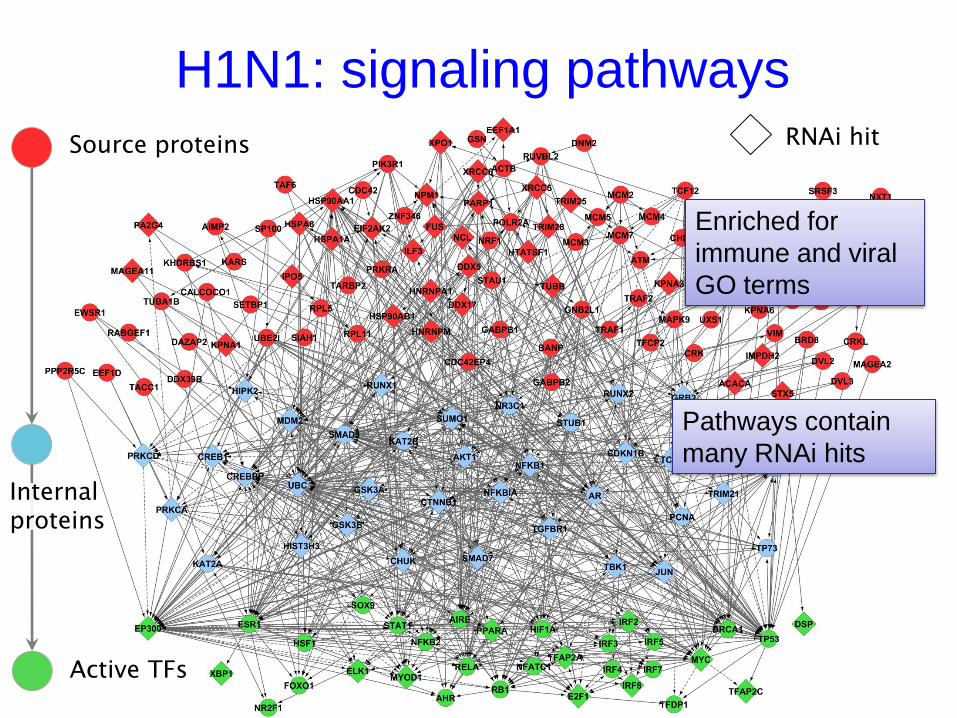
H1N1: signaling pathways
23
Pathways contain
many RNAi hits
Enriched for
immune and viral
GO terms
RNAi hit
Active TFs
Source proteins
Internal proteins
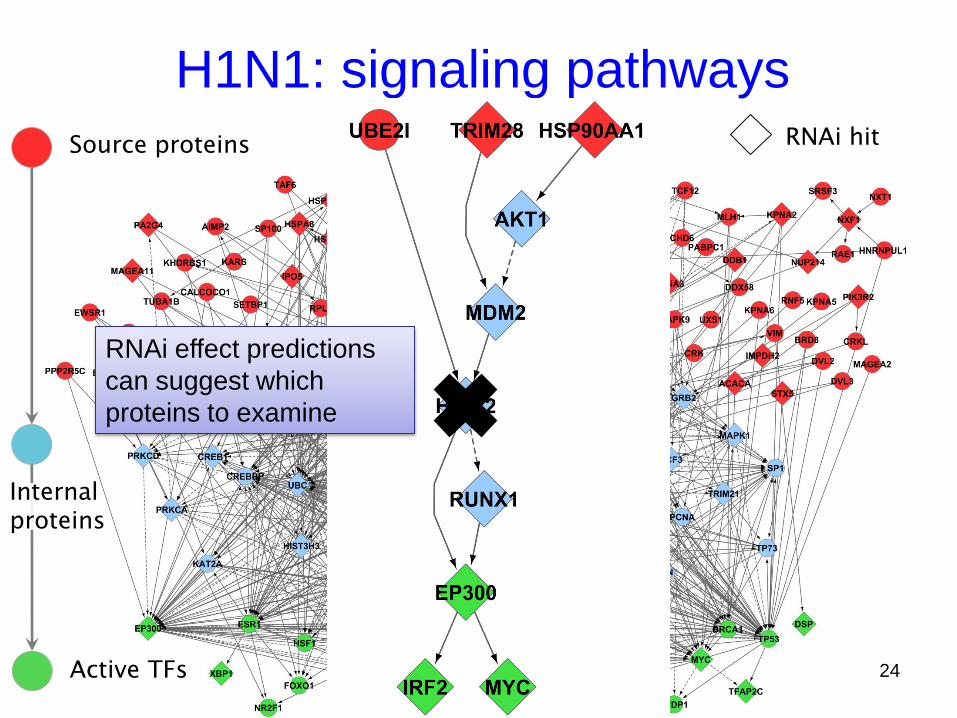
H1N1: signaling pathways
24
RNAi effect predictions
can suggest which
proteins to examine
RNAi hit
Active TFs
Source proteins
Internal proteins
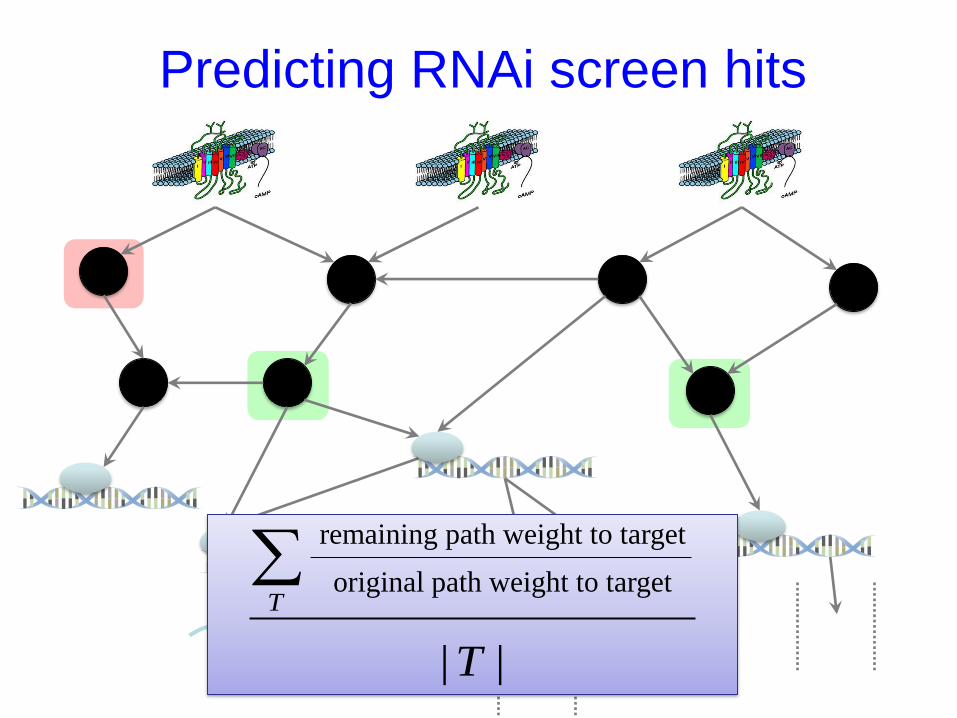
Predicting RNAi screen hits
||
T
T
remaining path weight to target
original path weight to target
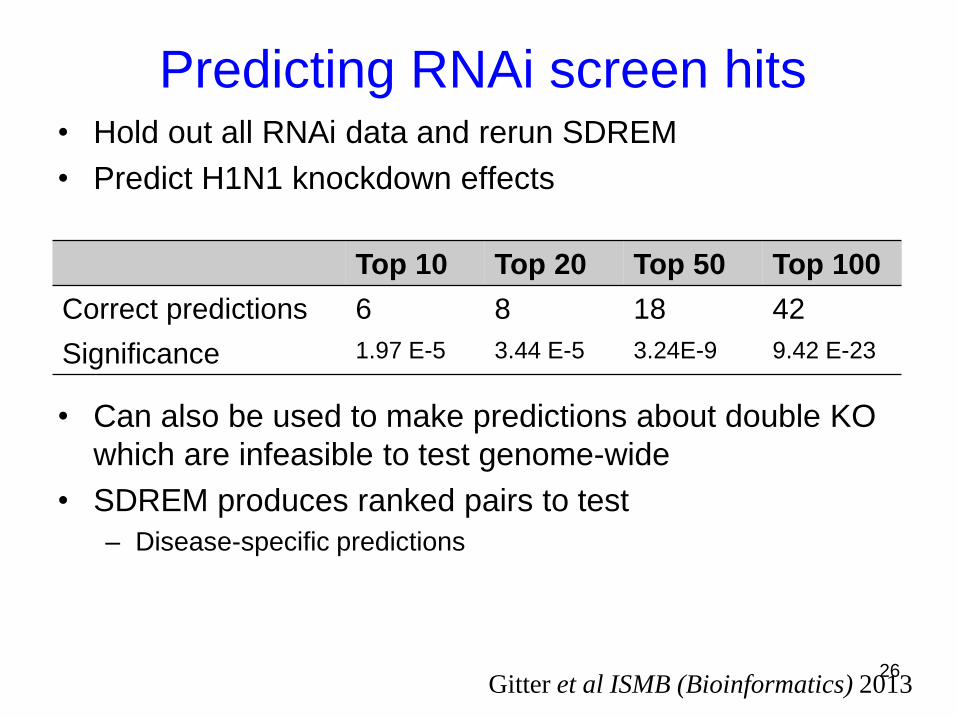
• Hold out all RNAi data and rerun SDREM
• Predict H1N1 knockdown effects
Predicting RNAi screen hits
26
Top 10 Top 20 Top 50 Top 100
Correct predictions 6 8 18 42
Significance 1.97 E-5 3.44 E-5 3.24E-9 9.42 E-23
Gitter et al ISMB (Bioinformatics) 2013
• Can also be used to make predictions about double KO
which are infeasible to test genome-wide
• SDREM produces ranked pairs to test
– Disease-specific predictions
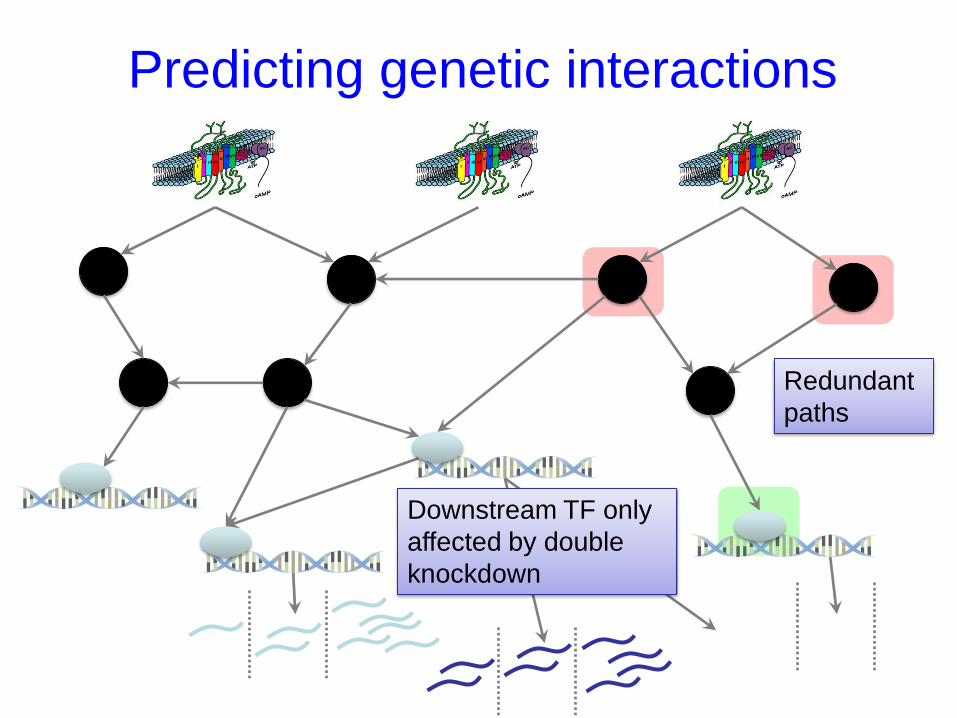
Predicting genetic interactions
Redundant
paths
Downstream TF only
affected by double
knockdown
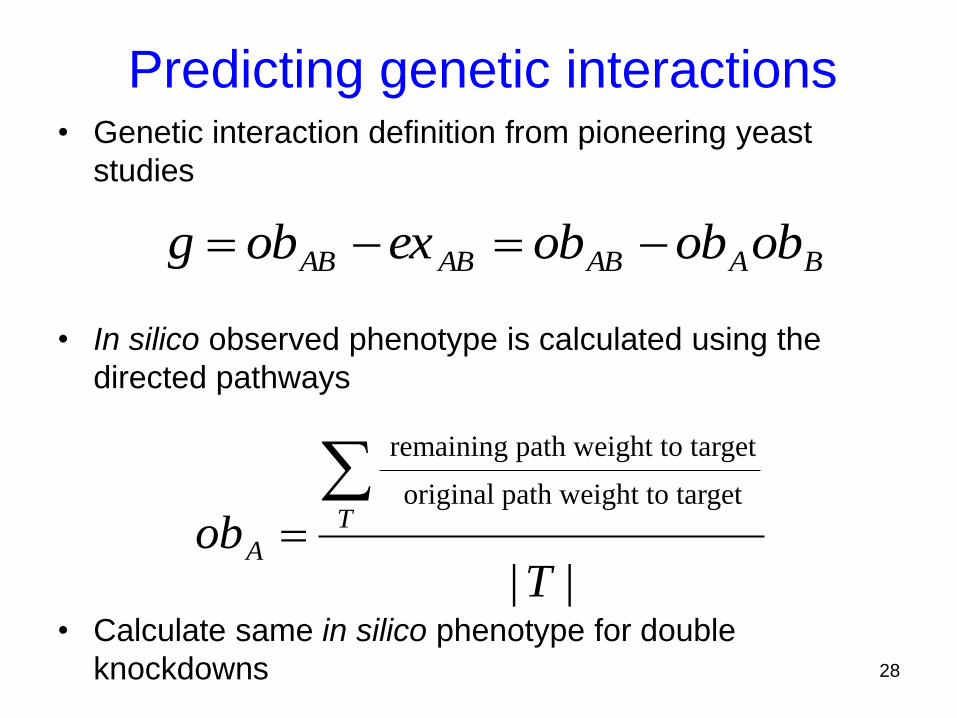
• Genetic interaction definition from pioneering yeast
studies
• In silico observed phenotype is calculated using the
directed pathways
• Calculate same in silico phenotype for double
knockdowns
Predicting genetic interactions
28
BAABABAB obobobexobg
||
Tob T
A
remaining path weight to target
original path weight to target
![What is answer set programming to propositional satisfiability · 1 Introduction Propositional satisfiability (or satisfiability) [6] and answer set programming [7]aretwo closely](https://img.pdfslide.net/doc/110x75/5f0725b47e708231d41b8a72/what-is-answer-set-programming-to-propositional-satisfiability-1-introduction-propositional.jpg)