Embed Size (px)
Citation preview

Supplementary information
Reconstructing the complex evolutionary history of mobile
plasmids in red algal genomes
JunMo Lee1, Kyeong Mi Kim2, Eun Chan Yang3, Kathy A. Miller4, Sung Min Boo5,
Debashish Bhattacharya6, & Hwan Su Yoon1,*
List of Tables
Table S1. Information about the NGS data for five newly sequenced red algal plastid
genomes.
Table S2. Gene compositions of red algal plastid genomes.
Table S3. List of 193 plastid protein-coding genes used in the ML tree search.
Table S4. Newly annotated genes from previously published red algal plastid genomes.
These genes have been overlooked, underestimated or mis-annotated in previous studies.
Table S5. Results of BLASTx search using plasmid-derived regions in plastid genomes.
Cutoff of e-value is 1.0e-05 and two cases of relaxed e-value (2.0e-01 and 3.0e-03) are adapted
to Gle4293 orf4 of Sporolithon and Gro4059 orf2347 of Grateloupia. Abbreviations: HyP
indicates hypothetical protein as in orf for the open reading frame, PG for the pseudogenized
gene. In the plastid genome region of Sporolithon durum, between argB and ftsH gene, 4.2
kb (non-coding) includes two plasmid-derived pseudogenized genes. In the plastid genome of
S. durum, the region between rRNAs and ycf27 pm_orf86 shows uncertain mixed plasmid
signals from BLASTx search results. The plastid genome of Gracilariopsis tenuistipitata var.
liui also shows uncertain plasmid signals between leuD and psbD gene.
Table S6. Samples used in this study.

Table S7. Combined and pseudogenized cases of plasmid-derived regions. Several partial
regions of plasmid-derived regions were combined into each single or pseudogenized gene
based on their alignment as complementary parts. Detailed information about these sequences
is shown below the table. In the genome of Moorea producens, hypothetical protein (GI:
332351884) and both flanking regions were combined and these bacterial sequences were
translated using the Bacterial, Archaeal and Plant Plastid Code (codon table 11). In the
mitochondrial genome of Marchantia polymorpha, orf196 (GI: 11467138) and orf207 (GI:
11467137) were combined with their flanking non-coding regions respectively, and their two
regions were also combined as a single pseudo-gene (89 bp interval between two regions).
For phylogenetic analysis, these plant mitochondrial sequences have been translated to amino
acids using a standard code (codon table 1). In red algae, each part of pseudo-gene regions
was translated using the codon table 11 and combined serially.
Table S8. Contents of subfamily groups in DNA polymerase type-B family catalytic domain
(POLBc) superfamily from conserved domain database (CDD).
Table S9. List of published red algal plasmids. 13 species out of a total 36 red algal species
surveyed contain plasmids (marked as “present [O]”). Among 13 species, 14 plasmid
sequences were reported from only 5 species (Porphyra pulchra, Pyropia tenera, Gracilaria
chilensis, Gracilaria robusta and Gracilariopsis lemaneiformis) in the NCBI database. 14
plasmid sequences encoded 56 open-reading frames (orf).
Table S10. Primer information for population analysis. Different individuals of Gelidium
elegans, Porphyra pulchra and Sporolithon durum were used to check the presence or
absence of the plasmid-derived region. The plasmid-derived regions of G. elegans (between
ycf27 and psbD gene), P. pulchra (between orf121 and apcF gene) and S. durum (between
pseudogenized syfB and rps1 gene) were confirmed by PCR.
List of Figures

Fig. S1. Plastid genome map of Porphyra pulchra. Functional gene groups are color-coded.
Genes drawn inside of the circle indicate the transcriptionally clockwise strand, and genes on
outside indicate the counter-clockwise strand.
Fig. S2. Plastid genome map of Sporolithon durugm. Functional gene groups are color-coded.
Genes drawn inside of the circle indicate the transcriptionally clockwise strand, and genes on
outside indicate the counter-clockwise strand.
Fig. S3. Plastid genome map of Gelidium elegans. Functional gene groups are color-coded.
Genes drawn inside of the circle indicate the transcriptionally clockwise strand, and genes on
outside indicate the counter-clockwise strand.
Fig. S4. Plastid genome map of Gelidium vagum. Functional gene groups are color-coded.
Genes drawn inside of the circle indicate the transcriptionally clockwise strand, and genes on
outside indicate the counter-clockwise strand.
Fig. S5. Plastid genome map of Gracilaria chilensis. Functional gene groups are color-coded.
Genes drawn inside of the circle indicate the transcriptionally clockwise strand, and genes on
outside indicate the counter-clockwise strand.
Fig. S6. Maximum likelihood tree based on aligned amino acid sequences of concatenated
193 protein encoding genes from 16 published and 5 new (underlined) plastid genomes (2000
replications, bootstrap support > 50%).
Fig. S7. Synteny of all plasmid-derived regions in red algae. Colored boxes indicate each
homolog region in red algal plasmid and plastid genomes. Porphyra pulchra plasmid Pp6859
orf4 and orf5 homolog regions are also presented with two cyanobacterial species.
Fig. S8. Maximum likelihood tree based on aligned amino acid sequences of Gracilariopsis
lemaneiformis plasmid GL3.5 orf2 related genes and its homologs from BLASTp search
(cutoff e-value 1.0e-03) (2000 replications, bootstrap support > 50%). Taxon information and
their sequence localities are color-coded as follows: bacteria (black), red algae (red), virus
(violet), plastid (green) and plasmid (brown).

Fig. S9. Maximum likelihood tree based on aligned amino acid sequences of red algal
replicase genes from Pyropia tenera (GI: 254029132, 17980119) plasmids, Porphyra pulchra
plasmid (GI: 7108461, 7108459, 7108457) and their homologs from BLASTp search (cutoff
e-value 1.0e-05) (2000 replications, bootstrap support > 50%). Taxon information and their
sequence localities were indicated with color-code as follows: parasitic bacteria (blue), plant
(green), red algae (red), rhizaria (cyan), stramenopile (brown), plasmid (violet), mitochondria
(orange) and nucleus (black).

Table S1. Information about the NGS data for five newly sequenced red algal plastid
genomes.
No. Taxa
Total bases of NGS
sequencing data (Mbp)
Size of complete
plastid genome (bp)
Total bases of mapped
plastid genome (bp)
Average coverage of
plastid genome (X)
1 Gelidium elegans 1,529 Mbp 174,749 bp 44,027,950 bp 228X
2 Gelidium vagum 990 Mbp 179,852 bp 66,802,278 bp 339X
3 Gracilaria chilensis 506 Mbp 185,637 bp 87,006,562 bp 445X
4 Porphyra pulchra 263 Mbp 194,175 bp 12,007,987 bp 52X
5 Sporolithon durum 3,190 Mbp 191,464 bp 32,008,868 bp 159X

Table S2. Gene compositions of red algal plastid genomes.
Species Reference GC (%)
Coding genes
tRNAs rRNAs Introns
Cyandiophyceae Cyanidioschyzon merolae (NC_004799)
Ohta et al. 2003 37.6 207 31 3 0
Cyanidium caldarium (NC_001840)
Glöckner et al. 2000
32.7 199 (2*) 30 3 0
Galdieria sulphuraria (NC_024665)
Jain et al. 2014 28.5 182 39 6 0
Porphyridiophyceae
Porphyridium purpureum (NC_023133)
Tajima et al. 2014 30.3 224 29 6 43
Bangiophyceae
Porphyra pulchra This study 33.3 207 37 6 0 Porphyra purpurea (NC_000925)
Reith & Munholland 1995
33.0 209 37 6 0
Porphyra umbilicalis (JQ408795)
Smith et al. 2012 32.9 208 (1*) 37 6 0
Pyropia fucicola (KJ776837)
Hughey et al. 2014 32.7 207 (4*) 35 3 0
Pyropia haitanensis (NC_021189)
Wang et al. 2013 33.0 213 (2*) 37 6 0
Pyropia kanakaensis (KJ776836)
Hughey et al. 2014 32.8 210 (4*) 35 3 0
Pyropia perforata (NC_024050)
Hughey et al. 2014 32.9 211 (2*) 35 3 0
Pyropia yezoensis (NC_007932)
Wang et al. 2013 33.1 213 37 6 0
Florideophyceae Calliarthron tuberculosum (NC_021075)
Janouškovec et al. 2013
29.2 201 31 3 2
Sporolithon durum This study 29.3 202 30 3 2 Chondrus crispus (NC_020795)
Janouškovec et al. 2013
28.7 204 30 3 1
Gelidium elegans This study 30.2 202 30 3 1
Gelidium vagum This study 29.9 201 30 3 1
Gracilaria chilensis This study 29.3 203 30 3 1 Gracilaria salicornia
(NC_023785) Campbell et al.
2014 28.8 203 (1*) 30 (1*) 3 1 (1*)
Gracilaria tenuistipitata var. liui (NC_006137)
Hagopian et al. 2004
29.2 205 (2*) 30 (1*) 3 1 (1*)
Grateloupia taiwanensis (NC_021618)
DePriest et al. 2013
30.6 234 (1*) 30 (1*) 3 1 (1*)
*: including un-annotated genes in previous reports

Table S3. List of 193 plastid protein-coding genes used in the ML tree search.
See the file “Table_S3_S4_S7_supplementary_tables.xlsx” (sheet Table S3).

Table S4. Newly annotated genes from previously published red algal plastid genomes.
These genes have been overlooked, underestimated or mis-annotated in previous studies.
Detailed information is shown in remarks.
See the file “Table_S3_S4_S7_supplementary_tables.xlsx” (sheet Table S4).

Table S5. Results of BLASTx search using plasmid-derived regions in plastid genomes. Cutoff of e-value is 1.0e-05 and two cases of relaxed e-
value (2.0e-01 and 3.0e-03) are adapted to Gle4293 orf4 of Sporolithon and Gro4059 orf2347 of Grateloupia. Abbreviations: HyP indicates
hypothetical protein same as in orf for the open reading frame, PG for the pseudogenized gene. The plastid genome region of Sporolithon durum
between argB and ftsH gene is 4.2 kb non-coding part that includes two plasmid-derived pseudogenized genes. Between rRNAs and ycf27 in
plastid genome of S. durum, pm_orf86 shows uncertain mixed plasmid signals from BLASTx search results. The plastid genome of
Gracilariopsis tenuistipitata var. liui also shows uncertain plasmid signals between leuD and psbD gene.
Species Locality Region Feature Size Matched results E-value Identities GI Remarks
Porphyra pulchra orf121-apcF - PG 585 bp Pp6427 orf3 1.E-39 45% 11466611
Pyropia haitanensis
petG-rps14 - PG 414 bp Pp6859 orf7 3.E-44 63% 11466621 petG-rps14 - PG 291 bp Pp6859 orf 6 3.E-22 48% 11466620 petG-rps14 pm_orf72 orf 216 bp Pp6859 orf 5 9.E-12 55% 11466341 un-annotated gene previously
ycf12-ftrB - PG 399 bp Pp6859 orf 4 4.E-36 51% 11466618 ycf12-ftrB pm_orf93 orf 279 bp Pp6427 orf 1 1.E-12 59% 11466609 un-annotated gene previously
Sporolithon durum
PG(syfB)-rps1 pm_orf185 orf 555 bp Gle4293 orf 4 2.E-01 26% 11465618 relaxed e-value, Pp6859 orf1 region mixed PG(syfB)-rps1 pm_orf73 orf 219 bp Pp6859 orf 6 4.E-06 37% 11466620 PG(syfB)-rps1 pm_orf819 orf 2457 bp Calothrix sp. HyP 1.E-146 36% 668693613 Pp6859 orf4 and orf5 homolog
argB-ftsH - PG 312 bp Calothrix sp. HyP 8.E-09 78% 668693613 copy region of pm_orf819 argB-ftsH - PG 381 bp Gch7220 orf 5 5.E-14 36% 11465596
Gelidium elegans ycf27-psbD - PG 831 bp Pp6859 orf 5 2.E-38 36% 11466341
Gelidium vagum rps6-rRNAs - PG 2091 bp Calothrix sp. HyP 2.E-107 34% 66863613 Pp6859 orf4 and orf5 homolog
rps6-rRNAs - PG 555 bp Gro4970 orf 5 2.E-12 25% 11466341
Grateloupia taiwanensis ycf27-psbD - PG 306 bp GL3.5 orf 1 1.E-05 35% 18514 overlapped to unique orf31 & orf32
rRNAs-ycf27 - PG 183 bp GL3.5 orf 2 3.E-12 74% 18515 overlapped to unique orf06
ycf27-psbD - PG 303 bp Gro4059 orf 2347 3.E-03 27% 11466334 relaxed e-value, overlapped to unique orf32
Gracilaria salicornia ycf27-psbD orf139 orf+PG 495 bp Gro4970 orf 1 3.E-24 50% 11466337 Gracilaria tenuistipitata var. liui rRNAs-ycf27 - PG 441 bp Gle4293 orf 1 5.E-14 64% 11465615
Gracilaria chilensis leuD-psbD - PG 606 bp Gle4293 orf 1 7.E-37 61% 11465615
leuD-psbD - PG 300 bp Gle4293 orf 2 6.E-08 36% 11465616 leuD-psbD - PG 408 bp Gle4293 orf 3 1.E-23 52% 11465617

Table S6. Sampling information used in this study.
No. Taxa Strain No. Date Locality
1 Gelidium elegans
SKKU18 Oct. 27, 2012 Anin, Gang-reung, Korea
SKKU22 Oct. 27, 2012 Gamchusa, Donghae-si, Korea
SKKU28 Oct. 22, 2012 Wando, Jungdo-ri, Korea
2 Gelidium vagum - Jul. 23, 2012 Manripo, Tae-an, Korea
3 Gracilaria chilensis - Feb. 1, 2003 Ancud, Chile
4 Porphyra pulchra UC1879714 Jun. 20, 1970 Moss Beach, California, USA
UC1454976 Jun. 20, 1970 Moss Beach, California, USA
5 Sporolithon durum
SKKU_SD01 Nov. 6, 2012 Army Bay, Whangaparaoa, New Zealand
SKKU_SD02 Aug. 28, 2014 Army Bay, Whangaparaoa, New Zealand
SKKU_SD03 Aug. 28, 2014 Army Bay, Whangaparaoa, New Zealand

Table S7. Information about the combination and separation of plasmid-derived regions.
Several partial orf regions were combined into one single orf, while an orf was separated into
two genes based on the complementary alignment. In the genome of Moorea producens,
hypothetical protein (GI: 332351884) and its flanking regions (both of sides) were combined
and these bacterial sequences were translated using the Bacterial, Archaeal and Plant Plastid
Code (codon table 11). In the mitochondrial genome of Marchantia polymorpha, orf196 (GI:
11467138) and orf207 (GI: 11467137) were combined with their flanking non-coding regions,
respectively, and their two regions were also combined as a single orf (89 bp interval between
two regions). For phylogenetic analysis, these plant mitochondrial sequences have been
translated to amino acids using a standard code (codon table 1). In red algae, each part of
sequences were translated. All these red algal sequences were translated using the codon table
11.
See the file “Table_S3_S4_S7_supplementary_tables.xlsx” (sheet Table S7).

Table S8. Contents of subfamily groups in DNA polymerase type-B family catalytic domain
(POLBc) superfamily from conserved domain database (CDD).
Conserved domain database Accession
POLBc superfamily cl10023
DNA polymerase type-B family catalytic domain (POLBc) cd00145
DNA polymerase type-B B1 subfamily catalytic domain (POLBc B1) cd05530
DNA polymerase type-B B2 subfamily catalytic domain (POLBc B2) cd05531
DNA polymerase type-B alpha subfamily catalytic domain (POLBc alpha) cd05532
DNA polymerase type-B delta subfamily catalytic domain (POLBc delta) cd05533
DNA polymerase type-B zeta subfamily catalytic domain (POLBc zeta) cd05534
DNA polymerase type-B epsilon subfamily catalytic domain (POLBc alpha) cd05535
DNA polymerase type-B B3 subfamily catalytic domain (POLBc B3) cd05536
DNA polymerase type-II subfamily catalytic domain (POLBc Pol II) cd05537
DNA polymerase type-II B subfamily catalytic domain (POLBc Pol II B) cd05538
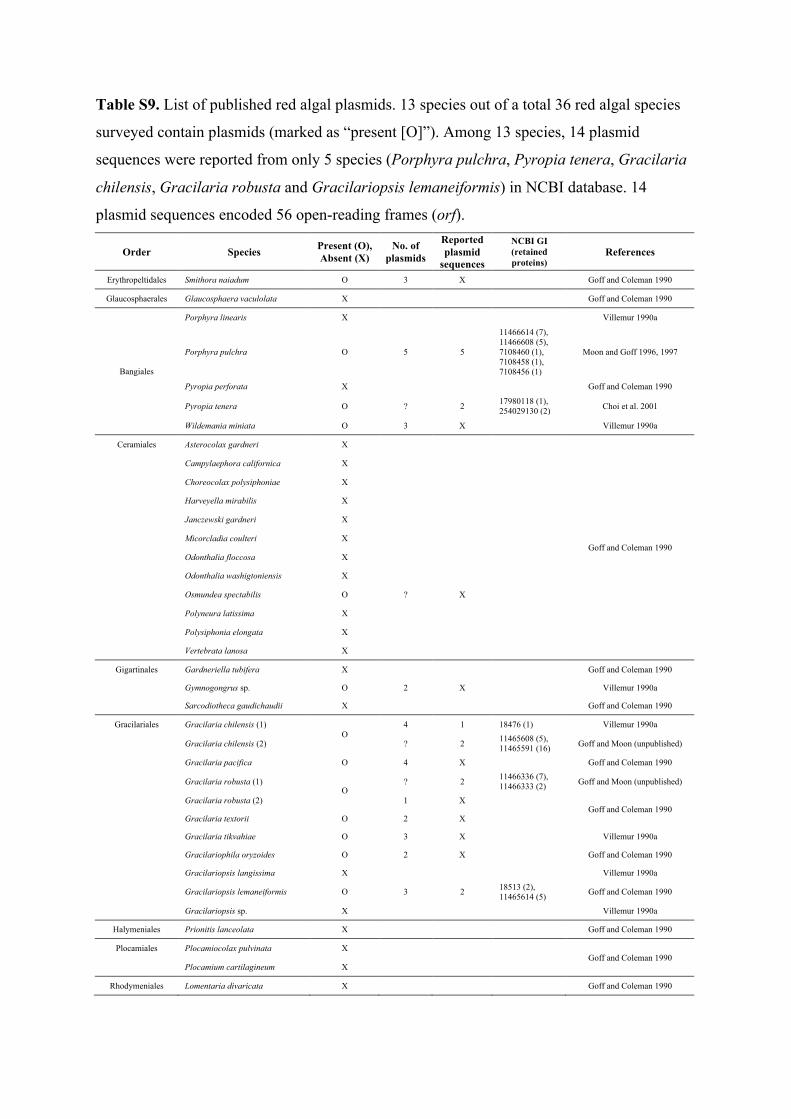
Table S9. List of published red algal plasmids. 13 species out of a total 36 red algal species
surveyed contain plasmids (marked as “present [O]”). Among 13 species, 14 plasmid
sequences were reported from only 5 species (Porphyra pulchra, Pyropia tenera, Gracilaria
chilensis, Gracilaria robusta and Gracilariopsis lemaneiformis) in NCBI database. 14
plasmid sequences encoded 56 open-reading frames (orf).
Order Species Present (O), Absent (X)
No. of plasmids
Reported plasmid
sequences
NCBI GI (retained proteins)
References
Erythropeltidales Smithora naiadum O 3 X Goff and Coleman 1990
Glaucosphaerales Glaucosphaera vaculolata X Goff and Coleman 1990
Bangiales
Porphyra linearis X Villemur 1990a
Porphyra pulchra O 5 5
11466614 (7), 11466608 (5), 7108460 (1), 7108458 (1), 7108456 (1)
Moon and Goff 1996, 1997
Pyropia perforata X Goff and Coleman 1990
Pyropia tenera O ? 2 17980118 (1), 254029130 (2) Choi et al. 2001
Wildemania miniata O 3 X Villemur 1990a
Ceramiales Asterocolax gardneri X
Goff and Coleman 1990
Campylaephora californica X
Choreocolax polysiphoniae X
Harveyella mirabilis X
Janczewski gardneri X
Micorcladia coulteri X
Odonthalia floccosa X
Odonthalia washigtoniensis X
Osmundea spectabilis O ? X
Polyneura latissima X
Polysiphonia elongata X Vertebrata lanosa X
Gigartinales Gardneriella tubifera X Goff and Coleman 1990
Gymnogongrus sp. O 2 X Villemur 1990a
Sarcodiotheca gaudichaudii X Goff and Coleman 1990
Gracilariales Gracilaria chilensis (1) O
4 1 18476 (1) Villemur 1990a
Gracilaria chilensis (2) ? 2 11465608 (5), 11465591 (16) Goff and Moon (unpublished)
Gracilaria pacifica O 4 X Goff and Coleman 1990
Gracilaria robusta (1) O
? 2 11466336 (7), 11466333 (2) Goff and Moon (unpublished)
Gracilaria robusta (2) 1 X Goff and Coleman 1990 Gracilaria textorii O 2 X
Gracilaria tikvahiae O 3 X Villemur 1990a
Gracilariophila oryzoides O 2 X Goff and Coleman 1990
Gracilariopsis langissima X Villemur 1990a
Gracilariopsis lemaneiformis O 3 2 18513 (2), 11465614 (5) Goff and Coleman 1990
Gracilariopsis sp. X Villemur 1990a
Halymeniales Prionitis lanceolata X Goff and Coleman 1990
Plocamiales Plocamiocolax pulvinata X Goff and Coleman 1990
Plocamium cartilagineum X
Rhodymeniales Lomentaria divaricata X Goff and Coleman 1990

Table S10. Primer information for population analysis. Different individuals of Gelidium
elegans, Porphyra pulchra and Sporolithon durum were used to check the presence or
absence of plasmid-derived region. The plasmid-derived regions of G. elegans (between
ycf27 and psbD gene), P. pulchra (between orf121 and apcF gene) and S. durum (between
pseudogenized syfB and rps1 gene) were confirmed by PCR.
Speices Strain Primer set
Gelidium elegans
SKKU18 [Forward 1] Gele_F1_1: 5'-ATTCAGTCTTCTAGAACTACTAGTAA-3' Gele_F1_2: 5'-AAAGACATGTTGATACAAGAGTTGTC-3' [Reverse 1] Gele_R1_1: 5'-CTTGTCCAATTGCTATGGTCATATTA-3' Gele_R1_2: 5'-AACCTTCTAGATAAGAACTAGCTAA-3'
SKKU22
SKKU28
Porphyra pulchra
UC1879714 [Forward 1] Pp_F1_1: 5'-TCTAGATTATAGATAGATTTAGTGCTC-3' Pp_F1_2: 5'-AAGACTAGTATATTTGTTAGTGCATCA-3' [Reverse 1] Pp_R1_1: 5'-AACTTTGAAGCTTTATTAGATGCAAGA-3' Pp_R1_2: 5'-GCTTAGGATATTAGAATTCACAGATAA-3'
UC1454976
Sporolithon durum
SKKU_SD01 [Forward 1] Spo_F1: 5’-CTGACACTGAGACAGATATAGAAAATTA-3' [Reverse 1] Spo_R1: 5’-AATTATTCATCGATCTTTCATTAGACAC-3' [Forward 2] Spo_F2: 5’-GTGCTAGTGTATTTAAGCTATATGAAG-3' [Reverse 2] Spo_R2: 5’-TTATTAAATAGAAGTTTAGCTCCATCT-3'
SKKU_SD02
SKKU_SD03

rnpB RNA
trnR
groEL
ycf17
rrstrnItrnA
rrlrrf
thiGtrpG
nblA cpeBcpeAccsApsaK
ycf61cpcApgmAsecAtrnEorf327psb30psaItrnVtrnRrrs
trnItrnA
rrlrrf
chlN
ycf37psaF psaJ apcD
fabHpsbXaccDpsbV
petJ
carA
orf1
08
rne
rpl2
7rp
l21
orf2
63rp
l32
psbY
ycf3
5
Pp64
27 o
rf3 re
gion
psaLrb
cL
orf62orf6
21orf287ycf24ycf16
rps18rpl33 glnB
ycf3atpBatpE
tatCpetA
preA
acsF
psaDorf68
psaApsaB
trnG
rps1
4
psbN
psaE
trnD
trnS
trnA
tnrM
trnT
trnY
trnV
rpl19
dnaB
rpl9
moeB
orf75
petD
petB
trnH
rps1
syfB
psbWtrnQsyhtrnR
orf148
orf198
ycf65rps16 ycf19
psbC
psbDorf27
rps6orf203
ccs1
orf240cpcG trnN
accAycf23psaC
gltB
trpA
ftrB psbJ
psbLpsbF psbE
ycf63chlIpsaM
ycf46rpl34
orf174
trnLor
f238
orf3
20rbcRps
bAtrnL
trxA
rpl28
or
f58trn
Tyc
f4trn
G rp
s4
ilvHtrn
McemA
trnL
ycf39
orf111
psbI
atpAatpDatpFatpG
atpI
atpH
tsfrps2
rpoC2
rpoC1
rpoB
rps20
infB
apcBapcA
apcE
odpB
petN secG ycf36 trnMbas1pbsA rpl35
rpl20
chlBacpP
orf565
rpl3 rpl4
rpl23 rpl2 rps19 rpl22
rps3 rpl16 rpl29 rps17
rpl14 rpl24
rpl5 rps8 rpl6
rpl18 rps5 secY
rpl36 rps13 rps11 rpoA
rpl13
rps9 rpl31 rps12
rps7 tufA
rps10
odpA
apcF
ycf2
0
trnP
ycf26
trnK
ycf22
ntcA
argB
trnSpe
tFpsbZ
accBtrnS
orf149
ycf34
trnL
trnC
infC
rbcScb
bX
orf1
21trn
R
orf1
14
orf4
50
chlL
orf107
ycf21
cpcB
Porphyra pulchra194,175 bp
GC content: 33.3 %
Fig. S1. Plastid genome map of Porphyra pulchra. Functional gene groups are color-coded. Genes drawninside of the circle indicate the transcriptionally clockwise strand, and genes on outside indicatethe counter-clockwise strand.
ribosomal RNAATP synthaseribosomal protein LSUOther genesIntrontrpB RNA
transfer RNAPhotosystemribosomal protein SSUORFpseudogenized genes
dnaK
psbK
petG
ycf3
8ps
bBps
bT
ftsH
psbH
ycf3
3
clpC
trnF
trnS
trnW
rpl11rpl
1
rpl12
ycf29
thiS
ilvB

cemA
trnMe(intronic orfs)
psbI
trnLycf39ycf41
orf360
ftsH
p
sbH
ps
bT
psbB
ycf3
8
rps10
t
ufA
rps7
rps
12 r
pl31
rps9
rpl13
rpoA
rps11
rps13
rpl36
secY
rps5
rpl18
rpl6
rps8
rpl5
rpl24
rpl14
rps1
7
rpl29
rp
l16
rps3
rpl22
rps19
rpl2
rp
l23
r
pl4
rpl3
Sporolithon durum191,465 bp
GC content: 29.3 %
Gch7220 orf5
regionycf33ilvB
clpC
trnStrnW
rpl11rpl1rpl12
ycf29thiS
rnpB RNA
groEL
ycf17
ycf6
0
rps6
ps
aM
chlI
yc
f63
ycf2
6ps
bEps
bF
psbL
ps
bJ
ftrB
trn
Ktrp
A
carA petJ psbV accD psbXfabHapcD psaJ psaF ycf37 chlN chlL
trxA rpl28 orf65
trnT petL ycf4
trnG
Fig. S2. Plastid genome map of Sporolithon durum. Functional gene groups are color-coded. Genes drawninside of the circle indicate the transcriptionally clockwise strand, and genes on outside indicatethe counter-clockwise strand.
atpA
atpD atpFatpG atpH atpI
tsfrps2rpoC2
rpoC1rpoBrps20infB
apcBapcAapcEodpB
rpl20rpl35pbsAbas1
trnM ycf36secG petM petNch
lB(in
troni
cor
f476
)acpP
petGpsbKdn
aK
petF
psbNpsaE
trnD
trnMtrnS
trnYtrnT
rpl19
argB
trnFpseudo-dnaB
rpl9
petDpetBntcAtrnHrps1
pm_orf819
pm_orf173
pm_orf185
pseudo-syfB
psbW
uppycf19rps16ycf65
trnQ
psbCpsbD
ycf27pm_orf86
rpl34trnP
ycf52
ycf53ycf55
rbcR
psbA
trnL
trpG
thiG
trnR
trnV
psaI
ycf64
tilS
trnE
secA
pseu
do-yc
f21
pgmA
cpcA
cpcB
rpoZ
psaKccsAcpeAcpeBnblAycf20
rps4trnLtrnC
psaL
cbbXrbcSrbcL
infC
apcF
psb3
0
trnR
moeB
ycf4
5odpA
Sta7437_4988
region
ribosomal RNAATP synthaseribosomal protein LSUOther genesIntrontrpB RNA
transfer RNAPhotosystemribosomal protein SSUORFpseudogenized genes
rrs
rrfrrltrnAtrnI
rpl21rpl27
rne
ccdA
ccs1trn
N
gltB
cpcG
trnRycf80
ilvH
orf408ycf58
orf84orf134sufBsufC
psaC
pseudo-ycf23ycf22
accAycf54
psbYrpl32ycf56
rpl33
rps18ycf3atpBatpEtatCpetApreAacsFps
aDtr
nSorf6
8ac
cB
psaApsaBrps1
4ps
bZtrnG

sufCsufBycf92
ycf58orf621 trnG
ycf4petLtrnTCcr_orf64
rpl28
trxA
ilvH
ycf80
cpcG
accAycf23
ycf22
psaCgltB
trpAtrnKftrB
ycf26ycf63chlI psaM
rpl34 trnP
ycf53
ycf55
rbcR
psbA
trnL
trpG
thiG
rrf
rrl
rrs
trnA
trnI
ycf1
7
groE
L
rnpB R
NA
thiSycf29
trnW
rpl11rpl1
rpl12
clpC
ilvBycf33
ftsH
psbH
psbT psbB
ycf38
rpl3 rpl4
rpl23 rpl2 rps19 rpl22 rps3 rpl16 rpl29 rps17 rpl14 rpl24 rpl5rps8rpl6rpl18rps5 secY rpl36 rps13 rps11 rpoA rpl13 rps9 rpl31 rps12 rps7
tufA rps10
trnGpsbZ
ribosomal RNAATP synthaseribosomal protein LSUOther genesIntrontrpB RNA
transfer RNAPhotosystemribosomal protein SSUORFpseudogenized genes
rps14psaB
psaAaccB
trnS
preA
tatCpetA
atpEatp
Bycf3rp
s18
Gelidium elegans174,748 bp
GC content: 30.2 %
Fig. S3. Plastid genome map of Gelidium elegans. Functional gene groups are color-coded. Genes drawninside of the circle indicate the transcriptionally clockwise strand, and genes on outside indicatethe counter-clockwise strand.
psbJpsbLpsbF psbE
rpl33
psaDacsF
ycf46
ycf52
trnRycf91
atpI
apcB
apcA
odpB
odpA rpl20
rpl35
pbsAbas1trnM ycf36
secG petM petN
acpP
ycf45
petGpsbK
dnaK
petF
psbN
argB
rpl19 trnTtrnYtrnV
trnFdnaB
rpl9m
oeBpetDpetBntcAtrnHrps1
syfBpsbW
upp
ycf1
9rp
s16
ycf6
5or
f164
psbCpsbD
Pp68
59 o
rf5 re
gion
ycf2
7
rps6
ccs1ccdAycf
35
rne
psbY
rpl32
ycf56
rpl21
rpl27
ycf54
carApetJpsbVaccDpsbXfabHapcDpsaJpsaF
ycf37
trnVtrnR
psaIpsb30
tilS
trnE
secA
ycf21
pgmA
cpcAcpcBrpoZ
psaK
ccsAcpeA
cpeBnblA
ycf20
apcF
rps4infC
trnC
trnL
ycf34 rbcSrbcL
psaLtrnM
e
(intronic orf12) cemA
psbIycf41ycf39trnL at
pAat
pDat
pFat
pGat
pH
cbbX
ycf64
trnN
ycf60
syh
trnR
trnQ
trnDtnrStnrM
psaE
apcE
tsf rps2
rpoC
2
rpoC
1
rpoB
rps2
0inf
B

ycf33
sufCsufBorf256
ycf58orf614 trnG
ycf4petLtrnTCcr_orf64
rpl28
trxA
ilvHycf80cpcG
accAycf23
ycf22
psaCgltB
ribosomal RNAATP synthaseribosomal protein LSUOther genesIntrontrpB RNA
transfer RNAPhotosystemribosomal protein SSUORFpseudogenized genes
trpAtrnKftrB
ycf26ycf63chlI psaM
rpl34 trnP
ycf53ycf55
rbcR
psbJpsbLpsbF psbE
psbA
trnL
trpG
thiG
rrfGr
o497
0 orf5
regi
on
Sta7
437_
4988
regi
onrr
l
rrs
trnA
trnI
ycf1
7
groE
L
rnpB R
NA
thiSycf29
trnW
rpl11rpl1
rpl12
clpC
ilvB
ftsH
psbH
psbT psbB
ycf38
rpl3 rpl4
rpl23 rpl2 rps19 rpl22 rps3 rpl16 rpl29 rps17 rpl14 rpl24 rpl5rps8rpl6rpl18rps5 secY rpl36 rps13 rps11 rpoA rpl13 rps9 rpl31 rps12 rps7 tufA
rps10
trnGpsbZ
rps14psaB
psaAaccB
trnS
preA
tatCpetA
atpEatp
Bycf3rp
s18
Gelidium vagum179,853 bp
GC content: 29.9 %
rpl20
rpl35
pbsAbas1trnM ycf36
secG petM petN
Fig. S4. Plastid genome map of Gelidium vagum. Functional gene groups are color-coded. Genes drawninside of the circle indicate the transcriptionally clockwise strand, and genes on outside indicatethe counter-clockwise strand.
rpl33
psaDacsF
ycf46
ycf52
trnRycf91
atpI
apcB
apcA
odpB
odpA
acpP
ycf45
petGpsbK
dnaK
petF
psbN
argB
rpl19 trnTtrnYtrnV
trnFdnaBrpl9m
oeBpetDpetBntcAtrnHrps1
syfB
psbW
upp
ycf1
9rp
s16
ycf6
5or
f164
psbCpsbDycf2
7
rps6
ccs1ccd
Aycf35
rnepsbY
rpl32
ycf56
rpl21
rpl27
ycf54
carApetJpsbVaccDpsbXfabH
apcDpsaJpsaF
ycf37
trnVtrnR
psaIpsb30
tilS
trnE
secA
ycf21
pgmA
cpcAcpcBrpoZ
psaKccsA
cpeA
cpeBnblA
ycf20apcF
rps4infC
trnC
trnL
pseudo-ycf34 rbcSrbcL
psaL
cbbX
ycf64
trnN
ycf60
syh
trnR
trnQ
trnDtnrStnrM
psaE
apcE
tsf rps2
rpoC
2
rpoC
1
rpoB
rps2
0inf
B

cemA
trnMe
(intronic orfs)
trnL
ycf39
orf109psbI
atpAatpF
atpGatpH
atpItsf
rps2
rpoC2
rpoC1
rpoB
rps20rps18rpl33 yc
f3
tatC
preA
acsF
psaD
trnS
accB
psaA
psaB
rps14psbZ
trnG
rpl3
rpl4
rpl23
rpl2
rps19
rpl22 rps3 rpl16 rpl29 rps17
rpl14 rpl24
rpl5rps8rpl6rpl18
rps5secY rpl36 rps13 rps11 rpoA
rpl13
rps9
rpl31
rps12
rps7
tufA
rps10
ycf38
psbB
psbT
psbH
syfBrps1trnHntcApetBpetDmoeBrpl9groELycf17
rrstrnI
trnA
rrl
rrfthiGtrn
Lps
bA
rbcRyc
f55
ycf5
3
trpA
trnK
ftrB
psbJ
psbL
psbF
psbE
ycf26
ycf63
chlI psaM
pseudo-yc
f46
rpl34
trnP
ycf5
2
gltB
psaC
cpcGorf73trnRycf80
ilvH
trnG ycf4petLtrnTorf65 rpl28 trxA
orf220ycf58
orf245ycf24
ycf16
Gracilaria chilensis185,637 bp
GC content: 29.3 %
Fig. S5. Plastid genome map of Gracilaria chilensis. Functional gene groups are color-coded. Genes drawninside of the circle indicate the transcriptionally clockwise strand, and genes on outside indicatethe counter-clockwise strand.
ribosomal RNAATP synthaseribosomal protein LSUOther genesIntrontrpB RNA
transfer RNAPhotosystemribosomal protein SSUORFpseudogenized genes
orf446
pseudo-ycf23ycf22accA
trpG
trnFpsbW
ftsH
ycf33ilvB
orf149dnaB
petAat
pEatpB
atpD
orf198orf197
infB
apcB
apcA
apcE
odpB
odpA
rpl
20 rp
l35
pseu
do-p
bsA
bas1
trnM
ycf3
6 yc
f47
petM
petN
acpP
ycf45
petG
dnaK
petF
psbNpsaE
argB trnDtrnS
trnM
rpl19 trnTtrnY trnV
clpC
rnpB RNAycf40ycf29
rpl12trnWtrnQsyhtrnR orf160
ycf65
rps16
ycf19
upp
psbDGle4293 orf3 region
Gle4293 orf2 region
Gle4293 orf1 region
leuDleuC
ycf27rps6cc
s1ds
bDycf3
5trn
N
rne
psbY
rp
l32
ycf5
6rp
l21
rpl2
7
ycf5
4carApe
tJpsbVac
cD
psbX
apcD
psaJ
ycf37
trnV
trnR
psaIpsb30tilStrnE
secAycf21
pgmAcpcAcpcB
ycf61
psaKccsAcpeAcpeBnblAycf20apcF
rps4infC
rbcL rbcS cbbXtrnCtrnL ycf34
psaL
psaF
fabH
ycf6
0
psbC
rpl1rpl11
psbK

Fig. S6. Maximum likelihood tree based on aligned amino acid sequences of concatenated 193 protein encoding genes from 16 published and 5 new (underlined) plastid genomes (2000 replications, bootstrap support > 50%).


Fig. S8. Maximum likelihood tree based on aligned amino acid sequences of Gracilariopsis lemaneiformis plasmid GL3.5 orf2 related genes and its homologs from BLASTp search (cutoff e-value 1.0e-03) (2000 replications, bootstrap support > 50%). Taxon information and their sequence localities are color-coded as follows: bacteria (black), red algae (red), virus (violet), plastid (green) and plasmid (brown).

Plan
t
Red algaeRhizaria
Stramenopile
Para
sitic
Bac
teria
0.7
uncultured marine virus [replication protein, gi444297942]Odonata-associated cirular virus-7 [replication-associated protein, gi744824944]
Avon-Heathcote Estuary associated circular virus 25 [replication-associated protein, gi765702697]Odonata-associated circular virus-15 [replication-associated protein, gi744824968]
1 ssDNA virus and 3 unclassified viruses4 ssDNA viruses
70 ssDNA viruses
uncultured marine virus [replication protein, gi444298144]Odonata-associated circular virus-8 [replication-associated protein, gi744824948]
Phytophthora sojae [mitochondrial orf98, gi145932354, mitochondria]Pyropia tenera [putative replicase (plasmid), gi254029132, plasmid]Pyropia tenera [replication associated protein (plasmid), gi17980119, plasmid]Porphyra pulchra [replicase (plasmid), gi7108461, plasmid]
Porphyra pulchra [replicase (plasmid), gi7108459, plasmid]Porphyra pulchra [replicase (plasmid), gi7108457, plasmid]
Reticulomyxa filosa [hypothetical protein RFI_31564, gi569354614, nucleus]Reticulomyxa filosa [rep, gi569382219, nucleus]
McMurdo Ice Shelf pond-associated circular DNA virus-2 [rep-associated protein, gi667699509]
‘Chrysanthemum coronarium’ phytoplasma [hypothetical protein, gi754689944]Onion yellow phytoplasma [replication associated protein, gi51172577]Onion yellow phytoplasma [replication protein, gi501877271]Onion yellow phytoplasma [replication protein, gi499583384]Onion yellow phytoplasma [replication protein, gi504873008]Onion yellow phytoplasma [geminivirus-like replication protein, gi504873005]
Candidatus Phytoplasma australiense [replication associated protein, gi501453683]Italina clover phyllody phytoplasma [hypothetical protein, gi515760571]Phytoplasma sp. [hypothetical protein, gi4468959]Vaccinium witches’-broom phytoplasma [hypothetical protein, gi515761095]Wheat blue dwarf phytoplasma [replication-associated protein, gi504896643]Paulownia witches’-broom phytoplasma [replication-associated protein, gi501254467]Wheat blue dwarf phytoplasma [replication-associated protein, gi504896653]Periwinkle little leaf phytoplasma [replication-associated protein, gi504873735]Candidatus Phyoplasma australiense [replication associated protein, gi501453688]Chrysanthemum yellow phytoplasma [hypothetical protein, gi735683554]Chinaberry witches’-broom phytoplasma [replication associated protein, gi503512976]Paulownia witches’-broom phytoplasma [replication-associated protein, gi501254473]Chrysanthemum yellows phytoplasma [hypothetical protein, gi735684243]Wheat blue dwarf phytoplasma [replication-associated protein, gi504896657]New Jwersey aster yellows phytoplasma [Rep protein, gi307902848]Aster yellows witches’-broom phytoplasma [hypothetical protein, gi499732216]Aster yellows witches’-broom phytoplasma AYWB [conserved hypothetical protein, gi84789653]Aster yellows witches’-broom phytoplasma AYWB [conserved hypothetical protein, gi84789536]Aster yellows witches’-broom phytoplasma [hypothetical protein, gi499732224]
Niminivirus [Rep, gi603013937]Grapevine red-blotch associated virus [C1 protein, gi528746544]
Sewage-associated circular DNA virus-18 [replication-associated protein, gi751868117]Sewage-associated circular DNA virus-28 [replication-associated protein, gi751868297]Sewage-associated circular DNA virus-14 [replication-associated protein, gi664651390]
Rhynchosia yellow mosaic virus [replication associated protein, gi256996647]
Nicotiana tomentosiformis [uncharacterized protein LOC104099148, gi697190578, nucleus]
Dalechampia chlorotic mosaic virus [replication associated protein, gi408355352]Tomato mottle leaf curl virus recombinant [replication-associated protein, gi85665888]
8 ssDNA viruses4 ssDNA viruses
3 ssDNA viruses38 ssDNA viruses
6 ssDNA viruses
Nicotiana tomentosiformis [uncharacterized protein LOC104086178, gi697159806, nucleus]Nicotiana tomentosiformis [uncharacterized protein LOC104092751, gi697175541, nucleus]Nicotiana tomentosiformis [uncharacterized protein LOC104099147, gi697190576, nucleus]Nicotiana tomentosiformis [uncharacterized protein LOC104115566, gi697140845, nucleus]Nicotiana tomentosiformis [uncharacterized protein LOC104119210, gi697149473, nucleus]
Asystasia mosaic Madagascar virus [replication-associated protein, gi761719712]Asystasia mosaic Madagascar virus [replication-associated protein, gi756558185]
137 ssDNA VirusesNicotiana tomentosiformis [uncharacterized protein LOC104099419, gi697190580, nucleus]Nicotiana tabacum [AL1 protein, gi1587991, nucleus]
100
55100
81
76
65
86100
78
100
100
98
75100
52
73100
100
85
100100
10066
70866688
Fig. S9. Maximum likelihood tree based on aligned amino acid sequences of red algal replicase genes from Pyropia tenera (GI: 254029132, 17980119) plasmids, Porphyra pulchra plasmid (GI: 7108461, 7108459, 7108457) and their homologs from BLASTp search (cutoff e-value 1.0e-05) (2000 replications, bootstrap support > 50%). Taxon information and their sequence localities were indicated with color-code as follows: parasitic bacteria (blue), plant (green), red algae (red), rhizaria (cyan), stramenopile (brown), plasmid (violet), mitochondria (orange) and nucleus (black).