Embed Size (px)
Citation preview
The Consortium for Policy Research in Education includes:
University of PennsylvaniaTeachers College Columbia University
Harvard UniversityStanford University
University of MichiganUniversity of Wisconsin-Madison
Northwestern University
Recruitment, Retention and the Minority Teacher
Shortage
By
Richard Ingersoll
and
Henry May
A CPRE Research Report Co-Sponsored by:
The Consortium for Policy Research in Education, University of Pennsylvania
and
The Center for Educational Research in the Interest of Underserved Students, University of California, Santa Cruz
Established in 1985, CPRE unites researchers from seven of the nation's leading research institutions in efforts to improve elementary and secondary education through practical research on policy, finance, school reform, and school governance. CPRE studies alternative approaches to education reform to determine how state and local policies can promote student learning. The Consortium’s member institutions are the University of Pennsylvania, Teachers College-Columbia University, Harvard University, Stanford University, the University of Michigan, University of Wisconsin-Madison, and Northwestern University. In March 2006, CPRE launched the Center on Continuous Instructional Improvement (CCII), a center engaged in research and development on tools, processes, and policies intended to promote the continuous improvement of instructional practice. CCII also aspires to be a forum for sharing, discussing, and strengthening the work of leading researchers, developers and practitioners, both in the United States and across the globe. To learn more about CPRE and CCII, visit our web sites at www.cpre.org and www.ccii-cpre.org.
The Center for Educational Research in the Interest of Underserved Students (CERIUS) is a research unit in the Division of Social Sciences at the University of California, Santa Cruz. CERIUS develops, conducts, and disseminates educational research to improve the teaching and learning of the nation's increasingly diverse student population and the teachers who serve them. The Center is trans-disciplinary, drawing on studies of education from multiple theoretical perspectives. CERIUS serves as a hub to integrate the work of scholars who focus on three research domains: a) Teachers and Teacher Development, b) Literacy Education, and c) Science and Mathematics Education. Rodney Ogawa, Professor of Education, serves as the Center's Director.
Consortium for Policy Research in Education University of Pennsylvania | Teachers College Columbia University | Harvard University |
Stanford University | University of Michigan | University of Wisconsin‐Madison | Northwestern University
Recruitment, Retention and the Minority Teacher Shortage
by
Richard M. Ingersoll and Henry May
of the
University of Pennsylvania
CPRE Research Report # RR‐69 September 2011
A Research Report Co‐Sponsored by
The Consortium for Policy Research in Education, University of Pennsylvania
and
The Center for Educational Research in the Interest of Underserved Students,
University of California, Santa Cruz
This research was supported by Sally Hewlett and the Flora Family Foundation.
Opinions in this paper are those of the authors and do not necessarily reflect those of the
Foundation, CPRE and its institutional partners, or The Center for Educational Research
in the Interest of Underserved Students. Elizabeth Merrill provided valuable assistance
with the data analysis. Earlier drafts of this paper were presented at conferences in June
2007 and June 2008 held by the Collaborative on Diversifying Teaching and Schooling at
the Flora Family Foundation in Palo Alto, CA. Thanks are due to Betty Achinstein and
Rodney Ogawa for helpful comments throughout the project.
Abstract i
Introduction 1
The Study 5
Data and Methods 8
Data 8
Measures and Methods 9
Results 17
Trends in Minority Teacher Recruitment and Employment 17
Trends in Minority Teacher Turnover 23
The Determinants of Minority Teacher Turnover 28
Individual, School, and Organizational Predictors of Minority Teacher Turnover 31
Summary and Implications 40
References 47
Endnotes 52
List of Figures Figure 1. Two Perspectives on the Causes and Consequences of Minority Teacher Staffing Problems
7
Figure 2. Percentage Increase in Students and Teachers, by Race/ethnicity from 1987-88 to 2007-08
20
Figure 3. Of Different Types of Public Schools, Race/ethnicity of their Teaching Staff (2003-2004)
21
Figure 4. Percent Annual Teacher Turnover, by Race/ethnicity of Teachers, by Year
24
Figure 5. Numbers of Minority Teachers Entering and Leaving Teaching Before and After the 2003-2004 School Year
26
Figure 6. Predicted Turnover Rates by Public School Organizational Conditions Percentile
39
Table of Contents
List of Tables Table 1. Definitions of Measures Utilized in the Regression Analysis 14
Table 2. Descriptive Statistics for Independent Variables Used in Regression Analysis 15
Table 3. Trends in the Nation’s Population, K-12 Student Enrollment, and the K-12 Teaching Force, by Race/Ethnicity
19
Table 4. Of Minority and White Public School Teachers, Percentage Employed in Different Types of Schools, (2003-2004)
20
Table 5. Percentage Public School Teachers Reporting Less Positive Organizational Conditions, By Type of School (2003-04)
22
Table 6. Percentage Annual Teacher Migration and Attrition, by Race/ethnicity of Teachers, and by Year
24
Table 7. Of Public School Teachers Who Moved to Other Schools, Percentage Reporting Various Categories of Reasons Were Very or Extremely Important, by Race/ethnicity of Teachers, (2004-05)
29
Table 8. Of Public School Teachers Who Left Teaching, Percentage Reporting Various Categories of Reasons Were Very or Extremely Important, by Race/ethnicity of Teachers (2004-05)
29
Table 9. Logistic Regression Analysis of the Likelihood of Public School Minority and White Teacher Turnover
33
Table 10. Logistic Regression Analysis of the Likelihood of Public School Minority and White Teacher Turnover
36
Abstract
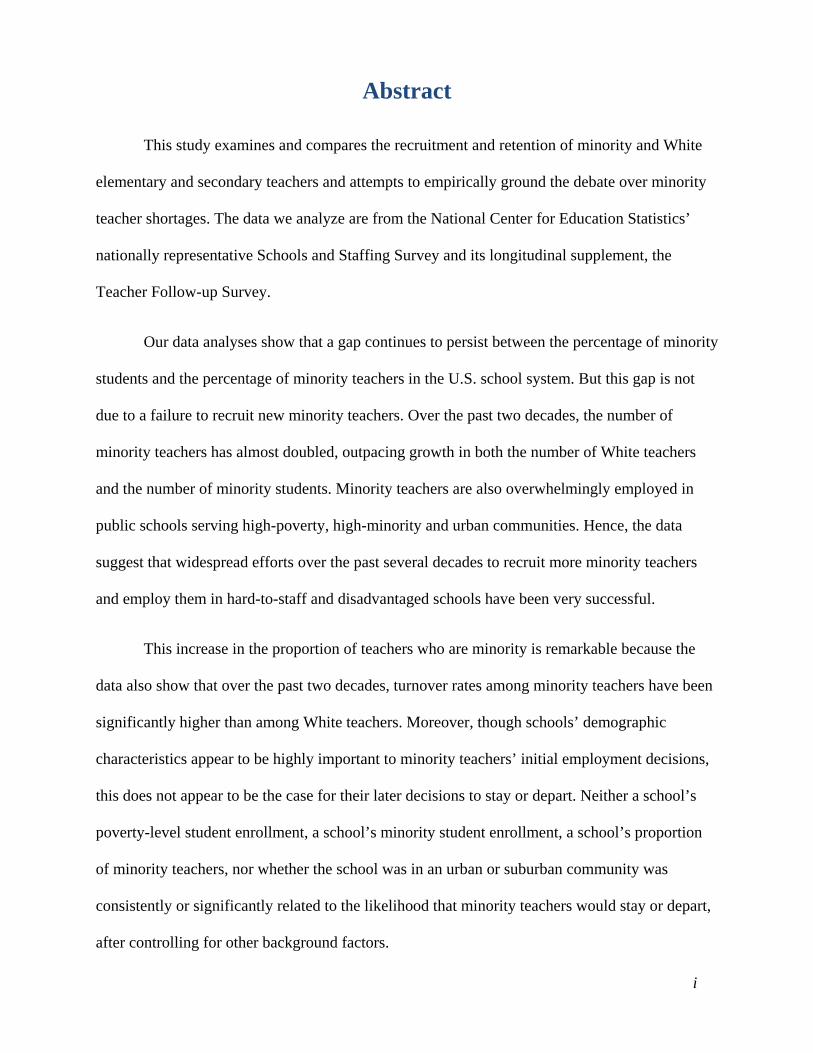
This study examines and compares the recruitment and retention of minority and White
elementary and secondary teachers and attempts to empirically ground the debate over minority
teacher shortages. The data we analyze are from the National Center for Education Statistics’
nationally representative Schools and Staffing Survey and its longitudinal supplement, the
Teacher Follow-up Survey.
Our data analyses show that a gap continues to persist between the percentage of minority
students and the percentage of minority teachers in the U.S. school system. But this gap is not
due to a failure to recruit new minority teachers. Over the past two decades, the number of
minority teachers has almost doubled, outpacing growth in both the number of White teachers
and the number of minority students. Minority teachers are also overwhelmingly employed in
public schools serving high-poverty, high-minority and urban communities. Hence, the data
suggest that widespread efforts over the past several decades to recruit more minority teachers
and employ them in hard-to-staff and disadvantaged schools have been very successful.
This increase in the proportion of teachers who are minority is remarkable because the
data also show that over the past two decades, turnover rates among minority teachers have been
significantly higher than among White teachers. Moreover, though schools’ demographic
characteristics appear to be highly important to minority teachers’ initial employment decisions,
this does not appear to be the case for their later decisions to stay or depart. Neither a school’s
poverty-level student enrollment, a school’s minority student enrollment, a school’s proportion
of minority teachers, nor whether the school was in an urban or suburban community was
consistently or significantly related to the likelihood that minority teachers would stay or depart,
after controlling for other background factors.
i
In contrast, organizational conditions in schools were strongly related to minority teacher
departures. Indeed, once organizational conditions are held constant, there was no significant
difference in the rates of minority and White teacher turnover. The schools in which minority
teachers have disproportionately been employed have had, on average, less positive
organizational conditions than the schools where White teachers are more likely to work,
resulting in disproportionate losses of minority teachers. The organizational conditions most
strongly related to minority teacher turnover were the level of collective faculty decision-making
influence and the degree of individual classroom autonomy held by teachers; these factors were
more significant than were salary, professional development or classroom resources. Schools
allowing more autonomy for teachers in regard to classroom issues and schools with higher
levels of faculty input into school-wide decisions had far lower levels of turnover.
ii
1
Introduction
Over the past several decades, there has been much concern over shortages of minority
school teachers. Numerous scholars and commentators have argued that there is a growing
mismatch between the degree of racial/ethnic diversity in the nation’s student population and the
degree of diversity in the nation’s elementary and secondary teaching force (for reviews, see
Quiocho & Rios, 2000; Torres et al., 2004; Villegas & Lucas, 2004; Zumwalt & Craig, 2005).
Typically, critics have held that as the nation’s population, and in turn the nation’s student body,
has grown more diverse, the teaching force has not kept pace. Some go further—arguing that the
teaching force has changed in the opposite direction, becoming even less diverse and more
homogeneously White.
Critics make three related arguments for why this mismatch is detrimental and why
increasing the racial/ethnic diversity of the teaching force would be beneficial. The first focuses
on demographic parity. This argument holds that minority teachers are important as role models
for both minority and White students. The underlying assumption is that the racial/ethnic makeup
of the teaching force should reflect that of the student population, and that of the larger society.
With increasing racial/ethnic diversity in the larger society, proponents hold, there is accordingly
a growing need for more minority teachers as role models in schools (e.g., Carnegie Forum on
Education and the Economy, 1986; American Association of Colleges of Teacher Education,
1999; Banks, 1995; Cochran-Smith, 2004; Dilworth, 1992; Kirby et al., 1999).
A second related argument focuses on what is often called “cultural synchronicity”
(Irvine, 1988, 1989). This view holds that minority students benefit from being taught by
minority teachers, because minority teachers are likely to have “insider knowledge” due to
similar life experiences and cultural backgrounds. The assumption is that synchronicity is a
2
valuable resource in teaching and learning (Villegas & Irvine, 2010; Gandara & Maxwell-Jolley,
2000; Valencia, 2002; Haycock, 2001; Foster, 1994; Achinstein & Aguirre, 2008). Proponents of
this view cite a growing number of empirical studies showing that minority teachers have a
positive impact on various outcomes for minority students (for a review, see Villegas & Lucas,
2004).
A third related argument concerns teacher shortages in general. Minority teachers not
only are likely to be well suited to teach minority students, this view holds, but they are also
likely to be motivated by a “humanistic commitment” to making a difference in the lives of
disadvantaged students. In turn, this argument holds, minority teachers are more likely than non-
minority candidates to seek employment in schools serving predominantly minority student
populations, often in low-income, urban school districts (e.g., Foster, 1997; Haberman, 1996;
Murnane et al., 1991; Ladson-Billings, 1995; Quiocho & Rios, 2000). Research has shown that
these same kinds of schools—urban, poor public schools serving minority students—
disproportionately suffer from general teacher shortages (e.g., Liu et al., 2008). Hence,
diversification of the teaching force in this view is a solution to the more general problem of
teacher shortages in disadvantaged schools.
As a result of these various factors—a lack of minority teacher role models, insufficient
cultural synchronicity between teachers and minority students, and a general dearth of qualified
teachers in disadvantaged schools—critics have concluded that the minority teacher shortage has
resulted in unequal access to adequately qualified teachers and, hence, to quality teaching, in
poor, urban public schools serving minority students. Unequal access to educational resources,
such as qualified teachers, has long been considered a primary cause of the stratification of
educational opportunity and, in turn, the achievement gap and, ultimately, unequal occupational
3
outcomes for disadvantaged students (e.g., Dreeben & Gamoran, 1986; Oakes, 1985, 1990;
Rosenbaum, 1976; Wilson, 1996).
Critics have identified several factors behind these minority teacher staffing problems
(for reviews, see Zumwalt & Craig, 2005; Villegas & Irvine, 2010). These factors concern
different stages in the pipeline of supply into the teaching occupation. One prominent factor, this
view holds, has been that minority student underachievement in elementary and secondary
education has resulted in fewer minority students entering the post-secondary level, and lower
graduation rates for those who do enter college (e.g., Banks, 1995). In turn, as career and
employment options available to minorities have broadened, a shrinking share of this shrinking
number of minority college graduates have entered teaching. Finally, this view holds, when
minority candidates do seek to enter teaching, the growth of occupational entry tests, coupled
with lower pass rates on these tests by minority teaching candidates, has meant that fewer
minority candidates are successful.
The prevailing policy response to these minority teacher staffing problems has been to
attempt to increase the supply of minority teachers (see, e.g., Hirsch, Koppich, & Knapp, 2001;
Feistritzer, 1997; Liu et al., 2008; Rice, Roellke, Sparks, & Kolbe, 2008). Over the past several
decades, organizations such as the Education Commission of the States (2003), the American
Association of Colleges of Teacher Education (1999), and the National Educational Association
(National Collaborative on Diversity in the Teaching Force, 2004) have advocated and
implemented a wide range of initiatives designed to recruit minority candidates into teaching.
Beginning in the late 1980s, the Ford Foundation, the DeWitt Wallace-Readers’ Digest Fund and
other foundations committed substantial funding to recruiting and preparing minority teachers.
These efforts have included future educator programs in high schools, partnerships between
4
community colleges with higher minority student enrollments and four-year colleges with
teacher education programs, career ladders for paraprofessionals already in the school system,
and alternative certification programs (e.g., Zeichner, 1996; Zeichner & Gore, 1990; Shen, 1998;
Clewell & Villegas, 2001; Lau et al., 2007). Many of these initiatives have been designed to
recruit minority teachers to teach in schools serving predominantly minority student populations,
often in low-income, urban school districts. Some of these initiatives have been designed to
recruit male minority teachers—often considered the group in shortest supply (e.g., Lewis, 2006;
Norton, 2005). By 2005, 36 states had minority teacher recruitment policies (Villegas & Irvine,
2010).
Nonetheless, there has been a surprising dearth of empirical investigation, especially
using nationally representative data, into how the minority teaching force has changed over
recent decades, whether there is still insufficient employment of minorities in teaching, and
where minority teacher staffing problems originate. Underlying most of the research,
commentary and policy on this issue has been the assumption, largely untested, that minority
teacher staffing problems are rooted in the front end of the teacher supply pipeline. The
assumption has been that an inadequate initial supply, coupled with barriers to entry, are the
main reasons that insufficient numbers of minority teachers are employed. Thus attention has
tended to focus on identifying obstacles to recruiting minority candidates into teaching and, in
turn, developing strategies to overcome these obstacles (Villegas & Lucas, 2004; Villegas &
Irvine, 2010).
In contrast, little attention has been paid to where minority teachers tend to be employed,
what happens to minority teachers once they are employed, or to the role in these staffing
problems of the organizations that employ teachers. Moreover, relatively less attention has been
5
paid to the exit end of the pipeline and the role of teacher turnover—the departures of teachers
from schools—in these shortages and staffing problems (Rice et al., 2008). As a recent review
concluded, empirical research on minority teacher turnover has been limited, has had mixed
findings, and, in general, has been inadequate to help us address the magnitude, determinants and
consequences of minority teacher turnover, or understand the implications of retention and
turnover for shortages (Achinstein et al., 2010). This study begins to address these gaps.
The Study
This study uses nationally representative data to empirically ground the debate over
minority teacher shortages. We examine trends in the recruitment, employment and retention of
minority teachers, using several sets of research questions:
1. Trends in Minority Teacher Recruitment and Employment
In recent decades, what changes have there been in the numbers of minority students and
numbers of minority teachers in the school system, and how does this compare with White
students and teachers? Is there more or less racial/ethnic diversity in the teaching force? Have
there been changes in the student-to-teacher race/ethnicity gap, that is, the difference between the
percentage of minority students and the percentage of minority teachers in the school system?
What is the distribution of teachers across the school system, by their race/ethnicity? Are
minority teachers more likely than White teachers to be employed in schools serving high-
poverty, urban, and high-minority student populations? How do the organizational and working
conditions of minority teachers’ schools compare to those of White teachers?
6
2. Trends in Minority Teacher Turnover
In recent decades, what have been the rates and magnitude of minority teacher turnover—
both those moving between schools and those leaving teaching altogether? How does this
compare to White teachers? What is the role of minority teacher turnover in the staffing
problems of schools and in the minority teacher shortage?
3.) The Determinants of Minority Teacher Turnover
What are the reasons behind the turnover of teachers and does this differ by their
race/ethnicity? What proportion of minority and White teacher turnover is due to retirement? Are
the demographic characteristics of schools associated with the departures of teachers, and does
this differ by the race/ethnicity of teachers? Are minority teachers less likely than White teachers
to depart from schools serving high-poverty, urban, and high-minority student populations?
What role do job and organizational conditions (e.g., salary levels, administrative support,
faculty decision making influence, teachers’ classroom autonomy, student discipline and
behavioral problems, availability of classroom instructional resources, teacher professional
development) play in the turnover of minority teachers, and how does this compare with White
teachers?
Our theoretical perspective, drawn from organizational theory and from the sociology of
organizations, occupations and work, is that teacher employment and staffing issues, like those in
other industries, cannot be fully understood without “putting the organization back” into the
analysis (cf. Stolzenberg, 1978; Baron & Bielby, 1980; Kalleberg, 1989; Hirsch & Lounsbury,
1997). Employee supply, demand, and turnover are central issues in organizational theory and
research (e.g., Price, 1977, 1989; Hom & Griffeth, 1995). However, there have been few efforts
to apply this theoretical perspective to understanding employee staffing problems in education.
7
By adopting this perspective, we seek to discover the extent to which staffing problems in
schools can be usefully reframed from macro-level issues, involving inexorable societal
demographic trends, to organizational-level issues, involving policy-amenable aspects of
particular districts and schools. The central premise of our study is that fully understanding
minority teacher shortages and staffing problems requires not only examining the supply pipeline
before employment, but also examining what happens to teachers once they are employed and
examining the organizational characteristics of the workplaces where teachers are employed (see
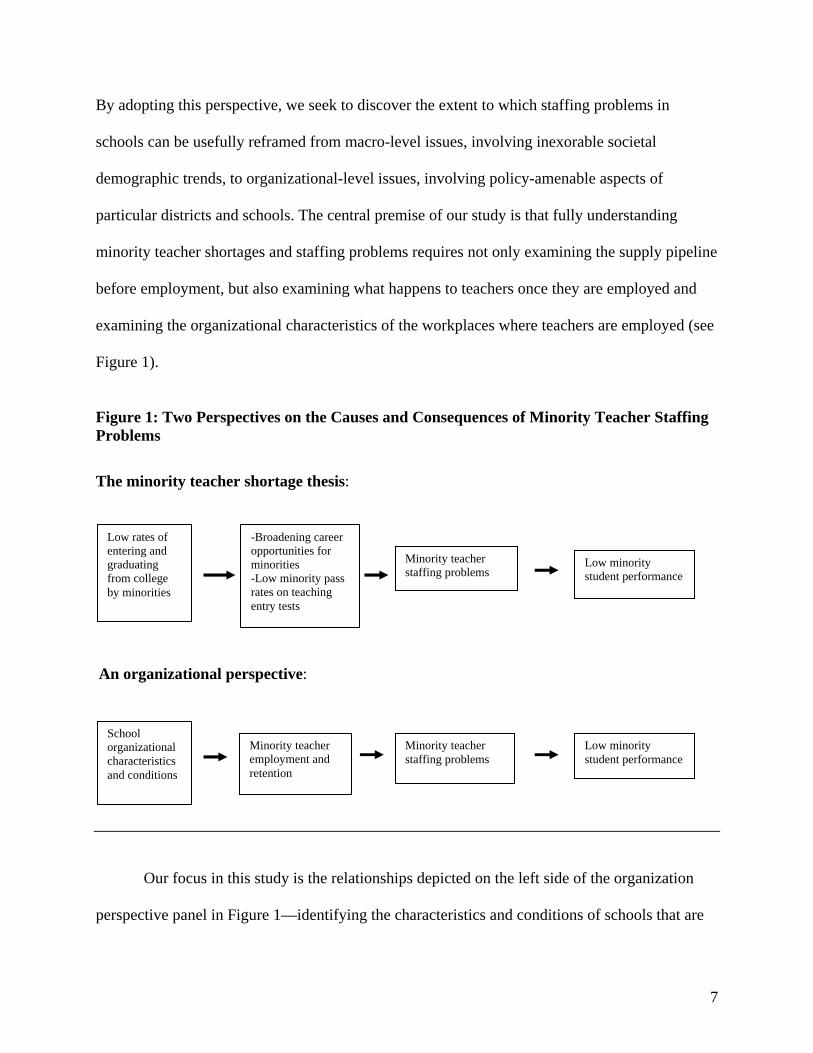
Figure 1).
Figure 1: Two Perspectives on the Causes and Consequences of Minority Teacher Staffing Problems
The minority teacher shortage thesis:
An organizational perspective:
Our focus in this study is the relationships depicted on the left side of the organization
perspective panel in Figure 1—identifying the characteristics and conditions of schools that are
-Broadening career opportunities for minorities -Low minority pass rates on teaching entry tests
Low minority student performance
School organizational characteristics and conditions
Minority teacher employment and retention
Minority teacher staffing problems
Low rates of entering and graduating from college by minorities
Low minority student performance
Minority teacher staffing problems
8
related to minority teacher employment and turnover and documenting the role that minority
teacher turnover plays in minority teacher staffing problems. Note that our focus is not on the
relationships depicted on the right side of Figure 1, or whether teaching force diversification is
positive or negative, or its impact on achievement.
In the next section, we describe our data sources and define key terms and measures. In
the following sections, we present our results sequentially for each of our three research
questions. We then conclude by discussing the implications of our findings for understanding
and addressing the minority teacher shortage.
Data and Methods
Data
The data for this study come from the National Center for Education Statistics’ (NCES)
nationally representative Schools and Staffing Survey (SASS) and its supplement, the Teacher
Followup Survey (TFS). This is the largest and most comprehensive data source available on the
staffing, occupational, and organizational aspects of elementary and secondary schools. The U.S.
Census Bureau collects the SASS data for NCES from a random sample of schools stratified by
state, public/private sector, and school level (for information on SASS, see NCES, 2005). There
have been six SASS cycles to date—1987-88; 1990-91; 1993-94; 1999-00; 2003-04; 2007-08.
Each cycle of SASS includes separate (but linked) questionnaires for school and district
administrators and for a random sample of teachers in each school. After 12 months, the same
schools are again contacted, and all those in the original teacher sample who had departed from
their school are given a second questionnaire to obtain information on their departures. The TFS
comprises this latter group, along with a representative sample of those who stayed in their
9
teaching jobs. Unlike most previous data sources on teacher turnover, the TFS is large,
comprehensive, and nationally representative, and it includes the reasons teachers themselves
give for their departures along with a wide range of information on the characteristics and
conditions of the schools that employ teachers. It also is unusual in that it does not focus solely
on a particular subset of separations, but includes all types of departures. (For information on the
TFS, see Chandler et al., 2004.)
Our analysis uses data from all six cycles of SASS/TFS to examine trends. We focus on
the 2003-04 SASS and the 2004-05 TFS for our primary analyses. The 2004-05 TFS has the
advantage of having a larger sample size than the more recent 2008-09 cycle of TFS. The 2003-
04 SASS sample comprises 43,358 White and 7,865 minority elementary and secondary
teachers. The 2004-05 TFS sample comprises 6,118 White and 1,311 minority elementary and
secondary teachers. This analysis uses data weighted to compensate for the over- and under-
sampling of the complex stratified survey design. Each observation is weighted by the inverse of
its probability of selection in order to obtain unbiased estimates of the national population of
schools and teachers in the year of the survey.
Measures and Methods
Our classification of minority teachers and White teachers is based on the SASS teacher
respondent’s self identification of their race/ethnicity in SASS questionnaires. Non-minority
refers to White, non-Hispanic. Minority includes those self identifying as Black or African
American, Asian, American Indian/Alaska Native, native Hawaiian/Pacific Islander, Hispanic
and multiple races. In 2003-04, the percentages for these minority groups were, respectively,
7.4%, 1.4%, .6%, .2%, 6%, and .7%. These groups are, of course, not homogeneous, between or
within, hence drawing conclusions about minority teachers as a whole runs the risk of
10
overgeneralizing. However, underlying our study is the assumption that patterns across
subgroups can be informative. In a companion study, Connor (2011) focused specifically on
Black and African American teachers, comparing them to White teachers. His findings on
turnover were similar to those reported in our study.
Our analysis has two stages. In the first stage, we present mostly descriptive statistics to
address our three research questions. In the second stage, we follow up with a detailed multiple
logistic regression analysis of the predictors of turnover to further address the third research
question. Below, we describe these stages of our analysis.
In the first stage, we examine data on trends in the relative numbers of minority and
White students and minority and White teachers, data on differences in the types of schools in
which minority and White teachers are employed, and data on trends in the turnover rates of
minority and White teachers.
Research on teacher turnover has often focused solely on those leaving the occupation
altogether, here referred to as teacher attrition, and has often de-emphasized those who transfer
or move to different teaching jobs in other schools, here referred to as teacher migration. The
logic is that teacher migration is a less significant form of turnover because it does not increase
or decrease the overall supply of teachers, as do retirements and career changes and, hence, does
not contribute to overall shortages. From a systemic level of analysis, this is probably correct.
However, from the organizational perspective of this study, employee migration is as relevant as
employee attrition. The premise underlying our perspective is that whether those departing are
moving to a similar job in another organization or leaving the occupation altogether, their
departures similarly impact and are impacted by the organization. For this same reason, the
distinction between attrition and migration is rarely noted in the larger literature on employee
11
turnover, and research on other occupations and organizations almost always includes both (see,
e.g., Price, 1977). We also include both, and we examine them both separately and together.
We then examine the reasons teachers themselves give for their migration and attrition,
drawn from sets of items in the TFS questionnaire that asked teacher-respondents to indicate the
importance of various factors for their departures. Self-report data such as these are useful
because those departing are, of course, often in the best position to know why they are leaving.
But such data are also based on subjective attributions by those who departed, introducing
possible attribution bias. Moreover, the items are often general (e.g., “dissatisfied with
teaching”), and do not indicate which aspects of teaching, or of schools, are related to turnover.
To address these limits, we follow up in our second stage with a regression analysis that
examines the association with turnover of a more specific set of school organizational
characteristics/conditions, based on data from the full and larger sample of respondents in the
2003-04 SASS (including both those who stayed and those who later departed). Because we
establish in the first stage of our analysis that over 90% of minority school teachers are employed
in public schools, and the majority of these are concentrated in schools serving high-poverty,
high-minority or urban communities, we focus on the public sector in our regression models.
In the regression models, the dependent variable—teacher turnover—is based on whether
each teacher remained with the school, moved to another school, or left teaching within one year
after the 2003-04 SASS administration. The TFS includes only about 12% of teachers from the
original SASS sample. To increase the sample size for our regression analyses, we combined the
TFS measure of turnover with another measure of turnover collected from school principals (the
teacher Status variable) for the entire SASS public school teacher sample, increasing our
effective sample size from about 5,300 to 43,000 teachers.i
12
We cumulatively examine three groups of predictors of turnover: teacher characteristics,
school characteristics, and organizational conditions. Table 1 defines for these variables. Table 2
provides mean teacher characteristics, school characteristics, and organizational conditions
associated with the teachers in the combined SASS/TFS sample.
Following previous research on teacher turnover, in the regression models we include
control variables for two key individual teacher characteristics: gender and age. Because it has
been found to have a U-shaped relationship to turnover (Ingersoll, 2001), we transform age into a
three-category set of dummy variables—younger (less than 30), middle-aged (31-50), and older
(greater than 50).
Following previous research on school organization (e.g., Bryk et al., 1990; Chubb &
Moe, 1990; Coleman & Hoffer, 1987), in the regression models we include, as independent
variables, school characteristics typically found to be important in this literature: school level and
school size.
To examine the role of school demographic characteristics, we also include measures of
whether the school is urban, rural, or suburban, the proportion of each school’s student
population at or below the poverty level (i.e., eligible for free or reduced lunch), the proportion
of each school’s student population that is minority, and proportion of the school faculty that is
minority. Because these demographic factors are often highly inter-correlated and confounded,
we estimate their effects both separately and simultaneously in conjunction to discern the extent
to which they are independent or redundant.
Finally, after controlling for the above teacher and school factors, we focus on the
relationship to turnover of eight key aspects of the organizational character and conditions in
schools: teacher salary, student discipline problems, school leadership and support, school
13
resources, faculty school-wide decision-making influence, teacher classroom autonomy, teacher
professional development activities focused on student discipline and classroom management,
and professional development activities focused on the teacher’s subject-area content. This study
does not attempt to provide a comprehensive analysis of all the many aspects of schools that may
impact the turnover of minority teachers. We focus on this set of eight particular characteristics
of schools because they have long been considered among the important aspects of effective
school organization (see, e.g., Goodlad, 1984; Coleman & Hoffer, 1987; Grant, 1988; Chubb &
Moe, 1990; Bryk et al., 1990), are ostensibly policy amenable, and are available from our data
source.
Unlike most empirical analyses, which use either individual teacher’s salaries or the
school’s mean teacher salary, we use the normal yearly base salary for teachers at the highest
step on the district or school salary schedule because it better assesses differences in the
organizational-level compensation structure.ii As defined in Table 1, for the other seven
measures of organization conditions we use school means of teachers’ responses to sets of items
in the teacher questionnaire.
This second stage of the analysis examines whether the likelihood that individual teachers
will move from or leave their teaching jobs is related to the above measures of school
organizational characteristics and conditions, while controlling for individual-level
characteristics of teachers and school-level characteristics. Because different school
organizational conditions are often interrelated, and their relationship to turnover is possibly
confounded, we estimate the coefficients for each measure of school organizational conditions
both in separate models and simultaneously.
14
Table 1. Definitions of Measures Utilized in the Regression Analysis
Teacher Turnover: a dichotomous variable where 0 = stayer/currently teaching in same school and 1 = not teaching in same school as last year.
Teacher Characteristics · Younger: a dichotomous variable where 1 = teacher less than 30 years of age and 0 = other teachers. · Older: a dichotomous variable where 1 = teacher older than 50 years of age and 0 = other teachers. · Male: a dichotomous variable where 1 = male teacher and 0 = female teacher.
School Characteristics · Secondary Level: a dichotomous variable where 1 = junior or senior secondary and 0 = elementary or middle
or combined (K-12). · School Size: student enrollment of school. · Rural: a dichotomous variable where 1 = rural and 0 = suburban or urban. · Suburban: a dichotomous variable where 1 = suburban and 0 = rural or urban. · Poverty Enrollment: percentage of students eligible for the federal free or reduced-price lunch program for
students from families below poverty level · Minority Enrollment: percentage of minority students · Minority Faculty: percentage of minority teachers
Organizational Conditions · Highest Salary: for districts with a salary schedule for teachers, normal yearly base salary highest step, or if
no district salary schedule, the highest teacher yearly base salary, as reported by school administrators. · Student Discipline Problems: on a scale of 1 = never happens to 5 = happens daily, the school mean of
teachers’ reports for eight kinds of student discipline problems: disruptive behavior; absenteeism; physical conflicts among students; robbery; vandalism; weapon possession; physical abuse of teachers; verbal abuse of teachers.
· School Leadership Support: on a scale of 1 = strongly disagree to 4 = strongly agree, the school mean of teachers’ reports for four items: principal communicates expectations; administration is supportive; principal enforces rules for student discipline; principal communicates objectives; staff are recognized for job well done.
· School Resources: on a scale of 1 = strongly disagree to 4 = strongly agree, the school mean of teachers’ reports for one item: necessary materials such as textbooks, supplies and copy machines are available as needed by the staff.
· Faculty Influence: on a scale of 1 = none to 4 = a great deal, the school mean of collective school-wide faculty influence over seven areas: student performance standards; curriculum; content of in-service programs; evaluating teachers; hiring teachers; school discipline policy; deciding spending of budget.
· Teacher Autonomy: on a scale of 1 = none to 4 = a great deal, the school mean of individual teacher’s control in their classroom over six areas: selecting textbooks and other instructional materials; selecting content, topics and skills to be taught; selecting teaching techniques; evaluating and grading students; determining the amount of homework to be assigned; disciplining students.
· Discipline-Focused Professional Development: on a scale of 1 = not receive or not useful to 4 = very useful, the school mean of teachers’ reports of the usefulness of any professional development activities that focused on student discipline and management in the classroom.
· Content-Focused Professional Development: on a scale of 1 = not receive or not useful to 4 = very useful, the school mean of teachers’ reports of the usefulness of any professional development activities that focused on the content of the subjects they taught.
We used factor analysis (with varimax rotation method) to evaluate our indices of student discipline problems, school leadership, faculty influence and teacher autonomy. We considered item loadings of at least .4 necessary for inclusion in a factor. No items loaded on more than one factor. Each factor had high internal consistency (a > .7). The measures of student discipline problems, leadership, resources, faculty influence, teacher autonomy and professional development are all school means of the reports of the larger total SASS teacher sample for each school and not limited to the reports of those in the smaller TFS sample.
15
Table 2. Descriptive Statistics for Independent Variables Used in Regression Analysis
Proportion
Categorical Predictor Variables All Teachers White Minority
Teacher Characteristics Younger .17 .16 .17 Older .30 .31 .25 Male .25 .25 .24
School Characteristics Secondary Level .30 .30 .28 Rural .19 .21 .11 Suburban .52 .55 .39
Mean
(Std. Dev.)
Continuous Predictor Variables All Teachers White Minority
School Characteristics School Size (in 100s) 8.04
(6.07) 7.87
(5.94) 8.9
(6.59) Poverty Enrollment (in 10s) 4.12
(2.93) 3.7
(2.73) 6.22
(2.99) Minority Enrollment (in 10s) 4.12
(2.93) 3.54 (3.3)
7.49 (2.98)
Minority Faculty (in 10s) 15.5 (22.9)
10.1 (16.3)
42.83 (30.62)
Organizational Conditions Highest Salary (in 10,000s) 6.08
(1.30) 6.06
(1.33) 6.20
(1.18) Student Discipline Problems (scale 1-5) 2.29
(0.71) 2.28 (0.7)
2.35 (0.73)
School Leadership Support (scale 1-4) 3.32 (0.65)
3.32 (0.65)
3.33 (0.67)
School Resources (scale 1-4) 3.14 (0.89)
3.17 (0.87)
3.0 (0.95)
Faculty Influence (scale 1-4) 2.21 (0.61)
2.21 (0.6)
2.24 (0.68)
Teacher Autonomy (scale 1-4) 3.38 (0.52)
3.40 (0.51)
3.3 (0.54)
Discipline-Focused Prof. Dev. (scale 1-4) 1.77 (1.04)
1.73 (1.01)
1.97 (1.14)
Content-Focused Prof. Dev. (scale 1-4) 2.64 (1.03)
2.60 (1.02)
2.79 (1.04)
Note: Means and deviations are at the teacher level and are associated with teachers in the sample.
16
As mentioned above, our measures of organizational conditions, other than salaries, are
based on teachers’ self reports. Teachers’ responses in any individual school, of course, may
vary because teachers in the same building may perceive various conditions differently. In
background analyses, we partitioned the variance of each measure of organizational conditions
into within-school and between-school components. The intraclass correlation, or the portion of
the variation that lies between schools, ranged from 13% for subject-area professional
development to 43% for student discipline, indicating that part of each measure is unique to each
teacher respondent and that part is common to all teachers within a school. Elsewhere, we have
explicitly compared the relative association with turnover of these two levels of measures of
organization conditions (see Ingersoll & May, 2010). Our focus here is on whether particular
school-wide organizational conditions on average are related to minority and White turnover.
Hence, for our measures of organizational conditions, we calculate averages across the entire
sample of teachers in each school.
Our analysis used PROC GENMOD in SAS (version 9.2) because it adjusts for the non-
random clustering of teachers within schools resulting from the multilevel structure of the
sample and uses within- and between-school predictor variables to estimate separate effects
across multiple levels. This procedure also supports logistic regression and allows for inclusion
of sampling design weights. Weights are necessary because the SASS and TFS over- or under-
sample certain segments of the teaching population. Though the TFS data are longitudinal in the
sense that the turnover outcomes transpired a year after the collection of the SASS measures of
school characteristics and organizational conditions, it is important to note that any relationships
found between these variables and turnover represent statistical associations between measures
and do not imply causality.
17
Results
Trends in Minority Teacher Recruitment and Employment
The data show that minority teachers continue to represent a small portion of the teaching
force and that a gap persists between the percentage of minority students and the percentage of
minority teachers in the U.S. school system. For instance, in the 2007-08 school year, 34% of the
nation’s population was minority, 41% of all elementary and secondary students were minority,
and only 16.5% of all elementary and secondary teachers were minority. But the data also show
that this gap is not due to a failure to recruit minority teachers. Indeed, efforts to recruit
minorities appear to have been highly successful.
After a period of decline during the 1970s, elementary and secondary student enrollments
began to grow steadily in the U.S., beginning in the mid-1980s and continuing to the present. As
Table 3 shows, over the two decades between 1988 and 2008, the elementary and secondary
student population as a whole increased by 19%. But this varied by the race/ethnicity of students.
While the number of White students decreased by 2% during those two decades, the number of
minority students increased by 73%.
The teaching force, as a whole, also increased over this same two-decade period but,
strikingly, by 48%—a rate over two times that of the overall growth rate for students of 19%.
Elsewhere we present a closer examination of the reasons behind this relatively dramatic growth
in the teaching force (see, Ingersoll & Merrill, 2010); our focus here is on increase of teachers by
their race/ethnicity. While the number of White teachers increased by 41%, the number of
minority teachers increased by 96% (see Figure 2).
18
Hence, in recent decades the rate of growth in the number of minority teachers has
outpaced that of minority students and that of White teachers. As a result, in spite of the overall
ballooning of the teaching force, the percentage of minority teachers has increased, from 12.4%
to 16.5%. Nevertheless, in spite of this increased diversity in the teaching force, the school
system is no closer to demographic parity; that is, there remains a gap between the percentage of
minority students and the percentage of minority teachers. This is largely due to a decline in the
number of White students in recent decades.
There have also been some interesting differences in gender by race/ethnicity; the
teaching force has become more female, but this differs by race/ethnicity. While the number of
White female teachers increased by 51% during this period, the number of White male teachers
increased by only 18%. At the same, the number of minority female teachers increased by 97%,
and the number of minority male teachers increased by 92%. In 2008, males represented about
one quarter of both the White and minority portions of the teaching force.
The large increase in minority teachers has also not been evenly distributed across
schools. The data show that less than one tenth of minority teachers work in private schools,
while the majority of minority teachers are concentrated in public schools serving high-poverty,
high-minority or urban communities.
To illustrate the public sector distribution for 2003-04, we subdivided the public teaching
force into quartiles accordingly to the poverty and minority student enrollments of their
schools.iii
19
Table 3. Trends in the Nation’s Population, K-12 Student Enrollment, and the K-12 Teaching Force, by Race/Ethnicity
1987-88 School Year
1990-91 School Year
1993-94 School Year
1999-00 School Year
2003-04 School Year
2007-08 School Year
% Increase From 1988-2008
1.) % Minority Population of U.S. 23.1 24.3 25.6 28.1 32.1 34.4
2.) Total Student Enrollment 45,220953 44,777,577 46,592,207 50,629,075 52,375,110 53,644,872 19
Number White Students 32,559,086 31,213,142 31,895,394 32,700,441 32,419,640 31,864,127 -2
Number Minority Students 12,661,867 13,564,435 14,696,813 17,928,634 19,955,470 21,780,745 73
% Minority Students 28.0 30.3 31.5 35.4 38.1 40.6
3.) Total Teaching Force 2,630,335 2,915,774 2,939,659 3,451,316 3,717,998 3,894,065 48
Number White Teachers 2,303,094 2,542,720 2,564,416 2,933,591 3,113,249 3,252,234 41
Number Minority Teachers 327,241 373,054 375,243 517,725 604,749 641,830 96
% Minority Teachers 12.4 12.8 12.8 15.0 16.3 16.5
20
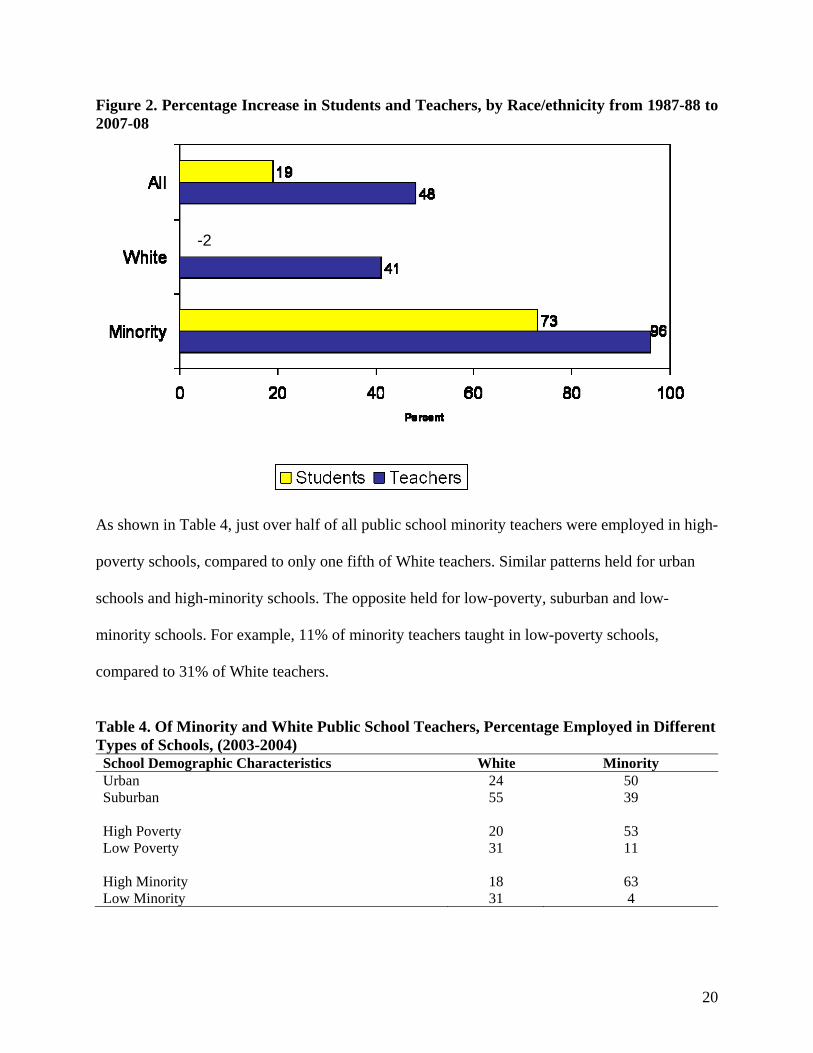
Figure 2. Percentage Increase in Students and Teachers, by Race/ethnicity from 1987-88 to 2007-08
As shown in Table 4, just over half of all public school minority teachers were employed in high-
poverty schools, compared to only one fifth of White teachers. Similar patterns held for urban
schools and high-minority schools. The opposite held for low-poverty, suburban and low-
minority schools. For example, 11% of minority teachers taught in low-poverty schools,
compared to 31% of White teachers.
Table 4. Of Minority and White Public School Teachers, Percentage Employed in Different Types of Schools, (2003-2004) School Demographic Characteristics White Minority Urban 24 50 Suburban 55 39 High Poverty 20 53 Low Poverty 31 11 High Minority 18 63 Low Minority 31 4
-2
21
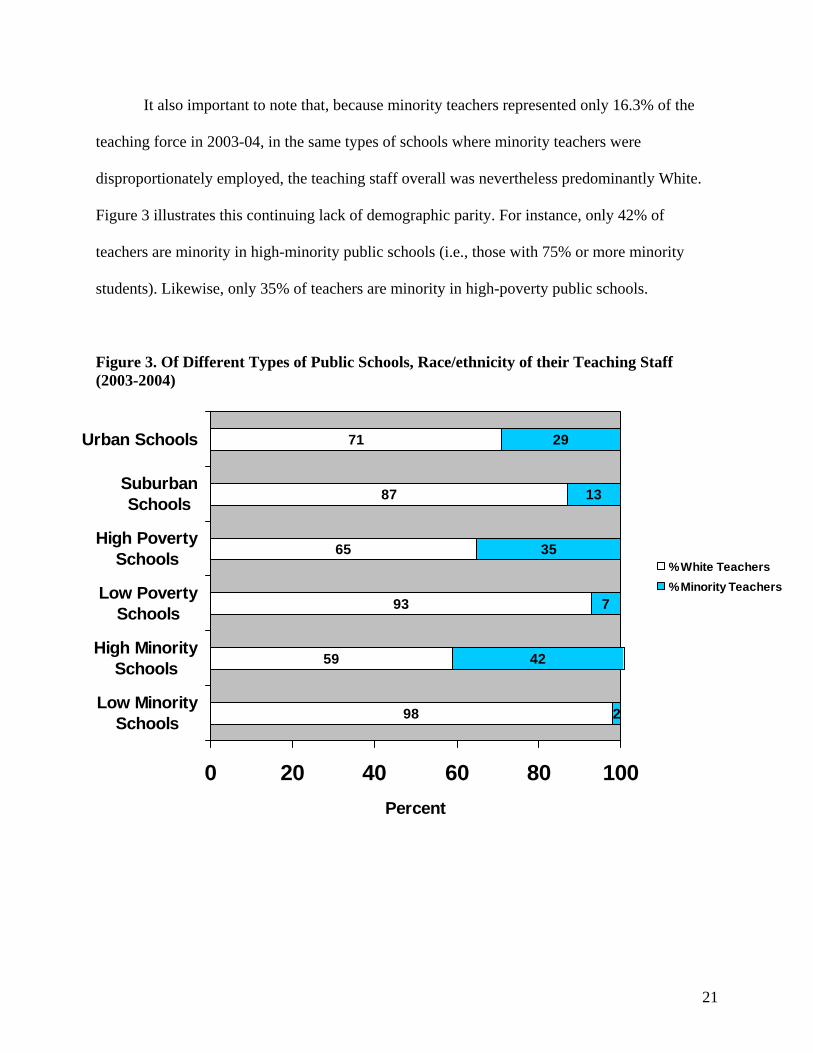
It also important to note that, because minority teachers represented only 16.3% of the
teaching force in 2003-04, in the same types of schools where minority teachers were
disproportionately employed, the teaching staff overall was nevertheless predominantly White.
Figure 3 illustrates this continuing lack of demographic parity. For instance, only 42% of
teachers are minority in high-minority public schools (i.e., those with 75% or more minority
students). Likewise, only 35% of teachers are minority in high-poverty public schools.
Figure 3. Of Different Types of Public Schools, Race/ethnicity of their Teaching Staff (2003-2004)
98
59
93
65
87
71
2
42
7
35
13
29
0 20 40 60 80 100
Low MinoritySchools
High MinoritySchools
Low PovertySchools
High PovertySchools
SuburbanSchools
Urban Schools
Percent
% White Teachers
% Minority Teachers
22
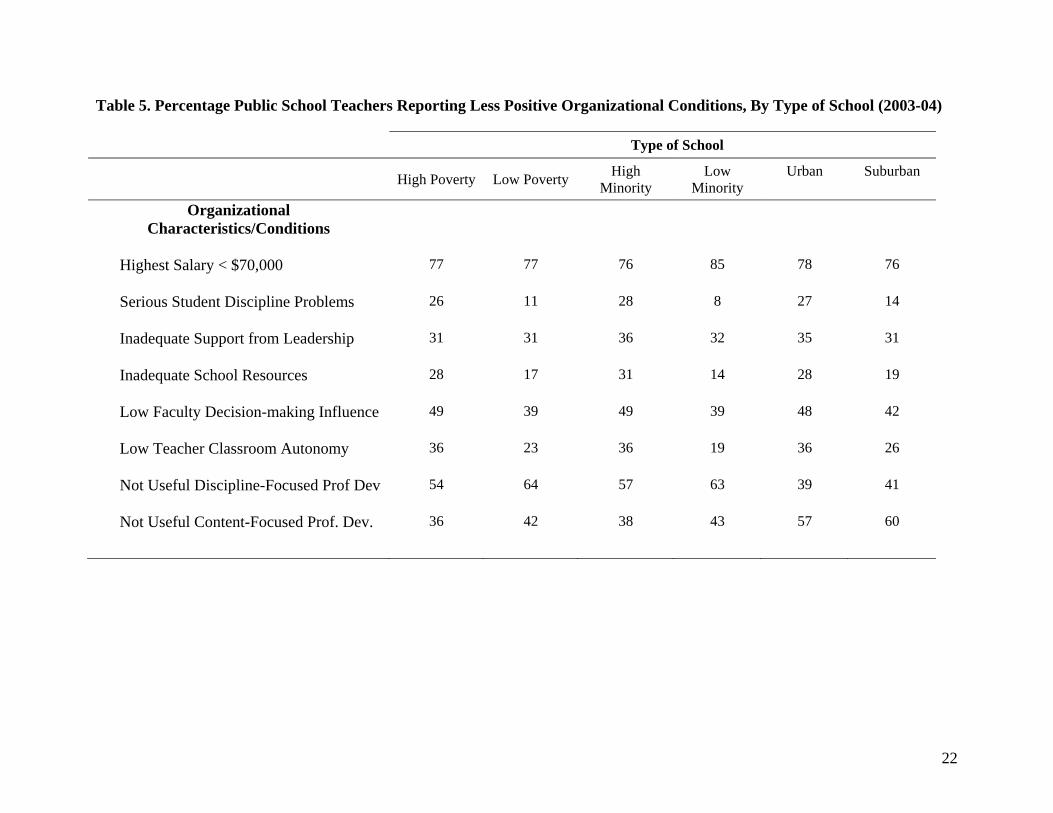
Table 5. Percentage Public School Teachers Reporting Less Positive Organizational Conditions, By Type of School (2003-04)
Type of School
High Poverty Low Poverty High
Minority Low
MinorityUrban Suburban
Organizational Characteristics/Conditions
Highest Salary < $70,000
77 77 76 85 78 76
Serious Student Discipline Problems
26 11 28 8 27 14
Inadequate Support from Leadership
31 31 36 32 35 31
Inadequate School Resources
28 17 31 14 28 19
Low Faculty Decision-making Influence
49 39 49 39 48 42
Low Teacher Classroom Autonomy
36 23 36 19 36 26
Not Useful Discipline-Focused Prof Dev
54 64 57 63 39 41
Not Useful Content-Focused Prof. Dev.
36 42 38 43 57 60
23
The data also show that organizational characteristics and conditions in these same kinds
of public schools differ. As Table 5 shows, teachers in high-poverty, high-minority, and urban
schools were often more likely to report less positive school organizational conditions than those
in low-poverty, low minority, and suburban schools.iv For instance, 26% of teachers employed in
high-poverty public schools reported the school having serious student discipline problems,
compared to 11% of teachers in low-poverty schools. Similarly, 28% of teachers in urban public
schools reported that textbooks and classroom supplies were inadequate, compared to 19% in
suburban public schools. Likewise, 36% of teachers employed in high-poverty public schools
reported having very low levels of classroom autonomy, compared to 23% of teachers in low-
poverty schools. On the other hand, there were not large differences across poor and not poor
schools in the maximum teacher salaries offered and in the case of useful professional
development, teachers in low-poverty public schools reported a less positive situation.
Trends in Minority Teacher Turnover
In the two decades from the late 1980s to 2009, despite some fluctuations, the annual rate
of overall teacher turnover (public and private) increased overall. This was especially true for
minority teachers, whose turnover rate increased by 28% during this period. Moreover, during
this period, the data also indicate that minority teachers tended to have higher rates of turnover
than White teachers (Table 6). As illustrated in Figure 4, for four of the six cycles of the TFS
data, total turnover rates for minorities were higher than those for White teachers, at a
statistically significant level. In none of the cycles were minority turnover rates lower than those
of White teachers at a statistically significant level. Moreover, this gap appears to have widened
in the last decade. In the 2004-2005 and 2008-09 school years, minority turnover was,
respectively, 18% and 24% higher than White teacher turnover.
24
Table 6. Percentage Annual Teacher Migration and Attrition, by Race/ethnicity of Teachers, and by Year Minority Teachers White Teachers Year Moves Leaves Total Moves Leaves Total 1988-89 9.2 5.9 15.1 7.9 6.5 14.4 1991-92 7.0 6.1 13.1 7.2 6.0 13.2 1994-95 9.2 7.6 16.8 6.7 7.2 13.9 2000-01 8.4 7.5 15.9 7.7 8.2 15.9 2004-05 9.0 10.4 19.4 7.6 8.8 16.4 2008-09 10.1 9.2 19.3 6.7 8.9 15.6
Teacher turnover is not necessarily detrimental. In general, theory and research from the
fields of organizational theory, economics and sociology have long held that some degree of
employee turnover is normal and inevitable, and can be efficacious for individuals, for
organizations, and for the economic system as a whole (e.g., Price, 1977, 1989; Jovanovic,
1979a, 1979b; Mobley, 1982; Abelson & Baysinger, 1984; Hom & Griffeth, 1995; Siebert &
19.3
19.4
15.9
16.8
13.1
15.1
15.6
16.4
15.9
13.9
13.2
14.4
0 10 20 30 40 50
2008-09
2004-05
2000-01
1994-95
1991-92
1988-89
Percent
White Teachers
Minority Teachers
Figure 4. Percent Annual Teacher Turnover, by Race/ethnicity of Teachers, by Year
25
Zubanov, 2009). Across a range of occupations and industries, job and career changing are
normal and common, perhaps increasingly so, and some hold that high levels of employee
turnover are a sign of economic opportunity and a dynamic, well-functioning economy (e.g.,
Kimmitt, 2007). Moreover, researchers have concluded that effective organizations usually
promote some degree of employee turnover and benefit from it by the departure of low-caliber
performers and the recruitment of “new blood” to facilitate innovation.
However, though there can be benefits to employee turnover, theory and research in these
fields have also long held that employee turnover is not cost free. There is a general consensus
that a variety of costs and consequences are associated with employee turnover, including the
loss of human capital and of investments in employee development, the cost of replacement
hiring and training, and disruption of production processes, and that such costs vary by industry
and occupation.
Elsewhere we examine in detail the levels of turnover in teaching compared to other
occupations and the benefits and costs of teacher turnover (see Ingersoll & Perda, 2011). Here
we focus on one consequence of the disproportionate loss of minority teachers—its implications
for the minority teacher shortage. Figure 5 illustrates the significance of minority teacher attrition
for minority teacher staffing using data from 2004-05 (the year with the highest annual level of
minority attrition in our two-decade period). The data show that at the beginning of the 2003-04
school year, about 47,600 minority teachers entered the school system; however, by the
following year, 20% more—about 56,000—left teaching.v Interestingly, if minority teacher
attrition in 2004-05 had been at a rate similar to that of White teachers that year (8.8%), then the
minority teacher outflow in Figure 5 would have been reduced to 47,521—about the same as the
inflow earlier that year.
26
Minority Teaching Force
604,749
Leaving56,244
Entering47,663
At Beginning of School Year During School Year After End of School Year
Some of those leaving teaching represent temporary attrition—those who leave for a year
or more and then return. Teachers who leave the occupation temporarily, of course, do not
produce a permanent loss of human capital from the teacher supply and, hence, do not
permanently contribute to overall shortages. In background analyses of the TFS data, we found
that 51% of minority teachers and 61% of White teachers who left in 2004-05 reported that they
would “consider returning to the position of K-12 teacher.” Not all of those who consider
returning do so. But significant numbers do return, and the re-entrance of former teachers is a
major source of new supply. Indeed, 35% of the 47,663 minority teachers in figure 5 who
entered teaching in the beginning of the 2003-04 school year were former teachers re-entering
the occupation. Our point here is that, regardless of whether we include temporary attrition in
Figure 5. Numbers of Minority Teachers Entering and Leaving Teaching Before and After the 2003-2004 School Year
27
both the inflow and outflow in Figure 5, high levels of minority teacher attrition result in a need
to continue—indeed, to increase—minority teacher recruitment to keep pace.
Teacher migration—those who transfer or move to different teaching jobs in other
schools—also has implications for minority teacher staffing problems. Migrants, of course, do
not represent a net loss of human capital from the teacher supply and, hence, do not permanently
contribute to overall systemic-level shortages. However, from an organizational-level
perspective, employee migration can result in disproportionate gains and losses of human capital
for particular kinds of schools.
Using the 2004-05 TFS data we were able to examine and compare the demographic
characteristics of the original and destination schools of migrants who went from one public
school to another. Interestingly, the data show that both minority and White teachers who moved
between schools in that year were most likely to go to schools that were similar demographically
to those from which they departed. For instance, in 2004-05, more than six times as many
minority teachers moved from high-poverty schools to other high-poverty schools than moved
from high-poverty schools to low-poverty schools. Similarly, almost three times as many
minority teachers moved from urban schools to other urban schools than moved from urban to
suburban schools. In the case of schools with different minority student populations, there was
little migration at all across school types. For instance, while over 20,000 minority teachers
moved from high-minority enrollment schools to other high-minority schools, only 550 minority
teachers moved from high-minority to low-minority schools.
However, high-poverty schools, high-minority schools, and urban schools all have far
higher rates of overall teacher migration than, respectively, low-poverty schools, low-minority
schools, and suburban schools. Despite the fact that teachers tend not to move to
28
demographically different schools, these higher overall rates from disadvantaged schools
resulted in a net loss of minority teachers from high-poverty to low-poverty schools and from
urban schools to suburban schools. For instance, of minority teachers who migrated between the
2004 and 2005 school years, almost twice as many moved from high-poverty schools to low-
poverty schools as the reverse.vi In sum, while minority teacher migration does not result in a net
loss to the system, it does result in a large annual asymmetric loss of minority teachers from
some of the same types of schools—urban and poor—in which minority teacher recruitment
efforts have long sought to place minority candidates. These patterns provide further support for
our theoretical perspective that fully understanding the minority teacher staffing problems of
schools requires examining those problems from the perspective of the organizations in which
they occur.
The Determinants of Minority Teacher Turnover
These data raise an important question: What are the reasons for and sources of these
levels and patterns of White and minority teacher turnover? One way to answer this question is
to examine self-report data from those who have moved or left. Tables 7 and 8 present data on
the percentage of teachers in the TFS who reported that particular reasons were “very” or
“extremely” important in their decisions to move or leave, on a five-point scale from “not
important” to “extremely important.” We grouped the individual reasons into categories as
shown. Note that the percentages in the tables add up to more than 100%, because respondents
could indicate more than one reason for their departures. Again, we focus here on public schools,
in which most minority teachers are employed.
As expected, retirement is a leading reason to leave teaching. Smaller portions of both
movers and leavers indicated that their moves or leaves were a result of school staffing actions—
29
such as their school being closed, or being laid off, transferred, reassigned or fired. Of those who
left teaching, minority teachers were slightly less likely than White teachers to report they were
laid off, terminated or reassigned.
Table 7. Of Public School Teachers Who Moved to Other Schools, Percentage Reporting Various Categories of Reasons Were Very or Extremely Important, by Race/ethnicity of Teachers, (2004-05)
White Minority
School Staffing Action 18.5 19.3
Family or Personal 25.8 28.1
To Pursue Other Job 43.7 49.1
Dissatisfaction with Job 57.5 63.2 Note. In Table 7, we grouped 11 reasons for moving in the questionnaire into four categories, as follows: (1) School Staffing Action: layoff/involuntary transfer (2) Family or Personal: new school closer to home (3) To Pursue Other Job: felt job security higher at another school; opportunity for better teaching assignment at new school (subject or grade level) (4) Dissatisfaction with Job: for better salary or benefits; dissatisfied with workplace conditions; dissatisfied with support from administration; dissatisfied with job responsibilities; lack of autonomy; dissatisfied with opportunities for professional development; dissatisfied with old school for other reasons. Table 8. Of Public School Teachers Who Left Teaching, Percentage Reporting Various Categories of Reasons Were Very or Extremely Important, by Race/ethnicity of Teachers (2004-05)
White Minority
Retirement 31.1 32.9
School Staffing Action 15.7 9.7
Family or Personal 43 45.3
To Pursue Other Job 29.4 35.4
Dissatisfaction with Job 30.7 35.3 Note. In Table 8, we grouped 12 reasons for leaving in the questionnaire into five categories, as follows: (1) Retirement (2) School Staffing Action: reduction-in-force/layoff/school closing/reassignment (3) Family or Personal: change in residence; pregnancy/child rearing; health; other family or personal reasons (4) To Pursue Other Job: to pursue position other than that of k-12 teacher; to take courses to improve career opportunities within education sector; to take courses to improve career opportunities outside of education sector (5) Dissatisfaction with Job: for better salary or benefits; dissatisfied with teaching as career; dissatisfied with previous school or teaching assignment

30
Relatively large and similar portions of White and minority teacher outflows, both
moving and leaving, were highly influenced by personal and family factors—a spouse’s job
required a move, health issues, closer proximity to a school, a desire to raise a family. These
types of job transitions are, no doubt, normal occurrences in any workplace, occupation, or
industry.
The most prominent set of factors behind both moving and leaving, according to teachers,
was a desire to obtain a different job or career, or dissatisfaction with some aspect of their
teaching job. This was even more true for minority teachers. Fifty-eight percent of White
teachers reported that dissatisfaction with some aspect of their school was behind their move to a
teaching job elsewhere; this was true for 64% of minority teachers. While 33% of minority
teachers who left teaching indicated retirement was a major reason, 35% reported a major reason
was dissatisfaction and 35% said it was due to desire for a better job. Unlike the first three
categories in Tables 7 and 8 (retirement, school staffing actions, and family/personal), the last
two categories (pursuing a different career or dissatisfaction) are more likely to be a matter of
choice—suggesting the importance of investigating the impact of job and organizational
conditions on these choices. But, as discussed in the Data/Methods section, there are limitations
to these self-report data. For instance, it is unclear what factors might be behind the large
portions of both White and minority teachers who departed for better jobs or because of
dissatisfaction.
We follow up below with a multivariate analysis examining a more specific set of school
organizational characteristics and conditions in public schools, based on data from the full set of
respondents in SASS, while controlling for other factors, such as teacher age, gender, school
grade level, school size and the demographic characteristics of schools.
31
Individual, School and Organizational Predictors of Minority Teacher Turnover
We estimated a series of regression models using the SASS/TFS data to examine whether
our predictor variables were associated with teacher turnover. The predictor variables and
associated regression estimates from each model are shown in Tables 9 and 10. To evaluate
whether relationships between the predictors and turnover differed by the teachers’
race/ethnicity, we separately estimated our models for minority teachers and for White teachers;
these are displayed side by side in the tables.
In Table 9, we sequentially entered the sets of measures for teacher characteristics and
school characteristics, then added the school demographic measures separately and, finally,
included all the measures in a full model. In Table 10, we sequentially added each of the
organizational condition variables to a basic model that included the set of teacher
characteristics, the set of school characteristics, and the set of school demographic measures.
As shown in Model 1 of Table 9, our analyses found that the individual demographic
characteristics of teachers were related to their likelihood of staying or departing at a statistically
significant level, after controlling for other factors. But this differed by the race/ethnicity of the
teacher. The age of teachers was a salient predictor of the likelihood of turnover, but only for
White teachers. Both younger (less than 30) and older (greater than 50) White teachers were far
more likely to depart than were middle-aged White teachers. For instance, the relative odds of
young White teachers departing were more than two times higher than for middle-aged White
teachers. In contrast, younger and older minority teachers did not depart at higher rates than
other minority teachers (Model 1). Gender was also a factor, but only for minority teachers. The
odds of male minority teachers departing were over 50% higher than for female minority
teachers; for Whites, there was little or no gender difference.
32
Some school characteristics were also related to turnover, but again this differed by the
race/ethnicity of the teacher. Minority teachers in smaller schools departed at higher rates; an
enrollment difference of 100 students was associated with a 3% difference in the odds of
minority teachers departing. For White teachers, the relationship with school size was very small
and not statistically significant.
As shown in Models 2, 3, 4 and 5, schools in urban areas, schools with higher
percentages of low-income students, schools with higher percentages of minority students, and
schools with higher percentages of minority teachers each had higher White turnover. For
instance, a 10 percentage point increase in the proportion of poverty-level students was
associated with a 6% increase in the odds of White teachers departing.
In contrast, there was no consistent or statistically significant relationship between the
likelihood of minority teachers departing and these demographic characteristics of schools (with
the exception of lower minority turnover in rural compared to urban schools). In other words,
after controlling for the background characteristics of teachers and schools, minority teachers, on
average, did not depart at significantly different rates from schools with different poverty levels,
with different minority student levels or with different proportions of minority faculty.
Model 6 includes all of these predictors simultaneously; it examines whether the effects
of the different measures of school demographics were independent or redundant. Interestingly,
after controlling for the other school demographic characteristics, the student poverty enrollment
of schools was no longer significantly related to White teacher turnover; minority enrollment and
minority faculty remain related, but with only borderline statistical significance.
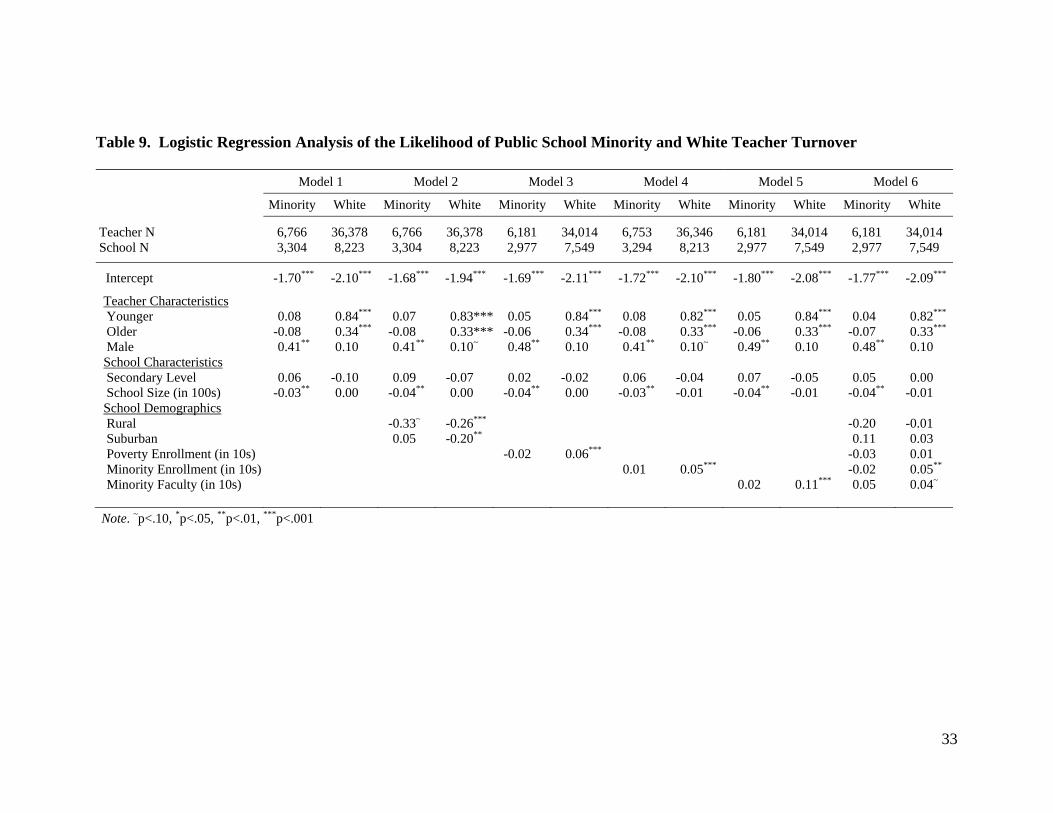
33
Table 9. Logistic Regression Analysis of the Likelihood of Public School Minority and White Teacher Turnover
Model 1 Model 2 Model 3 Model 4 Model 5 Model 6
Minority White Minority White Minority White Minority White Minority White Minority White
Teacher N 6,766 36,378 6,766 36,378 6,181 34,014 6,753 36,346 6,181 34,014 6,181 34,014 School N 3,304 8,223 3,304 8,223 2,977 7,549 3,294 8,213 2,977 7,549 2,977 7,549
Intercept -1.70*** -2.10*** -1.68*** -1.94*** -1.69*** -2.11*** -1.72*** -2.10*** -1.80*** -2.08*** -1.77*** -2.09***
Teacher Characteristics Younger 0.08 0.84*** 0.07 0.83*** 0.05 0.84*** 0.08 0.82*** 0.05 0.84*** 0.04 0.82*** Older -0.08 0.34*** -0.08 0.33*** -0.06 0.34*** -0.08 0.33*** -0.06 0.33*** -0.07 0.33*** Male 0.41** 0.10 0.41** 0.10~ 0.48** 0.10 0.41** 0.10~ 0.49** 0.10 0.48** 0.10 School Characteristics Secondary Level 0.06 -0.10 0.09 -0.07 0.02 -0.02 0.06 -0.04 0.07 -0.05 0.05 0.00 School Size (in 100s) -0.03** 0.00 -0.04** 0.00 -0.04** 0.00 -0.03** -0.01 -0.04** -0.01 -0.04** -0.01 School Demographics Rural -0.33~ -0.26*** -0.20 -0.01 Suburban 0.05 -0.20** 0.11 0.03 Poverty Enrollment (in 10s) -0.02 0.06*** -0.03 0.01 Minority Enrollment (in 10s) 0.01 0.05*** -0.02 0.05** Minority Faculty (in 10s) 0.02 0.11*** 0.05 0.04~
Note. ~p<.10, *p<.05, **p<.01, ***p<.001
34
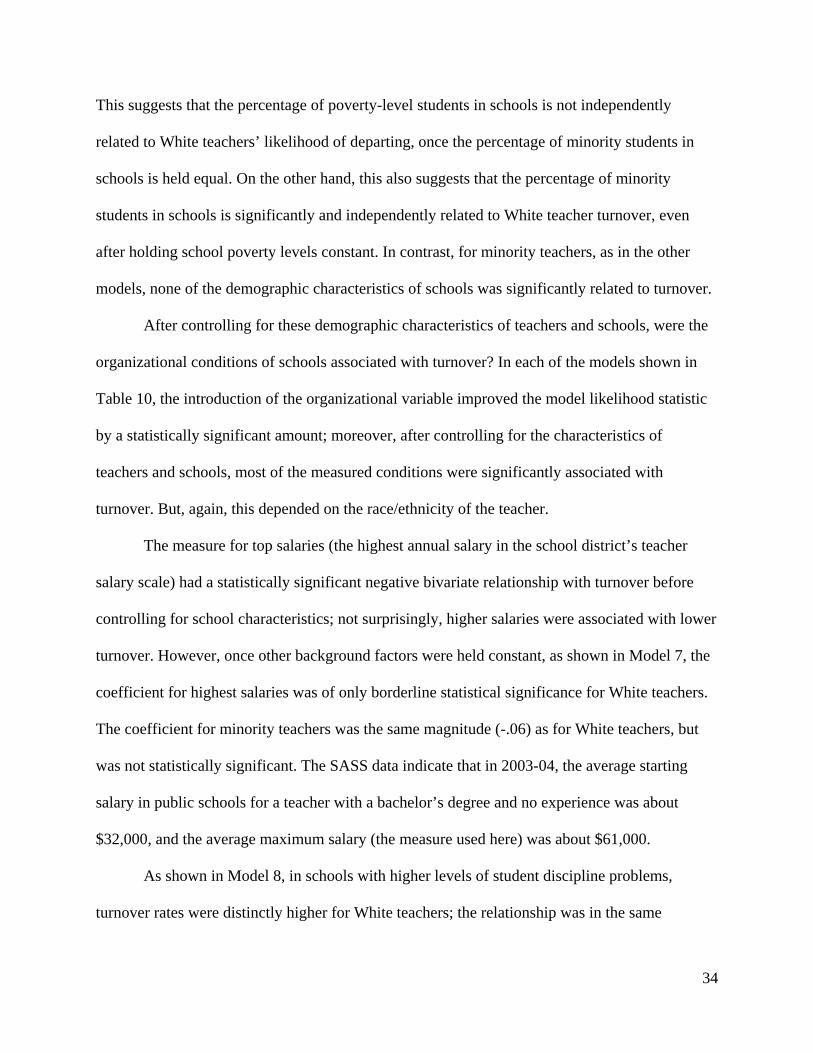
This suggests that the percentage of poverty-level students in schools is not independently
related to White teachers’ likelihood of departing, once the percentage of minority students in
schools is held equal. On the other hand, this also suggests that the percentage of minority
students in schools is significantly and independently related to White teacher turnover, even
after holding school poverty levels constant. In contrast, for minority teachers, as in the other
models, none of the demographic characteristics of schools was significantly related to turnover.
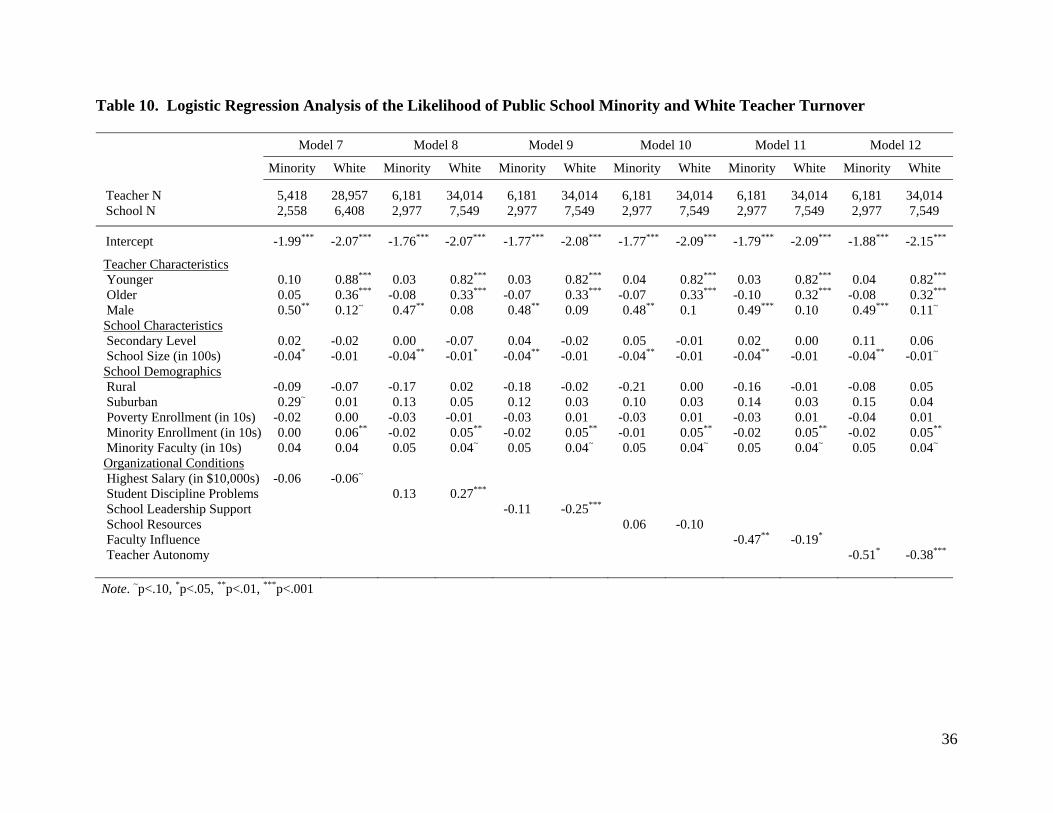
After controlling for these demographic characteristics of teachers and schools, were the
organizational conditions of schools associated with turnover? In each of the models shown in
Table 10, the introduction of the organizational variable improved the model likelihood statistic
by a statistically significant amount; moreover, after controlling for the characteristics of
teachers and schools, most of the measured conditions were significantly associated with
turnover. But, again, this depended on the race/ethnicity of the teacher.
The measure for top salaries (the highest annual salary in the school district’s teacher
salary scale) had a statistically significant negative bivariate relationship with turnover before
controlling for school characteristics; not surprisingly, higher salaries were associated with lower
turnover. However, once other background factors were held constant, as shown in Model 7, the
coefficient for highest salaries was of only borderline statistical significance for White teachers.
The coefficient for minority teachers was the same magnitude (-.06) as for White teachers, but
was not statistically significant. The SASS data indicate that in 2003-04, the average starting
salary in public schools for a teacher with a bachelor’s degree and no experience was about
$32,000, and the average maximum salary (the measure used here) was about $61,000.
As shown in Model 8, in schools with higher levels of student discipline problems,
turnover rates were distinctly higher for White teachers; the relationship was in the same
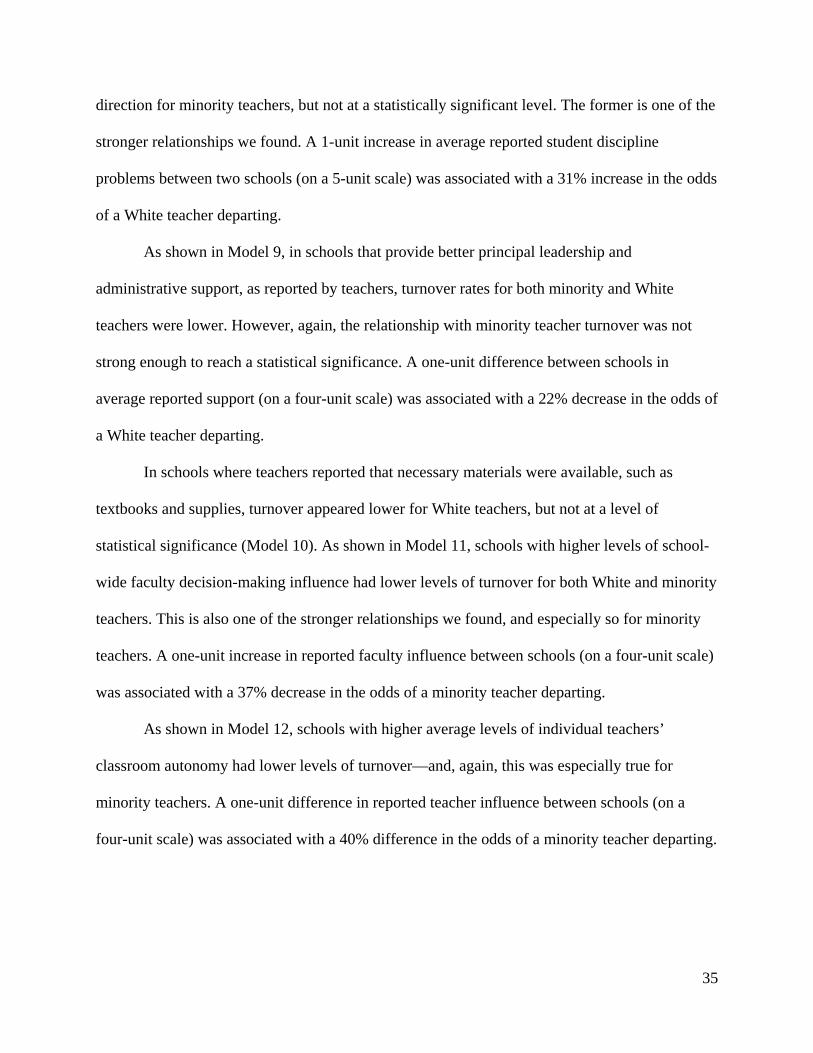
35
direction for minority teachers, but not at a statistically significant level. The former is one of the
stronger relationships we found. A 1-unit increase in average reported student discipline
problems between two schools (on a 5-unit scale) was associated with a 31% increase in the odds
of a White teacher departing.
As shown in Model 9, in schools that provide better principal leadership and
administrative support, as reported by teachers, turnover rates for both minority and White
teachers were lower. However, again, the relationship with minority teacher turnover was not
strong enough to reach a statistical significance. A one-unit difference between schools in
average reported support (on a four-unit scale) was associated with a 22% decrease in the odds of
a White teacher departing.
In schools where teachers reported that necessary materials were available, such as
textbooks and supplies, turnover appeared lower for White teachers, but not at a level of
statistical significance (Model 10). As shown in Model 11, schools with higher levels of school-
wide faculty decision-making influence had lower levels of turnover for both White and minority
teachers. This is also one of the stronger relationships we found, and especially so for minority
teachers. A one-unit increase in reported faculty influence between schools (on a four-unit scale)
was associated with a 37% decrease in the odds of a minority teacher departing.
As shown in Model 12, schools with higher average levels of individual teachers’
classroom autonomy had lower levels of turnover—and, again, this was especially true for
minority teachers. A one-unit difference in reported teacher influence between schools (on a
four-unit scale) was associated with a 40% difference in the odds of a minority teacher departing.
36
Table 10. Logistic Regression Analysis of the Likelihood of Public School Minority and White Teacher Turnover
Model 7 Model 8 Model 9 Model 10 Model 11 Model 12
Minority White Minority White Minority White Minority White Minority White Minority White
Teacher N 5,418 28,957 6,181 34,014 6,181 34,014 6,181 34,014 6,181 34,014 6,181 34,014 School N 2,558 6,408 2,977 7,549 2,977 7,549 2,977 7,549 2,977 7,549 2,977 7,549
Intercept -1.99*** -2.07*** -1.76*** -2.07*** -1.77*** -2.08*** -1.77*** -2.09*** -1.79*** -2.09*** -1.88*** -2.15***
Teacher Characteristics Younger 0.10 0.88*** 0.03 0.82*** 0.03 0.82*** 0.04 0.82*** 0.03 0.82*** 0.04 0.82*** Older 0.05 0.36*** -0.08 0.33*** -0.07 0.33*** -0.07 0.33*** -0.10 0.32*** -0.08 0.32*** Male 0.50** 0.12~ 0.47** 0.08 0.48** 0.09 0.48** 0.1 0.49*** 0.10 0.49*** 0.11~ School Characteristics Secondary Level 0.02 -0.02 0.00 -0.07 0.04 -0.02 0.05 -0.01 0.02 0.00 0.11 0.06 School Size (in 100s) -0.04* -0.01 -0.04** -0.01* -0.04** -0.01 -0.04** -0.01 -0.04** -0.01 -0.04** -0.01~ School Demographics Rural -0.09 -0.07 -0.17 0.02 -0.18 -0.02 -0.21 0.00 -0.16 -0.01 -0.08 0.05 Suburban 0.29~ 0.01 0.13 0.05 0.12 0.03 0.10 0.03 0.14 0.03 0.15 0.04 Poverty Enrollment (in 10s) -0.02 0.00 -0.03 -0.01 -0.03 0.01 -0.03 0.01 -0.03 0.01 -0.04 0.01 Minority Enrollment (in 10s) 0.00 0.06** -0.02 0.05** -0.02 0.05** -0.01 0.05** -0.02 0.05** -0.02 0.05** Minority Faculty (in 10s) 0.04 0.04 0.05 0.04~ 0.05 0.04~ 0.05 0.04~ 0.05 0.04~ 0.05 0.04~ Organizational Conditions Highest Salary (in $10,000s) -0.06 -0.06~ Student Discipline Problems 0.13 0.27*** School Leadership Support -0.11 -0.25*** School Resources 0.06 -0.10 Faculty Influence -0.47** -0.19* Teacher Autonomy -0.51* -0.38***
Note. ~p<.10, *p<.05, **p<.01, ***p<.001
37
We also examined the relationship to turnover of whether teachers participated in, and
found useful, two types of professional development: 1) professional development focused on
student discipline and classroom management, and 2) professional development focused on the
content of the subjects taught. For both types of development, and for both White and minority
teachers, the association with turnover was small and not statistically significant and, hence, we
did not display these here.
The separate models in Table 10 estimate the independent relationships to turnover of
each organizational condition. However, as discussed in the Data/Methods section, the above
organizational conditions do not exist in isolation; schools with higher levels of one were also
likely to have higher levels of others. To get a sense of the joint association with turnover of
multiple organizational conditions we estimated predicted turnover rates by entering a range of
values for the set of all organizational variables. Holding the control variables constant at the
sample mean, we set the eight organizational condition variables to values corresponding to the
10th percentile, the 25th percentile, the mean, the 75th percentile, and the 90th percentile for the
sample. This allowed us to predict the turnover rates of minority and White teachers for a range
of hypothetical schools, beginning with those that have the worst organizational conditions (i.e.,
at the 10th percentile on each of the eight organizational measures) and concluding with those
that have the best organizational conditions (i.e., at the 90th percentile on each of organizational
measures). Results from this analysis are depicted in Figure 6 and reveal a clear collective
relationship between organizational conditions and turnover. This relationship is remarkably
strong for minority teachers, whose predicted annual turnover rates are only 12% in the schools
with the best organizational conditions versus nearly 21% in schools with the worst
38
organizational conditions. For White teachers the relationship is not as strong, ranging from
12% in the best schools to 15% in the worst schools.vii
Moreover, we estimated our sequential sets of models in Tables 9 and 10 on several
permutations of our teacher data file. First, we tested our models using a comprehensive data file
combining both White and minority teachers, while adding a predictor for minority teachers
(table not displayed here). Consistent with our descriptive statistics in Table 6, minority teachers
had a statistically significantly higher likelihood of turnover than did White teachers. The odds
of minority teachers departing were almost 50% higher than for White teachers, even after
controlling for the characteristics of teachers and schools. However, once organizational
conditions were controlled, the coefficient for minority teachers became statistically insignificant
and small (the odds of minority teachers departing were less than 5% higher than for White
teachers). In other words, we found that less positive organizational conditions in schools
accounted for the higher rates of minority teacher turnover.
We also estimated our same set of models separately for movers and leavers to explore
differences in the predictors of each component of turnover (table not displayed here). This
analysis necessarily used the smaller TFS sample. Given the smaller sample, as expected, some
of the coefficients for organizational conditions failed to achieve statistical significance.
However, in almost all cases, the direction and magnitude of the coefficients for organizational
conditions were similar to those found in the models analyzing the full sample in Tables 9 and10.
In other words, organizational conditions associated with differences in rates of teacher
migration were similarly associated with differences in rates of teacher attrition.
39
Figure 6. Predicted Turnover Rates by Public School Organizational Conditions Percentile
There were, however, some interesting differences in the relationship of school
demographic characteristics to these types of departures. For White teachers, school
demographic characteristics, especially minority student enrollment, had a stronger relationship
to moving than to leaving. After controlling for our other variables, schools with higher
percentages of low-income students, higher percentages of minority students, and higher
percentages of minority teachers had higher White teacher migration to other schools; for Whites
leaving teaching altogether, the differences were small and not statistically significant.
In contrast, for minority teachers, there continued to be little relationship between school
demographic characteristics and the likelihood that minority teachers would either move between
15.0%
20.7%
13.8%
18.2%
13.4%
15.7%
12.5%
13.5%
12.3%
11.5%
0% 10% 20% 30% 40% 50%
White
Minority
Predicted Annual Turnover
Best Schools (90th Percentile)
Better Schools (75th Percentile)
Average Schools
Worse Schools (25th Percentile)
Worst Schools (10th Percentile)
40
schools or leave teaching, with one interesting exception: there was a small but statistically
significant negative relationship between poverty enrollment and minority teacher migration.
Minority teachers in schools with higher poverty-level enrollments were slightly less likely to
migrate to other schools, than those in lower-poverty schools.
Finally, we estimated our same set of models on a subset of turnover that excluded those
who departed because of retirement, layoffs, terminations or school closings, in order to test our
findings using a file approximating only voluntary departures. When looking at departures that
are, ostensibly, a matter of choice, we would expect organizational conditions to have a clearer
and stronger relationship to turnover. On the other hand, to do this analysis, it was necessary to
use the smaller TFS sample; given the smaller sample, we would expect some variables to have a
weaker relationship. We found that the magnitude of the association of many of our predictors
increased and that the findings were highly consistent with those in the models in Tables 9 and
10.
Summary and Implications
It is widely believed that the nation’s schools suffer from dire shortages of minority
teachers. Numerous scholars and commentators have held that there is a growing mismatch
between the degree of racial/ethnic diversity in the nation’s student population and the degree of
diversity in the nation’s elementary and secondary teaching force. In response, in recent decades
numerous government and non-government organizations have implemented a variety of
minority teacher recruitment programs and initiatives. Have these efforts been successful? Has
the teaching force grown more diverse?
The national data show a gap persists between the percentage of minority students and
the percentage of minority teachers in the U.S. school system. For instance in 2008, 34% of the
41
nation’s population was minority, and 41% of all elementary and secondary students were
minority, but only 16.5% of all elementary and secondary teachers were minority. But the data
also show this gap is not due to a failure of teacher recruitment. Indeed, since the late 1980s the
number of minority elementary and secondary teachers has ballooned by almost 100%,
outpacing growth in the number of White teachers and outpacing growth in minority students.
The result is that the teaching force has rapidly grown more diverse.
Moreover, minority teachers are overwhelmingly employed in public schools serving
high-poverty, high-minority, and urban communities. Minority teachers are two to three times
more likely than White teachers to work in such hard-to-staff schools. Hence, the data show that,
in spite of a purported host of barriers to entry and competition from other occupations for
minority college graduates, efforts over recent decades to recruit more minority teachers and
place them in schools serving disadvantaged and minority student populations have been very
successful.
However, overall, the data show that over the past two decades minority teachers were
also less stable than White teachers; in most years they were more likely to migrate from one
school to another or to leave teaching altogether. This was especially true for male minority
teachers. The result has been that, numerically, there has been a large degree of job transition
among minority teachers each year. For instance, during the 12 months from the beginning of the
2003-04 school year to the following year, about one third of the approximately 600,000
minority teachers in the nation moved into, between, or out of schools.
Some turnover of teachers is, of course, normal, inevitable, and beneficial. For
individuals, departures leading to better jobs, either in teaching or not, can be a source of upward
mobility. For schools, departures of low-performing employees can enhance organizational
42
outcomes. For the educational system, some teacher outflows, such as cross-school migration,
temporary attrition, or those leaving classroom teaching for other education-related jobs, do not
represent a net or permanent loss of human capital to the education system as a whole.
However, from an organizational level of analysis and from the viewpoint of those
managing schools, none of these types of departures are cost free, whether permanent, to other
schools, or to other education jobs. All have the same effect; they typically result in a decrease in
minority classroom instructional staff in that organization. One consequence of such turnover,
our analysis reveals, is that it undermines efforts to address the minority teacher shortage.
Why do minority teachers depart schools at higher rates? Strikingly, while the
demographic characteristics of schools appear to be highly important to minority teachers’ initial
employment decisions, this does not appear to be the case for their later decisions about whether
to depart. A school’s enrollment of poverty-level students, a school’s minority-student
enrollment, the school’s proportion of minority teachers, or whether the school lies in an urban
or suburban community were not strongly or consistently related to the likelihood that minority
teachers would decide to stay or depart. On the other hand, our data also show that after
controlling for other factors, school demographics were significantly related to White teachers’
turnover decisions. Hence, like other studies (see, e.g., Achinstein, et al. 2010), we found that,
compared to White teachers, minority teachers were less likely to turnover from high-poverty,
and high minority, and urban schools. But this was not due to any kind of minority teacher
affinity for, or commitment to, employment in such schools, as is widely believed (e.g., Irvine
1988). When it comes to the turnover of minority teachers, the demographic characteristics of
the students appear to be non factors. This also appears to be true for the largest subgroup within
the minority teaching force—Black and African American teachers. In a companion study,
43
Connor (2011) focused specifically on Black and African American teachers, comparing them to
White teachers. His findings on turnover were similar to those reported in our study.
Among the most prominent reasons teachers gave for leaving or moving were a desire to
obtain a better job or career, or dissatisfaction with some aspect of their teaching job. And not
only did minority teachers depart at higher rates, but among those who moved or left, minority
teachers were more likely to cite career advancement or job dissatisfaction than were White
teachers.
The data further show that particular school organizational conditions were strongly
related to these minority teacher departures. Hard-to-staff schools that are more likely to employ
minority teachers often also have less desirable organizational conditions. And less desirable
conditions, our data suggest, account for the higher rates of minority teacher turnover. In other
words, the data indicate that minority teachers departed at higher rates because the schools in
which they were employed tended to have less positive organizational conditions. The strongest
organizational factors for minority teachers were the levels of collective faculty decision-making
influence in their school and the degree of individual instructional autonomy held by teachers in
their classrooms. Schools that provided more teacher classroom discretion and autonomy, as well
as schools with higher levels of faculty input into school decision-making influence, had lower
levels of minority teacher turnover. Other factors, such as salaries, the provision of professional
development or the availability of classroom resources, had much less effect on turnover rates.
What are the implications of these results for the widespread efforts to diversify the
teaching force? In supply and demand theory, any imbalance between labor demand and supply
can be referred to as a shortage, in the sense that there is an inadequate quantity of individuals
able and willing to offer their services under given wages and conditions. From this perspective,
44
the problems many schools encounter retaining minority teachers can technically be referred to
as a shortage. However, in the context of minority teachers and schools, the term shortage is
typically given a narrower connotation—an insufficient production and recruitment of new
minority teaching candidates in the face of increasing minority student enrollments. These
terminological and diagnostic differences have crucial implications for prescription and policy.
As noted in the beginning of this article, increased teacher production and recruitment has
long been the dominant strategy to diversify the teaching force and address the minority teacher
shortage. Numerous high-profile reports have called for dramatic increases in the recruitment of
new minority teachers across the nation (e.g., Education Commission of the States, 2003;
American Association of Colleges of Teacher Education, 1987; National Educational
Association, 2004). Beginning in the late 1980s, such efforts received substantial support and
funding—the Ford Foundation and the DeWitt Wallace Readers’ Digest Fund alone committed
over $60 million.
Nothing in our research suggests that bringing new qualified minority candidates into
teaching is not a worthwhile step. Indeed, our data show that this approach has had remarkable
success. In the two decades since the late 1980s, the minority teaching force has increased at
over two and a half times the rate of the White teaching force—by 300,000—almost doubling in
size.
But the data indicate that new teacher recruitment strategies alone do not directly address
a major source of minority teacher staffing problems—turnover. This is especially true for
minority teacher recruitment efforts aimed at male teachers, because male minority teachers have
especially high turnover. Indeed, the ballooning of the minority teaching force is all the more
remarkable because it has occurred in spite of the high turnover rate among minority teachers.

45
To illustrate, our data reveal that at the beginning of the 2003-04 school year abut 48,000
minorities entered teaching. After the end of the school year, over 56,000 minority teachers left
teaching. Of these, about 16,000 retired, another 30,000 indicated that they left to pursue another
job or because of job dissatisfaction. Improving the retention of minority teachers brought into
teaching by recruitment initiatives could prevent the loss of the investment, and also help to
lessen the need for more recruitment initiatives. All of this suggests the efficacy of developing
teacher recruitment and retention initiatives together.
These findings also have implications for the implementation of educational accountability
reforms, which have increased since the enactment of NCLB in 2001. In preliminary analyses,
we have found that in many states and school districts, the implementation of school and teacher
accountability initiatives has been accompanied by decreases in levels of individual teacher
classroom autonomy, especially in regard to the selection of texts, content, topics and evaluating
of students in their courses – one of the organizational conditions strongly associated with
minority teacher turnover (Ingersoll, 2007; also see Guggino & Brint, 2010). Hence, depending
on how they are implemented, accountability reforms may have the unintended and unfortunate
consequence of increasing minority teacher turnover and minority teacher staffing problems.
These issues are worthy of further investigation—a project we are now undertaking.
This study’s findings support the view that school organization, management, and
leadership matter, and they shift attention to discovering which policy-amenable aspects of
schools as organizations—their practices, policies, characteristics, and conditions—are related to
their ability to retain minority teachers. The data suggest that poor, high-minority, urban schools
with improved organizational conditions will be far more able to do so. To be sure, the data do
not suggest that altering any of the organizational conditions we examined would be easy.
46
However, unlike reforms such as teacher salary increases, professional development and class-
size reduction, changing some conditions, such as teachers’ classroom autonomy and faculty’s
school-wide influence, would appear to be less costly financially—an important consideration,
especially in low-income settings and in periods of budgetary constraint.
47
References
Abelson, M.A., & Baysinger, B.D. (1984). Optimal and dysfunctional turnover: Toward an organizational level model. The Academy of Management Review, 9(2), 331-341.
Achinstein, B., & Aguirre, J. (2008). Cultural match or cultural suspect: How new teachers
of color negotiate socio-cultural challenges in the classroom. Teachers College Record, 110(8), 1505-1540.
Achinstein, B., Ogawa, R.T., Sexton, D., & Freitas, C. (2010). Retaining teachers of color: A
pressing problem and a strategy for “hard-to-staff” schools. Review of Educational Research, 80(1), 71-107.
American Association of Colleges of Teacher Education. (1999). Teacher education pipeline
IV: Schools and departments of education enrollments by race, ethnicity, and gender. Washington, DC: Author.
Banks, J. (1995). Multicultural education: Historical development, dimensions, and practice.
In J. Banks & C. Banks (Eds.), Handbook of research on multicultural education (pp. 3-24). New York, NY: Macmillan.
Baron, J., & Bielby, W. (1980). Bringing the firm back in: Stratification, segmentation, and the organization of work. American Sociological Review, 45, 737-765.
Bryk, A., Lee, V., & Holland, P. (1993). Catholic schools and the common good. Cambridge, MA: Harvard University Press.
Carnegie Forum on Education and the Economy, Task Force on Teaching as a Profession. (1986). A nation prepared: Teachers for the 21st century. Washington, DC: Author.
Chandler, K., Luekens, M., Lyter, D., & Fox, E. (2004). Teacher attrition and mobility: Results from the teacher follow-up survey, 2000-01. Washington, DC: National Center for Education Statistics.
Chubb, J.E., & Moe, T. (1990). Politics, markets and America’s schools. Washington, DC:
Brookings Institute. Clewell, B.C., & Villegas, A.M. (2001). Evaluation of the DeWitt Wallace–Reader’s Digest
Fund’s Pathways to Teaching Careers program. Washington, DC: Urban Institute. Cochran-Smith, M. (2004). Walking the road: Race, diversity, and social justice in teacher
education. New York, NY: Teachers College Press. Cole, B.P. (1986). The Black educator: An endangered species. Journal of Negro Education,
55(3), 326-334.
48
Coleman, J., & Hoffer, T. (1987). Public and private schools: The impact of communities. New York, NY: Basic.
Connor, R. (2011). Examining African American teacher turnover, past & present. Unpublished
PhD Dissertation, University of Pennsylvania. Dilworth, M. (1992). Diversity in teacher education. San Francisco, CA: Jossey-Bass.
Dreeben, R., & Gamoran, A. (1986). Race, instruction and learning. American Sociological
Review, 51, 660-669. Education Commission of the States. (2003). Recruiting teachers of color: A 50-state survey of
state policies. Denver, CO: Author. Feistritzer, E. (1997). Alternative teacher certification: A state-by-state analysis (1997).
Washington, DC: National Center for Education Information. Foster, M. (1994). Effective Black teachers: A literature review. In E. R. Hollins, J. E. King, &
W. C. Hayman (Eds.), Teaching diverse populations: Formulating a knowledge base (pp. 225-241). Albany, NY: State University of New York Press.
Foster, M. (1997). Black teachers on teaching. New York, NY: New Press.
Gandara, P. & Maxwell-Jolley, J. (2000). Preparing teachers for diversity: A dilemma of quality and quantity. Santa Cruz, CA: The Center for the Future of Teaching & Learning.
Goodlad, J. (1984). A place called school: Prospects for the future. St. Louis, MO: McGraw-Hill.
Grant, G. (1988). The world we created at Hamilton High. Cambridge, MA: Harvard University
Press. Guggino, P., & Brint, S. (2010). Does the No Child Left Behind Act help or hinder K-12
education? Policy Matters, 3(3), 1-7. Haberman, M. (1996). Selecting and preparing culturally competent teachers for urban schools.
In J. Sikula (Ed.), Handbook of research on teacher education (pp. 747-760). New York, NY: Simon & Schuster Macmillan.
Haycock, K. (2001). Closing the achievement gap. Educational Leadership, 58(6), 6-11. Hirsch, P., & Lounsbury, M. (1997). Putting the organization back into organization theory.
Journal of Management Inquiry, 6, 79-88.
49
Hirsch, E., Koppich, J., & Knapp, M. (2001). Revisiting what states are doing to improve the quality of teaching: An update on patterns and trends. Seattle, WA: Center for the Study of Teaching and Policy, University of Washington.
Hom, P., & Griffeth, R. (1995). Employee turnover. Cincinnati, OH: South-Western. Ingersoll, R. (2001). Teacher turnover and teacher shortages: An organizational analysis.
American Educational Research Journal, 38(3), 499-534. Ingersoll, R. (2007). Short on power, long on responsibility. Educational Leadership, 65(1), 20-
25. Ingersoll, R., & May, H. (2010). The magnitude, destinations and determinants of mathematics
and science teacher turnover. Philadelphia, PA: Consortium for Policy Research in Education, University of Pennsylvania.
Ingersoll, R., & Merrill, E. (2010) Who’s teaching our children? Educational Leadership, 67, 14-
20. Ingersoll, R., & Perda, D. (2011). How high is teacher turnover and is it a problem?
Philadelphia, PA: Consortium for Policy Research in Education, University of Pennsylvania.
Irvine, J.J. (1988). An analysis of the problem of the disappearing Black educator. Elementary
School Journal, 88(5), 503-514. Irvine, J.J. (1989). Beyond role models: An examination of cultural influences on the
pedagogical perspectives of Black teachers. Peabody Journal of Education, 66(4), 51-63. Jovanovic, B. (1979a). Job matching and the theory of turnover. Journal of Political Economy,
87(5), 972-990. Jovanovic, B. (1979b). Firm-specific capital and turnover. Journal of Political Economy, 87(6),
1246-1260. Kalleberg, A. (1989). Linking macro and micro levels: Bringing the workers back into the
sociology of work. Social Forces, 67, 582-592.
Kimmitt. R. (2007, Jan.23). Why job churn is good. Washington Post (p. A17). Kirby, S.N., Berends, M., & Naftel, S. (1999). Supply and demand of minority teachers in Texas:
Problems and prospects. Educational Evaluation and Policy Analysis, 21(1), 47-66. Ladson-Billings, G. (1995). Toward a theory of culturally relevant pedagogy. American
Educational Research Journal, 32(3), 465-491.
50
Lau, K.F., Dandy, E.B., & Hoffman, L. (2007). The Pathways Program: A model for increasing the numbers of teachers of color. Teacher Education Quarterly, 34(4), 27-40.
Lewis, C.W. (2006). African American male teachers in public schools: An examination of three
urban school districts. Teachers College Record, 108(2), 224-245. Liu, E., Rosenstein, J., Swann, A., & Khalil, D. (2008). When districts encounter teacher
shortages: The challenges of recruiting and retaining math teachers in urban districts. Leadership and Policy in Schools, 7(3), 296-323.
Mobley, W. (1982). Employee turnover: Causes, consequences and control. Reading, MA:
Addison-Wesley. Murnane, R., Singer, J., Willet, J., Kemple, J., & Olsen, R. (Eds.). (1991). Who will teach?
Policies that matter. Cambridge, MA: Harvard University Press. National Center for Education Statistics. (2005). Schools and staffing survey (SASS) and teacher
follow-up survey (TFS). Data File. Washington, DC: U.S. Department of Education. Available from http://nces.ed.gov/surveys/SASS
National Collaborative on Diversity in the Teaching Force. (2004). Assessment of diversity in
America’s teaching force: A call to action. Washington, DC: National Educational Association.
Norton, R. (2005, April). Call me MISTER. Black Collegian, 27-28. Oakes, J. (1985). Keeping track: How schools structure inequality. New Haven, CT: Yale
University Press. Oakes, J. (1990). Multiplying inequalities: The effects of race, social class, and tracking on
opportunities to learn mathematics and science. Santa Monica, CA: The RAND Corporation.
Price, J. (1977). The study of turnover. Ames, IA: Iowa State University Press. Price, J. 1989. The impact of turnover on the organization. Work and Occupations, 16, 461-473. Quiocho, A. & Rios, F. (2000). The power of their presence: Minority group teachers and
schooling. Review of Educational Research, 70(4), 485-528. Rice, J., Roellke, C., Sparks, D., & Kolbe, T. (2008). Piecing together the teacher policy
landscape: A policy-problem typology. Teachers College Record. Available from http://www.tcrecord.org/Content.asp?ContentId=15223
Rosenbaum, J. (1976). Making inequality. New York, NY: John Wiley & Sons.
51
Shen, J. (1998). Alternative certification, minority teachers, and urban education. Education and Urban Society, 31(1), 30-41.
Siebert, S.W., & Zubanov, N. (2009). Searching for the optimal level of employee turnover: A
study of a large U.K. retail organization. Academy of Management Journal, 52(2), 294-313. Stolzenberg, R. (1978). Bringing the firm back in: Employer size, employee schooling and
socioeconomic achievement. American Sociological Review, 43, 813-28. Torres, J., Santos, J., Peck, N. L., & Cortes, L. (2004). Minority teacher recruitment,
development, and retention. Providence, RI: Brown University, Educational Alliance. Valencia, R.R. (2002). The plight of Chicano students: An overview of schooling conditions and
outcomes. In R.R. Valencia (Ed.), Chicano school failure and success, second edition (pp. 3-51). New York, NY: Routledge-Falmer.
Villegas, A.M. & Lucas, T. (2004). Diversifying the teacher workforce: A retrospective and prospective analysis. In M.A. Smylie & D. Miretky (Eds.), Developing the teacher workforce (103rd Yearbook of the National Society for the Study of Education, Part 1) (pp. 70-104). Chicago, IL: University of Chicago Press.
Villegas, A.M., & Irvine, J.J. (2010, April). Diversifying the teaching force: An examination of major arguments. Urban Review, 42:175-192.
Wilson, W.J. (1996). When work disappears: The world of the new urban poor. New York, NY:
Knopf. Zeichner, K. (1996) Educating teachers for cultural diversity. In K. Zeichner, S. Melnick & M.L.
Gomez (Eds.), Currents of reform in preservice teacher education (pp. 133-175). New York, NY: Teachers College Press.
Zeichner, K. & Gore, J. (1990). Teacher socialization. In W.R. Houston, M. Haberman & J. Sikula
(Eds.), Handbook of research on teacher education (pp. 329-348). New York, NY: Macmillan.
Zumwalt, K., & Craig, E. (2005). Teachers’ characteristics: Research on the demographic
profile. In M. Cochran-Smith & K.M. Zeichner (Eds.), Studying teacher education: The report of the AERA panel on research and teacher education (pp. 111–156). Mahwah, NJ: Lawrence Erlbaum.
52
Endnotes
i The preliminary Teacher Status variable, from SASS, has some error in distinguishing between migration (movers) and attrition (leavers). Essentially, school principals tend to over-report the number of leavers because teachers who quit their jobs often do not inform their previous schools that they have moved to another school. However, this measure is quite accurate in accurately identifying who is and isn’t still working at the original school. By comparing individual teacher’s values for the Teacher Status variable from SASS with confirmed final turnover from the TFS, we found the Teacher Status variable was about 93% accurate in distinguishing teachers who had departed from those who had not.
More specifically, the Teacher Status variable from the SASS accurately identified 90% of confirmed leavers (i.e., 2,385 out of 2,650) as having left the teaching occupation. However, the Teacher Status variable classified 29% of confirmed movers (i.e., 559 out of 1,911) as having left the teaching occupation, and an additional 1% of confirmed movers (i.e., 18 out of 1,911) as stayers. When no distinction is made between movers and leavers, the Teacher Status variable was 92% sensitive (i.e., 4,471 out of 4,886 teachers identified as departing did, in fact, move from or leave their teaching jobs), and Teacher Status was 96% specific (i.e., 2,442 out of 2,532 teachers identified as not turning over did, in fact, stay in their teaching jobs). This translates to an overall accuracy rate of 93% (i.e., 6,913 out of 7,418).
In our merger of the SASS and TFS measures, we corrected the Teacher Status measure using TFS data making the former approximately 96% accurate. Applying the sensitivity and specificity rates above to the uncorrected ATTRIT data (i.e., 40,563 stayers and 3,064 movers/leavers) and assuming 100% accuracy for those teachers included in the TFS data (i.e., 2,864 stayers and 4,565 movers/leavers), we end up with an overall accuracy rate of 96% (i.e., [(40,563 x .96) + (3,064 x .92) + (2,864 x 1.00) + (4,565 x 1.00)] / 51,056 = 0.96). ii Especially with an aging teaching workforce, it can be unclear if differences in average salary levels are due to real differences in the compensation offered to comparable teachers at different schools or are due to differences in the experience and education levels of the teachers employed. That is, a school with older teachers may appear to offer better salaries, when, in fact, they do not. A more accurate method of comparison across schools is to compare the normal salaries paid by schools to teachers at common points in their careers. Teacher salary levels are often standardized by school districts according to a uniform salary schedule, based on the education levels and years of experience of the teachers. In this analysis we tested two salary schedule measures - each based on a different point on school salary schedules: 1) the normal yearly base salary for a teacher with 10 years of experience and a masters degree; and 2) the normal yearly base salary for a teacher at the highest possible step on salary schedule. The latter measure had a slightly stronger association with turnover than the former, and it also had relatively fewer missing data; hence, it is used in this study. This measure represents the organizational financial rewards teachers can look forward to at an advanced point in their careers if they stay in their particular schools and, hence, we expect could affect their decisions to depart or stay.
This measure also may have limitations. Some might argue that school salary schedules do not accurately capture the effect of salary on rates of teacher turnover because candidates can
53
obtain this information in deciding whether to accept a particular teaching job. From this viewpoint, since public school teachers are compensated according to published salary schedules that change only infrequently, new entrants can predict with almost complete certainty how much they will be paid in each year in the future. Hence, if a teacher did accept a job, it suggests that they are satisfied with their school’s salary levels and, hence, most likely low salaries would not be a factor in future turnover.
On the other hand, sometimes teachers may, of course, accept jobs with salaries below what they would prefer and then move in a few years when a better paying job opens up. Goodlad (1984) and others have argued that, while money is not a major factor in teachers’ choice of a job, it is a major factor in their decision to move or leave teaching. In this view, beginning teachers are primarily motivated by non-pecuniary and intrinsic values, but if these kinds of expectations are frustrated, salaries can become a source of considerable dissatisfaction. Hence from this viewpoint, salary schedules would be related to turnover precisely because they allow teachers to predict how much they will be paid in the future. This analysis does not presume the validity of either view, but simply tests whether differences in advanced salaries among schools are related to turnover. iii In Table 4, Table 5 and Figure 3, high-poverty schools refers to those in which 60% or more of the students are eligible for the federal free or reduced-price lunch program for students from families below poverty level. Low-poverty schools refer to those in which less than 20 % of the students are eligible for the federal free or reduced-price lunch program. High-minority schools refer to those in which 75% or more of the students are minority. Low-minority schools refer to those in which less than 10% of the students are minority. Note, these categories represent quartiles of the total SASS sample of public school teachers—these categories are not of equal size in number of schools or students. iv In Table 5, Serious Student Discipline Problems refers to scores greater than or equal to 3 on a scale of 1 to 5; Inadequate School Leadership Support refers to scores less than or equal to 3 on a scale of 1 to 4; Inadequate School Resources refers to scores less than or equal to 2 on a scale of 1 to 4; Low Faculty Influence refers to scores less than or equal to 2 on a scale of 1 to 4; Low Teacher Autonomy refers to scores less than or equal to 3 on a scale of 1 to 4; Not Useful Discipline-Focused PD refers to scores less than or equal to 1 on a scale of 1 to 4; Not Useful Content-Focused PD refers to scores less than or equal to 2 on a scale of 1 to 4. v Note, Figure 5 uses data from both SASS and TFS and hence the percentage rate of turnover differs slightly from Table 6 for 2004-05, which uses TFS data only. In Figure 5 the estimate of inflows is based on the SASS sample and the estimate of outflows is based on the TFS sample. 56,244 leavers represents 10.4 % of the TFS estimate of 540,018 total minority teachers in 2004, and not 10.4 % of the SASS estimate of 604,749 total minority teachers in the middle of the figure. vi For our analysis of the destination schools of migrants, we subdivided the total SASS sample of public school teachers into thirdtiles (even thirds) to create high, middle and low categories of schools, according to their poverty and minority enrollments. Low-poverty schools are those with 29% or less low-income students; high-poverty schools are those with 57% or
54
more. Low-minority schools are those with 22% or less minority students; high-minority schools are those with 69% or more. vii Note that general magnitude of the annual rates of turnover in Figure 6 differ from those in Table 6 and Figure 4 because the former focuses on public schools only, while the latter includes all teachers in both public and private. Moreover, as discussed in the Data/Methods section and in endnote i, the regression analyses use a combined TFS/SASS measure of turnover, while the descriptive turnover data in Table 6 and Figure 4 use the TFS measure of turnover.