Embed Size (px)
Citation preview
ANALYTICAL BIOCHEMISTRY 99, 297--303 (1979)
Recycling Analysis of Nicotinamide-adenine Dinucleotide Phosphates (NADP and NADPH)
B o M. JORGENSEN AND HANS N . RASMUSSEN
Institute of Biological Chemistry A, University of Copenhagen, DK-2100 Copenhagen, Denmark
Received February 9, 1979
A simple and sensitive analysis of NADP and NADPH is described. It uses the glucose- 6-phosphate dehydrogenase-glutathione reductase system with detection of reduced gluta- thione through reaction with 5,5'-dithiobis(2-nitrobenzoic acid), Ellmans reagent. The rate of reaction is constant for several hours, and the analytical system does not react with NAD or NADH. Linear standard curves are obtained with 1.25/zg of each enzyme in 1 ml assay mixture, while higher amounts of enzyme in most cases cause nonlinear standard curves. The dynamic range is from approximately 0.2 to 400 pmol corresponding to 0.8 nM to 1.6 bl, M in the extracts. The analytical reactions are inhibited by salts, but reliable quantitation is obtained through the use of internal standards. The applicability to acid and alkaline extracts is investigated, and the analysis is compared with a fluorometric endpoint method. The two methods of analysis give the same analytical results.
Since Warburg et al. (1) developed an analysis for NADP(H) a based on enzymatic cycling, a number of such methods have appeared (2-12). Most of these employ GIu- 6-PDH for reduction of NADP. Reoxidation of NADPH is effected by direct reactions with artificial hydrogen acceptors (7-10) or by enzymatic reactions (1-6, 11, 12). Conn and Vennesland (13) used a Glu-6-PDH- GR system for assay of GR activity, and this system was later employed in cycling analy- sis of NADP(H) by Grassetti and Murray (11) and by Bitny-Szlachto and Sollich (12). In these analyses, GSH formed by the cycling reactions reacts with an aromatic disulfide to form an aromatic thioalcohol which is measured spectrophotometrically. The advantage of this is that no separate
detection step involving deproteinization and incubation is necessary. The disulfides used are 2,2'-dithiobispyridine (11) and 2,4- dinitrophenyl(2-hydroxyethyl)disulfide (12).
The present paper describes an analysis based on the Glu-6-PDH-GR system and on DTNB, Ellmans reagent (14,15), for de- tection of the GSH formed. The procedure demands only commercially available re- agents and common laboratory equipment. The system appears to have several advan- tages compared to the similar methods men- tioned above (11,12). The analysis is very sensitive to NADP(H) owing to the favor- able stoichiometry of the reaction, low blank values, and constant rates of reaction. Experimental conditions giving linear stand- ard curves have been developed.
1 Abbreviations used: DTNB, 5,5'-dithiobis(2-nitro- benzoic acid); Glu-6-PDH, glucose 6-phosphate dehy- drogenase (EC 1.1.1.49); GR, glutathione reductase (EC 1.6.4.2); ICDH, NADP-specific isocitrate dehy- drogenase (EC 1.1.1.42); MNB, 5-mercapto-2-nitro- benzoic acid; NADP(H), NADP and/or NADPH; Hepes, 4-(2-hydroxyethyl)- 1-piperazineethanesulfonic acid.
MATERIALS AND METHODS
Reagents. The buffer mixture was Tris (0.2 M), GIc-6-P (5 mM), GSSG (0.5 mM), EDTA (1 mM), and DTNB (0.5 mM); pH adjusted to 8.2 with HC1. The glucose 6- phosphate used was the crystalline mono-
297 0003-2697/79/160297-07502.00/0 Copyright © 1979 by Academic Press. Inc, All rights of reproduction in any form reserved.
298 JORGENSEN AND RASMUSSEN
sodium salt supplied by Sigma Chemical Company.
Glu-6-PDH (grade I) and GR from baker's yeast and GIu-6-PDH from Leuconostoc mesenteroides were obtained as crystal sus- pensions from Boehringer-Mannheim. Vol- umes containing equal masses of GIu-6- PDH and GR were mixed and centrifuged. The precipitate was dissolved in 0.1 M Tris (pH 8 at 4°C) at a total mass concentration of 1 /zg//zl. This enzyme solution could be stored at 4°C for a week. As indicated be- low, the baker's yeast Glu-6-PDH was pre- ferred to the Leuconostoc enzyme.
The NADP standard (100 riM) was made up shortly before the analysis by dilution of an 0.2 mM stock solution. The stock solu- tion was standardized by an endpoint method using ICDH and photometric meas- urement at 340 nm (16). The reaction mix- ture was 50 mM Tris, pH 8.2, 5 mM iso- citrate, 5 mM MgC12, and 10/~g/ml ICDH from pig heart (Boehringer-Mannheim).
Recycling assay. Enzyme solution was diluted 200-fold with buffer mixture im- mediately before start of the analysis. The analytical reaction mixture was made up of 500 t~l enzyme-buffer mixture, 250/xl sam- ple, and 250/.d water or internal standard solution (100 nM). It was incubated at 25°C for an appropriate time (usually 1 h), after which the absorbance at 412 nm was read in 1-cm cuvettes. The molar absorption coef- ficient of MNB under the present conditions was determined to 1.35 × 10⁴ M -1 cm -1.
All samples were analyzed without and with standard solution added. A blank anal- ysis (without and with standard solution) was included in each series. The back- ground absorbance was measured with a blank analysis incubated without enzymes. A sample containing significant amounts of disulfide reducing compounds should also be incubated without enzymes to correct for noncatalytic reduction of DTNB.
Extracts. Neutralized acid and alkaline extracts of mitochondria were prepared by a slight modification of the method of
Klingenberg (17). Pigeon heart mitochon- dria were prepared as described by Ras- mussen (18). The mitochondria were sus- pended in a medium containing 225 mM mannitol, 75 m~ sucrose, 20 mM Tris, 10 mM phosphate, and 0.5 mM EDTA, pH 7.35 (18). Simulated extracts were prepared by substituting medium for mitochondrial sus- pension.
Perchloric acid (1 M) was mixed with 2 vol of mitochondrial suspension and the mix- ture was centrifuged (8000 rpm, 10 min). Two volumes of the supernatant was neu- tralized to pH 8.2 with 1 vol of preadjusted KOH-Tr i s solution (ca. 0.8 M KOH and 0.2 M Tris). All operations were carried out at 4°C.
Potassium hydroxide (1 M in ethanol) was mixed with 2 vol of mitochondrial suspen- sion and incubated 30 min at room tempera- ture. The mixture (3 vol) was cooled and neutralized to pH 8.2 with 2 vol of 0.5 M KH2PO4. After 10 min of incubation at room temperature, the precipitated protein was removed by centrifugation in the cold (15,000 rpm, 10 rain).
RESULTS AND DISCUSSION
Experimental conditions. The chemical reactions on which the analysis is based are most likely:
Glc-6-P + NADP--~
6-phosphogluconolactone + NADPH,
NADPH + GSSG ~ NADP + 2 GSH,
2 GSH + DTNB ~ GSSG + 2 MNB.
In these reactions, the G S S G - G S H couple is recycled, in accordance with the obser- vation that the amount of MNB formed is not limited by the initial GSSG concentra- tion. Hence, the formation of a stable mixed disulfide through reaction between GSH and DTNB is ruled out. The rate of reaction is defined as the rate of decrease in amount of DTNB and the cycling frequency as this rate divided by amount of NADP(H).
RECYCLING ANALYSIS OF NADP AND NADPH 299
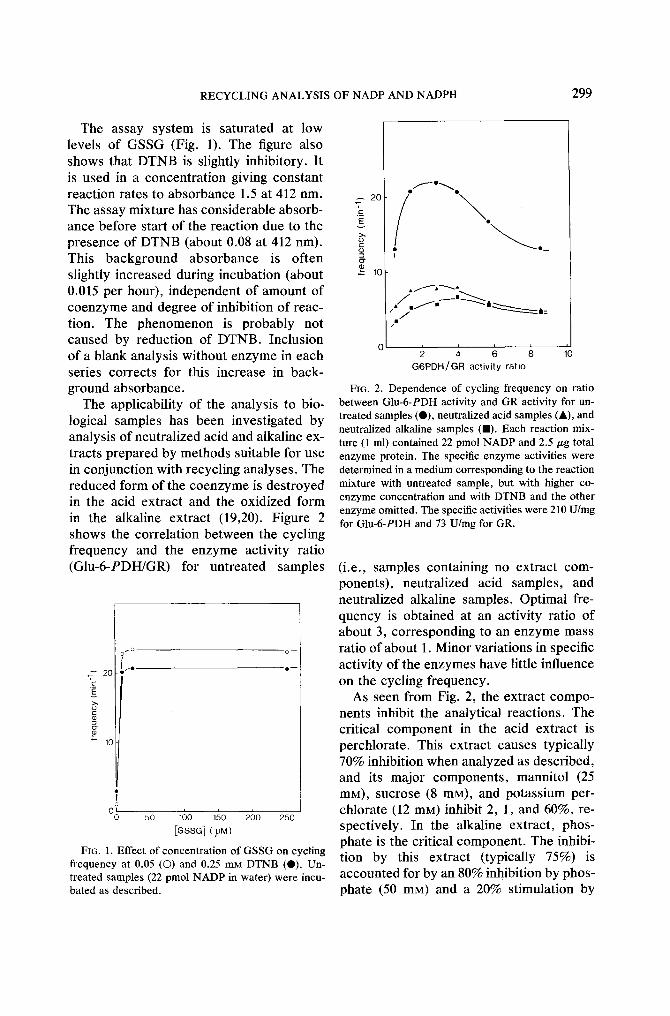
The assay system is saturated at low levels of GSSG (Fig. 1). The figure also shows that DTNB is slightly inhibitory. It is used in a concentration giving constant reaction rates to absorbance 1.5 at 412 nm. The assay mixture has considerable absorb- ance before start of the reaction due to the presence of DTNB (about 0.08 at 412 nm). This background absorbance is often slightly increased during incubation (about 0.015 per hour), independent of amount of coenzyme and degree of inhibition of reac- tion. The phenomenon is probably not caused by reduction of DTNB. Inclusion of a blank analysis without enzyme in each series corrects for this increase in back- ground absorbance.
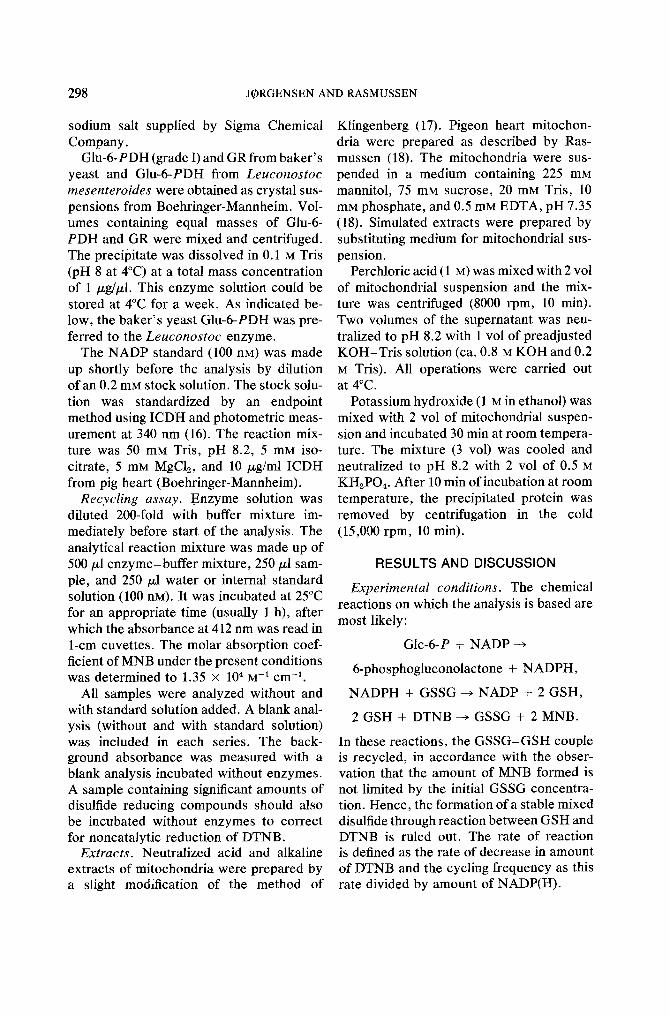
The applicability of the analysis to bio- logical samples has been investigated by analysis of neutralized acid and alkaline ex- tracts prepared by methods suitable for use in conjunction with recycling analyses. The reduced form of the coenzyme is destroyed in the acid extract and the oxidized form in the alkaline extract (19,20). Figure 2 shows the correlation between the cycling frequency and the enzyme activity ratio (GIu-6-PDH/GR) for untreated samples
2O
E
=o
10
O ~0 0 - -
!~II O--
0 t o 5'0 100 150 2(30 250
[GSSG] (pM)
FIG. 1. Effect of concentration of GSSG on cycling frequency at 0.05 (©) and 0.25 mu DTNB (O). Un- treated samples (22 pmol NADP in water) were incu- bated as described.
2O "7 c E
g O"
o ~ - + ~ o
I
/ / /u
to
G6PDH/GR activity ratio
FIG. 2. Dependence of cycling frequency on ratio between Glu-6-PDH activity and GR activity for un- treated samples (O), neutralized acid samples (A), and neutralized alkaline samples ( I ) . Each reaction mix- ture (1 ml) contained 22 pmol NADP and 2.5/zg total enzyme protein. The specific enzyme activities were determined in a medium corresponding to the reaction mixture with untreated sample, but with higher co- enzyme concentration and with DTNB and the other enzyme omitted. The specific activities were 210 U/mg for Glu-6-PDH and 73 U/mg for GR.
(i.e., samples containing no extract com- ponents), neutralized acid samples, and neutralized alkaline samples. Optimal fre- quency is obtained at an activity ratio of about 3, corresponding to an enzyme mass ratio of about 1. Minor variations in specific activity of the enzymes have little influence on the cycling frequency.
As seen from Fig. 2, the extract compo- nents inhibit the analytical reactions. The critical component in the acid extract is perchlorate. This extract causes typically 70% inhibition when analyzed as described, and its major components, mannitol (25 mM), sucrose (8 mM), and potassium per- chlorate (12 mM) inhibit 2, 1, and 60%, re- spectively. In the alkaline extract, phos- phate is the critical component. The inhibi- tion by this extract (typically 75%) is accounted for by an 80% inhibition by phos- phate (50 mM) and a 20% stimulation by
300 JORGENSEN AND RASMUSSEN
~ 2O i .E E g-
o- lO
i\:\, "
O~ 012 013 014 015 relative sample volume
1.0
"6 0 )
0.5 ~
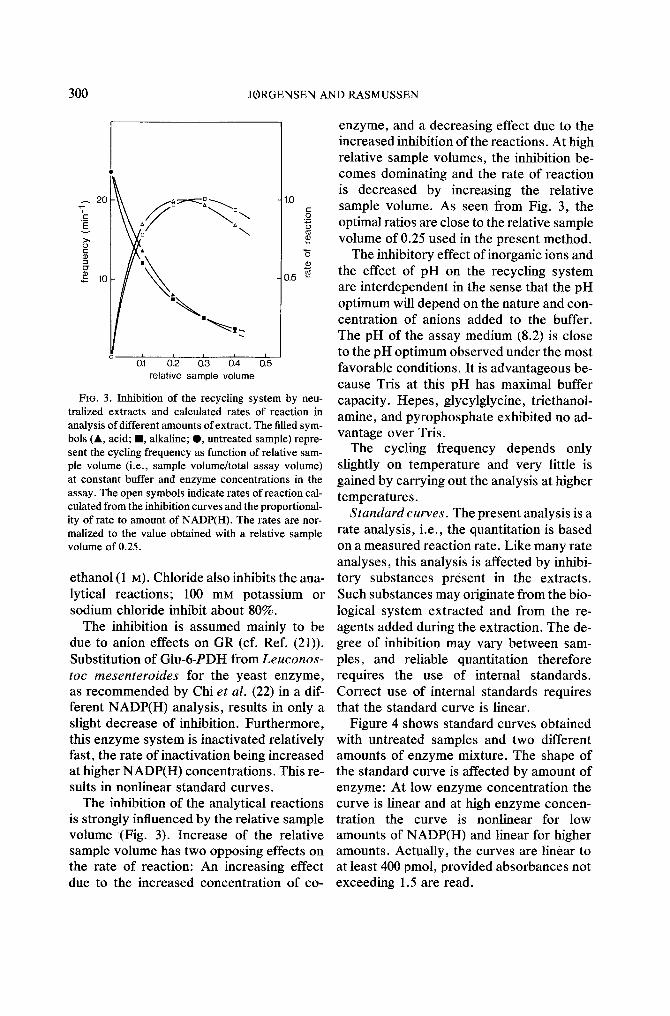
FIG. 3. Inhibition of the recycling system by neu- tralized extracts and calculated rates of reaction in analysis of different amounts of extract. The filled sym- bols (&, acid; II, alkaline; t , untreated sample) repre- sent the cycling frequency as function of relative sam- ple volume (i.e., sample volume/total assay volume) at constant buffer and enzyme concentrations in the assay. The open symbols indicate rates of reaction cal- culated from the inhibition curves and the proportional- ity of rate to amount of NADP(H). The rates are nor- malized to the value obtained with a relative sample volume of 0.25.
ethanol (1 M). Chloride also inhibits the ana- lytical reactions; 100 mM potassium or sodium chloride inhibit about 80%.
The inhibition is assumed mainly to be due to anion effects on GR (cf. Ref. (21)). Substitution of GIu-6-PDH from Leuconos -
toc mesen tero ides for the yeast enzyme, as recommended by Chi et al. (22) in a dif- ferent NADP(H) analysis, results in only a slight decrease of inhibition. Furthermore, this enzyme system is inactivated relatively fast, the rate of inactivation being increased at higher NADP(H) concentrations. This re- sults in nonlinear standard curves.
The inhibition of the analytical reactions is strongly influenced by the relative sample volume (Fig. 3). Increase of the relative sample volume has two opposing effects on the rate of reaction: An increasing effect due to the increased concentration of co-
enzyme, and a decreasing effect due to the increased inhibition of the reactions. At high relative sample volumes, the inhibition be- comes dominating and the rate of reaction is decreased by increasing the relative sample volume. As seen from Fig. 3, the optimal ratios are close to the relative sample volume of 0.25 used in the present method.
The inhibitory effect of inorganic ions and the effect of pH on the recycling system are interdependent in the sense that the pH optimum will depend on the nature and con- centration of anions added to the buffer. The pH of the assay medium (8.2) is close to the pH optimum observed under the most favorable conditions. It is advantageous be- cause Tris at this pH has maximal buffer capacity. Hepes, glycylglycine, triethanol- amine, and pyrophosphate exhibited no ad- vantage over Tris.
The cycling frequency depends only slightly on temperature and very little is gained by carrying out the analysis at higher temperatures.
S tandard curves. The present analysis is a rate analysis, i.e., the quantitation is based on a measured reaction rate. Like many rate analyses, this analysis is affected by inhibi- tory substances present in the extracts. Such substances may originate from the bio- logical system extracted and from the re- agents added during the extraction. The de- gree of inhibition may vary between sam- pies, and reliable quantitation therefore requires the use of internal standards. Correct use of internal standards requires that the standard curve is linear.
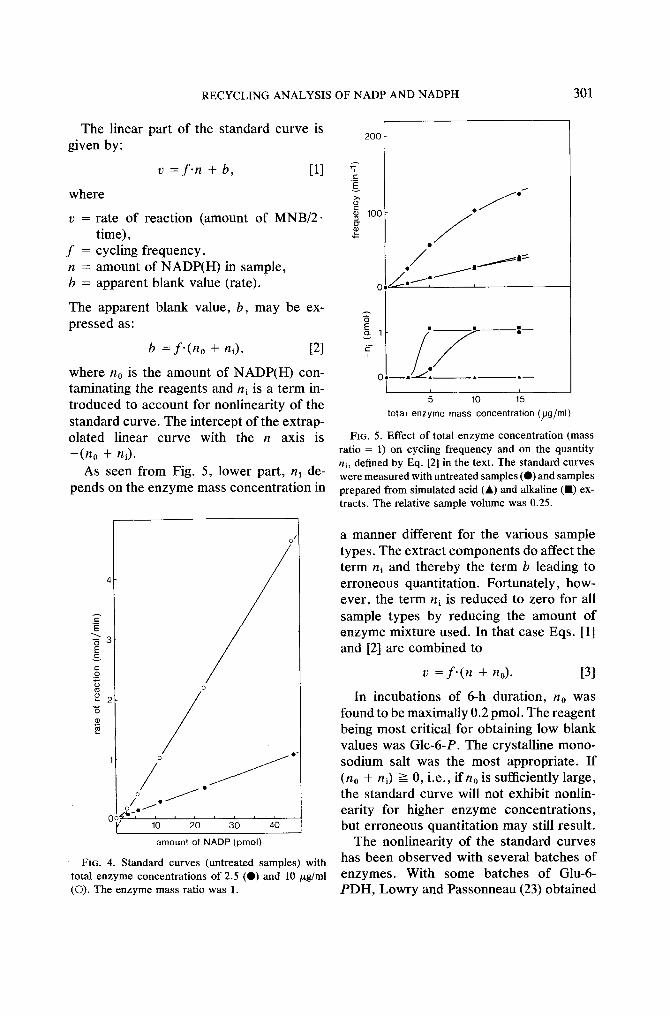
Figure 4 shows standard curves obtained with untreated samples and two different amounts of enzyme mixture. The shape of the standard curve is affected by amount of enzyme: At low enzyme concentration the curve is linear and at high enzyme concen- tration the curve is nonlinear for low amounts of NADP(H) and linear for higher amounts. Actually, the curves are linear to at least 400 pmol, provided absorbances not exceeding 1.5 are read.
RECYCLING ANALYSIS OF NADP AND NADPH 301
The linear part of the standard curve is given by:
v = f . n + b, [1]
where
v = rate of reaction (amount of MNB/2. time),
f = cycling frequency, n = amount of NADP(H) in sample, b = apparent blank value (rate).
The apparent blank value, b, may be ex- pressed as:
b = f ' ( n o + ni), [2]
where no is the amount of NADP(H) con- taminating the reagents and ni is a term in- t roduced to account for nonlinearity of the standard curve. The intercept of the extrap- olated linear curve with the n axis is - - ( n o + hi) .
As seen from Fig. 5, lower part, ni de- pends on the enzyme mass concentrat ion in
/
4
E "~ '3
,S o
/o J
0 7 / - "
O~ff '-" 1 ' 0 ' 2'0 ' 3'0 ' 4'0
amount of NADP (pmol)
FIG. 4. Standard curves (untreated samples) with total enzyme concentrations of 2.5 (Q) and 10/zg/ml (©). The enzyme mass ratio was 1.
200
E E
. 100 o }
o
E v
i
f • J I~
: / J i i
1'0 1'5 total enzyme mass concentration ()Jg/ml)
FIG. 5. Effect of total enzyme concentration (mass ratio = 1) on cycling frequency and on the quantity ni, defined by Eq. [2] in the text. The standard curves were measured with untreated samples (O) and samples prepared from simulated acid (A) and alkaline (11) ex- tracts. The relative sample volume was 0.25.
a manner different for the various sample types. The extract components do affect the term ni and thereby the term b leading to erroneous quantitation. Fortunately, how- ever, the term ni is reduced to zero for all sample types by reducing the amount of enzyme mixture used. In that case Eqs. [1] and [2] are combined to
v = f . ( n + no). [3]
In incubations of 6-h duration, no was found to be maximally 0.2 pmol. The reagent being most critical for obtaining low blank values was GIc-6-P. The crystalline mono- sodium salt was the most appropriate. I f (no + ni) >-- 0, i.e., if n0 is sufficiently large, the standard curve will not exhibit nonlin- earity for higher enzyme concentrat ions, but erroneous quantitation may still result.
The nonlinearity of the standard curves has been observed with several batches of enzymes. With some batches of GIu-6- P D H , Lowry and Passonneau (23) obtained
302 JORGENSEN AND RASMUSSEN
.~ 3 {3
~2 =1.
0 < ,z, 1
0 A o
[NADP] ()JM), end-po in t
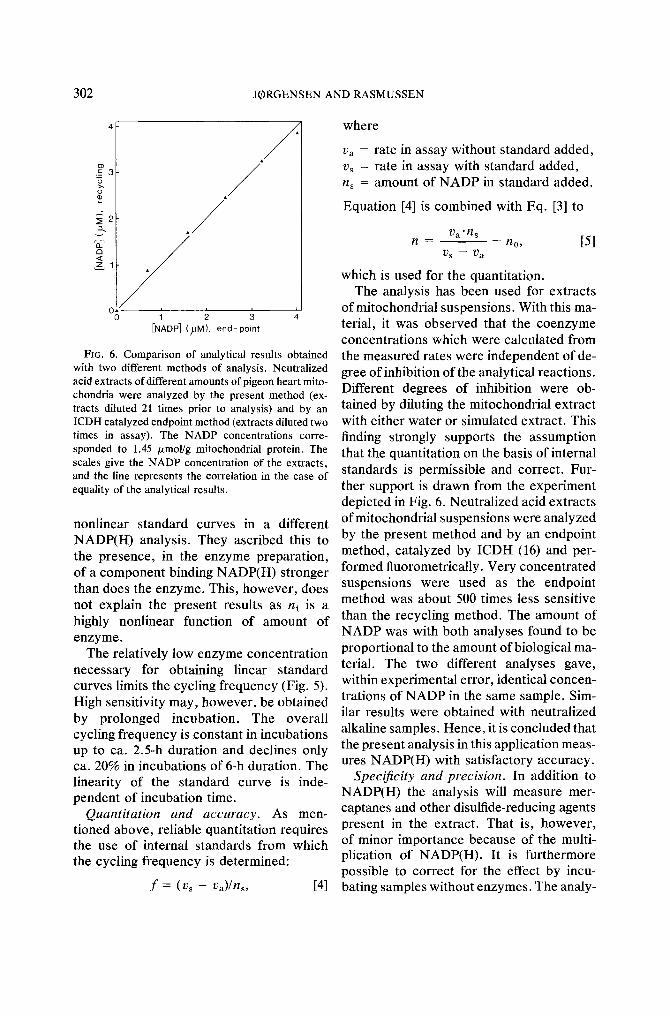
Fro. 6. Comparison of analytical results obtained with two different methods of analysis. Neutralized acid extracts of different amounts of pigeon heart mito- chondria were analyzed by the present method (ex- tracts diluted 21 times prior to analysis) and by an ICDH catalyzed endpoint method (extracts diluted two times in assay). The NADP concentrations corre- sponded to 1,45 /zmol/g mitochondrial protein. The scales give the NADP concentration of the extracts, and the line represents the correlation in the case of equality of the analytical results.
nonlinear standard curves in a different NADP(H) analysis. They ascribed this to the presence, in the enzyme preparation, of a component binding NADP(H) stronger than does the enzyme. This, however, does not explain the present results as ni is a highly nonlinear function of amount of enzyme.
The relatively low enzyme concentration necessary for obtaining linear standard curves limits the cycling frequency (Fig. 5). High sensitivity may, however, be obtained by prolonged incubation. The overall cycling frequency is constant in incubations up to ca. 2.5-h duration and declines only ca. 20% in incubations of 6-h duration. The linearity of the standard curve is inde- pendent of incubation time.
Quantitation and accuracy. As men- tioned above, reliable quantitation requires the use of internal standards from which the cycling frequency is determined:
f = (Vs - Va)/ns, [41
where
Va = rate in assay without standard added, vs = rate in assay with standard added, ns = amount of NADP in standard added.
Equation [4] is combined with Eq. [3] to
V a "F/s n - no, [5]
V s -- /2 a
which is used for the quantitatlon. The analysis has been used for extracts
of mitochondrial suspensions. With this ma- terial, it was observed that the coenzyme concentrations which were calculated from the measured rates were independent of de- gree of inhibition of the analytical reactions. Different degrees of inhibition were ob- tained by diluting the mitochondrial extract with either water or simulated extract. This finding strongly supports the assumption that the quantitation on the basis of internal standards is permissible and correct. Fur- ther support is drawn from the experiment depicted in Fig. 6. Neutralized acid extracts of mitochondrial suspensions were analyzed by the present method and by an endpoint method, catalyzed by ICDH (16) and per- formed fluorometrically. Very concentrated suspensions were used as the endpoint method was about 500 times less sensitive than the recycling method. The amount of NADP was with both analyses found to be proportional to the amount of biological ma- terial. The two different analyses gave, within experimental error, identical concen- trations of NADP in the same sample. Sim- ilar results were obtained with neutralized alkaline samples. Hence, it is concluded that the present analysis in this application meas- ures NADP(H) with satisfactory accuracy.
Specificity and precision. In addition to NADP(H) the analysis will measure mer- captanes and other disulfide-reducing agents present in the extract. That is, however, of minor importance because of the multi- plication of NADP(H). It is furthermore possible to correct for the effect by incu- bating samples without enzymes. The analy-
RECYCLING ANALYSIS OF NADP AND NADPH 303
sis does no t measu re N A D or N A D H : The
rates wi th 1 n m o l of these c o e n z y m e s were
ind i s t ingu ishab le f rom the b l ank value .
The re la t ive s tandard dev ia t ion of meas-
ured rates was 0.9 and 0.4% for 10 and 40 pmol N A D P , respec t ive ly (10 de te rmina -
t ions). The sens i t iv i ty of the analys is was
abou t 0.2 pmol in ext rac ts (6-h incuba t ion) .
ACKNOWLEDGMENT
The excellent technical assistance of Mrs. Hanne Lauritzen is gratefully acknowledged.
REFERENCES
1. Warburg, O., Christian, W., and Griese, A. (1935) Biochem. Z. 282, 157.
2. Haas, E., Harrer, C. J., and Hogness, T. R. (1942) J. Biol. Chem. 142, 835.
3. Glock, G. E., and McLean, P. (1955)Biochem. J. 61, 381.
4. Lowry, O. H., Passonneau, J. V., Schulz, D. W., and Rock, M. K. (1961)J. Biol. Chem. 236, 2746.
5. Villee, C. A. (1962) Biochem. J. 83, 191. 6. Pastan, I., Wills, V., Herring, B., and Fields, J. B.
(1963) J. Biol. Chem. 238, 3362. 7. Slater, T. F., Sawyer, B., and Str~iuli, U. (1964)
Arch. Int. Physiol. Biochim. 72, 427. 8. Greenbaum, A. L., Clark, J. B., and McLean, P.
(1965) Biochem. J. 95, 161. 9. Rhodes, M. J. C., and Wooltorton, L. S. C. (1968)
Phytochemistry 7, 337.
10. Nisselbaum, J. S., and Green, S. (1969)Anal. Bio- chem. 27, 212.
11. Grassetti, D. R., and Murray, J. F., Jr. (1967)Anal. Biochem. 21,427.
12. Bitny-Szlachto, S., and SoUich, A. (1970) Acta Bio- chim. Polon. 17, 175.
13. Conn, E. E., and Vennesland, B. (1951)J. Biol. Chem. 192, 17.
14. Ellman, G. L. (1959)Arch. Biochem. Biophys. 82, 70.
15. Habeeb, A. F. S. A. (1972) in Methods in Enzy- mology (Hirs, C. H., and Timasheff, S. N., eds.), Vol. 25, p. 457, Academic Press, New York.
16. Ciotti, M. M., and Kaplan, N. O. (1957)in Methods in Enzymology (Colowick, S. P., and Kaplan, N. O., eds.), Vol. 3, p. 892, Academic Press, New York.
17. Klingenberg, M. (1974) in Methods of Enzymatic Analysis (Bergmeyer, H. U., ed.), 2nd ed., Vol. 4, pp. 2046, 2048, Verlag Chemie, Weinheim.
18. Rasmussen, U. F. (1969) FEBS Lett. 2, 157. 19. Lowry, O. H., Passonneau, J. V., and Rock, M. K.
(1961) J. Biol. Chem. 236, 2756. 20. Estabrook, R. W., Williamson, J. R., Frenkel, R.,
and Maitra, P. K. (1967) in Methods in Enzy- mology (Estabrook, R. W., and Pullman, M. E., eds.), Vol. 10, p. 474, Academic Press, New York.
21. Moroff, G., and Brandt, K. G. (1973)Arch. Bio- chem. Biophys. 159, 468.
22. Chi, M. M.-Y., Lowry, C. V., and Lowry, O. H. (1978)Anal. Biochem. 89, 119.
23. Lowry, O. H., and Passonneau, J. V. (1972) A Flexible System of Enzymatic Analysis, pp. 132-133, Academic Press, New York.