Embed Size (px)
Citation preview

EXPERIMENTAL STUDIES OF EXPERIMENTAL STUDIES OF RED ALDER NUTRITION ON RED ALDER NUTRITION ON
VANCOUVER ISLANDVANCOUVER ISLAND
Kevin Brown, KR Brown and Kevin Brown, KR Brown and Associates, Victoria, BCAssociates, Victoria, BC
Paul Courtin, BC Ministry of Forests, Paul Courtin, BC Ministry of Forests, Nanaimo, BCNanaimo, BC

But why nutrition? Alder fixes nitrogen !
Importance of fixing atmospheric N2 and its impact on red alder, coniferous associates, ecosystems has driven much research
Much less research on effects of nutrition on red alder

Do mineral nutrient deficiencies limit the growth of red alder on Vancouver Island ?
Rationale:Evidence relating site index and nutrient availability
Ongoing study of management regimes: density, pruning,thinning, mixtures in conjunction with HSC at OSU
E. Vancouver Island, Sunshine Coast identified as prime areas for intensified management
N
50 km
Glasshouse
Single tree plot
Stand-level

Previous work on alder nutrition and growth
Correlative studies: Courtin 1992; Harrington and Courtin 1994
Field studies: alder after alder or Douglas-firCole et al. 1990; Compton et al. 1997; Compton and Cole 2001
Seedling and young plantation studiesBinkley 1986; Radwan and DeBell 1994; Hurd and DeBell 2001
P seemed to be important
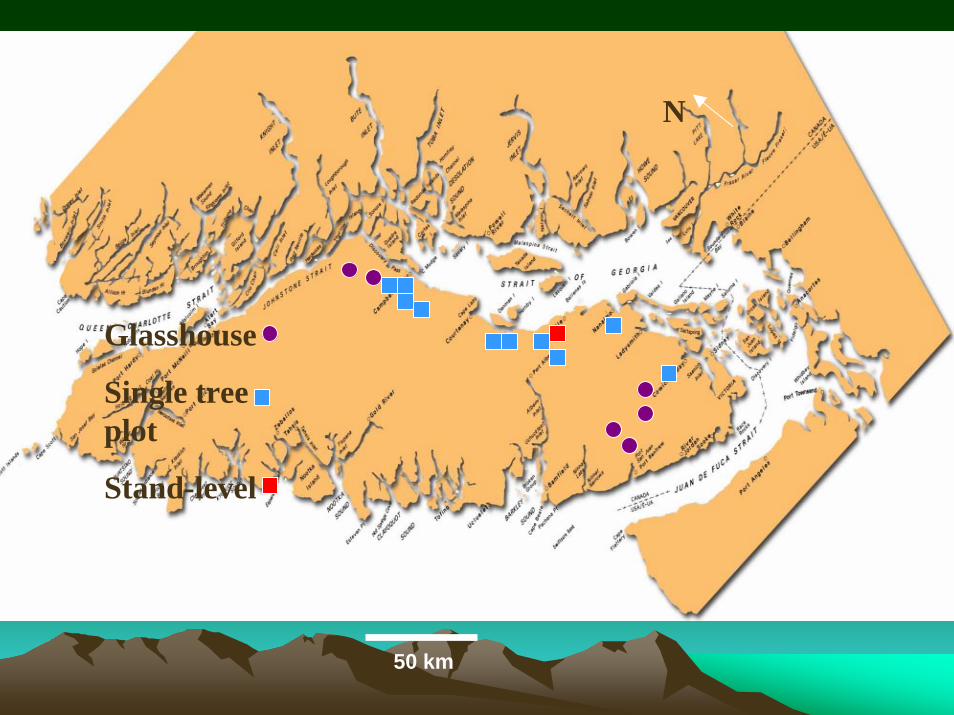
General Questions:
Is growth limited by deficiencies of mineral nutrients? If so, which ones and in which sites?
What are the long-term effects of adding those nutrients on different sites?
Experimental approaches:
Potted seedlingsSingle-tree plot fertilization experimentsMulti-tree plot experiments

Glasshouse—effects of P additions and liming
Rationale: indication that P supply might limit growth of alder in lower-pH soils
Grew seedlings in soils from alluvial alder stands on Vancouver Island: west of Cowichan Lake and north of Campbell River
All sites classified as having rich-very rich soil nutrient regimes4 sites “low pH” (4.5) 2 sites “high pH” (5.5)
Fertilized with P, dolomitic lime, grew for three months

Soil nutrient regime (SNR) and Soil Moisture Regime (SMR)
Integral part of BC biogeoclimatic ecosystem classification system – guide to forest management decisions
Determined using field-identifiable site and soil characteristics, composition of flora
Related to site index
SNR related to soil nutrient availability
Bray-P (ppm)5 10 15 20 25 30
Res
pons
e (%
)
0
100
200
300
400P1P2
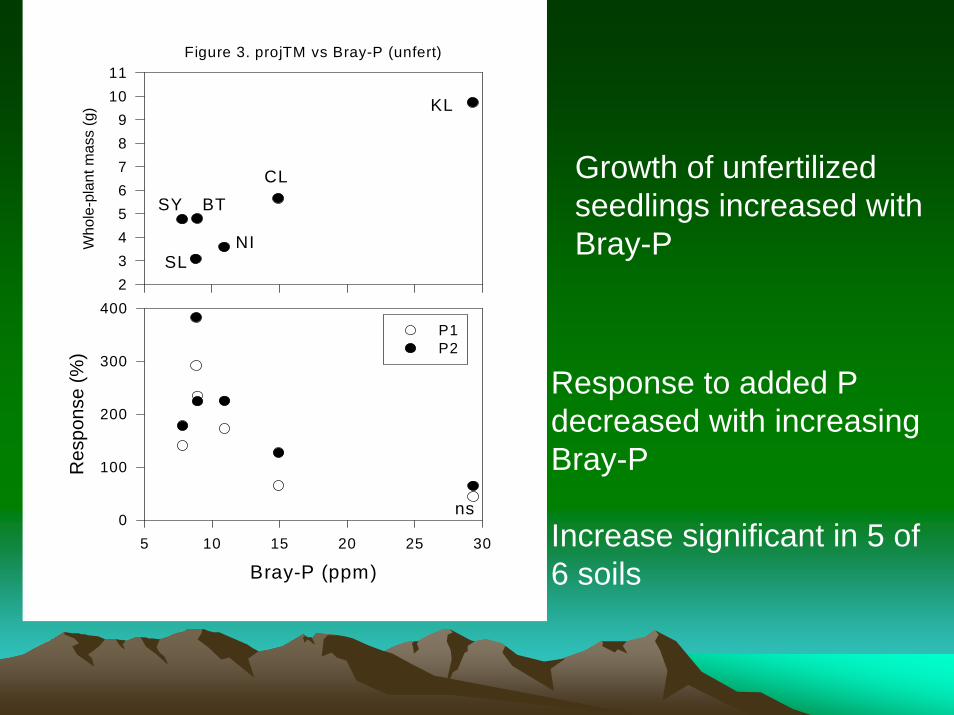
Figure 3. projTM vs Bray-P (unfert)
Who
le-p
lant
mas
s (g
)
23456789
1011
KL
CL
SL
SY BT
NI
ns
Response to added P decreased with increasing Bray-P
Increase significant in 5 of 6 soils
Growth of unfertilized seedlings increased with Bray-P
Who
le-p
lant
Mas
s (g
)
2
4
6
8
10
12
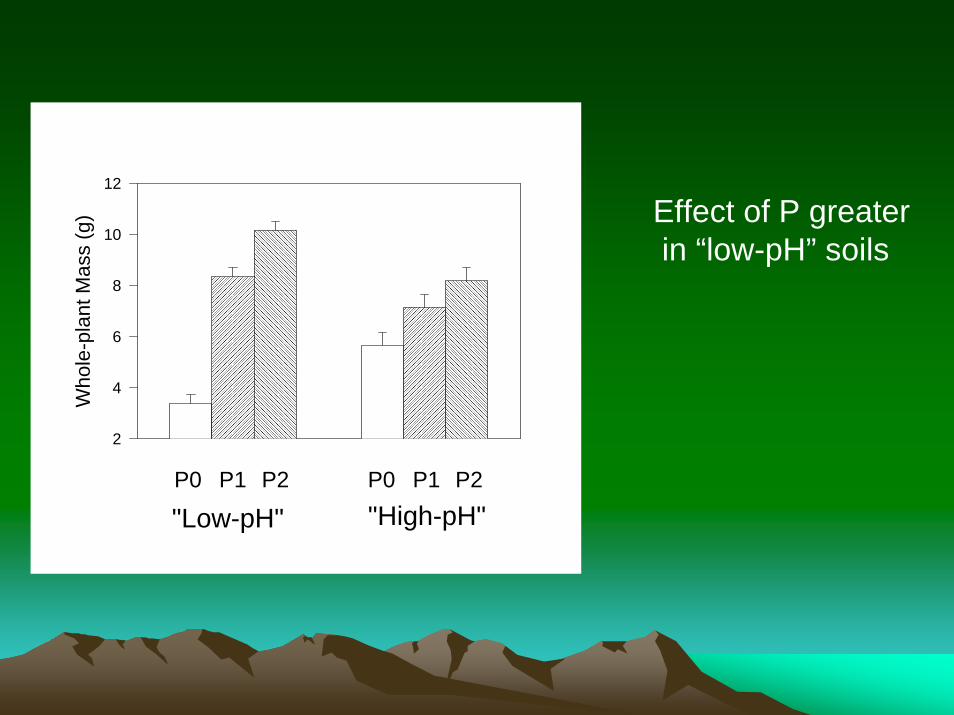
P0 P1 P2 P0 P1 P2
"Low-pH" "High-pH"
Effect of P greaterin “low-pH” soils

Addition of dolomite increased pH, Mg uptake---did not affect growth
Conclude P deficiencies may limit growth of red alder even in sites classified as very rich

Field experiments: single-tree plot
Rationale:Confirm whether nutrient deficiencies existed in field
sites
Only very small plantations available
Disadvantage:Can’t assess long-term effects at stand level

Site AgeDominant Tree Species
Bray-P(ppm)
CEC(cmol/kg)
Malaspina (M) 4 P. menziesii 37.8 5.6
Bowser (B) 4 P. menziesii 11.4 4.3
French Creek (FC) 4 P. menziesii 91.6 2.8
Quinsam (Q) 3 P. menziesii 48.5 3.5
Hillcrest (Hill) 2 P. menziesii 118.5 4.1
FannyBayDry (FBD) 1 A. rubra 3 7.5
FannyBayWet (FBW) 1 A. rubra 6.8 10.8CampbellR Lower (CRL) 1
A. rubra / P.trichocarpa 3.5 5.7
CampbellRUpper(CRU) 1 P. menziesii 124.9 2.3
HarryRoad (HR) 0 A. rubra 6.8 9.1

SOIL NUTRIENT REGIME
MOISTURE Very poor Poor Medium Rich VeryRich
Very_Dry 0 02
Mod_Dry 1 03 04
Mod_Dry 2 Hill CRU FC M
Sl_Dry 3 B
Fresh 4 01 Q 05
Moist 5 06 FBD, HR 07
VeryMoist 6 FBW, CRL
Wet 7 11 12


TreatmentsAdded P with or without other elements: 0,10, 20, 30 g P
per tree in younger; 0, 20, 40 g P in older
Other elements added in appropriate proportion relative to P
Older plantations – removed understory and then banded fertilizers
Younger plantations: placed fertilizer in dibble holes
Responses measured for up to three years

Single-tree plot experiments:
Older plantations—little or no growth response to either P or blend fertilizer
Younger plantations—growth response to P, not to other added elements
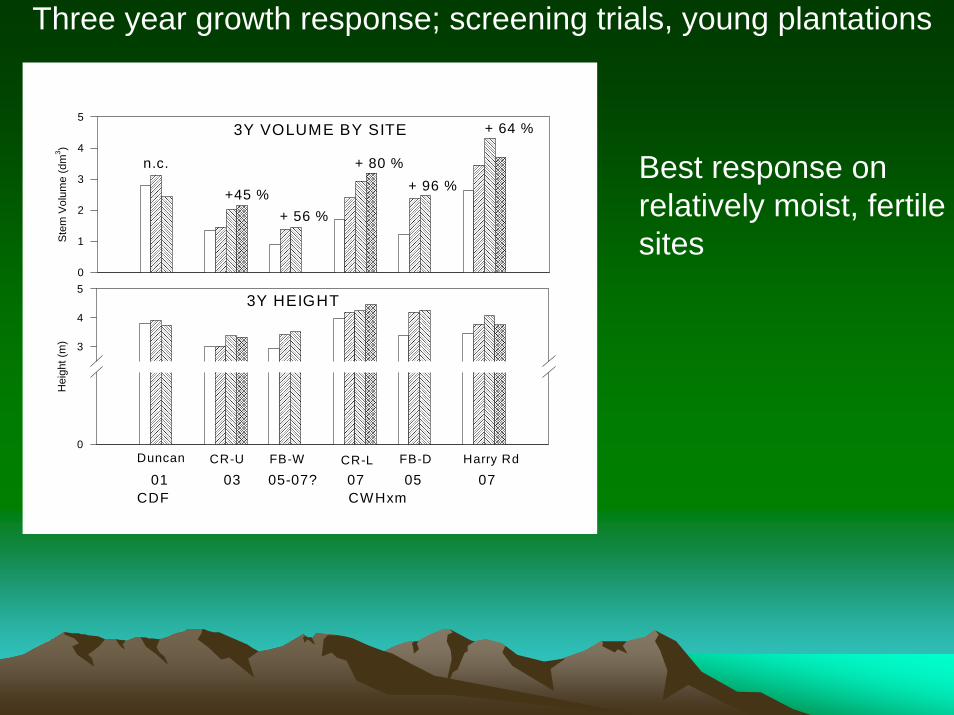
3Y VOLUME BY SITE
Stem
Vol
ume
(dm
3 )
0
1
2
3
4
5
3Y HEIGHT
Hei
ght (
m)
0
3
4
5
Duncan Harry RdCR-U FB-DFB-W CR-L
n.c.
+45 %+ 56 %
+ 80 %+ 96 %
+ 64 %
0301 0505-07? 0707CDF CWHxm
Three year growth response; screening trials, young plantations
Best response on relatively moist, fertile sites

Single-tree plot experiment (cont’d)
P fertilizerincreased growth and Y1 foliar concentrations ofP, N (all sites) Ca, Mg, S (some sites)
decreased Zn (all sites) K, B, Cu, Mn (some sites)
Blend fertilizerincreased N, K, Mg, S, B, Zn but did not increase growth
Conclude P availability limited growth

Foliar P (g kg-1)
1.0 1.2 1.4 1.6 1.8 2.0 2.2 2.4 2.6 2.8 3.0
Stem
Vol
ume
(dm
3 )
0
1
2
3
4
5
FBDFBWCRLCRUHR
Stem
vol
ume
(dm
3)
2
4
6
8
10
12
14
16
18
MQBFC
a
b
Older plantations
Younger plantations


Why were older plantations less responsive?
Trees were bigger: volumes in 4 year old plantations 84X greater than in 1 year old, but P addition only 2X
Soil in older plantations had higher P levels
Foliage in older plantations had greater P concentrations
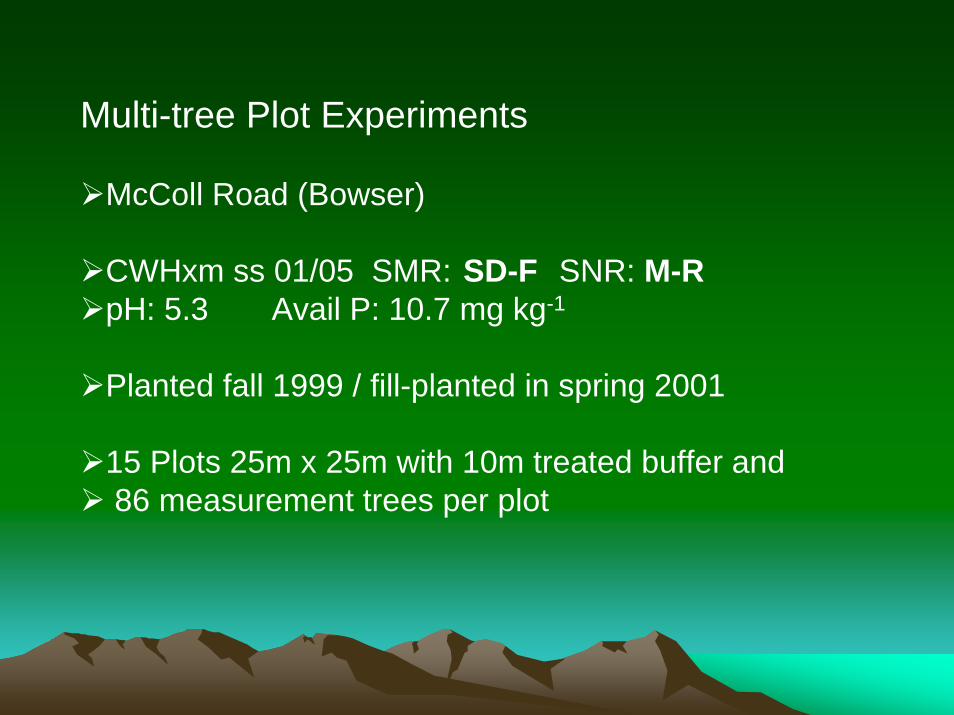
Multi-tree Plot Experiments
McColl Road (Bowser)
CWHxm ss 01/05 SMR: SD-F SNR: M-RpH: 5.3 Avail P: 10.7 mg kg-1
Planted fall 1999 / fill-planted in spring 2001
15 Plots 25m x 25m with 10m treated buffer and86 measurement trees per plot

Soil (Bray-extractable) P (mg kg-1)
2 4 6 8 10 12 14 16 18 20 22 24
Ste
m v
olum
e (c
m3 )
0
5
10
15
20
25
30
35
40
45
Y = 1.496P + 4.730 r2 = 0.49
Prior to P additions, stem volume increased with soil Bray-P

Treatments
0, 15, 30 g P per tree in spring 2001
Treatments randomly assigned
Attempt to maintain differences in foliar P
All trees re-fertilized in 2002, 2003, 2004; cumulative P additions of 0, 41, 88 g P/tree (0, 58, 124 kg P/ha)
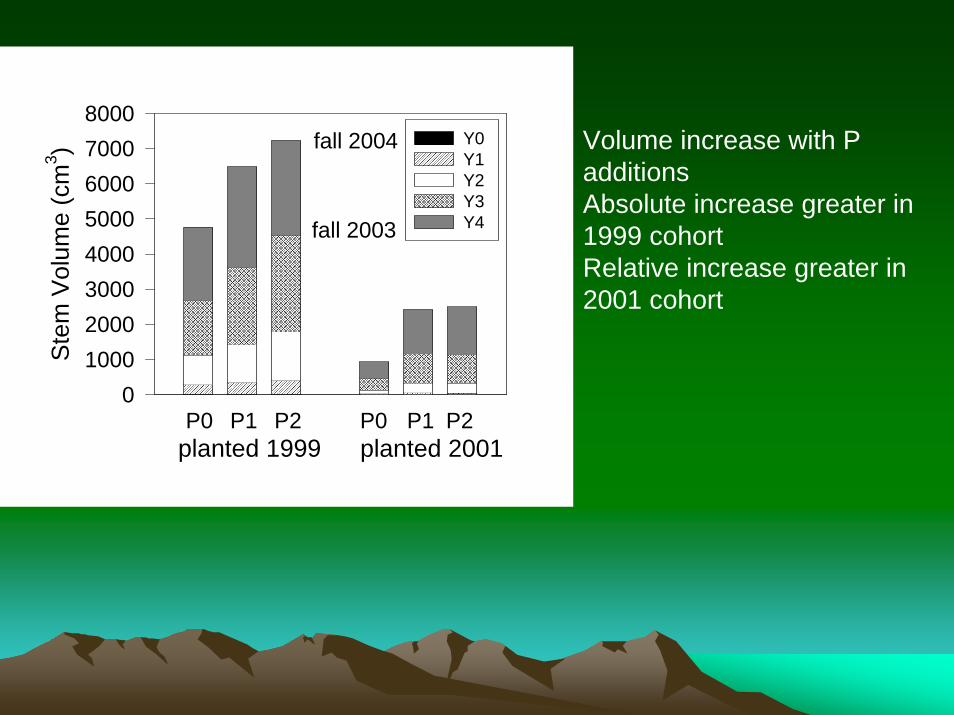
Ste
m V
olum
e (c
m3 )
010002000300040005000600070008000
Y0 Y1Y2Y3Y4
planted 1999 planted 2001P0 P1 P2 P0 P1 P2
fall 2004
fall 2003
Volume increase with P additionsAbsolute increase greater in 1999 cohortRelative increase greater in 2001 cohort

1999 cohort
Mor
talit
y (%
)
05
1015202530
2002 2003 2004
2001 cohort
Mor
talit
y (%
)
05
1015202530
P0 P1 P2
Mortality greater in younger trees
Unaffected by P treatment through 4 years
Mortality greater in 2003, 2004, than in 2002; drought???

Month3 4 5 6 7 8 9 10
Prec
ipita
tion(
mm
)
0
20
40
60
80
100normal 2001200220032004
Growing season precipitation close to normal in 2001, 2002;Below-normal in 2003, early 2004

What we’ve learned…
P additions often increase growth of very young red alder
Growth responses are greatest at:addition rates of 20-30 g P / tree within year of
plantinglow soil P concentrations (< 15 ppm) or
• low foliar P concentrations (< 0.18 %)
Soil or foliar P is a better predictor of response than is BEC soil nutrient regime
Haven’t seen growth responses to addition of elements other than P

Some things we don’t know…
Why were bigger trees less responsive ?
How long do the effects of P fertilization last ?
Does P fertilization increase N accumulation?
Are of P-fertilized alders more susceptible to frost damage ?
Are P- fertilized alders more susceptible to moisture stress ?
At what rate does P fertilization induce deficiencies of other elements?