Embed Size (px)
Citation preview
Fargo-Moorhead Metro Feasibility Appendix G-EX-E-1
February 28, 2011 Cost Estimates-Exhibit E
RED RIVER DIVERSION
FARGO – MOORHEAD METRO FLOOD RISK
MANAGEMENT PROJECT,
FEASIBILITY STUDY, PHASE 4
APPENDIX G – COST ESTIMATES
EXHIBIT E – PRELIMINARY EARTHWORK ANALYSIS
Report for the US Army Corps of Engineers, and the cities of Fargo, ND &
Moorhead, MN
By: Barr Engineering Co.
FINAL – February 28, 2011
TABLE OF CONTENTS
G-E1.0 PRELIMINARY EARTHWORK ANALYSIS ................................................... 2
ATTACHMENTS
G-E1.0 Preliminary Earthwork Analysis
Fargo-Moorhead Metro Feasibility Appendix G-EX-E-2
February 28, 2011 Cost Estimates-Exhibit E
APPENDIX G
COST ESTIMATES
EXHIBIT E – PRELIMINARY EARTHWORK ANALYSIS
G-E1.0 PRELIMINARY EARTHWORK ANALYSIS
Attachment G-E1.0 of this Exhibit E presents the preliminary earthwork analysis used to
develop crews and productivities in the MII cost estimates, including the following
information, computations and assumptions:
• Manitoba Floodway Expansion Images – Excavation & Haul
• Work Analysis – City of Fargo Images – Borrow Pits
• Work Analysis – Earthwork Crews
• Work Analysis – Earthwork – Topsoil Stripping and Stockpiling
• Work Analysis – Earthwork – Type 1 Non-Saturated Non-Brenna
• Work Analysis – Earthwork – Type 2 Saturated Non-Brenna
• Work Analysis – Earthwork – Type 3 Oxidized Brenna
• Work Analysis – Earthwork – Type 4 Brenna
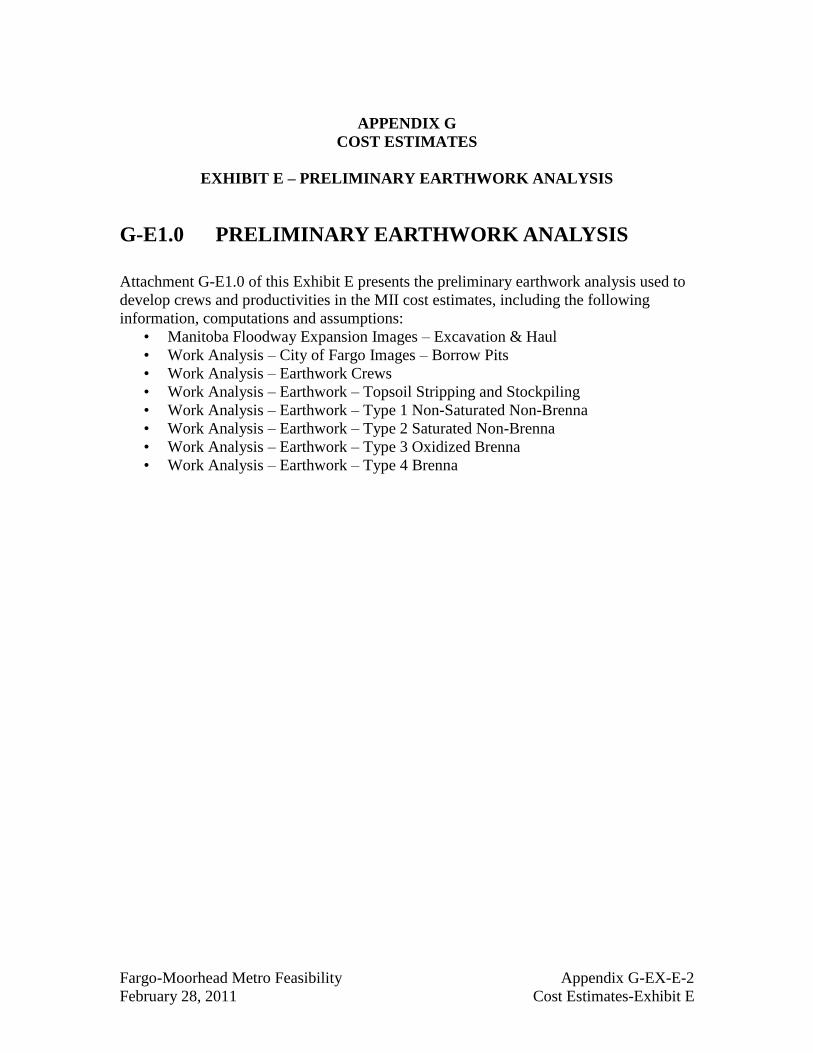
Exhibit_G-E1_0_Preliminary_Earthwork_Analysis Page 1
Job Number: 34-091-004.300.500
Barr Engineering Company
Project: Fargo-Moorhead Metro Flood Risk Management Project Computed: MRM Date 7/26/2010
Subject: Phase 3 Cost Estimate Checked: MW1 Date 7/26/2010
Task: Work Analysis - Manitoba Floodway Expansion Images - Excavation & Haul Sheet: 1 of 10
Status: draft
Images courtesy of Manitoba Floodway Authority - Floodway Expansion 2005-2007
http://www.floodwayauthority.mb.ca/construction_status.html#
Shallow material excavated with scraper fleet
Working on stronger material to excavate weaker underlying material Articulated Dump Truck -CAT D400E, 28.6 cy heaped max capacity
P:\Mpls\34 ND\09\34091004 Fargo Moorhead Metropolitan Feas. Study\WorkFiles\Project Data\Phase3\700_Cost_Est\Report_Exhibits\Exhibit_G-E1_0_Preliminary_Earthwork_Analysis Page 1
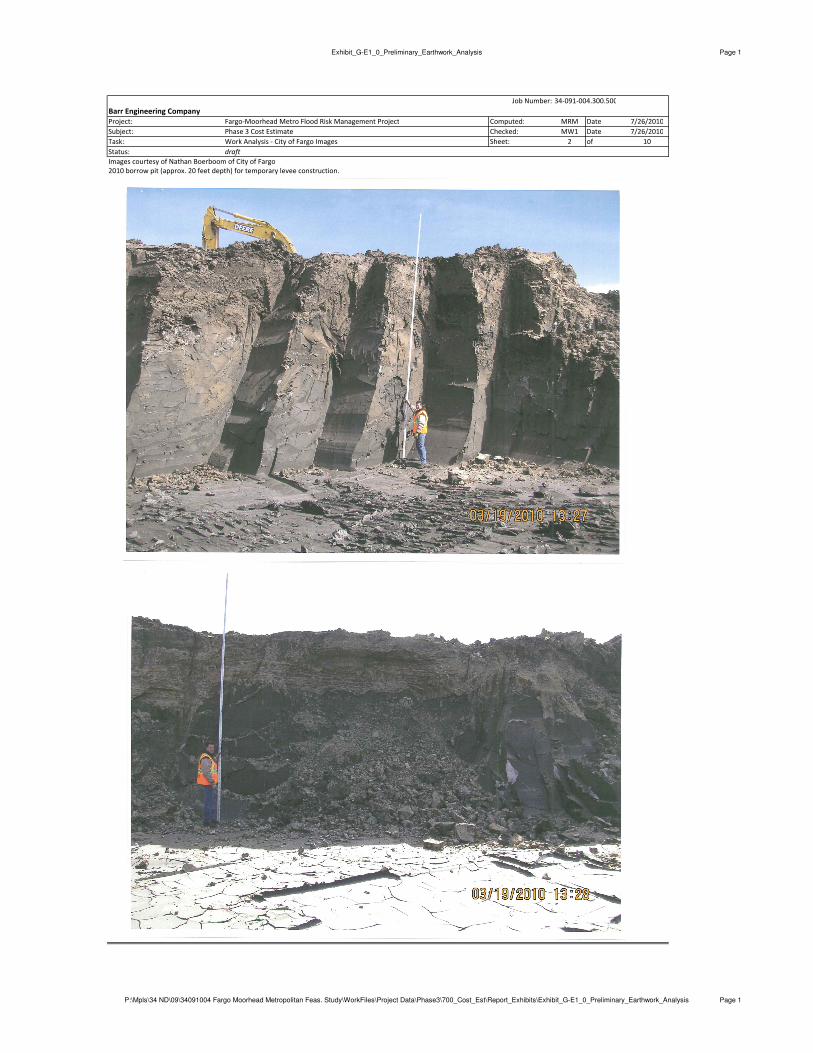
Exhibit_G-E1_0_Preliminary_Earthwork_Analysis Page 1
Job Number: 34-091-004.300.500
Barr Engineering Company
Project: Fargo-Moorhead Metro Flood Risk Management Project Computed: MRM Date 7/26/2010
Subject: Phase 3 Cost Estimate Checked: MW1 Date 7/26/2010
Task: Work Analysis - City of Fargo Images Sheet: 2 of 10
Status: draft
Images courtesy of Nathan Boerboom of City of Fargo
2010 borrow pit (approx. 20 feet depth) for temporary levee construction.
P:\Mpls\34 ND\09\34091004 Fargo Moorhead Metropolitan Feas. Study\WorkFiles\Project Data\Phase3\700_Cost_Est\Report_Exhibits\Exhibit_G-E1_0_Preliminary_Earthwork_Analysis Page 1
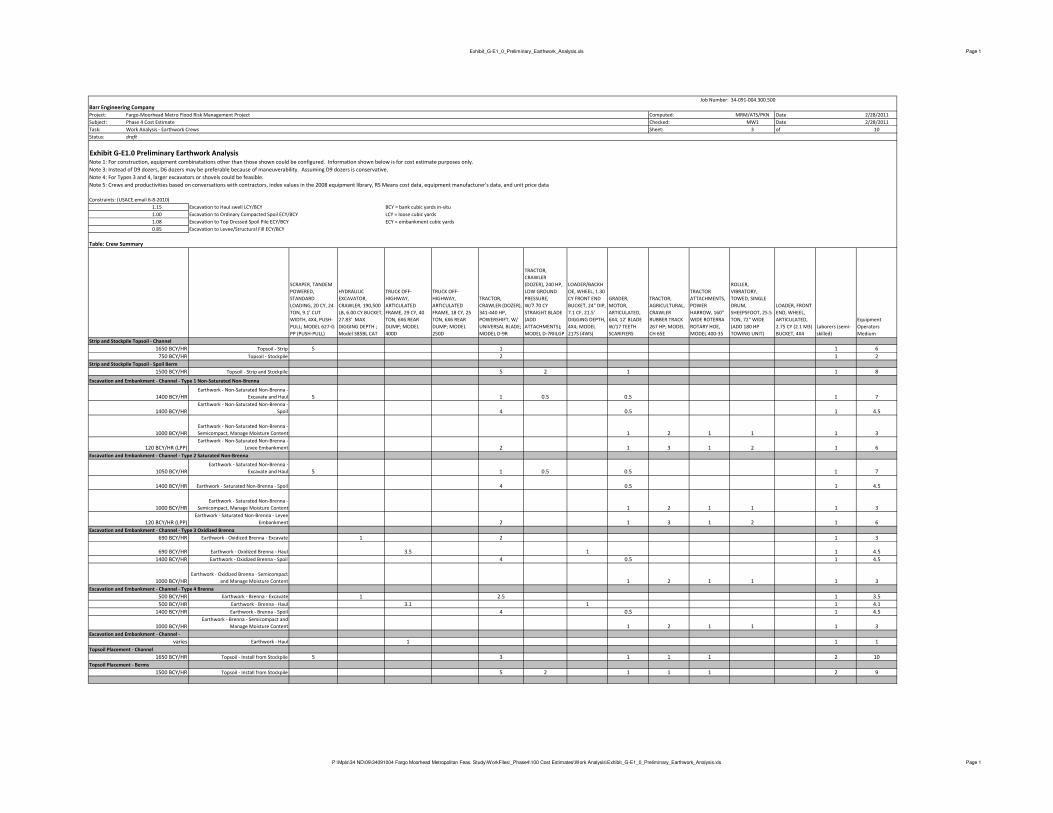
Exhibit_G-E1_0_Preliminary_Earthwork_Analysis.xls Page 1
Job Number: 34-091-004.300.500
Barr Engineering Company
Project: Fargo-Moorhead Metro Flood Risk Management Project Computed: MRM/ATS/PKN Date 2/28/2011
Subject: Phase 4 Cost Estimate Checked: MW1 Date 2/28/2011
Task: Work Analysis - Earthwork Crews Sheet: 3 of 10
Status: draft
Exhibit G-E1.0 Preliminary Earthwork AnalysisNote 1: For construction, equipment combinatations other than those shown could be configured. Information shown below is for cost estimate purposes only.
Note 3: Instead of D9 dozers, D6 dozers may be preferable because of maneuverability. Assuming D9 dozers is conservative.
Note 4: For Types 3 and 4, larger excavators or shovels could be feasible.
Note 5: Crews and productivities based on conversations with contractors, index values in the 2008 equipment library, RS Means cost data, equipment manufacturer's data, and unit price data
Constraints: (USACE email 6-8-2010)
1.15 Excavation to Haul swell LCY/BCY BCY = bank cubic yards in-situ
1.00 Excavation to Ordinary Compacted Spoil ECY/BCY LCY = loose cubic yards
1.08 Excavation to Top Dressed Spoil Pile ECY/BCY ECY = embankment cubic yards
0.85 Excavation to Levee/Structural Fill ECY/BCY
Table: Crew Summary
SCRAPER, TANDEM
POWERED,
STANDARD
LOADING, 20 CY, 24
TON, 9.1' CUT
WIDTH, 4X4, PUSH-
PULL; MODEL 627-G
PP (PUSH-PULL)
HYDRAULIC
EXCAVATOR,
CRAWLER, 190,500
LB, 6.00 CY BUCKET,
27.83' MAX
DIGGING DEPTH ;
Model 385BL CAT
TRUCK OFF-
HIGHWAY,
ARTICULATED
FRAME, 29 CY, 40
TON, 6X6 REAR
DUMP; MODEL
400D
TRUCK OFF-
HIGHWAY,
ARTICULATED
FRAME, 18 CY, 25
TON, 6X6 REAR
DUMP; MODEL
250D
TRACTOR,
CRAWLER (DOZER),
341-440 HP,
POWERSHIFT, W/
UNIVERSAL BLADE;
MODEL D-9R
TRACTOR,
CRAWLER
(DOZER), 240 HP,
LOW GROUND
PRESSURE,
W/7.70 CY
STRAIGHT BLADE
(ADD
ATTACHMENTS);
MODEL D-7RIILGP
LOADER/BACKH
OE, WHEEL, 1.30
CY FRONT END
BUCKET, 24" DIP,
7.1 CF, 21.5'
DIGGING DEPTH,
4X4; MODEL
217S (4WS)
GRADER,
MOTOR,
ARTICULATED,
6X4, 12' BLADE
W/17 TEETH
SCARIFIERS
TRACTOR,
AGRICULTURAL,
CRAWLER
RUBBER TRACK
267 HP; MODEL
CH 65E
TRACTOR
ATTACHMENTS,
POWER
HARROW, 160"
WIDE ROTERRA
ROTARY HOE,
MODEL 400-35
ROLLER,
VIBRATORY,
TOWED, SINGLE
DRUM,
SHEEPSFOOT, 25.5
TON, 72" WIDE
(ADD 180 HP
TOWING UNIT)
LOADER, FRONT
END, WHEEL,
ARTICULATED,
2.75 CY (2.1 M3)
BUCKET, 4X4
Laborers (semi-
skilled)
Equipment
Operators
Medium
Strip and Stockpile Topsoil - Channel
1650 BCY/HR Topsoil - Strip 5 1 1 6
750 BCY/HR Topsoil - Stockpile 2 1 2
Strip and Stockpile Topsoil - Spoil Berm
1500 BCY/HR Topsoil - Strip and Stockpile 5 2 1 1 8
Excavation and Embankment - Channel - Type 1 Non-Saturated Non-Brenna
1400 BCY/HR
Earthwork - Non-Saturated Non-Brenna -
Excavate and Haul 5 1 0.5 0.5 1 7
1400 BCY/HR
Earthwork - Non-Saturated Non-Brenna -
Spoil 4 0.5 1 4.5
1000 BCY/HR
Earthwork - Non-Saturated Non-Brenna -
Semicompact, Manage Moisture Content 1 2 1 1 1 3
120 BCY/HR (LPP)
Earthwork - Non-Saturated Non-Brenna -
Levee Embankment 2 1 3 1 2 1 6
Excavation and Embankment - Channel - Type 2 Saturated Non-Brenna
1050 BCY/HR
Earthwork - Saturated Non-Brenna -
Excavate and Haul 5 1 0.5 0.5 1 7
1400 BCY/HR Earthwork - Saturated Non-Brenna - Spoil 4 0.5 1 4.5
1000 BCY/HR
Earthwork - Saturated Non-Brenna -
Semicompact, Manage Moisture Content 1 2 1 1 1 3
120 BCY/HR (LPP)
Earthwork - Saturated Non-Brenna - Levee
Embankment 2 1 3 1 2 1 6
Excavation and Embankment - Channel - Type 3 Oxidized Brenna
690 BCY/HR Earthwork - Oxidized Brenna - Excavate 1 2 1 3
690 BCY/HR Earthwork - Oxidized Brenna - Haul 3.5 1 1 4.5
1400 BCY/HR Earthwork - Oxidized Brenna - Spoil 4 0.5 1 4.5
1000 BCY/HR
Earthwork - Oxidized Brenna - Semicompact
and Manage Moisture Content 1 2 1 1 1 3
Excavation and Embankment - Channel - Type 4 Brenna
500 BCY/HR Earthwork - Brenna - Excavate 1 2.5 1 3.5
500 BCY/HR Earthwork - Brenna - Haul 3.1 1 1 4.1
1400 BCY/HR Earthwork - Brenna - Spoil 4 0.5 1 4.5
1000 BCY/HR
Earthwork - Brenna - Semicompact and
Manage Moisture Content 1 2 1 1 1 3
Excavation and Embankment - Channel -
varies Earthwork - Haul 1 1 1
Topsoil Placement - Channel
1650 BCY/HR Topsoil - Install from Stockpile 5 3 1 1 1 2 10
Topsoil Placement - Berms
1500 BCY/HR Topsoil - Install from Stockpile 5 2 1 1 1 2 9
P:\Mpls\34 ND\09\34091004 Fargo Moorhead Metropolitan Feas. Study\WorkFiles\_Phase4\100 Cost Estimates\Work Analysis\Exhibit_G-E1_0_Preliminary_Earthwork_Analysis.xls Page 1
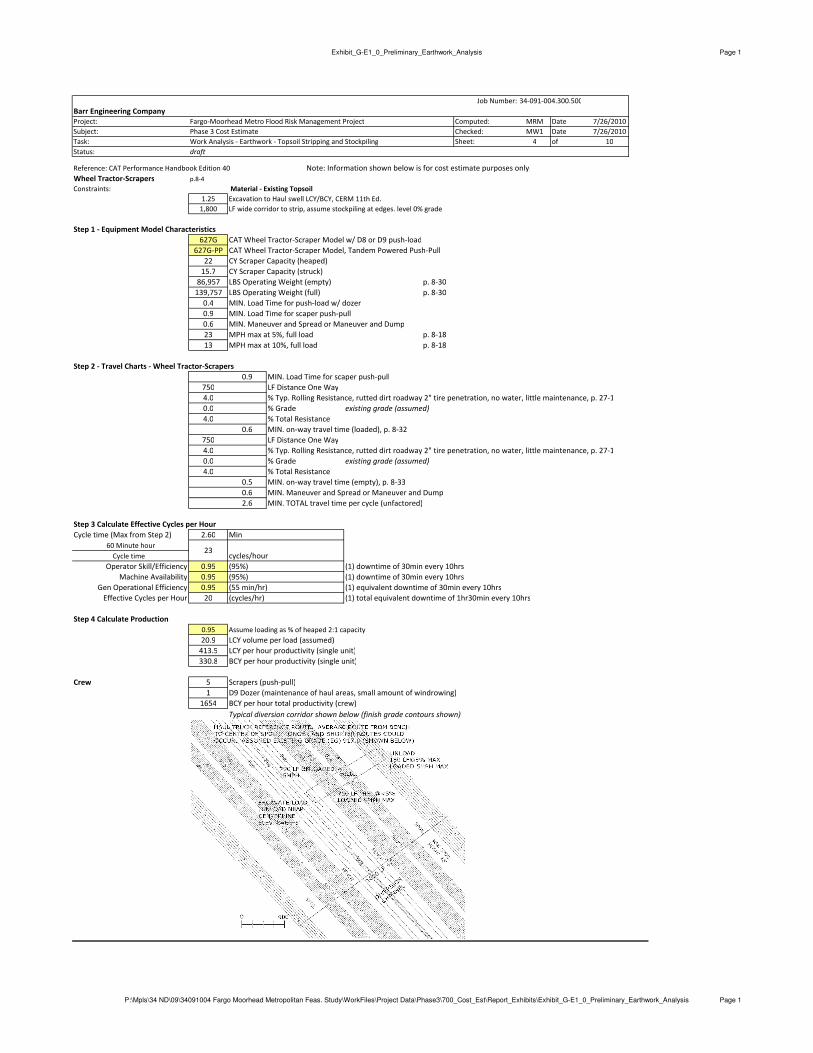
Exhibit_G-E1_0_Preliminary_Earthwork_Analysis Page 1
Job Number: 34-091-004.300.500
Barr Engineering Company
Project: Fargo-Moorhead Metro Flood Risk Management Project Computed: MRM Date 7/26/2010
Subject: Phase 3 Cost Estimate Checked: MW1 Date 7/26/2010
Task: Work Analysis - Earthwork - Topsoil Stripping and Stockpiling Sheet: 4 of 10
Status: draft
Reference: CAT Performance Handbook Edition 40 Note: Information shown below is for cost estimate purposes only.
Wheel Tractor-Scrapers p.8-4
Constraints: Material - Existing Topsoil
1.25 Excavation to Haul swell LCY/BCY, CERM 11th Ed.
1,800 LF wide corridor to strip, assume stockpiling at edges. level 0% grade
Step 1 - Equipment Model Characteristics
627G CAT Wheel Tractor-Scraper Model w/ D8 or D9 push-load
627G-PP CAT Wheel Tractor-Scraper Model, Tandem Powered Push-Pull
22 CY Scraper Capacity (heaped)
15.7 CY Scraper Capacity (struck)
86,957 LBS Operating Weight (empty) p. 8-30
139,757 LBS Operating Weight (full) p. 8-30
0.4 MIN. Load Time for push-load w/ dozer
0.9 MIN. Load Time for scaper push-pull
0.6 MIN. Maneuver and Spread or Maneuver and Dump
23 MPH max at 5%, full load p. 8-18
13 MPH max at 10%, full load p. 8-18
Step 2 - Travel Charts - Wheel Tractor-Scrapers
0.9 MIN. Load Time for scaper push-pull
750 LF Distance One Way
4.0 % Typ. Rolling Resistance, rutted dirt roadway 2" tire penetration, no water, little maintenance, p. 27-1
0.0 % Grade existing grade (assumed)
4.0 % Total Resistance
0.6 MIN. on-way travel time (loaded), p. 8-32
750 LF Distance One Way
4.0 % Typ. Rolling Resistance, rutted dirt roadway 2" tire penetration, no water, little maintenance, p. 27-1
0.0 % Grade existing grade (assumed)
4.0 % Total Resistance
0.5 MIN. on-way travel time (empty), p. 8-33
0.6 MIN. Maneuver and Spread or Maneuver and Dump
2.6 MIN. TOTAL travel time per cycle (unfactored)
Step 3 Calculate Effective Cycles per Hour
Cycle time (Max from Step 2) 2.60 Min
60 Minute hour
Cycle time cycles/hour
Operator Skill/Efficiency 0.95 (95%) (1) downtime of 30min every 10hrs
Machine Availability 0.95 (95%) (1) downtime of 30min every 10hrs
Gen Operational Efficiency 0.95 (55 min/hr) (1) equivalent downtime of 30min every 10hrs
Effective Cycles per Hour 20 (cycles/hr) (1) total equivalent downtime of 1hr30min every 10hrs
Step 4 Calculate Production
0.95 Assume loading as % of heaped 2:1 capacity
20.9 LCY volume per load (assumed)
413.5 LCY per hour productivity (single unit)
330.8 BCY per hour productivity (single unit)
Crew 5 Scrapers (push-pull)
1 D9 Dozer (maintenance of haul areas, small amount of windrowing)
1654 BCY per hour total productivity (crew)
Typical diversion corridor shown below (finish grade contours shown)
23
P:\Mpls\34 ND\09\34091004 Fargo Moorhead Metropolitan Feas. Study\WorkFiles\Project Data\Phase3\700_Cost_Est\Report_Exhibits\Exhibit_G-E1_0_Preliminary_Earthwork_Analysis Page 1
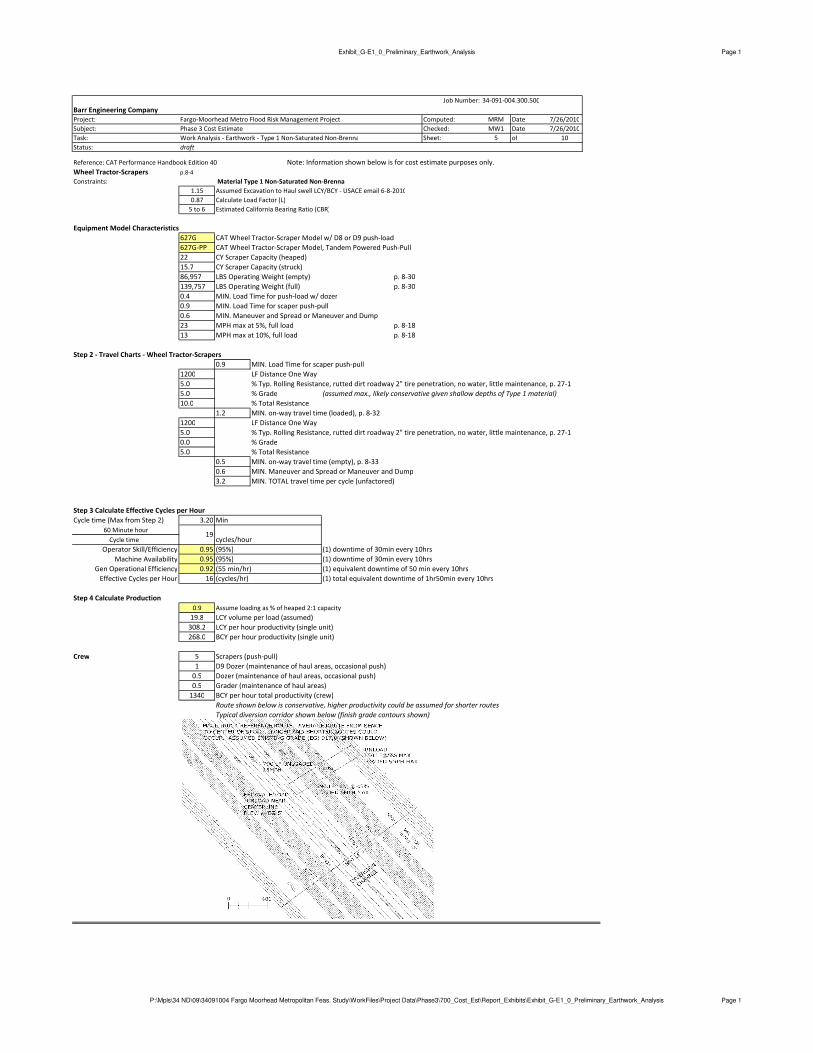
Exhibit_G-E1_0_Preliminary_Earthwork_Analysis Page 1
Job Number: 34-091-004.300.500
Barr Engineering Company
Project: Fargo-Moorhead Metro Flood Risk Management Project Computed: MRM Date 7/26/2010
Subject: Phase 3 Cost Estimate Checked: MW1 Date 7/26/2010
Task: Work Analysis - Earthwork - Type 1 Non-Saturated Non-Brenna Sheet: 5 of 10
Status: draft
Reference: CAT Performance Handbook Edition 40 Note: Information shown below is for cost estimate purposes only.
Wheel Tractor-Scrapers p.8-4
Constraints: Material Type 1 Non-Saturated Non-Brenna
1.15 Assumed Excavation to Haul swell LCY/BCY - USACE email 6-8-2010
0.87 Calculate Load Factor (L)
5 to 6 Estimated California Bearing Ratio (CBR)
Equipment Model Characteristics
627G CAT Wheel Tractor-Scraper Model w/ D8 or D9 push-load
627G-PP CAT Wheel Tractor-Scraper Model, Tandem Powered Push-Pull
22 CY Scraper Capacity (heaped)
15.7 CY Scraper Capacity (struck)
86,957 LBS Operating Weight (empty) p. 8-30
139,757 LBS Operating Weight (full) p. 8-30
0.4 MIN. Load Time for push-load w/ dozer
0.9 MIN. Load Time for scaper push-pull
0.6 MIN. Maneuver and Spread or Maneuver and Dump
23 MPH max at 5%, full load p. 8-18
13 MPH max at 10%, full load p. 8-18
Step 2 - Travel Charts - Wheel Tractor-Scrapers
0.9 MIN. Load Time for scaper push-pull
1200 LF Distance One Way
5.0 % Typ. Rolling Resistance, rutted dirt roadway 2" tire penetration, no water, little maintenance, p. 27-1
5.0 % Grade (assumed max., likely conservative given shallow depths of Type 1 material)
10.0 % Total Resistance
1.2 MIN. on-way travel time (loaded), p. 8-32
1200 LF Distance One Way
5.0 % Typ. Rolling Resistance, rutted dirt roadway 2" tire penetration, no water, little maintenance, p. 27-1
0.0 % Grade
5.0 % Total Resistance
0.5 MIN. on-way travel time (empty), p. 8-33
0.6 MIN. Maneuver and Spread or Maneuver and Dump
3.2 MIN. TOTAL travel time per cycle (unfactored)
Step 3 Calculate Effective Cycles per Hour
Cycle time (Max from Step 2) 3.20 Min
60 Minute hour
Cycle time cycles/hour
Operator Skill/Efficiency 0.95 (95%) (1) downtime of 30min every 10hrs
Machine Availability 0.95 (95%) (1) downtime of 30min every 10hrs
Gen Operational Efficiency 0.92 (55 min/hr) (1) equivalent downtime of 50 min every 10hrs
Effective Cycles per Hour 16 (cycles/hr) (1) total equivalent downtime of 1hr50min every 10hrs
Step 4 Calculate Production
0.9 Assume loading as % of heaped 2:1 capacity
19.8 LCY volume per load (assumed)
308.2 LCY per hour productivity (single unit)
268.0 BCY per hour productivity (single unit)
Crew 5 Scrapers (push-pull)
1 D9 Dozer (maintenance of haul areas, occasional push)
0.5 Dozer (maintenance of haul areas, occasional push)
0.5 Grader (maintenance of haul areas)
1340 BCY per hour total productivity (crew)
Route shown below is conservative, higher productivity could be assumed for shorter routes
Typical diversion corridor shown below (finish grade contours shown)
19
P:\Mpls\34 ND\09\34091004 Fargo Moorhead Metropolitan Feas. Study\WorkFiles\Project Data\Phase3\700_Cost_Est\Report_Exhibits\Exhibit_G-E1_0_Preliminary_Earthwork_Analysis Page 1
Exhibit_G-E1_0_Preliminary_Earthwork_Analysis Page 1
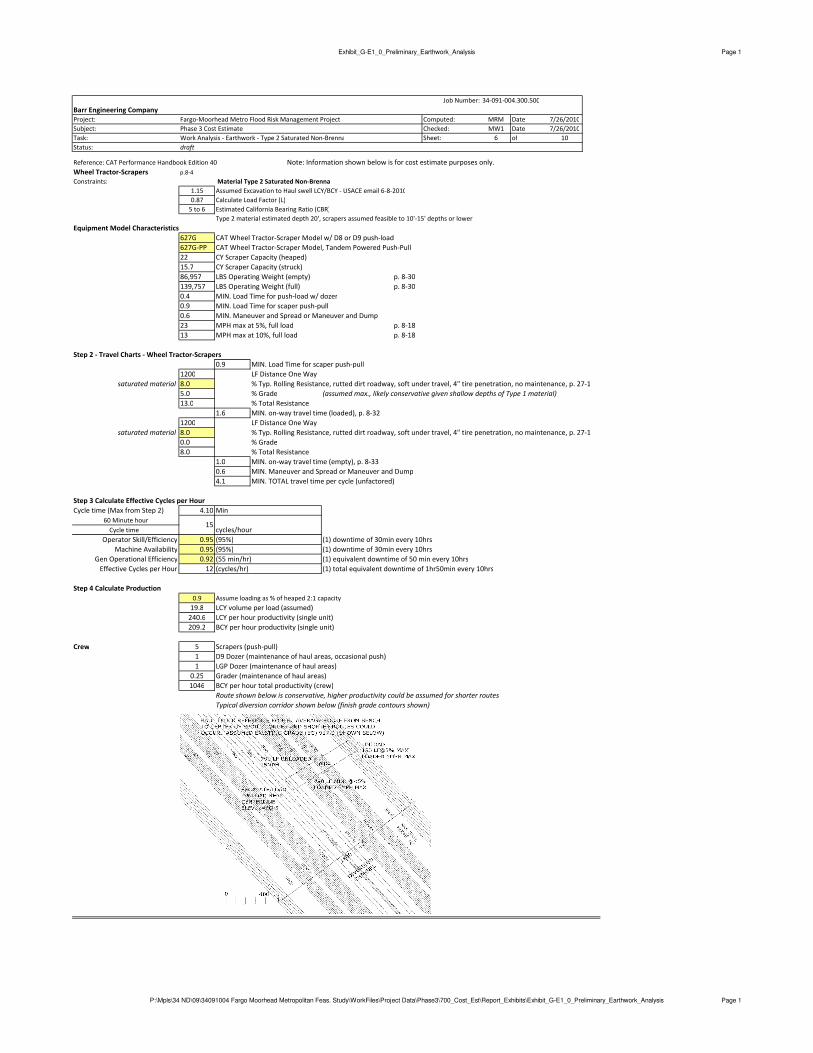
Job Number: 34-091-004.300.500
Barr Engineering Company
Project: Fargo-Moorhead Metro Flood Risk Management Project Computed: MRM Date 7/26/2010
Subject: Phase 3 Cost Estimate Checked: MW1 Date 7/26/2010
Task: Work Analysis - Earthwork - Type 2 Saturated Non-Brenna Sheet: 6 of 10
Status: draft
Reference: CAT Performance Handbook Edition 40 Note: Information shown below is for cost estimate purposes only.
Wheel Tractor-Scrapers p.8-4
Constraints: Material Type 2 Saturated Non-Brenna
1.15 Assumed Excavation to Haul swell LCY/BCY - USACE email 6-8-2010
0.87 Calculate Load Factor (L)
5 to 6 Estimated California Bearing Ratio (CBR)
Type 2 material estimated depth 20', scrapers assumed feasible to 10'-15' depths or lower.
Equipment Model Characteristics
627G CAT Wheel Tractor-Scraper Model w/ D8 or D9 push-load
627G-PP CAT Wheel Tractor-Scraper Model, Tandem Powered Push-Pull
22 CY Scraper Capacity (heaped)
15.7 CY Scraper Capacity (struck)
86,957 LBS Operating Weight (empty) p. 8-30
139,757 LBS Operating Weight (full) p. 8-30
0.4 MIN. Load Time for push-load w/ dozer
0.9 MIN. Load Time for scaper push-pull
0.6 MIN. Maneuver and Spread or Maneuver and Dump
23 MPH max at 5%, full load p. 8-18
13 MPH max at 10%, full load p. 8-18
Step 2 - Travel Charts - Wheel Tractor-Scrapers
0.9 MIN. Load Time for scaper push-pull
1200 LF Distance One Way
saturated material 8.0 % Typ. Rolling Resistance, rutted dirt roadway, soft under travel, 4" tire penetration, no maintenance, p. 27-1
5.0 % Grade (assumed max., likely conservative given shallow depths of Type 1 material)
13.0 % Total Resistance
1.6 MIN. on-way travel time (loaded), p. 8-32
1200 LF Distance One Way
saturated material 8.0 % Typ. Rolling Resistance, rutted dirt roadway, soft under travel, 4" tire penetration, no maintenance, p. 27-1
0.0 % Grade
8.0 % Total Resistance
1.0 MIN. on-way travel time (empty), p. 8-33
0.6 MIN. Maneuver and Spread or Maneuver and Dump
4.1 MIN. TOTAL travel time per cycle (unfactored)
Step 3 Calculate Effective Cycles per Hour
Cycle time (Max from Step 2) 4.10 Min
60 Minute hour
Cycle time cycles/hour
Operator Skill/Efficiency 0.95 (95%) (1) downtime of 30min every 10hrs
Machine Availability 0.95 (95%) (1) downtime of 30min every 10hrs
Gen Operational Efficiency 0.92 (55 min/hr) (1) equivalent downtime of 50 min every 10hrs
Effective Cycles per Hour 12 (cycles/hr) (1) total equivalent downtime of 1hr50min every 10hrs
Step 4 Calculate Production
0.9 Assume loading as % of heaped 2:1 capacity
19.8 LCY volume per load (assumed)
240.6 LCY per hour productivity (single unit)
209.2 BCY per hour productivity (single unit)
Crew 5 Scrapers (push-pull)
1 D9 Dozer (maintenance of haul areas, occasional push)
1 LGP Dozer (maintenance of haul areas)
0.25 Grader (maintenance of haul areas)
1046 BCY per hour total productivity (crew)
Route shown below is conservative, higher productivity could be assumed for shorter routes
Typical diversion corridor shown below (finish grade contours shown)
15
P:\Mpls\34 ND\09\34091004 Fargo Moorhead Metropolitan Feas. Study\WorkFiles\Project Data\Phase3\700_Cost_Est\Report_Exhibits\Exhibit_G-E1_0_Preliminary_Earthwork_Analysis Page 1
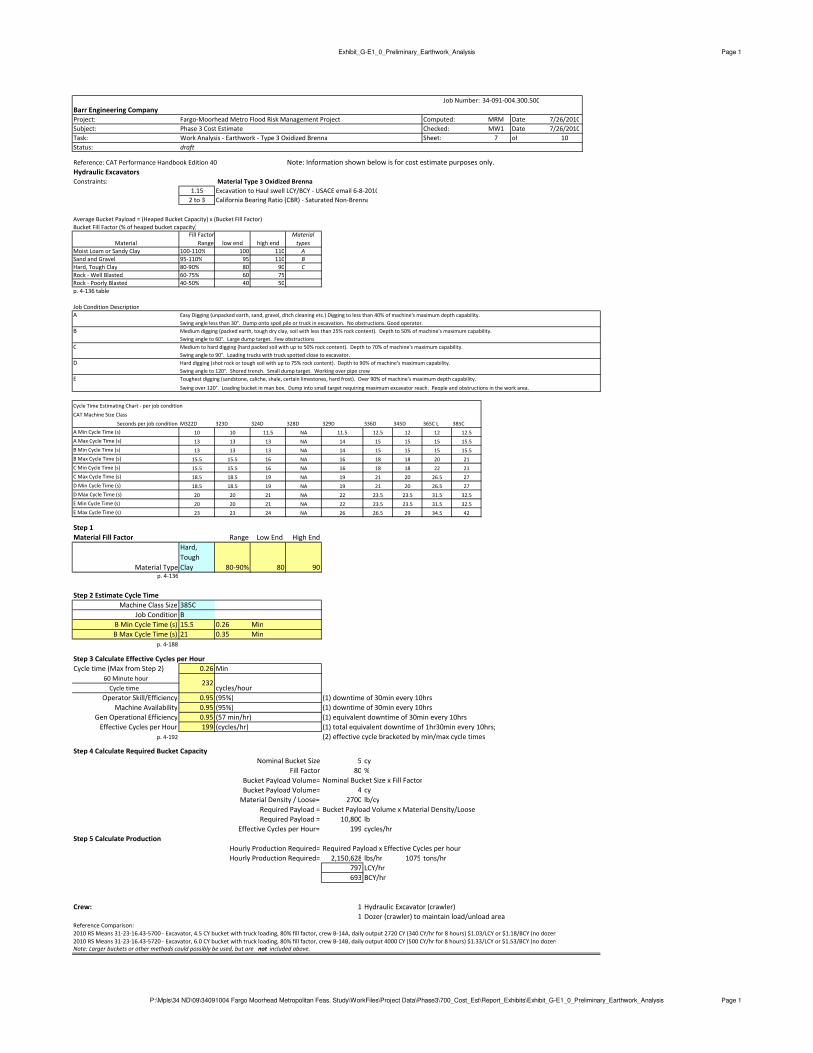
Exhibit_G-E1_0_Preliminary_Earthwork_Analysis Page 1
Job Number: 34-091-004.300.500
Barr Engineering Company
Project: Fargo-Moorhead Metro Flood Risk Management Project Computed: MRM Date 7/26/2010
Subject: Phase 3 Cost Estimate Checked: MW1 Date 7/26/2010
Task: Work Analysis - Earthwork - Type 3 Oxidized Brenna Sheet: 7 of 10
Status: draft
Reference: CAT Performance Handbook Edition 40 Note: Information shown below is for cost estimate purposes only.
Hydraulic Excavators
Constraints: Material Type 3 Oxidized Brenna
1.15 Excavation to Haul swell LCY/BCY - USACE email 6-8-2010
2 to 3 California Bearing Ratio (CBR) - Saturated Non-Brenna
Average Bucket Payload = (Heaped Bucket Capacity) x (Bucket Fill Factor)
Bucket Fill Factor (% of heaped bucket capacity)
Material
Fill Factor
Range low end high end
Material
types
Moist Loam or Sandy Clay 100-110% 100 110 A
Sand and Gravel 95-110% 95 110 B
Hard, Tough Clay 80-90% 80 90 C
Rock - Well Blasted 60-75% 60 75
Rock - Poorly Blasted 40-50% 40 50
p. 4-136 table
Job Condition Description
A Easy Digging (unpacked earth, sand, gravel, ditch cleaning etc.) Digging to less than 40% of machine's maximum depth capability.
Swing angle less than 30°. Dump onto spoil pile or truck in excavation. No obstructions. Good operator.
B Medium digging (packed earth, tough dry clay, soil with less than 25% rock content). Depth to 50% of machine's maximum capability.
Swing angle to 60°. Large dump target. Few obstructions
C Medium to hard digging (hard packed soil with up to 50% rock content). Depth to 70% of machine's maximum capability.
Swing angle to 90°. Loading trucks with truck spotted close to excavator.
D Hard digging (shot rock or tough soil with up to 75% rock content). Depth to 90% of machine's maximum capability.
Swing angle to 120°. Shored trench. Small dump target. Working over pipe crew
E Toughest digging (sandstone, caliche, shale, certain limestones, hard frost). Over 90% of machine's maximum depth capability.
Swing over 120°. Loading bucket in man box. Dump into small target requiring maximum excavator reach. People and obstructions in the work area.
Cycle Time Estimating Chart - per job condition
CAT Machine Size Class
Seconds per job condition M322D 323D 324D 328D 329D 336D 345D 365C L 385C
A Min Cycle Time (s) 10 10 11.5 NA 11.5 12.5 12 12 12.5
A Max Cycle Time (s) 13 13 13 NA 14 15 15 15 15.5
B Min Cycle Time (s) 13 13 13 NA 14 15 15 15 15.5
B Max Cycle Time (s) 15.5 15.5 16 NA 16 18 18 20 21
C Min Cycle Time (s) 15.5 15.5 16 NA 16 18 18 22 21
C Max Cycle Time (s) 18.5 18.5 19 NA 19 21 20 26.5 27
D Min Cycle Time (s) 18.5 18.5 19 NA 19 21 20 26.5 27
D Max Cycle Time (s) 20 20 21 NA 22 23.5 23.5 31.5 32.5
E Min Cycle Time (s) 20 20 21 NA 22 23.5 23.5 31.5 32.5
E Max Cycle Time (s) 23 23 24 NA 26 26.5 29 34.5 42
Step 1
Material Fill Factor Range Low End High End
Material Type
Hard,
Tough
Clay 80-90% 80 90p. 4-136
Step 2 Estimate Cycle Time
Machine Class Size 385C
Job Condition B
B Min Cycle Time (s) 15.5 0.26 Min
B Max Cycle Time (s) 21 0.35 Min
p. 4-188
Step 3 Calculate Effective Cycles per Hour
Cycle time (Max from Step 2) 0.26 Min
60 Minute hour
Cycle time cycles/hour
Operator Skill/Efficiency 0.95 (95%) (1) downtime of 30min every 10hrs
Machine Availability 0.95 (95%) (1) downtime of 30min every 10hrs
Gen Operational Efficiency 0.95 (57 min/hr) (1) equivalent downtime of 30min every 10hrs
Effective Cycles per Hour 199 (cycles/hr) (1) total equivalent downtime of 1hr30min every 10hrs;
p. 4-192 (2) effective cycle bracketed by min/max cycle times
Step 4 Calculate Required Bucket Capacity
Nominal Bucket Size 5 cy
Fill Factor 80 %
Bucket Payload Volume= Nominal Bucket Size x Fill Factor
Bucket Payload Volume= 4 cy
Material Density / Loose= 2700 lb/cy
Required Payload = Bucket Payload Volume x Material Density/Loose
Required Payload = 10,800 lb
Effective Cycles per Hour= 199 cycles/hr
Step 5 Calculate Production
Hourly Production Required= Required Payload x Effective Cycles per hour
Hourly Production Required= 2,150,628 lbs/hr 1075 tons/hr
797 LCY/hr
693 BCY/hr
Crew: 1 Hydraulic Excavator (crawler)
1 Dozer (crawler) to maintain load/unload areaReference Comparison:
2010 RS Means 31-23-16.43-5700 - Excavator, 4.5 CY bucket with truck loading, 80% fill factor, crew B-14A, daily output 2720 CY (340 CY/hr for 8 hours) $1.03/LCY or $1.18/BCY (no dozers)
2010 RS Means 31-23-16.43-5720 - Excavator, 6.0 CY bucket with truck loading, 80% fill factor, crew B-14B, daily output 4000 CY (500 CY/hr for 8 hours) $1.33/LCY or $1.53/BCY (no dozers)Note: Larger buckets or other methods could possibly be used, but are not included above.
232
P:\Mpls\34 ND\09\34091004 Fargo Moorhead Metropolitan Feas. Study\WorkFiles\Project Data\Phase3\700_Cost_Est\Report_Exhibits\Exhibit_G-E1_0_Preliminary_Earthwork_Analysis Page 1
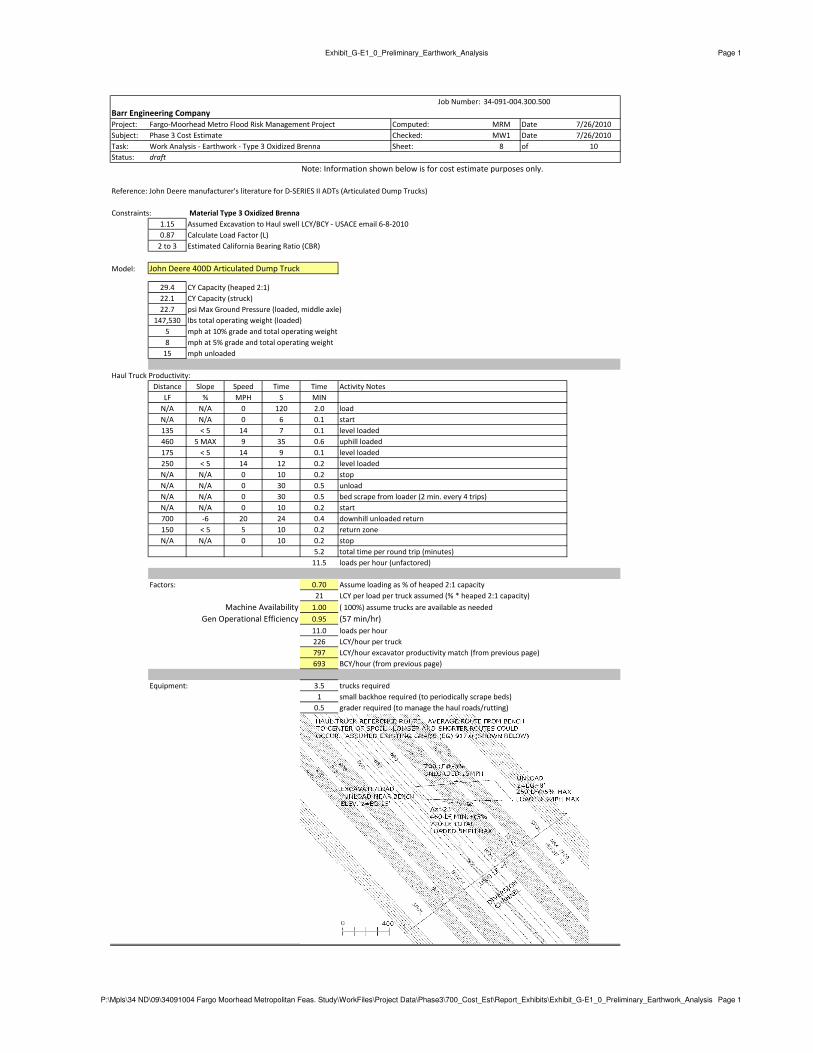
Exhibit_G-E1_0_Preliminary_Earthwork_Analysis Page 1
Job Number: 34-091-004.300.500
Barr Engineering Company
Project: Fargo-Moorhead Metro Flood Risk Management Project Computed: MRM Date 7/26/2010
Subject: Phase 3 Cost Estimate Checked: MW1 Date 7/26/2010
Task: Work Analysis - Earthwork - Type 3 Oxidized Brenna Sheet: 8 of 10
Status: draft
Note: Information shown below is for cost estimate purposes only.
Reference: John Deere manufacturer's literature for D-SERIES II ADTs (Articulated Dump Trucks)
Constraints: Material Type 3 Oxidized Brenna
1.15 Assumed Excavation to Haul swell LCY/BCY - USACE email 6-8-2010
0.87 Calculate Load Factor (L)
2 to 3 Estimated California Bearing Ratio (CBR)
Model: John Deere 400D Articulated Dump Truck
29.4 CY Capacity (heaped 2:1)
22.1 CY Capacity (struck)
22.7 psi Max Ground Pressure (loaded, middle axle)
147,530 lbs total operating weight (loaded)
5 mph at 10% grade and total operating weight
8 mph at 5% grade and total operating weight
15 mph unloaded
Haul Truck Productivity:
Distance Slope Speed Time Time Activity Notes
LF % MPH S MIN
N/A N/A 0 120 2.0 load
N/A N/A 0 6 0.1 start
135 < 5 14 7 0.1 level loaded
460 5 MAX 9 35 0.6 uphill loaded
175 < 5 14 9 0.1 level loaded
250 < 5 14 12 0.2 level loaded
N/A N/A 0 10 0.2 stop
N/A N/A 0 30 0.5 unload
N/A N/A 0 30 0.5 bed scrape from loader (2 min. every 4 trips)
N/A N/A 0 10 0.2 start
700 -6 20 24 0.4 downhill unloaded return
150 < 5 5 10 0.2 return zone
N/A N/A 0 10 0.2 stop
5.2 total time per round trip (minutes)
11.5 loads per hour (unfactored)
Factors: 0.70 Assume loading as % of heaped 2:1 capacity
21 LCY per load per truck assumed (% * heaped 2:1 capacity)
Machine Availability 1.00 ( 100%) assume trucks are available as needed
Gen Operational Efficiency 0.95 (57 min/hr)
11.0 loads per hour
226 LCY/hour per truck
797 LCY/hour excavator productivity match (from previous page)
693 BCY/hour (from previous page)
Equipment: 3.5 trucks required
1 small backhoe required (to periodically scrape beds)
0.5 grader required (to manage the haul roads/rutting)
P:\Mpls\34 ND\09\34091004 Fargo Moorhead Metropolitan Feas. Study\WorkFiles\Project Data\Phase3\700_Cost_Est\Report_Exhibits\Exhibit_G-E1_0_Preliminary_Earthwork_Analysis Page 1
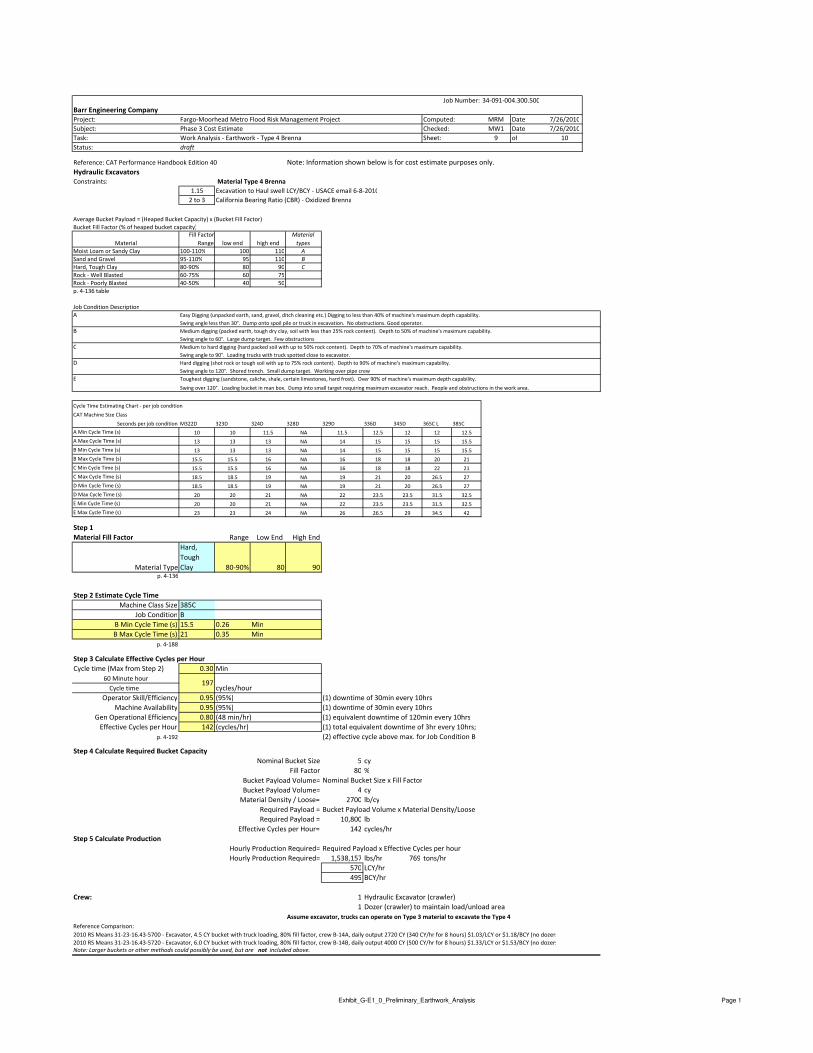
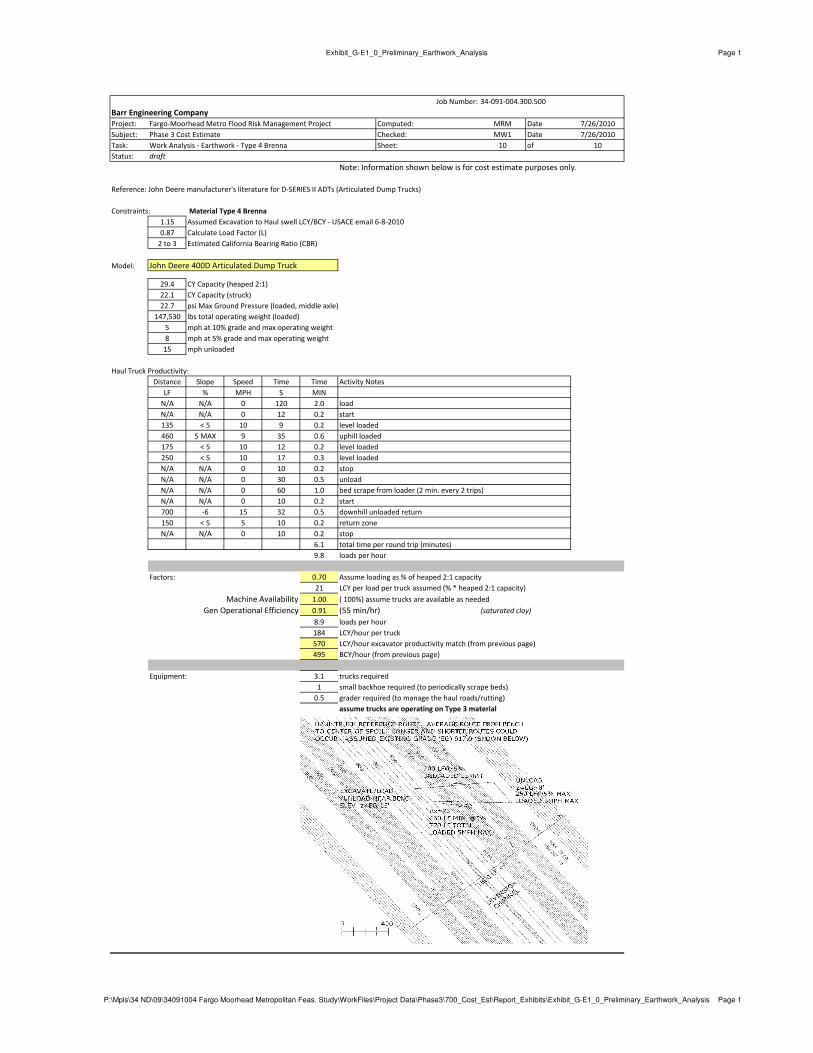
Job Number: 34-091-004.300.500
Barr Engineering Company
Project: Fargo-Moorhead Metro Flood Risk Management Project Computed: MRM Date 7/26/2010
Subject: Phase 3 Cost Estimate Checked: MW1 Date 7/26/2010
Task: Work Analysis - Earthwork - Type 4 Brenna Sheet: 9 of 10
Status: draft
Reference: CAT Performance Handbook Edition 40 Note: Information shown below is for cost estimate purposes only.
Hydraulic Excavators
Constraints: Material Type 4 Brenna
1.15 Excavation to Haul swell LCY/BCY - USACE email 6-8-2010
2 to 3 California Bearing Ratio (CBR) - Oxidized Brenna
Average Bucket Payload = (Heaped Bucket Capacity) x (Bucket Fill Factor)
Bucket Fill Factor (% of heaped bucket capacity)
Material
Fill Factor
Range low end high end
Material
types
Moist Loam or Sandy Clay 100-110% 100 110 A
Sand and Gravel 95-110% 95 110 B
Hard, Tough Clay 80-90% 80 90 C
Rock - Well Blasted 60-75% 60 75
Rock - Poorly Blasted 40-50% 40 50
p. 4-136 table
Job Condition Description
A Easy Digging (unpacked earth, sand, gravel, ditch cleaning etc.) Digging to less than 40% of machine's maximum depth capability.
Swing angle less than 30°. Dump onto spoil pile or truck in excavation. No obstructions. Good operator.
B Medium digging (packed earth, tough dry clay, soil with less than 25% rock content). Depth to 50% of machine's maximum capability.
Swing angle to 60°. Large dump target. Few obstructions
C Medium to hard digging (hard packed soil with up to 50% rock content). Depth to 70% of machine's maximum capability.
Swing angle to 90°. Loading trucks with truck spotted close to excavator.
D Hard digging (shot rock or tough soil with up to 75% rock content). Depth to 90% of machine's maximum capability.
Swing angle to 120°. Shored trench. Small dump target. Working over pipe crew
E Toughest digging (sandstone, caliche, shale, certain limestones, hard frost). Over 90% of machine's maximum depth capability.
Swing over 120°. Loading bucket in man box. Dump into small target requiring maximum excavator reach. People and obstructions in the work area.
Cycle Time Estimating Chart - per job condition
CAT Machine Size Class
Seconds per job condition M322D 323D 324D 328D 329D 336D 345D 365C L 385C
A Min Cycle Time (s) 10 10 11.5 NA 11.5 12.5 12 12 12.5
A Max Cycle Time (s) 13 13 13 NA 14 15 15 15 15.5
B Min Cycle Time (s) 13 13 13 NA 14 15 15 15 15.5
B Max Cycle Time (s) 15.5 15.5 16 NA 16 18 18 20 21
C Min Cycle Time (s) 15.5 15.5 16 NA 16 18 18 22 21
C Max Cycle Time (s) 18.5 18.5 19 NA 19 21 20 26.5 27
D Min Cycle Time (s) 18.5 18.5 19 NA 19 21 20 26.5 27
D Max Cycle Time (s) 20 20 21 NA 22 23.5 23.5 31.5 32.5
E Min Cycle Time (s) 20 20 21 NA 22 23.5 23.5 31.5 32.5
E Max Cycle Time (s) 23 23 24 NA 26 26.5 29 34.5 42
Step 1
Material Fill Factor Range Low End High End
Material Type
Hard,
Tough
Clay 80-90% 80 90p. 4-136
Step 2 Estimate Cycle Time
Machine Class Size 385C
Job Condition B
B Min Cycle Time (s) 15.5 0.26 Min
B Max Cycle Time (s) 21 0.35 Min
p. 4-188
Step 3 Calculate Effective Cycles per Hour
Cycle time (Max from Step 2) 0.30 Min
60 Minute hour
Cycle time cycles/hour
Operator Skill/Efficiency 0.95 (95%) (1) downtime of 30min every 10hrs
Machine Availability 0.95 (95%) (1) downtime of 30min every 10hrs
Gen Operational Efficiency 0.80 (48 min/hr) (1) equivalent downtime of 120min every 10hrs
Effective Cycles per Hour 142 (cycles/hr) (1) total equivalent downtime of 3hr every 10hrs;
p. 4-192 (2) effective cycle above max. for Job Condition B
Step 4 Calculate Required Bucket Capacity
Nominal Bucket Size 5 cy
Fill Factor 80 %
Bucket Payload Volume= Nominal Bucket Size x Fill Factor
Bucket Payload Volume= 4 cy
Material Density / Loose= 2700 lb/cy
Required Payload = Bucket Payload Volume x Material Density/Loose
Required Payload = 10,800 lb
Effective Cycles per Hour= 142 cycles/hr
Step 5 Calculate Production
Hourly Production Required= Required Payload x Effective Cycles per hour
Hourly Production Required= 1,538,157 lbs/hr 769 tons/hr
570 LCY/hr
495 BCY/hr
Crew: 1 Hydraulic Excavator (crawler)
1 Dozer (crawler) to maintain load/unload area
Assume excavator, trucks can operate on Type 3 material to excavate the Type 4
Reference Comparison:
2010 RS Means 31-23-16.43-5700 - Excavator, 4.5 CY bucket with truck loading, 80% fill factor, crew B-14A, daily output 2720 CY (340 CY/hr for 8 hours) $1.03/LCY or $1.18/BCY (no dozers)
2010 RS Means 31-23-16.43-5720 - Excavator, 6.0 CY bucket with truck loading, 80% fill factor, crew B-14B, daily output 4000 CY (500 CY/hr for 8 hours) $1.33/LCY or $1.53/BCY (no dozers)Note: Larger buckets or other methods could possibly be used, but are not included above.
197
Exhibit_G-E1_0_Preliminary_Earthwork_Analysis Page 1
Exhibit_G-E1_0_Preliminary_Earthwork_Analysis Page 1
Job Number: 34-091-004.300.500
Barr Engineering Company
Project: Fargo-Moorhead Metro Flood Risk Management Project Computed: MRM Date 7/26/2010
Subject: Phase 3 Cost Estimate Checked: MW1 Date 7/26/2010
Task: Work Analysis - Earthwork - Type 4 Brenna Sheet: 10 of 10
Status: draft
Note: Information shown below is for cost estimate purposes only.
Reference: John Deere manufacturer's literature for D-SERIES II ADTs (Articulated Dump Trucks)
Constraints: Material Type 4 Brenna
1.15 Assumed Excavation to Haul swell LCY/BCY - USACE email 6-8-2010
0.87 Calculate Load Factor (L)
2 to 3 Estimated California Bearing Ratio (CBR)
Model: John Deere 400D Articulated Dump Truck
29.4 CY Capacity (heaped 2:1)
22.1 CY Capacity (struck)
22.7 psi Max Ground Pressure (loaded, middle axle)
147,530 lbs total operating weight (loaded)
5 mph at 10% grade and max operating weight
8 mph at 5% grade and max operating weight
15 mph unloaded
Haul Truck Productivity:
Distance Slope Speed Time Time Activity Notes
LF % MPH S MIN
N/A N/A 0 120 2.0 load
N/A N/A 0 12 0.2 start
135 < 5 10 9 0.2 level loaded
460 5 MAX 9 35 0.6 uphill loaded
175 < 5 10 12 0.2 level loaded
250 < 5 10 17 0.3 level loaded
N/A N/A 0 10 0.2 stop
N/A N/A 0 30 0.5 unload
N/A N/A 0 60 1.0 bed scrape from loader (2 min. every 2 trips)
N/A N/A 0 10 0.2 start
700 -6 15 32 0.5 downhill unloaded return
150 < 5 5 10 0.2 return zone
N/A N/A 0 10 0.2 stop
6.1 total time per round trip (minutes)
9.8 loads per hour
Factors: 0.70 Assume loading as % of heaped 2:1 capacity
21 LCY per load per truck assumed (% * heaped 2:1 capacity)
Machine Availability 1.00 ( 100%) assume trucks are available as needed
Gen Operational Efficiency 0.91 (55 min/hr) (saturated clay)
8.9 loads per hour
184 LCY/hour per truck
570 LCY/hour excavator productivity match (from previous page)
495 BCY/hour (from previous page)
Equipment: 3.1 trucks required
1 small backhoe required (to periodically scrape beds)
0.5 grader required (to manage the haul roads/rutting)
assume trucks are operating on Type 3 material
P:\Mpls\34 ND\09\34091004 Fargo Moorhead Metropolitan Feas. Study\WorkFiles\Project Data\Phase3\700_Cost_Est\Report_Exhibits\Exhibit_G-E1_0_Preliminary_Earthwork_Analysis Page 1