Embed Size (px)
Citation preview
Procedia - Social and Behavioral Sciences 133 ( 2014 ) 279 – 290
Available online at www.sciencedirect.com
1877-0428 © 2014 The Authors. Published by Elsevier Ltd. Open access under CC BY-NC-ND license. Selection and peer-review under responsibility of the Organizing Committee of ICTMS-2013.doi: 10.1016/j.sbspro.2014.04.194
ScienceDirect
ICTMS-2013
Redefining retailer’s satisfaction index: A case of FMCG market in India
Sadia Samar Alia, Rameshwar Dubeyb*
aFortune Institute of International Business, New Delhi, India *bSymbiosis Institute of Operations Management, Symbiosis International University, Nashik, India
Abstract
Globalisation and maximum profit fetching attitude, drive many companies to nourish their retailers /distributors. Retailers/Distributors satisfaction is the buzzword of late 1990s, keeping in mind the importance of service as a major marketing tool, the decisions resulting retailers/distributors enjoying a healthy share in any company’s strategic decisions. Such decisions retrieve further importance because of non-predictability and uncertainty in working environment. In this paper researchers propose a model based on American Customer Satisfaction Index, ACSI, to evaluate the satisfaction level of Retailers/Distributors. Data has been collected from 3 Distributors and 180 Retailers working with Nestle India Limited. One of the most important concepts of marketing is satisfaction and for the past few decades has been attracting interests for retailers as well.The model proposed for Nestle Retailer Satisfaction Index viewed as a cause and model based on process, retailer service and information and measured by multiple dimensions. This study utilizes the data for 180 retailers only which makes it difficult to generalize the results on the bigger level. Therefore, researchers are encouraged to cover more retailers’ further.Retailers need to be well informed about various products/services and they should be guided well in advance about the new launches so that they can pass out this information to customers. Retailer satisfaction index highlights certain areas for managers to work upon.Managerial implications in implementing activities and certain schemes like sales promotion, gifts, exchange offers may provide good future prospects.
© 2014 The Authors. Published by Elsevier Ltd. Selection and peer-review under responsibility of the Organizing Committee of ICTMS-2013.
Keywords: India; Retailers; ACSI; Factor analysis.
* Corresponding author. Tel.: +91-253-2379960; fax: +91-253-2379959. E-mail address: [email protected]
© 2014 The Authors. Published by Elsevier Ltd. Open access under CC BY-NC-ND license. Selection and peer-review under responsibility of the Organizing Committee of ICTMS-2013.
280 Sadia Samar Ali and Rameshwar Dubey / Procedia - Social and Behavioral Sciences 133 ( 2014 ) 279 – 290
1. Introduction
Intense competitive pressure is forcing the modern organizations, to gain insight into customers' or clients' preferences for products or services provided by the organization. Realising the importance of customer satisfaction, organisations are making efforts to know the reasons as to why a customer does not stay with the organisation and how to keep their customers loyal, even a satisfied customer looks for better satisfaction elsewhere ( Reichheld 1996). The empirical results of Anderson (1996), Anderson et al. (1994 and 2004) show a strong relationship between customer satisfaction and economic performance. Other studies by Fornell (2001), Ittner and Larcker (1996), and Ali (2008a,b) also force customer satisfaction, but not much is known about how the companies could be benefited by measuring retailers’ satisfaction and virtually there are fewer efforts to keep the retailers satisfied. From retailers’ perspective, customer service may have become the only way to differentiate them from competitors because the products that they offer often differ insignificantly from one store to another with varied service. Customer satisfaction is the outcome felt by those that have experienced a company’s performance that has fulfilled their expectations. (Angelova and Zekiri, 2011). It is proposed that organizations could enhance customers’ repeat purchase behaviour if they could successfully increase customer satisfaction through improved service quality (Oliver, 1997). Satisfaction is one of the most important concepts in marketing, and has attracted a great deal of research interest in the past few decades. Existing customer satisfaction literatures (Anderson and Sullivan 1993; Fornell 2001; Shemwell et al. 1998) highlighted the importance of service, quality provided, as an antecedent of customer satisfaction. Smith (2009) in a study of customer relation management (CRM) for the concept of attracting and retaining customers pointed out that organization which did not pay attention to the features and service that customers wanted were in risk of reduced profits and market share. In another study, Kumar, Lemon, and Parasuraman (2006) propose a chain of effects framework for understanding and managing customer lifetime value which affects shareholder value. They had identified econometric and data-related challenges in establishing the link of direct relation among two variables, which means longer is the customers stay, better is the value. They have also suggested directions for future research.
Against this background, this study aims to explore the way that relates to retailer satisfaction for Indian FMCG products and considering it as flexible approach as this has not been used for untouched Indian sector for measuring satisfaction of retailers. FMCG sector in India is diligently adopting effective protocols for improving customer service, sales, and telemarketing productivity, making customer transactions shorter, and more cost-effective. FMCG Giants in India have developed leading-edge ways to monitor, measure, and manage your service and sales functions, and overall customer satisfaction. They have been felicitated with numerous recognitions, prestigious industry awards thus enabling them to reach and sustain positions of leadership and respect. They have succeeded in achieving this stature by aligning their processes and practices in the most effective and efficient manner. Right from conceptualization of the idea to the delivery of the product to the end customer there are multiple processes and partners and there is an absolute necessity of an alignment and orientation of these processes and partners. The process orientation gives an idea to the organization to look at what are the major contributions of all partners in satisfying the multiple customers. Here we highlight the importance of role played by the retailer in this success story chain. The products reach customers through retailers whose function is to make products available to customer. The basic rule for organisation is to consider the retailer as a very important person who bridges the gap for B-to-B selling of their products. So we can say that the role of retailer has changed from mere supplier of goods from organization to the customer to an important entity responsible for creating a significant feedback loop between businesses and those served by them. Companies doing a lot to check B-to-C satisfaction, instead, have to realise the importance of B-to-B satisfaction also for their growth.
Realising the importance of distributors and retailers in achieving customer satisfaction, this paper has been focussed to evaluate retailers/distributors satisfaction In FMCG sector in India. Nestle has been a popular food brand in India for nearly a century and enjoys a strong presence in India with its head office, manufacturing plants and branch offices spread all over India. Through tire years nestle has invested to better understand the needs and aspirations of the consumers in India and to provide “Good Food, Good Lotto”. Nestle has invested consistently in understanding consumers and their changing lifestyles, in developing tasty and healthy and high quality relevant product concepts with strong brand to build on consumer trust. Nestle involvement in the creation of prosperity on an on-going and sustainable basis has resulted in not just the transformation of India into a prosperous and vibrant country today, but a thriving hub of industrial activity, as well. The Company's activity in India have facilitated direct and indirect employment and provides livelihood to about one million people including farmers, suppliers of
281 Sadia Samar Ali and Rameshwar Dubey / Procedia - Social and Behavioral Sciences 133 ( 2014 ) 279 – 290
packaging materials, services and other goods. Such success comes if all the major stakeholders in a strategic relationship like customers, shareholders, suppliers, and major networks etc. are satisfied and contributing towards the growth. The study has been conducted over the retailers and distributors of Nestle (FMCG giant) to measure the level of satisfaction. 1.1 Nestle India
Nestlé India is a subsidiary of Nestlé S.A. of Switzerland. With seven factories and a large number of co-packers, Nestlé India is a vibrant Company that provides consumers in India with products of global standards and is committed to long-term sustainable growth and shareholder satisfaction. Company insists on honesty, integrity and fairness in all aspects of its business and expects the same in its relationships. This has earned it the trust and respect of every strata of society that it comes in contact with and is acknowledged amongst India's 'Most Respected Companies' and amongst the 'Top Wealth Creators of India'.
Nestle was promoted by Nestle Alimentana, Switzerland, a wholly owned subsidiary of Nestle Holdings Ltd., Nassau, Bahama Islands. Nestle is one of the oldest food MNC operating in India, with a presence of over a century. For a long time, Nestle India’s operations were restricted to importing and trading of condensed milk and infant food. Nestle was incorporated as a limited company in 1959. In 1978, the Company issued 0.4mn new shares and 0.38m of existing shares of Nestle Holdings Ltd. to Indian public to reduce its foreign holdings to 40%. Its name was changed from Foods Specialties Ltd. to the current name in 1981. Over the years, the Company expanded its product range with new products in instant coffee, Maggie noodles, sauces, pickles and other culinary aids, chocolates and confectionery.
1.1.1 Origin in India
Nestlé’s relationship with India dates back to 1912, when it began trading as The Nestlé Anglo-Swiss
Condensed Milk Company (Export) Limited, importing and selling finished products in the Indian market. After India’s independence in 1947, the economic policies of the Indian Government emphasized the need for local production. Nestlé responded to India’s aspirations by forming a company in India and set up its first factory in 1961 at Moga, Punjab, where the Government wanted Nestlé to develop the milk economy. Progress in Moga required the introduction of Nestlé’s Agricultural Services to educate, advise and help the farmer in a variety of aspects. From increasing the milk yield of their cows through improved dairy farming methods, to irrigation, scientific crop management practices and helping with the procurement of bank loans. Nestlé set up milk collection centers that would not only ensure prompt collection and pay fair prices, but also instill amongst the community, a confidence in the dairy business. Progress involved the creation of prosperity on an on-going and sustainable basis that has resulted in not just the transformation of Moga into a prosperous and vibrant milk district today, but a thriving hub of industrial activity, as well. Nestlé has been a partner in India's growth for over nine decades now and has built a very special relationship of trust and commitment with the people of India. Company's activities in India have facilitated direct and indirect employment and provides livelihood to about one million people including farmers, suppliers of packaging materials, services and other goods. Company continuously focuses its efforts to better understand the changing lifestyles of India and anticipate consumer needs in order to provide Taste, Nutrition, Health and Wellness through its product offerings. The culture of innovation and renovation within the Company and access to the Nestlé Group's proprietary technology/Brands expertise and the extensive centralized Research and Development facilities gives it a distinct advantage in these efforts. It helps the Company to create value that can be sustained over the long term by offering consumers a wide variety of high quality, safe food products at affordable prices.
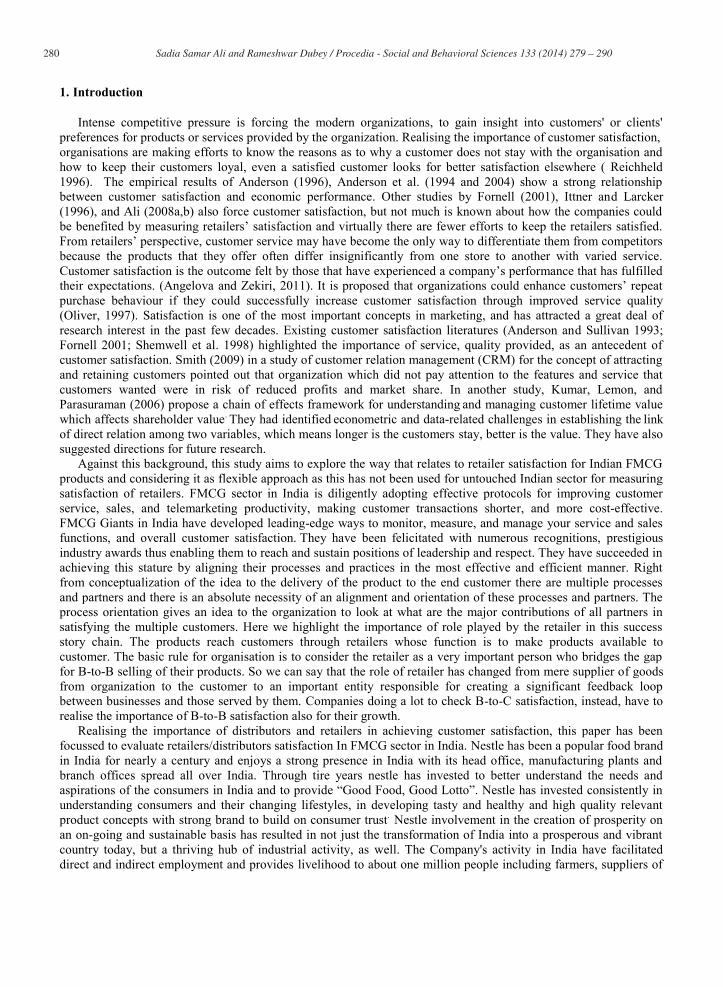
Nestlé India manufactures products of truly international quality under internationally famous brand names such as NESCAFÉ, MAGGI, MILKYBAR, MILO, KIT KAT, BAR-ONE, MILKMAID and NESTEA and in recent years the Company has also introduced products of daily consumption and use such as NESTLÉ Milk, NESTLÉ SLIM Milk, NESTLÉ Fresh 'n' Natural Dahi and NESTLÉ Jeera Raita. Nestlé India is a responsible organization and facilitates initiatives that help to improve the quality of life in the communities where it operates( Please refer to Figure 1).
282 Sadia Samar Ali and Rameshwar Dubey / Procedia - Social and Behavioral Sciences 133 ( 2014 ) 279 – 290
1.1.2 Group
Nestle S A Switzerland, is one of the leading companies in the global foods industry. The principal activities of the group encompass beverages (with Nescafe as the flagship brand), milk products, processed foods, cooking aids, bakery products, chocolates, confectioneries, pharmaceutical products (ophthalmic, surgical instruments etc). Nestle has a presence in 83 countries worldwide. It has a total number of 509 factories out of which 220 are located in Europe, 153 in America and 136 in Africa, Asia and Oceania
Figure1: An Overview of Plant Locations (Source : www.nestleindia.com)
1.1.3 Brands
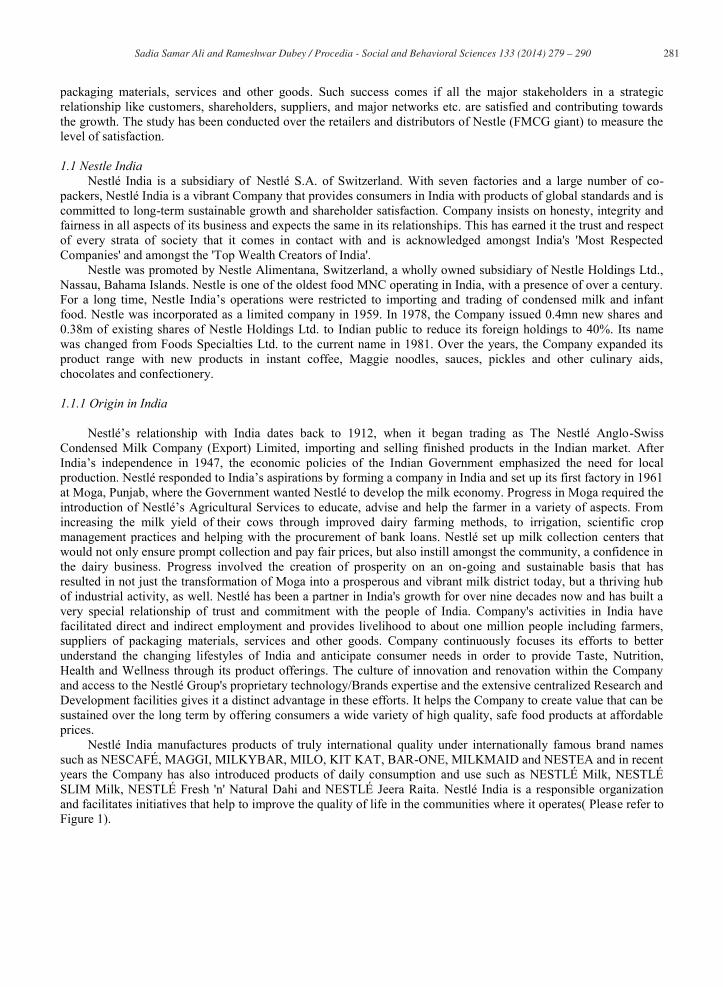
Most people know Nestle through their brands. Nestlé’s portfolio covers practically all food and beverage categories. Some brands are only available in certain parts of the world. Some of the important Nestle products are tabulated below in figure 2.
1.1.5 Nestle Analysis and Overview
Nestle India is continuously putting efforts to improve its performance year after year. From descriptive statistics we can see, that there is an increase of 11.1% in company’s net profit to Rs. 1067.93 crore on 10.8% growth in net sales to Rs. 8302.26 crore in the year ended 31 December 2012(FY 2012) over the year ended 31
283 Sadia Samar Ali and Rameshwar Dubey / Procedia - Social and Behavioral Sciences 133 ( 2014 ) 279 – 290
December 2011(FY 2011). Export sales shows as surge of 7.6%, export to third parties jumped 36.7%. Domestic sales after portfolio and channel optimisation increased 11 per cent mainly, on account of net realisations and product mix. During the fourth quarter ended December, Nestle India reported a 21 per cent rise in net profit at Rs 279 crore on the back of good domestic and export performance.
Figure 2: Products and Product Categories
2. Literature Review
The American Customer Satisfaction Index (ACSI) is an economic indicator that measures the satisfaction of consumers across the U.S economy. It is produced by the National Quality Research Centre (NQRC) at the University of Michigan.
As long as repeat business is important and as long as customers have chance to go somewhere else, employees must deliver high level of customer satisfaction for a company to be successful. In a competitive market place that offers meaningful consumer choice alternatives firms that do well by their customers are rewarded by repeat business, lower price elasticity, higher reservation prices, more cross selling opportunities, greater marketing efficiency and a host of other things that usually lead to earnings growth (Fornell et al. 1996). Customer satisfaction with a company’s products or services is often seen as the key to company’s success and long term competitiveness. In the context of relationship marketing, customer satisfaction is often viewed as a central determinant of customer retention.
Customer satisfaction is an abstract concept and the actual manifestation of the state of satisfaction will vary from person to person and product/service to product/service. The state of satisfaction depends on a number of both psychological and physical variables which correlate with satisfaction behaviors such as return and recommend rate. The level of satisfaction can also vary depending on other factors of the customer, such as other products against which the customer can compare the organization's products.
Work done by Parasuraman, Zeithaml and Berry (1993) delivered SERVQUAL which provides the basis for the measurement of customer satisfaction with a service by using the gap between the customer's expectation of performance and their perceived experience of performance. This provides the researcher with a satisfaction "gap" which is semi-quantitative in nature. Cronin and Taylor extended the disconfirmation theory by combining the "gap"
284 Sadia Samar Ali and Rameshwar Dubey / Procedia - Social and Behavioral Sciences 133 ( 2014 ) 279 – 290
described by Parasuraman, Zeithaml and Berry as two different measures (perception and expectation) into a single measurement of performance relative to expectation.
In a study of catalogue retailer, Reinartz and Kumar (2003) find a weaker than expected (but significant) relationship between customer retention and profitability. The strength of any customer retention-profitability relationship depends on the cost of creating and maintaining repeat customers. If repeat business is created through price discounts or other means that do not cause an upward shift in the firm’s demand curve, the relationship will be weaker. The repeat business produced by higher customer satisfaction will be more profitable in general than repeat business generated by price discounts. Porter (1985) emphasized the importance of retaining customers and suggested how the competitive advantage of retaining customers is beneficial to firms.
ACSI when put to measure the customer satisfaction in stock market, reveals that satisfied customers ameliorate the level of net cash flows resulting in high return with low risk (Fornell et al 2006).
Customer satisfaction should not be of theoretical nature; it should reflect the prevailing culture of organization and should be more practical in nature (Gowing and Lindholm, 2002). Gale and Wood (1994) suggested the excellence in quality and service that drives the customer attention. Satisfaction being the most important concept in marketing drives attention of most of the researchers. Ali and Bhardwaj (2009) has taken service quality gap approach as a measure of satisfaction in banking industry and laid emphasis that banks should excel in their corporate quality programme and customer service system.
It's a well known fact that no business can exist without customers. In the business of Website design, it's important to work closely with your customers to make sure the site or system you create for them is as close to their requirements as you can manage. Because it's critical that you form a close working relationship with your client, customer service is of vital importance. Every action should be shaped by a relentless commitment to meeting and exceeding customer expectations regarding product and service quality. However, the whole organization must be aligned toward customer satisfaction or this approach can never work. It requires an upside down view of business—viewing the organization through the eyes of the customer, rather than through the eyes of an investor. Interestingly enough, the investor’s goals are not lost in this process. Increasing customer satisfaction markedly increases market value and profitability (Aranoff and Fitzpatrick, 2008). Achieving and measuring customer satisfaction is a key aim in systems development. However, widespread customer satisfaction is not normally attained largely due to problems of inadequate ‘requirements understanding’. This lack of understanding is a function of a semantic gap that exists between customers and system developers while exploring requirements. What is required is a universal and non-technical customer-oriented process that supports the attainment of customer satisfaction through minimising any barriers to understanding (Elliot and Smith, 2000).
There is widespread belief that firms should pursue superiority in both customer satisfaction and productivity. Anderson, Fornell, Rust. 1997). However there is reason to belief these two goals are not always compatible. If a firm improves productivity by downsizing it may achieve an increase in productivity in short term but future profitability may be threatened if customer satisfaction is highly dependent on the efforts of personnel. If so there are potential tradeoffs between customer satisfaction and productivity for industries as diverse as airlines, banking, education etc. It follows that developing a better understanding of how customer satisfaction and productivity relate to one another is of substantial and growing importance especially in light of expected continued growth in services throughout the world economy. It is worth emphasizing that this is an issue that is not only important today, but certainly will become even more important in the future. As the growth of services continues and world markets become increasingly competitive the importance of customer satisfaction will also increase. To compete in such a world, firms must strike the right balance between their efforts to compete efficiently and their efforts to compete effectively (Anderson, Fornell, Rust. 1997). It is also believed that, firms that do not pay attention to the quality and services needed by the customers operate in an unstable environment and may face reduced profits and market share (Smith 2009).
Against this background this study irrespective of various customer satisfaction approaches like product quality, product differentiation, better quality management etc, tries to reveal the satisfaction of retailers/distributors which are in direct contact with customers and are more effective in bringing about customer satisfaction to firms. Profitable retail investment performance comes through a successful partnership between investor and retailers. Retailers satisfaction index has been used to measure and benchmarking the level of satisfaction. In a study by IRIS group , a leading research & analytics and market intelligence & handholding firm, surveyed mostly all big Indian retailers viz : Hypermarket :Big Bazar, Reliance Mart, Hyper City , Star Bazar , More Megamart ; Department Store such as Lifestyle, Westside, Shoppers Stop , Central , Reliance Trends , Pantloons, Globus; Leisure : Archies
285 Sadia Samar Ali and Rameshwar Dubey / Procedia - Social and Behavioral Sciences 133 ( 2014 ) 279 – 290
,Planet M , Crossword , Landmark ; Food services : Café coffee day , McDonald’s , Barista , Pizza Hut ,Yo China, KFC; Multiplex : PVR , Big Cinemas , INOX ; Fashion & Lifestyle : Beneton ,Levis, Bata, ; Consumer Durables : E-Zone, Croma, Next for measuring the satisfaction of the retailers on the basis of explicit and implicit importance of measurement parameter of measuring retailers satisfaction . Further these parameters have been classified as low important, high important, must have and hidden motivators. At true value retailers satisfaction has been shown to be impacted by various factors like Ease of ordering Order lead time, Variety of products, Fill rates, Reliable on-time delivery, Competitive pricing, Maximizing retail margins etc.In one of the recent study by Ali and Ahmed (2009) , a multiple decision making criteria has been proposed, based on American Customer Satisfaction Index and being named as Flexible Approach to Retailer's Satisfaction Index. This tool helps marketing planners in evaluating satisfaction. The case of Glaxo SmithKline, India has been considered for checking the overall satisfaction of retailers and its impact on the market. The analysis suggests an acceptable and generic model that can be used by managers and researchers to evaluate satisfaction level. 3. Research Methodology 3.1 Exploratory Investigations
In order to investigate the objectives of this study the descriptive research method was employed. This study
has been carried out to understand the key drivers of satisfaction that are important to nestle retailers. The technique used for choice of retailer segments is Quota sampling.in which representative individuals are chosen out of a specific subgroup. In Quota sampling once the general breakdown of the sample is decided and the quota assignments allocated to each decision maker, the choice of the actual sample units to fit into this framework is left to the decision maker.A sample was drawn from a list of outlets available with the distributors in three cities Delhi, Noida and Ghaziabad in India. Questionnaire was provided to retailers to obtain information on the various services that distributors provide. A 5-point likert scale was used to capture the retailers responses ranging from strongly agree to strongly disagree.
The questionnaire used for the sample survey is a structured, Likert non-comparative scaling technique and non-disguised questionnaire and consisted of four sections (Ali et al 2013). It is a widely used rating scale which requires the respondents to indicate a degree of agreement or disagreement with each of a series of statements or questions (Ajzen and Fishbein, 1980). This rating scale is easy to construct and administer and respondents readily understand how to use the scale (Malhotra and Birks, 2003, pp. 305).
Responses were collected by personal in depth interview from three types of outlets A, B and C. The questionnaires were administered in Delhi & NCR area. Four people assisted in conducting the interviews. They include four students of post graduates, all males. Formal training was done apart from explaining briefly what the research is all about and the ways to collect the data. No compensation was given to the interviewers. The data was collected for April – July 2011 in each location. Since no list of retailers was used, the retailer locations were used as quota segment. These retailers locations may relate to the level of social class of inhabitants and as well as to the level of use of the FMCG products. 3.2 Data Collection
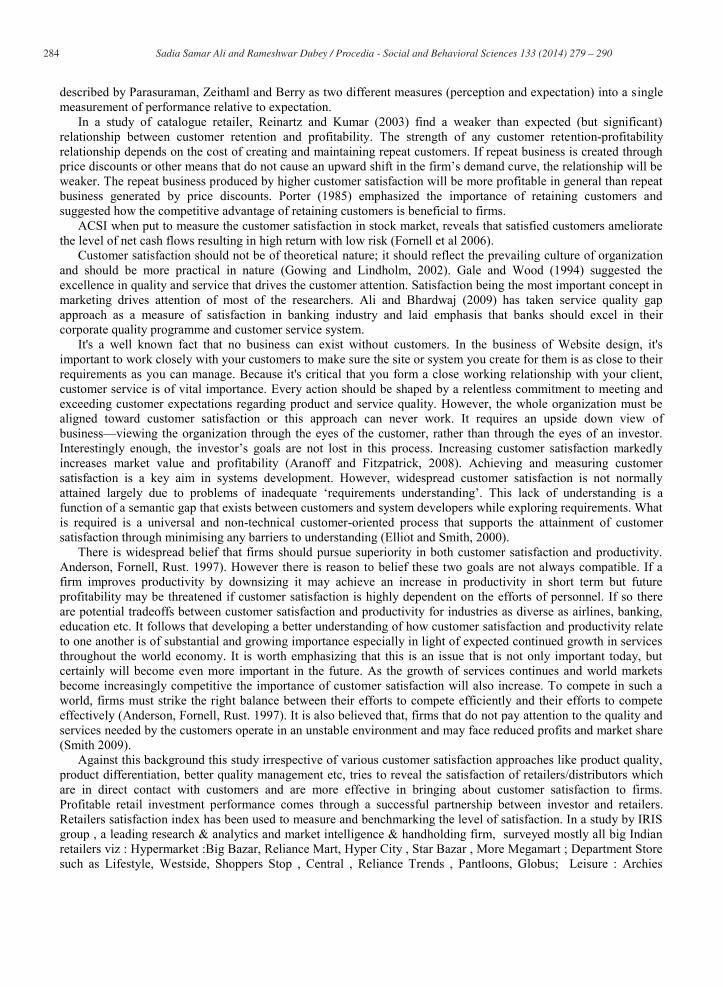
Data were collected by personally visiting different outlets and explaining them in detail about the survey. Distributor provides us an exhausted list of outlets but due to time and budget constraints we have surveyed only 18 outlets of different classes, 2 of each class from each place Retail outlets have been classified into A, B and C, as shown in Figure 3, class outlets depending on the number of cash counters they have. 4. Research model base
This study is an adaptive approach to ACSI model, which consists of areas of customer satisfaction assessment such as process, information, customer service, and perceived customer quality and customer expectation.
286 Sadia Samar Ali and Rameshwar Dubey / Procedia - Social and Behavioral Sciences 133 ( 2014 ) 279 – 290
Figure 3: Classification of Outlets
4.1 ACSI Model
The American Customer Satisfaction Index (ACSI) is an economic indicator that measures the satisfaction of consumers across the U.S economy. It is produced by the National Quality Research Centre (NQRC) at the University of Michigan. ACSI model has been extensively used by different research groups, institutions and universities to create effective customer satisfaction indices for their national economies. ACSI is produced by the joint effort of University of Michigan Business School, CFI group and the American society for Quality.
Data has been put into a casual/structural equation model, which is utilized to achieve scores for measured latent variable components (like customer expectations, perceived value etc.) The relationships between these measured components are also obtained. The organization is given a customer satisfaction index score or an ACSI score which reflects weighted average of three satisfaction proxy questions on a 0-100 scale. Practically, the scores move from the low 50s to high 80s.The three satisfaction questions are generally identical and the comparisons between organizations thus become available. Organizations can incorporate these questions for their surveys of comparisons. The ACSI score is calculated using arithmetic mean for each question,AMQ as given below [(Satisfaction-1)*AMQ + (Expectancy-1)*AMQ + (Performance-1)*AMQ]/[n-1] *100
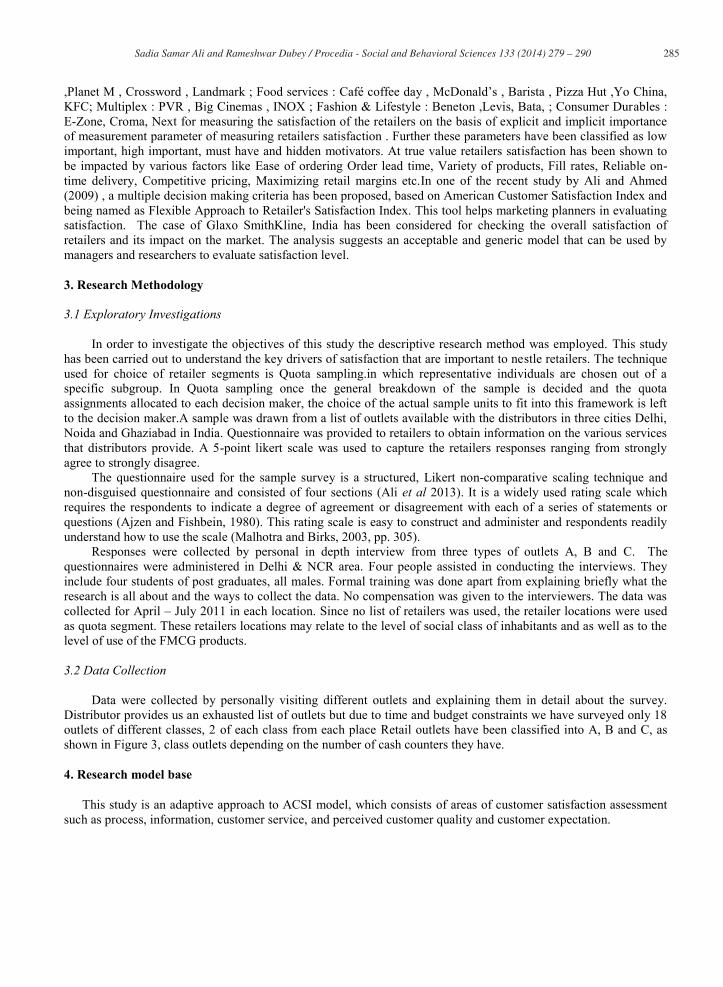
ACSI model has been taken as the base model for this paper. Here we aimed at calculating retailer satisfaction and considering Nestle as a giant and best in industry we are assuming that retailers are loyal to them and thus we are not taking into account the part of customer loyalty and customer complaints shown in Figure 4. So our model for this particular research work will be as one shown in Figure 5.
The role of four factors is briefly described below Process: The retailers have a tendency to go for best product/service available in the market and if the product or service is of an inferior quality they go for exchange policy or with certain promotional schemes. The retailers are much concerned that distributors should pay attention to their needs with urgency. Perceived value is a measure of quality relative to price paid. However price i.e. value for money often fetch out retailers importance to have handsome profit on purchase, it usually have smaller impact on satisfaction. Information: Flow of complete information is necessary to avoid any discrepancy, retailers are in actual the final point of contact with customers and therefore they should be well informed about the various products or services. They provide first hand feedbacks to company containing information on proper pricing, quality and other customer responses. Perceived quality is a measure of retailer’s evaluation against the consumption experiences of the quality of company’s products or services. Retailer Service: In the journey of product from company to consumer via distributors and retailers satisfaction of each linkage brings about the satisfaction of another. This implies that if retailers are well satisfied with the services, behaviour of distributors they are supposed to attach more customer satisfaction with the brand. Retailer Expectations: It is a measure of retailer’s anticipation of the quality of a company’s products or services. Like retailers expect a credit policy from distributors so that they can go for variety of products, certain promotional schemes and free offers.
287 Sadia Samar Ali and Rameshwar Dubey / Procedia - Social and Behavioral Sciences 133 ( 2014 ) 279 – 290
Figure 4 ACSI Model
Source: http://www.theacsi.org/images/stories/images/about/model
Figure 5: Adaptive Research Model for Retailers 5 Analysis and Findings Factor analysis was done based on factors discussed by Ali (2006 a) to find out the key dimensions affecting retailer satisfaction levels. Respondent ratings were subjected to principal axis factoring with varimax rotation to reduce multi-co linearity among the items and to improve reliability. KMO greater than equal to 0.5 is acceptable. In Table 1 all factors have values greater than 0.5 and less than 1. Hence validity of data is accepted.
Perceived Quality
Customer Expectations
Perceived Value Customer
Satisfaction (ACSI)
Customer Complaints
Customer Loyalty
Process
Information
Retailer Service
Perceived Retailer Value
Retailer Expectation
Retailer Satisfaction
288 Sadia Samar Ali and Rameshwar Dubey / Procedia - Social and Behavioral Sciences 133 ( 2014 ) 279 – 290
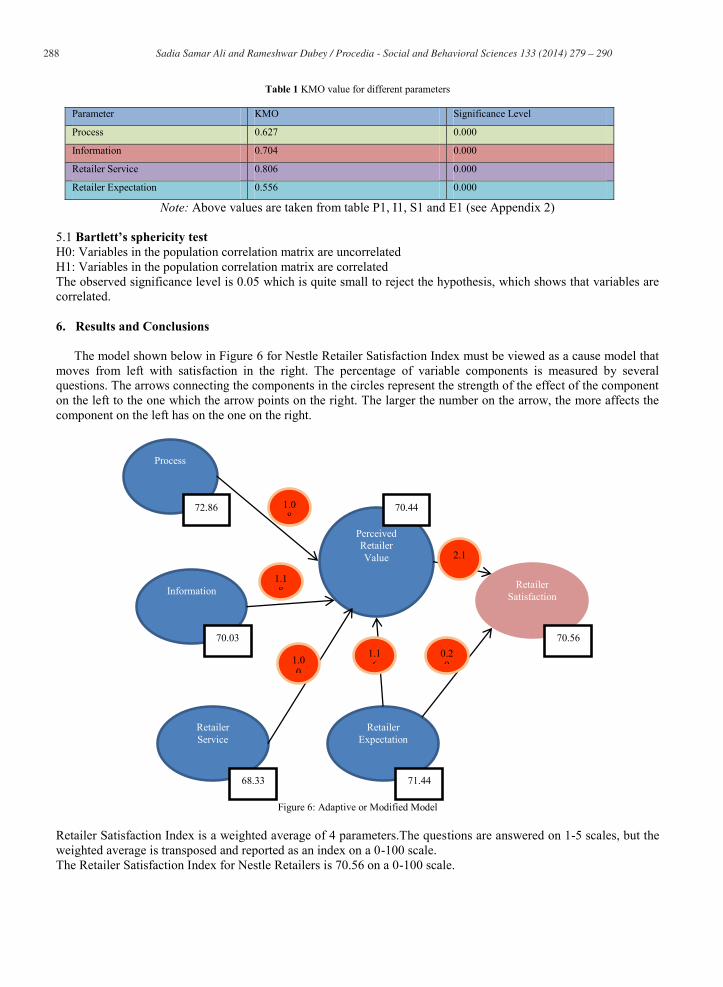
Table 1 KMO value for different parameters
Parameter KMO Significance Level
Process 0.627 0.000
Information 0.704 0.000
Retailer Service 0.806 0.000
Retailer Expectation 0.556 0.000
Note: Above values are taken from table P1, I1, S1 and E1 (see Appendix 2) 5.1 Bartlett’s sphericity test H0: Variables in the population correlation matrix are uncorrelated H1: Variables in the population correlation matrix are correlated The observed significance level is 0.05 which is quite small to reject the hypothesis, which shows that variables are correlated. 6. Results and Conclusions
The model shown below in Figure 6 for Nestle Retailer Satisfaction Index must be viewed as a cause model that moves from left with satisfaction in the right. The percentage of variable components is measured by several questions. The arrows connecting the components in the circles represent the strength of the effect of the component on the left to the one which the arrow points on the right. The larger the number on the arrow, the more affects the component on the left has on the one on the right.
Figure 6: Adaptive or Modified Model
Retailer Satisfaction Index is a weighted average of 4 parameters.The questions are answered on 1-5 scales, but the weighted average is transposed and reported as an index on a 0-100 scale. The Retailer Satisfaction Index for Nestle Retailers is 70.56 on a 0-100 scale.
Process
72.86
Information
70.03
Retailer Service
68.33
Perceived Retailer Value
70.44
Retailer Expectation
71.44
Retailer Satisfaction
70.56
1.08
1.18
1.00
2.1
0.29
1.16
289 Sadia Samar Ali and Rameshwar Dubey / Procedia - Social and Behavioral Sciences 133 ( 2014 ) 279 – 290
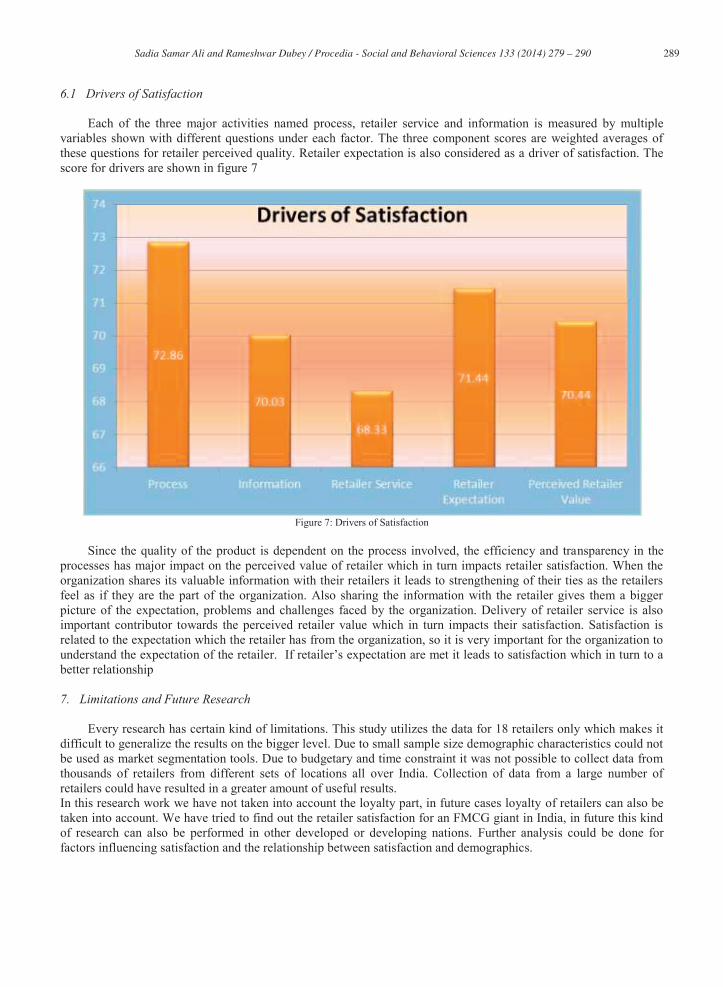
6.1 Drivers of Satisfaction
Each of the three major activities named process, retailer service and information is measured by multiple
variables shown with different questions under each factor. The three component scores are weighted averages of these questions for retailer perceived quality. Retailer expectation is also considered as a driver of satisfaction. The score for drivers are shown in figure 7
Figure 7: Drivers of Satisfaction
Since the quality of the product is dependent on the process involved, the efficiency and transparency in the
processes has major impact on the perceived value of retailer which in turn impacts retailer satisfaction. When the organization shares its valuable information with their retailers it leads to strengthening of their ties as the retailers feel as if they are the part of the organization. Also sharing the information with the retailer gives them a bigger picture of the expectation, problems and challenges faced by the organization. Delivery of retailer service is also important contributor towards the perceived retailer value which in turn impacts their satisfaction. Satisfaction is related to the expectation which the retailer has from the organization, so it is very important for the organization to understand the expectation of the retailer. If retailer’s expectation are met it leads to satisfaction which in turn to a better relationship 7. Limitations and Future Research
Every research has certain kind of limitations. This study utilizes the data for 18 retailers only which makes it
difficult to generalize the results on the bigger level. Due to small sample size demographic characteristics could not be used as market segmentation tools. Due to budgetary and time constraint it was not possible to collect data from thousands of retailers from different sets of locations all over India. Collection of data from a large number of retailers could have resulted in a greater amount of useful results. In this research work we have not taken into account the loyalty part, in future cases loyalty of retailers can also be taken into account. We have tried to find out the retailer satisfaction for an FMCG giant in India, in future this kind of research can also be performed in other developed or developing nations. Further analysis could be done for factors influencing satisfaction and the relationship between satisfaction and demographics.
290 Sadia Samar Ali and Rameshwar Dubey / Procedia - Social and Behavioral Sciences 133 ( 2014 ) 279 – 290
8. Managerial Implications In a food sector, consumer demands use to change rapidly and the shelf life of most of the food items is quite
less, therefore retailers need to react fast to consumer preferences. Our research clearly indicates that retailer satisfaction index for Nestle is 70.56 and little efforts are needed to
take it to high 80s. As per Leeds (1992) some sorts of formal greetings may increase customer satisfaction. Thus employees and workers need to be trained to offer formal greetings to retailers/customers to improve their satisfaction. Managerial implications in implementing activities and certain schemes like sales promotion, gifts, exchange offers may provide good future prospects. Nestle is an international brand known for its excellent customer services and after sale services. We as researchers feel that Nestle can strengthen their ties with their retailers by using innovative strategies. One suggestion that we would like to give is to open retailer service centers where the retailers and the management should meet once after three months to discuss the future collaboration, innovations, problems and challenges. This would not only help in development of mutual understanding also in finding innovative solution to their problems. At the same time Nestle can help their retailer in ‘entrepreneurship’ ventures or other kind of support services for their progress.
Retailers need to be well informed about various products/services and they should be guided well in advance about the new launches so that they can pass out this information to customers.
References
Ali, Sadia Samar, R. K. Bharadwaj and F. Ahmed (2013), Flexible Approach to Patients Satisfaction: A Case of Private Hospitals”, International Journal of Services and Operations Management,13, 2, pp 252 – 275.
Ali, Sadia Samar and F. Ahmad (2009), Flexible approach to retailer satisfaction index : An Indian Case Study of health drink sector; International Journal of Indian Culture and Business Management, 3, 3,pp 260-284 .
Ali S.S and Bhardwaj R.K (2009) ‘Consumer satisfaction and service quality gap approach: commercial Indian banks’, ICTIM 2nd Proceedings, Vol.2, pp 189-197.
Ali S.S (2006a) ‘Consumer response to promotional Schemes: an analytical approach’, Journal of management and technology, Vol.1, No.1, pp 43-50.
Ajzen, I and Fishbein, M.(1980) ; Understanding attitudes and predicting social behaviour; Upper Saddle River, N J : Prentice Hall. Anderson, E.W., and Sullivan, A.W. (1993), The antecedents and consequences of customer satisfaction for firms, Marketing Science (12:3), pp
125-143. Anderson E.W., Fornell, C and Lehman D. R (1994),Customer Satisfaction, market share and profitability; findings from Sweden’, Journal of
Marketing, vol. 58, pp. 53-66, July. Anderson E. W, Fornell C, Ronald T. Rust, Marketing Science vol. 16, No.2 spring 1997, pp 129-145 Arnoff S, Fitzpatrick R, ‘Manage service quality at every level of your organization’, May. 2008, Digital Publishing Solutions Eliott J and Peter R.S, (2000);Achieving Customer Satisfaction through Requirements Understanding, Proceedings of the European Workshop on
Software Technology , 203 -219. Fornell , C (2001), The Science of Satisfaction, Harvard Business Review, 79 (March), 120–21. Fornell, Claes, Sunil Mithas, Forrest V. Morgeson III & M.S. Krishnan, (2006), Customer satisfaction and stock prices: high returns, low risk,
Journal of Marketing, 70, January, 3-14. Gale B. T and Wood, R. C (1994) Managing Customer Value: Creating Quality and Services that customer can see. New York: The Free Press,
pp 22-40. Gowing, M.K. and Lindholm, M.L. (2002), Human resource management in the public sector, Human Resource Management, 41 (3), 283-95. Leeds, B. (1992), Mystery Shopping' Offers Clues to Quality Service. Bank Marketing, 24(11), November , 24-27. Kumar V., K. N Lemon and Parasuraman.A (2006) ‘Managing customers for value: An overview and research agenda’, Journal of Service
Research, Vol. 9, No.2 pp87-94, November 1. Malhotra, N.K. & Birks, D.F. ; 2003 ; Marketing research : an applied approach ; 2nd, European edition ; Pearson Prentice Hall, pp305. Parasuraman, Zeithaml and Berry,L. L and Zeithaml , V. A. (1993) ,More on improving service quality measurement , Journal of Retailing ,
Volume 69, Issue 1, Spring 1993, Pages 140-147 Porter M.E (1985) ‘Competitive Advantage’; New York, NY: The free press, pp 21-25 Reinartz, W J and Kumar, V (2003) , The Impact of Customer Relationship Characteristics on Profitable Lifetime Duration, The Journal of
Marketing, Vol. 67, No. 1 , pp. 77-99 Shemwell D. J, Yavas, U and Bilgin Z (1998) ‘Customer-service provider relationships: an empirical test of a model of service quality,
satisfaction and relationship oriented’, Int. J. Service industry management, vol.9, No.2 pp 155-168. Smith A.D (2009)’Customer relationship management: a look at incentive programmes and their usefulness in selected service firms’, Int .J.
International culture and business management, Vol.3, No.1, pp 1-16. Steve; Aranoff and Fitzpatrick, Robert(2008); Manage Service Quality at Every Level of Your Organization; May2008, Digital Publishing
Solutions, http://www.dpsmagazine.com/content/ContentCT.asp?P=401