Embed Size (px)
Citation preview
Reduction of Baltic Sea Nutrient Inputs and Allocationof Abatement Costs Within the Baltic Sea Catchment
Fredrik Wulff, Christoph Humborg, Hans Estrup Andersen, Gitte Blicher-Mathiesen,
Mikołaj Czajkowski, Katarina Elofsson, Anders Fonnesbech-Wulff,
Berit Hasler, Bongghi Hong, Viesturs Jansons, Carl-Magnus Morth,
James C. R. Smart, Erik Smedberg, Per Stalnacke, Dennis P. Swaney,
Hans Thodsen, Adam Was, Tomasz _Zylicz
Abstract The Baltic Sea Action Plan (BSAP) requires
tools to simulate effects and costs of various nutrient
abatement strategies. Hierarchically connected databases
and models of the entire catchment have been created to
allow decision makers to view scenarios via the decision
support system NEST. Increased intensity in agriculture in
transient countries would result in increased nutrient loads
to the Baltic Sea, particularly from Poland, the Baltic
States, and Russia. Nutrient retentions are high, which
means that the nutrient reduction goals of 135 000 tons N
and 15 000 tons P, as formulated in the BSAP from 2007,
correspond to a reduction in nutrient loadings to water-
sheds by 675 000 tons N and 158 000 tons P. A cost-
minimization model was used to allocate nutrient reduc-
tions to measures and countries where the costs for
reducing loads are low. The minimum annual cost to meet
BSAP basin targets is estimated to 4.7 billion €.
Keywords Nutrient reduction � Nitrogen � Phosphorus �Retention � Management � Cost minimization
INTRODUCTION
The Baltic Sea has suffered from severe effects of eutro-
phication for many decades. The Baltic Sea Action Plan
(BSAP) of the Helsinki Commission (HELCOM) was
adopted by all the coastal countries of the Baltic Sea and by
the European Community in November 2007 (HELCOM
2007). The eutrophication section of the BSAP is
commonly considered as its most important component,
since it presents very specific goals in terms of nutrient
reductions (in tons of nitrogen and phosphorus) for the var-
ious sub-basins in order to achieve a ‘‘healthy’’ Baltic by
2021 (Backer et al. 2010). Moreover, these nutrient reduction
goals are allocated to the countries around the sea. Models
and datasets covering the entire sea and catchment were used
in these calculations (Wulff et al. 2007).
The novelty of the approach used in the HELCOM
action plan (BSAP) is that it puts the ecosystem at the
center, defining the status of the sea as we want it to be in
the future, and focusing management decisions on this goal
instead of taking the traditional approach of addressing
pollution sources on a sector-by-sector basis, without
directly linking abatement measures to the status of the
Baltic Sea (Pyhala 2012).
When the BSAP was adopted, it was recognized that the
calculated maximum allowable nutrient loads and the
country-wise allocations of nutrient reductions were based
on the best knowledge available, but that revised estimates
would be necessary as soon as updated data and more
advanced models became available. These revisions have
now been made (late fall 2013), but have not yet been
approved by all HELCOM member countries.
The economic cost of implementing nutrient reductions
is not addressed in the BSAP, but is estimated to be high
(Elofsson 2010a). Policymakers are likely to be concerned
with the costs incurred within their respective countries,
and well-founded estimates of nutrient reduction costs and
their distribution could serve as a basis for negotiations
among countries as well as for the selection and design of
economic incentives.
The BONUS research project RECOCA (Reduction of
Baltic Sea Nutrient Inputs and Cost Allocation in the Baltic
Sea Catchment) was specifically designed to improve our
Electronic supplementary material The online version of thisarticle (doi:10.1007/s13280-013-0484-5) contains supplementarymaterial, which is available to authorized users.
� The Author(s) 2013. This article is published with open access at Springerlink.com
www.kva.se/en 123
AMBIO 2014, 43:11–25
DOI 10.1007/s13280-013-0484-5
understanding of processes in the catchment, compared to
those used in the original BSAP, by using improved models
and datasets. The key objectives of RECOCA were to (1)
simulate possible future riverine nutrient loads to the Baltic
Sea, (2) estimate cost-effective reductions of those loads,
and (3) suggest cost allocation schemes for the countries in
the drainage basin. In this paper, we describe a multi-model
approach to characterize the nutrient loads, the retentions
that occur between these sources and the Sea, and the
effects of various management strategies to reduce loads.
An advantage of the approach, in which models of different
levels of complexity and spatial resolution are applied to
the basin (see Electronic Supplementary Material, Fig. S1),
is that it provides more robust insights into patterns of
loading and response when the models yield similar results
and provides insight into priorities for additional research
when they disagree.
KEY RESEARCH AND RESULTS
New Catchment Database
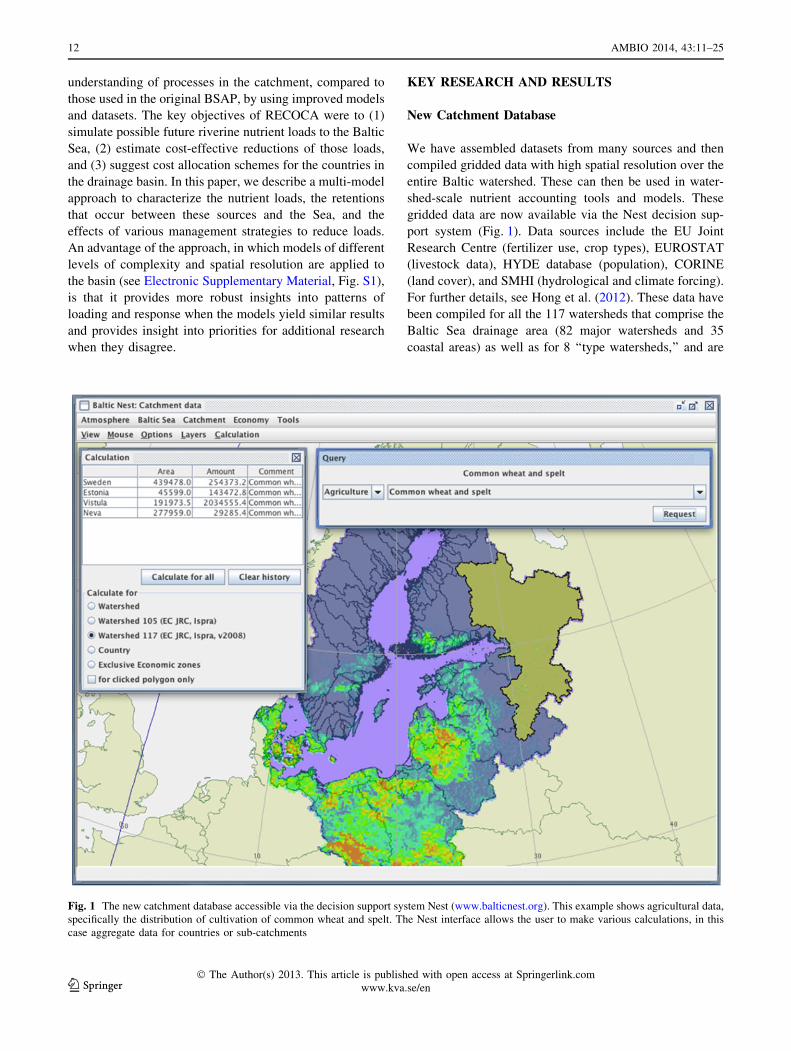
We have assembled datasets from many sources and then
compiled gridded data with high spatial resolution over the
entire Baltic watershed. These can then be used in water-
shed-scale nutrient accounting tools and models. These
gridded data are now available via the Nest decision sup-
port system (Fig. 1). Data sources include the EU Joint
Research Centre (fertilizer use, crop types), EUROSTAT
(livestock data), HYDE database (population), CORINE
(land cover), and SMHI (hydrological and climate forcing).
For further details, see Hong et al. (2012). These data have
been compiled for all the 117 watersheds that comprise the
Baltic Sea drainage area (82 major watersheds and 35
coastal areas) as well as for 8 ‘‘type watersheds,’’ and are
Fig. 1 The new catchment database accessible via the decision support system Nest (www.balticnest.org). This example shows agricultural data,
specifically the distribution of cultivation of common wheat and spelt. The Nest interface allows the user to make various calculations, in this
case aggregate data for countries or sub-catchments
12 AMBIO 2014, 43:11–25
123� The Author(s) 2013. This article is published with open access at Springerlink.com
www.kva.se/en
organized into fertilizer use, atmospheric deposition, bio-
logical N-fixation, crops, livestock, and human population
distributions.
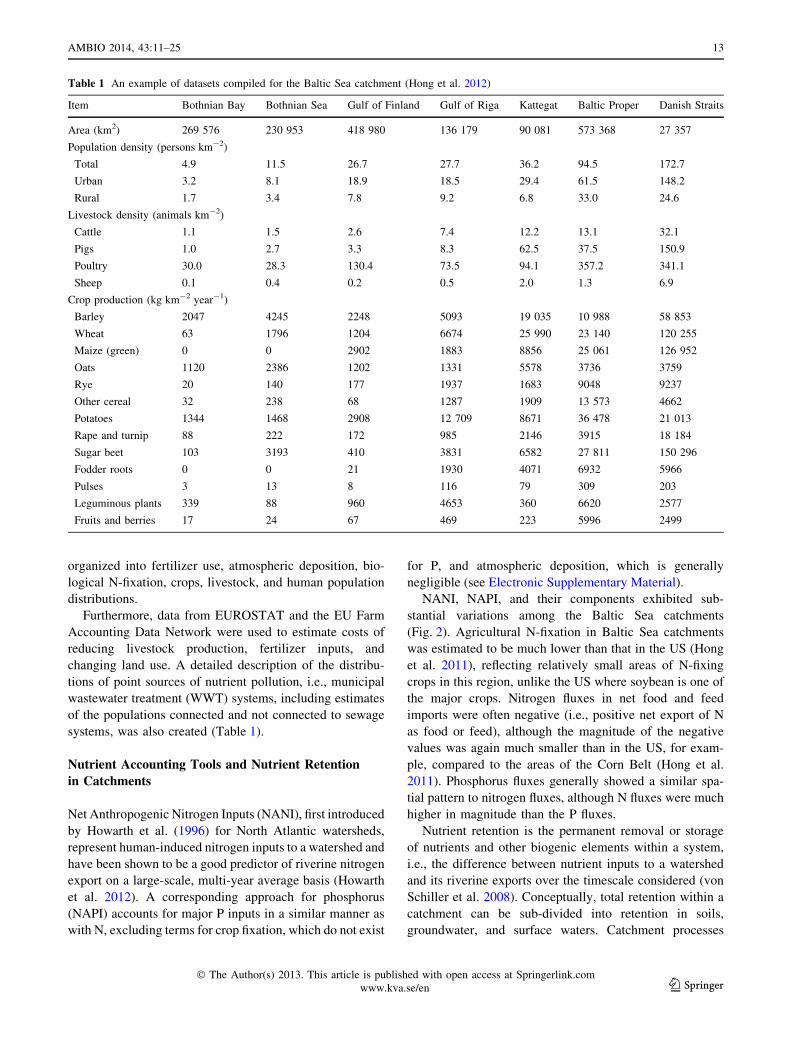
Furthermore, data from EUROSTAT and the EU Farm
Accounting Data Network were used to estimate costs of
reducing livestock production, fertilizer inputs, and
changing land use. A detailed description of the distribu-
tions of point sources of nutrient pollution, i.e., municipal
wastewater treatment (WWT) systems, including estimates
of the populations connected and not connected to sewage
systems, was also created (Table 1).
Nutrient Accounting Tools and Nutrient Retention
in Catchments
Net Anthropogenic Nitrogen Inputs (NANI), first introduced
by Howarth et al. (1996) for North Atlantic watersheds,
represent human-induced nitrogen inputs to a watershed and
have been shown to be a good predictor of riverine nitrogen
export on a large-scale, multi-year average basis (Howarth
et al. 2012). A corresponding approach for phosphorus
(NAPI) accounts for major P inputs in a similar manner as
with N, excluding terms for crop fixation, which do not exist
for P, and atmospheric deposition, which is generally
negligible (see Electronic Supplementary Material).
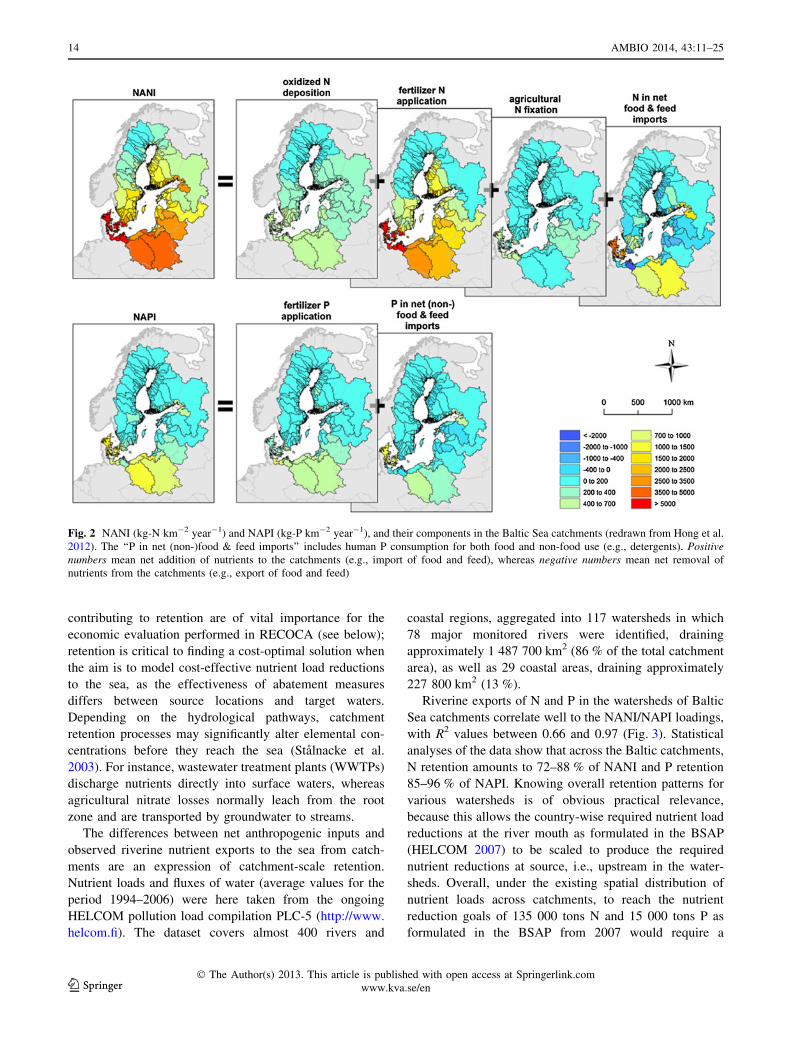
NANI, NAPI, and their components exhibited sub-
stantial variations among the Baltic Sea catchments
(Fig. 2). Agricultural N-fixation in Baltic Sea catchments
was estimated to be much lower than that in the US (Hong
et al. 2011), reflecting relatively small areas of N-fixing
crops in this region, unlike the US where soybean is one of
the major crops. Nitrogen fluxes in net food and feed
imports were often negative (i.e., positive net export of N
as food or feed), although the magnitude of the negative
values was again much smaller than in the US, for exam-
ple, compared to the areas of the Corn Belt (Hong et al.
2011). Phosphorus fluxes generally showed a similar spa-
tial pattern to nitrogen fluxes, although N fluxes were much
higher in magnitude than the P fluxes.
Nutrient retention is the permanent removal or storage
of nutrients and other biogenic elements within a system,
i.e., the difference between nutrient inputs to a watershed
and its riverine exports over the timescale considered (von
Schiller et al. 2008). Conceptually, total retention within a
catchment can be sub-divided into retention in soils,
groundwater, and surface waters. Catchment processes
Table 1 An example of datasets compiled for the Baltic Sea catchment (Hong et al. 2012)
Item Bothnian Bay Bothnian Sea Gulf of Finland Gulf of Riga Kattegat Baltic Proper Danish Straits
Area (km2) 269 576 230 953 418 980 136 179 90 081 573 368 27 357
Population density (persons km-2)
Total 4.9 11.5 26.7 27.7 36.2 94.5 172.7
Urban 3.2 8.1 18.9 18.5 29.4 61.5 148.2
Rural 1.7 3.4 7.8 9.2 6.8 33.0 24.6
Livestock density (animals km-2)
Cattle 1.1 1.5 2.6 7.4 12.2 13.1 32.1
Pigs 1.0 2.7 3.3 8.3 62.5 37.5 150.9
Poultry 30.0 28.3 130.4 73.5 94.1 357.2 341.1
Sheep 0.1 0.4 0.2 0.5 2.0 1.3 6.9
Crop production (kg km-2 year-1)
Barley 2047 4245 2248 5093 19 035 10 988 58 853
Wheat 63 1796 1204 6674 25 990 23 140 120 255
Maize (green) 0 0 2902 1883 8856 25 061 126 952
Oats 1120 2386 1202 1331 5578 3736 3759
Rye 20 140 177 1937 1683 9048 9237
Other cereal 32 238 68 1287 1909 13 573 4662
Potatoes 1344 1468 2908 12 709 8671 36 478 21 013
Rape and turnip 88 222 172 985 2146 3915 18 184
Sugar beet 103 3193 410 3831 6582 27 811 150 296
Fodder roots 0 0 21 1930 4071 6932 5966
Pulses 3 13 8 116 79 309 203
Leguminous plants 339 88 960 4653 360 6620 2577
Fruits and berries 17 24 67 469 223 5996 2499
AMBIO 2014, 43:11–25 13
� The Author(s) 2013. This article is published with open access at Springerlink.com
www.kva.se/en 123
contributing to retention are of vital importance for the
economic evaluation performed in RECOCA (see below);
retention is critical to finding a cost-optimal solution when
the aim is to model cost-effective nutrient load reductions
to the sea, as the effectiveness of abatement measures
differs between source locations and target waters.
Depending on the hydrological pathways, catchment
retention processes may significantly alter elemental con-
centrations before they reach the sea (Stalnacke et al.
2003). For instance, wastewater treatment plants (WWTPs)
discharge nutrients directly into surface waters, whereas
agricultural nitrate losses normally leach from the root
zone and are transported by groundwater to streams.
The differences between net anthropogenic inputs and
observed riverine nutrient exports to the sea from catch-
ments are an expression of catchment-scale retention.
Nutrient loads and fluxes of water (average values for the
period 1994–2006) were here taken from the ongoing
HELCOM pollution load compilation PLC-5 (http://www.
helcom.fi). The dataset covers almost 400 rivers and
coastal regions, aggregated into 117 watersheds in which
78 major monitored rivers were identified, draining
approximately 1 487 700 km2 (86 % of the total catchment
area), as well as 29 coastal areas, draining approximately
227 800 km2 (13 %).
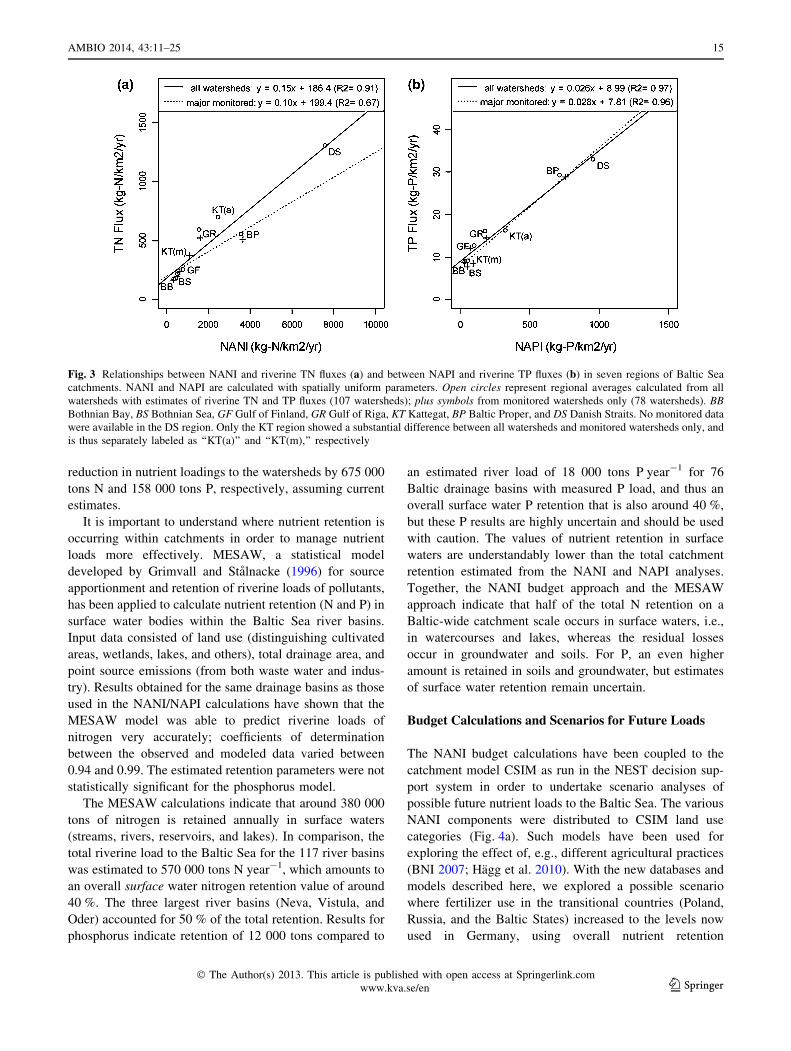
Riverine exports of N and P in the watersheds of Baltic
Sea catchments correlate well to the NANI/NAPI loadings,
with R2 values between 0.66 and 0.97 (Fig. 3). Statistical
analyses of the data show that across the Baltic catchments,
N retention amounts to 72–88 % of NANI and P retention
85–96 % of NAPI. Knowing overall retention patterns for
various watersheds is of obvious practical relevance,
because this allows the country-wise required nutrient load
reductions at the river mouth as formulated in the BSAP
(HELCOM 2007) to be scaled to produce the required
nutrient reductions at source, i.e., upstream in the water-
sheds. Overall, under the existing spatial distribution of
nutrient loads across catchments, to reach the nutrient
reduction goals of 135 000 tons N and 15 000 tons P as
formulated in the BSAP from 2007 would require a
Fig. 2 NANI (kg-N km-2 year-1) and NAPI (kg-P km-2 year-1), and their components in the Baltic Sea catchments (redrawn from Hong et al.
2012). The ‘‘P in net (non-)food & feed imports’’ includes human P consumption for both food and non-food use (e.g., detergents). Positive
numbers mean net addition of nutrients to the catchments (e.g., import of food and feed), whereas negative numbers mean net removal of
nutrients from the catchments (e.g., export of food and feed)
14 AMBIO 2014, 43:11–25
123� The Author(s) 2013. This article is published with open access at Springerlink.com
www.kva.se/en
reduction in nutrient loadings to the watersheds by 675 000
tons N and 158 000 tons P, respectively, assuming current
estimates.
It is important to understand where nutrient retention is
occurring within catchments in order to manage nutrient
loads more effectively. MESAW, a statistical model
developed by Grimvall and Stalnacke (1996) for source
apportionment and retention of riverine loads of pollutants,
has been applied to calculate nutrient retention (N and P) in
surface water bodies within the Baltic Sea river basins.
Input data consisted of land use (distinguishing cultivated
areas, wetlands, lakes, and others), total drainage area, and
point source emissions (from both waste water and indus-
try). Results obtained for the same drainage basins as those
used in the NANI/NAPI calculations have shown that the
MESAW model was able to predict riverine loads of
nitrogen very accurately; coefficients of determination
between the observed and modeled data varied between
0.94 and 0.99. The estimated retention parameters were not
statistically significant for the phosphorus model.
The MESAW calculations indicate that around 380 000
tons of nitrogen is retained annually in surface waters
(streams, rivers, reservoirs, and lakes). In comparison, the
total riverine load to the Baltic Sea for the 117 river basins
was estimated to 570 000 tons N year-1, which amounts to
an overall surface water nitrogen retention value of around
40 %. The three largest river basins (Neva, Vistula, and
Oder) accounted for 50 % of the total retention. Results for
phosphorus indicate retention of 12 000 tons compared to
an estimated river load of 18 000 tons P year-1 for 76
Baltic drainage basins with measured P load, and thus an
overall surface water P retention that is also around 40 %,
but these P results are highly uncertain and should be used
with caution. The values of nutrient retention in surface
waters are understandably lower than the total catchment
retention estimated from the NANI and NAPI analyses.
Together, the NANI budget approach and the MESAW
approach indicate that half of the total N retention on a
Baltic-wide catchment scale occurs in surface waters, i.e.,
in watercourses and lakes, whereas the residual losses
occur in groundwater and soils. For P, an even higher
amount is retained in soils and groundwater, but estimates
of surface water retention remain uncertain.
Budget Calculations and Scenarios for Future Loads
The NANI budget calculations have been coupled to the
catchment model CSIM as run in the NEST decision sup-
port system in order to undertake scenario analyses of
possible future nutrient loads to the Baltic Sea. The various
NANI components were distributed to CSIM land use
categories (Fig. 4a). Such models have been used for
exploring the effect of, e.g., different agricultural practices
(BNI 2007; Hagg et al. 2010). With the new databases and
models described here, we explored a possible scenario
where fertilizer use in the transitional countries (Poland,
Russia, and the Baltic States) increased to the levels now
used in Germany, using overall nutrient retention
Fig. 3 Relationships between NANI and riverine TN fluxes (a) and between NAPI and riverine TP fluxes (b) in seven regions of Baltic Sea
catchments. NANI and NAPI are calculated with spatially uniform parameters. Open circles represent regional averages calculated from all
watersheds with estimates of riverine TN and TP fluxes (107 watersheds); plus symbols from monitored watersheds only (78 watersheds). BB
Bothnian Bay, BS Bothnian Sea, GF Gulf of Finland, GR Gulf of Riga, KT Kattegat, BP Baltic Proper, and DS Danish Straits. No monitored data
were available in the DS region. Only the KT region showed a substantial difference between all watersheds and monitored watersheds only, and
is thus separately labeled as ‘‘KT(a)’’ and ‘‘KT(m),’’ respectively
AMBIO 2014, 43:11–25 15
� The Author(s) 2013. This article is published with open access at Springerlink.com
www.kva.se/en 123
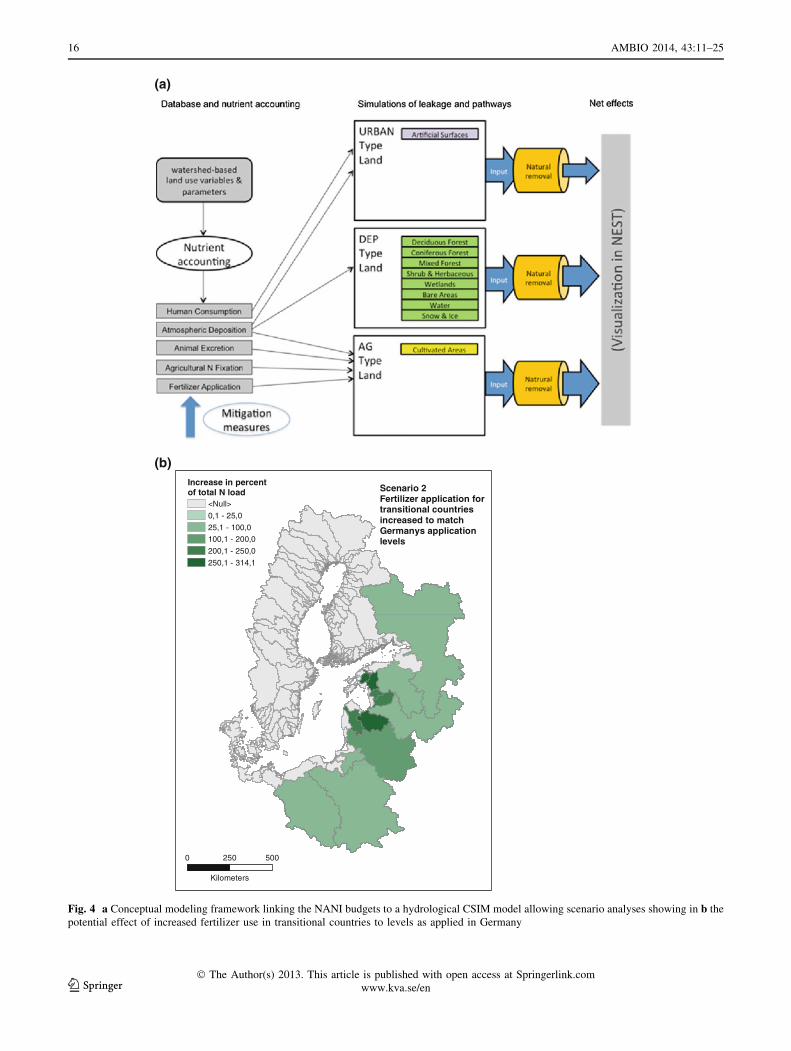
Kilometers
0 250 500
Scenario 2 Fertilizer application fortransitional countriesincreased to match Germanys applicationlevels
Increase in percentof total N load
<Null>
0,1 - 25,0
25,1 - 100,0
100,1 - 200,0
200,1 - 250,0
250,1 - 314,1
(a)
(b)
Fig. 4 a Conceptual modeling framework linking the NANI budgets to a hydrological CSIM model allowing scenario analyses showing in b the
potential effect of increased fertilizer use in transitional countries to levels as applied in Germany
16 AMBIO 2014, 43:11–25
123� The Author(s) 2013. This article is published with open access at Springerlink.com
www.kva.se/en
estimates from the NANI approach and hydrological
characteristics of the individual watersheds as described
in CSIM. Modeling suggests that nutrient loads to the
Baltic may increase drastically under this scenario
(Fig. 4b). This scenario suggests that changes in agricul-
tural practices in transitional countries could indeed have
dramatic effects on the Baltic Sea ecosystem and the
results also indicate which individual watersheds are most
sensitive to these changes.
Detailed Simulations of Nutrient Pathways
and Effects of Abatement Measures for the Baltic
Sea
Beyond estimating watershed nutrient retention, a dynamic
model with much higher resolution approaching farm scale
has been used to quantify the effects of various abatement
measures on nutrient loads to the sea. NANI/NAPI calcula-
tions and the MESAW model cannot describe the detailed
effects of changing management activities, e.g., in agricul-
ture because they operate at broad spatial resolutions.
Abatement measures simulated were changes in fertil-
izer use, livestock density and atmospheric deposition,
creation of wetlands, and improved sewage treatment. To
quantify the effects of these measures, it is necessary to
describe load reductions at various sources, as well as
nutrient removal along transport pathways in soils,
groundwater, lakes, and streams. Such estimates are also
essential to calculate the cost-effectiveness of abatement
measures, as described below.
To characterize important variables at a close to farm-
level resolution, the Baltic Sea catchment (1.7 9 106 km2)
was partitioned into 10 9 10 km grid cells in which land
use and agricultural practices were specified, based on
information from a comprehensive dataset combining
national and regional statistics and published surveys. The
strong heterogeneity in farm size and production intensity
within the catchment was characterized by introducing
three different representative farm types, for which live-
stock, and fertilizer and manure inputs per crop were
specified for each riparian country and calibrated to
national statistics on consumption of fertilizer and manure.
Within each country, the farm types were distributed at the
NUTS2/Oblast/Voblast spatial scale using livestock pro-
duction as a key, forming a consistent and very detailed
description of agricultural production throughout the Baltic
Sea catchment. Once the near farm-level variations in key
variables were established, the soil–vegetation–atmosphere
model DAISY was applied to estimate nutrient fluxes
corresponding to the high-resolution farm management
data (see Electronic Supplementary Material).
The high-resolution data in the Baltic Sea database
enabled us to provide the DAISY model with information
over the entire catchment, including precipitation, tem-
perature, soil types, farm types, and levels of inputs of
fertilizer and manure to crops. It thus became possible to
describe relationships between these drivers and nutrient
leaching for the entire region. These model outputs
regarding catchment and soil type-specific fertilizer and
manure inputs to crops were subsequently used as inputs to
the cost modeling. Due to computational constraints, a
direct link between DAISY and the cost-minimization
model was not possible.
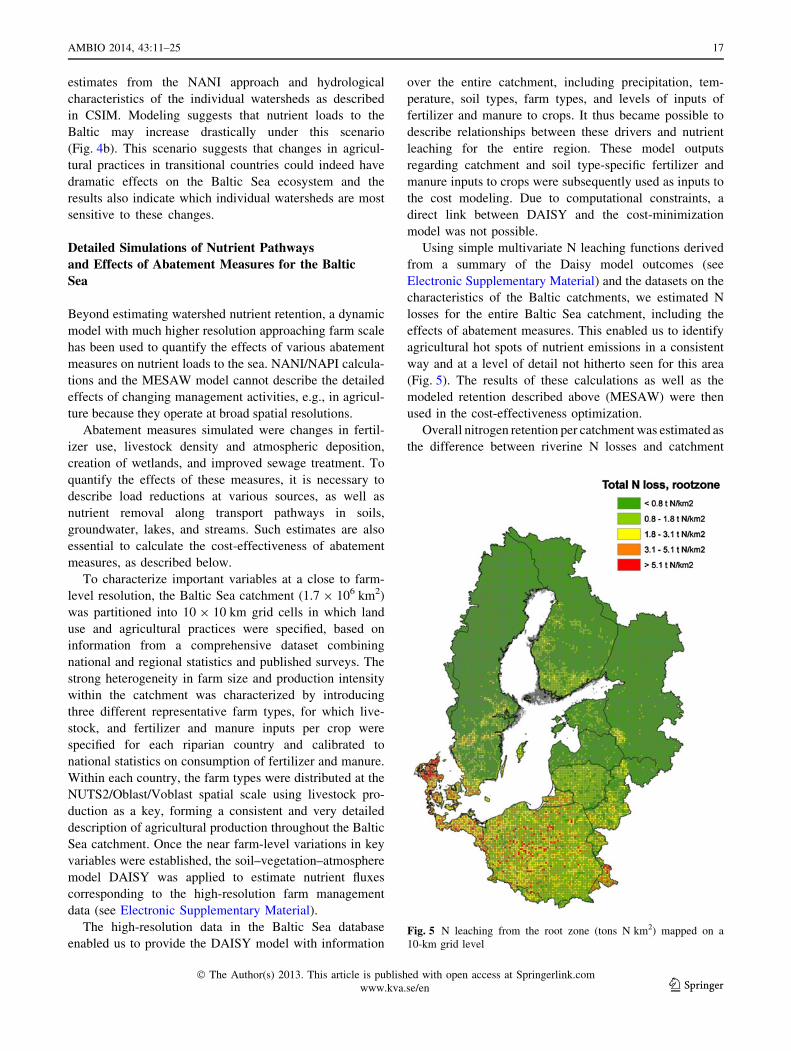
Using simple multivariate N leaching functions derived
from a summary of the Daisy model outcomes (see
Electronic Supplementary Material) and the datasets on the
characteristics of the Baltic catchments, we estimated N
losses for the entire Baltic Sea catchment, including the
effects of abatement measures. This enabled us to identify
agricultural hot spots of nutrient emissions in a consistent
way and at a level of detail not hitherto seen for this area
(Fig. 5). The results of these calculations as well as the
modeled retention described above (MESAW) were then
used in the cost-effectiveness optimization.
Overall nitrogen retention per catchment was estimated as
the difference between riverine N losses and catchment
Fig. 5 N leaching from the root zone (tons N km2) mapped on a
10-km grid level
AMBIO 2014, 43:11–25 17
� The Author(s) 2013. This article is published with open access at Springerlink.com
www.kva.se/en 123
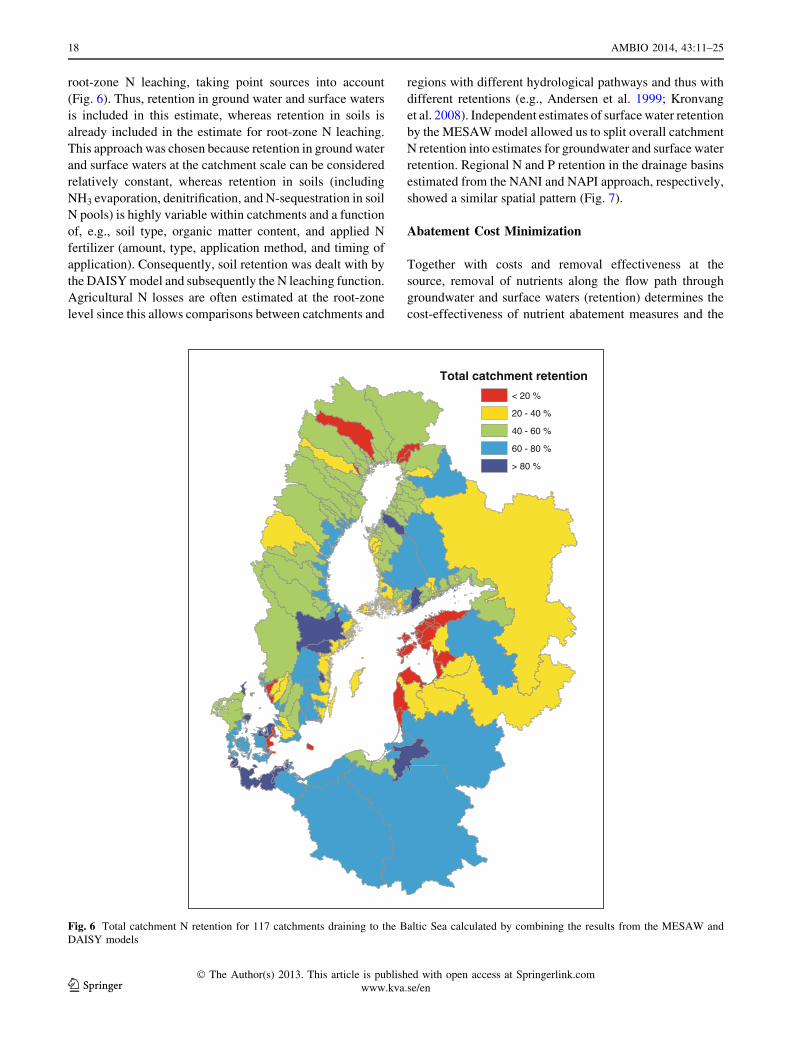
root-zone N leaching, taking point sources into account
(Fig. 6). Thus, retention in ground water and surface waters
is included in this estimate, whereas retention in soils is
already included in the estimate for root-zone N leaching.
This approach was chosen because retention in ground water
and surface waters at the catchment scale can be considered
relatively constant, whereas retention in soils (including
NH3 evaporation, denitrification, and N-sequestration in soil
N pools) is highly variable within catchments and a function
of, e.g., soil type, organic matter content, and applied N
fertilizer (amount, type, application method, and timing of
application). Consequently, soil retention was dealt with by
the DAISY model and subsequently the N leaching function.
Agricultural N losses are often estimated at the root-zone
level since this allows comparisons between catchments and
regions with different hydrological pathways and thus with
different retentions (e.g., Andersen et al. 1999; Kronvang
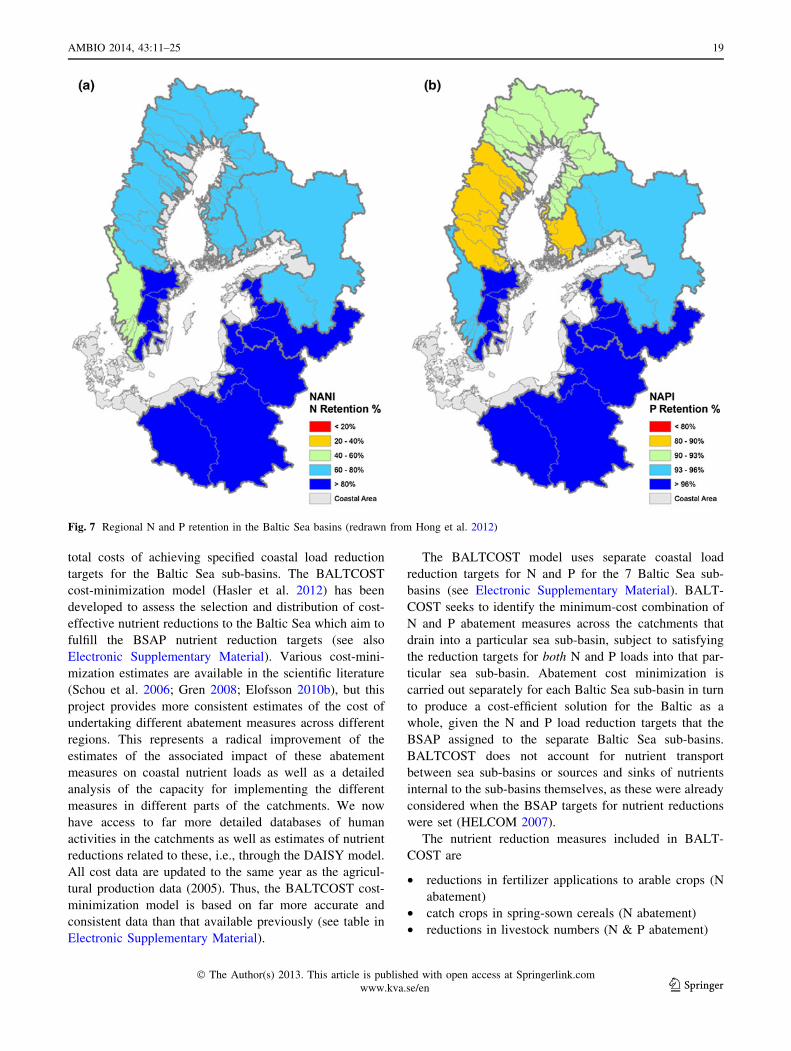
et al. 2008). Independent estimates of surface water retention
by the MESAW model allowed us to split overall catchment
N retention into estimates for groundwater and surface water
retention. Regional N and P retention in the drainage basins
estimated from the NANI and NAPI approach, respectively,
showed a similar spatial pattern (Fig. 7).
Abatement Cost Minimization
Together with costs and removal effectiveness at the
source, removal of nutrients along the flow path through
groundwater and surface waters (retention) determines the
cost-effectiveness of nutrient abatement measures and the
Total catchment retention
< 20 %
20 - 40 %
40 - 60 %
60 - 80 %
> 80 %
Fig. 6 Total catchment N retention for 117 catchments draining to the Baltic Sea calculated by combining the results from the MESAW and
DAISY models
18 AMBIO 2014, 43:11–25
123� The Author(s) 2013. This article is published with open access at Springerlink.com
www.kva.se/en
total costs of achieving specified coastal load reduction
targets for the Baltic Sea sub-basins. The BALTCOST
cost-minimization model (Hasler et al. 2012) has been
developed to assess the selection and distribution of cost-
effective nutrient reductions to the Baltic Sea which aim to
fulfill the BSAP nutrient reduction targets (see also
Electronic Supplementary Material). Various cost-mini-
mization estimates are available in the scientific literature
(Schou et al. 2006; Gren 2008; Elofsson 2010b), but this
project provides more consistent estimates of the cost of
undertaking different abatement measures across different
regions. This represents a radical improvement of the
estimates of the associated impact of these abatement
measures on coastal nutrient loads as well as a detailed
analysis of the capacity for implementing the different
measures in different parts of the catchments. We now
have access to far more detailed databases of human
activities in the catchments as well as estimates of nutrient
reductions related to these, i.e., through the DAISY model.
All cost data are updated to the same year as the agricul-
tural production data (2005). Thus, the BALTCOST cost-
minimization model is based on far more accurate and
consistent data than that available previously (see table in
Electronic Supplementary Material).
The BALTCOST model uses separate coastal load
reduction targets for N and P for the 7 Baltic Sea sub-
basins (see Electronic Supplementary Material). BALT-
COST seeks to identify the minimum-cost combination of
N and P abatement measures across the catchments that
drain into a particular sea sub-basin, subject to satisfying
the reduction targets for both N and P loads into that par-
ticular sea sub-basin. Abatement cost minimization is
carried out separately for each Baltic Sea sub-basin in turn
to produce a cost-efficient solution for the Baltic as a
whole, given the N and P load reduction targets that the
BSAP assigned to the separate Baltic Sea sub-basins.
BALTCOST does not account for nutrient transport
between sea sub-basins or sources and sinks of nutrients
internal to the sub-basins themselves, as these were already
considered when the BSAP targets for nutrient reductions
were set (HELCOM 2007).
The nutrient reduction measures included in BALT-
COST are
• reductions in fertilizer applications to arable crops (N
abatement)
• catch crops in spring-sown cereals (N abatement)
• reductions in livestock numbers (N & P abatement)
Fig. 7 Regional N and P retention in the Baltic Sea basins (redrawn from Hong et al. 2012)
AMBIO 2014, 43:11–25 19
� The Author(s) 2013. This article is published with open access at Springerlink.com
www.kva.se/en 123
• restoring wetlands on agricultural land (N & P abatement)
• improving WWT (N & P abatement)
In the present BALTCOST model, livestock reductions are
anticipated to have effects on both N and P abatement in most
cases. It would be much harder to achieve the BSAP P load
reduction targets, particularly in the Baltic Proper sub-basin
if the effects of livestock reduction were excluded. More
measures will be implemented in the BALTCOST model in
the future, for instance, constructing wetlands on non-
agricultural land, NOx reductions from power plants and
ships, as well as measures for increased utilization of
livestock manure to decrease nutrient loads from livestock
farms in those countries where the utilization rate is currently
low (50 % of the nutrient content utilized or lower).
The BALTCOST model identifies the least-cost com-
bination of the five nutrient abatement measures within
each of 22 main Baltic drainage basins that will deliver the
separate BSAP N and P load reduction targets specified for
each of the seven Baltic Sea sub-basins.
The modeled capacity of the abatement measures, i.e.,
the maximum extent to which the measures can be
implemented in each catchment, cannot be measured with
full certainty. For example, the maximum allowable wet-
land restoration is estimated by mapping the share of
organic agricultural soils within each catchment, and,
consequently, a rather large share of the catchment can be
converted into wetlands if the organic share is high and
vice versa (wetland restoration capacity varies between 0.1
and 15 % of the agricultural land within the 22 drainage
basins). We considered this approach to be less uncertain
than assuming a fixed capacity constraint for wetland res-
toration for all catchments. A capacity constraint for the
maximum reduction in nitrogen fertilizer application was
set at 20 %. This constraint setting was chosen because
reduction beyond this range is likely to influence the
parameters of the yield functions from which the oppor-
tunity costs of fertilizer reduction were calculated.
Increasing the maximum fertilizer reduction capacity
beyond this 20 % limit could thus lead to faulty results as
the shape of the yield functions will change due to deple-
tion of the nitrogen stock in the soil. The maximum
capacity for the livestock reduction measures was set at
30 % of the current herd sizes for the species concerned in
each drainage basin. This capacity limit was chosen
because further reductions in livestock numbers would be
likely to incur additional costs, which are not reflected in
the model, such as costs arising from prior investment in
animal housing facilities and milking parlors. The reduc-
tion in manure fertilizer application to the field following
livestock reductions is assumed to be substituted by com-
mercial fertilizer with a lower nutrient loss. The application
capacity constraint for catch crops is assumed to be the
current land area sown with spring cereals, and for WWTP
drainage basin-specific capacity constraints for WWT
upgrading are estimated for each watershed, using data
detailing the current implementation of WWT technology
within the drainage basin (Berbeka et al. 2012).
The results in Table 2 report the minimum-cost combi-
nation of N and P abatement measures identified by
BALTCOST at drainage basin spatial resolution for deliv-
ering load reductions that match the BSAP load reduction
targets as fully as possible, given that the measure-specific
maximum abatement capacities are implemented. BALT-
COST results indicate that the BSAP load reduction targets
can be delivered in all instances except for N reductions in
the Danish Straits and P reductions in the Baltic Proper.
The lowest-cost combination of drainage basin-specific
abatement measures, which almost achieves the BSAP load
reduction targets (Table 2), delivers N and P reductions
that exceed the targets specified for N for the Baltic Proper
and the Gulf of Finland because some measures (livestock
reductions, wetlands, and WWT upgrading) are anticipated
to deliver both N and P reductions simultaneously. Thus,
for example, increasing implementation of the wetlands’
measure to satisfy a P load reduction target will also deliver
N load reductions, whether or not these N load reductions
are required and vice versa.
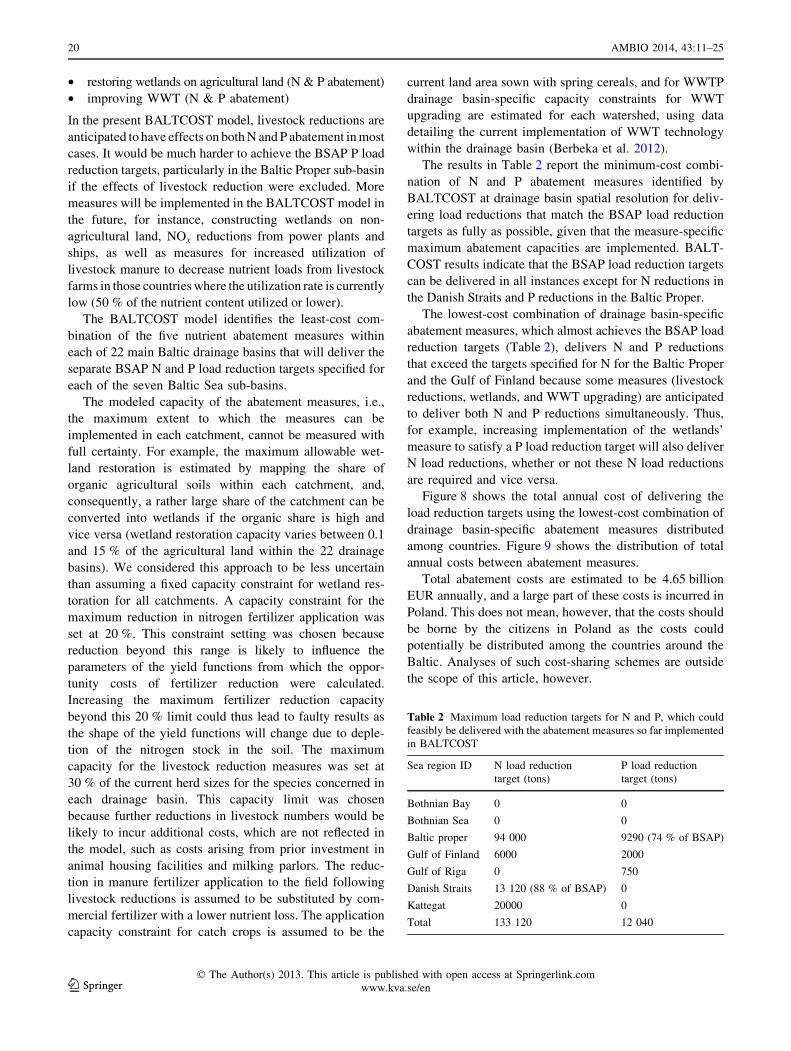
Figure 8 shows the total annual cost of delivering the
load reduction targets using the lowest-cost combination of
drainage basin-specific abatement measures distributed
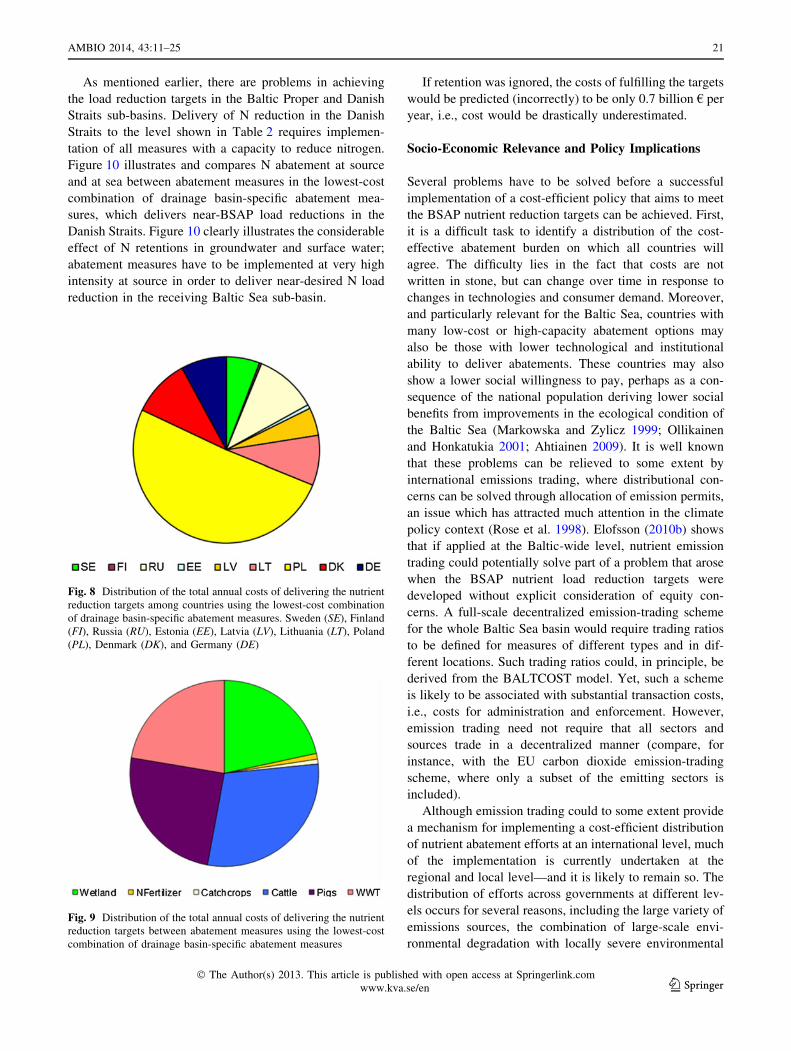
among countries. Figure 9 shows the distribution of total
annual costs between abatement measures.
Total abatement costs are estimated to be 4.65 billion
EUR annually, and a large part of these costs is incurred in
Poland. This does not mean, however, that the costs should
be borne by the citizens in Poland as the costs could
potentially be distributed among the countries around the
Baltic. Analyses of such cost-sharing schemes are outside
the scope of this article, however.
Table 2 Maximum load reduction targets for N and P, which could
feasibly be delivered with the abatement measures so far implemented
in BALTCOST
Sea region ID N load reduction
target (tons)
P load reduction
target (tons)
Bothnian Bay 0 0
Bothnian Sea 0 0
Baltic proper 94 000 9290 (74 % of BSAP)
Gulf of Finland 6000 2000
Gulf of Riga 0 750
Danish Straits 13 120 (88 % of BSAP) 0
Kattegat 20000 0
Total 133 120 12 040
20 AMBIO 2014, 43:11–25
123� The Author(s) 2013. This article is published with open access at Springerlink.com
www.kva.se/en
As mentioned earlier, there are problems in achieving
the load reduction targets in the Baltic Proper and Danish
Straits sub-basins. Delivery of N reduction in the Danish
Straits to the level shown in Table 2 requires implemen-
tation of all measures with a capacity to reduce nitrogen.
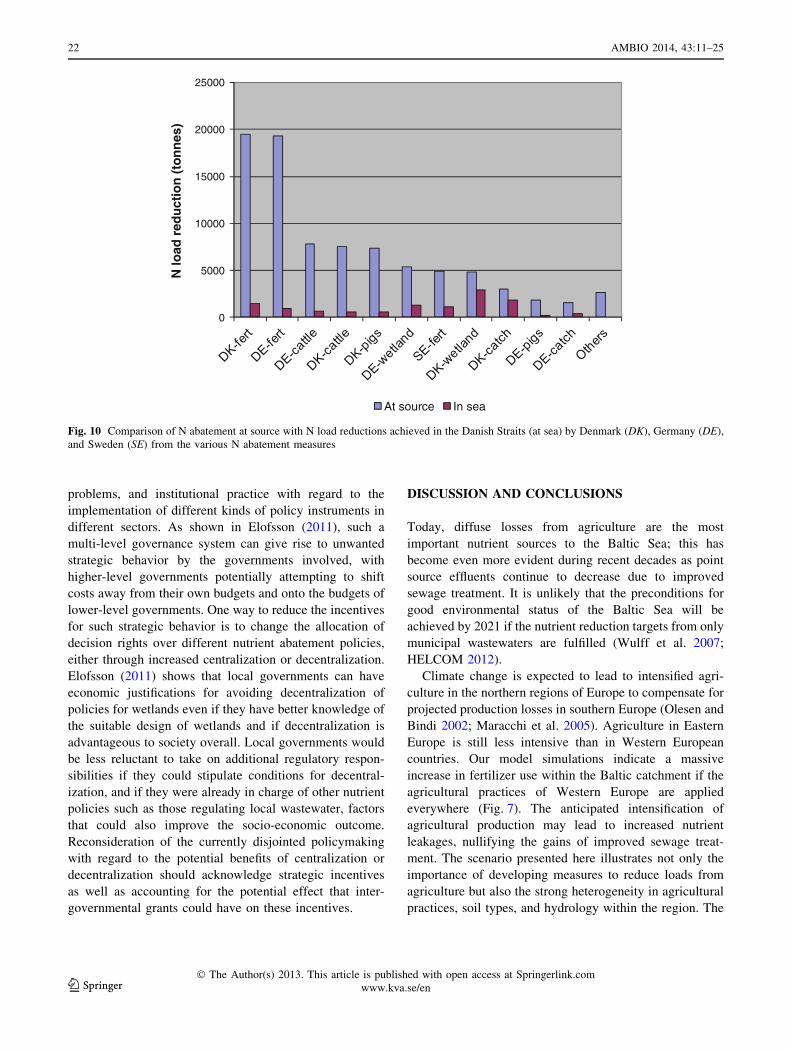
Figure 10 illustrates and compares N abatement at source
and at sea between abatement measures in the lowest-cost
combination of drainage basin-specific abatement mea-
sures, which delivers near-BSAP load reductions in the
Danish Straits. Figure 10 clearly illustrates the considerable
effect of N retentions in groundwater and surface water;
abatement measures have to be implemented at very high
intensity at source in order to deliver near-desired N load
reduction in the receiving Baltic Sea sub-basin.
If retention was ignored, the costs of fulfilling the targets
would be predicted (incorrectly) to be only 0.7 billion € per
year, i.e., cost would be drastically underestimated.
Socio-Economic Relevance and Policy Implications
Several problems have to be solved before a successful
implementation of a cost-efficient policy that aims to meet
the BSAP nutrient reduction targets can be achieved. First,
it is a difficult task to identify a distribution of the cost-
effective abatement burden on which all countries will
agree. The difficulty lies in the fact that costs are not
written in stone, but can change over time in response to
changes in technologies and consumer demand. Moreover,
and particularly relevant for the Baltic Sea, countries with
many low-cost or high-capacity abatement options may
also be those with lower technological and institutional
ability to deliver abatements. These countries may also
show a lower social willingness to pay, perhaps as a con-
sequence of the national population deriving lower social
benefits from improvements in the ecological condition of
the Baltic Sea (Markowska and Zylicz 1999; Ollikainen
and Honkatukia 2001; Ahtiainen 2009). It is well known
that these problems can be relieved to some extent by
international emissions trading, where distributional con-
cerns can be solved through allocation of emission permits,
an issue which has attracted much attention in the climate
policy context (Rose et al. 1998). Elofsson (2010b) shows
that if applied at the Baltic-wide level, nutrient emission
trading could potentially solve part of a problem that arose
when the BSAP nutrient load reduction targets were
developed without explicit consideration of equity con-
cerns. A full-scale decentralized emission-trading scheme
for the whole Baltic Sea basin would require trading ratios
to be defined for measures of different types and in dif-
ferent locations. Such trading ratios could, in principle, be
derived from the BALTCOST model. Yet, such a scheme
is likely to be associated with substantial transaction costs,
i.e., costs for administration and enforcement. However,
emission trading need not require that all sectors and
sources trade in a decentralized manner (compare, for
instance, with the EU carbon dioxide emission-trading
scheme, where only a subset of the emitting sectors is
included).
Although emission trading could to some extent provide
a mechanism for implementing a cost-efficient distribution
of nutrient abatement efforts at an international level, much
of the implementation is currently undertaken at the
regional and local level—and it is likely to remain so. The
distribution of efforts across governments at different lev-
els occurs for several reasons, including the large variety of
emissions sources, the combination of large-scale envi-
ronmental degradation with locally severe environmental
Fig. 8 Distribution of the total annual costs of delivering the nutrient
reduction targets among countries using the lowest-cost combination
of drainage basin-specific abatement measures. Sweden (SE), Finland
(FI), Russia (RU), Estonia (EE), Latvia (LV), Lithuania (LT), Poland
(PL), Denmark (DK), and Germany (DE)
Fig. 9 Distribution of the total annual costs of delivering the nutrient
reduction targets between abatement measures using the lowest-cost
combination of drainage basin-specific abatement measures
AMBIO 2014, 43:11–25 21
� The Author(s) 2013. This article is published with open access at Springerlink.com
www.kva.se/en 123
problems, and institutional practice with regard to the
implementation of different kinds of policy instruments in
different sectors. As shown in Elofsson (2011), such a
multi-level governance system can give rise to unwanted
strategic behavior by the governments involved, with
higher-level governments potentially attempting to shift
costs away from their own budgets and onto the budgets of
lower-level governments. One way to reduce the incentives
for such strategic behavior is to change the allocation of
decision rights over different nutrient abatement policies,
either through increased centralization or decentralization.
Elofsson (2011) shows that local governments can have
economic justifications for avoiding decentralization of
policies for wetlands even if they have better knowledge of
the suitable design of wetlands and if decentralization is
advantageous to society overall. Local governments would
be less reluctant to take on additional regulatory respon-
sibilities if they could stipulate conditions for decentral-
ization, and if they were already in charge of other nutrient
policies such as those regulating local wastewater, factors
that could also improve the socio-economic outcome.
Reconsideration of the currently disjointed policymaking
with regard to the potential benefits of centralization or
decentralization should acknowledge strategic incentives
as well as accounting for the potential effect that inter-
governmental grants could have on these incentives.
DISCUSSION AND CONCLUSIONS
Today, diffuse losses from agriculture are the most
important nutrient sources to the Baltic Sea; this has
become even more evident during recent decades as point
source effluents continue to decrease due to improved
sewage treatment. It is unlikely that the preconditions for
good environmental status of the Baltic Sea will be
achieved by 2021 if the nutrient reduction targets from only
municipal wastewaters are fulfilled (Wulff et al. 2007;
HELCOM 2012).
Climate change is expected to lead to intensified agri-
culture in the northern regions of Europe to compensate for
projected production losses in southern Europe (Olesen and
Bindi 2002; Maracchi et al. 2005). Agriculture in Eastern
Europe is still less intensive than in Western European
countries. Our model simulations indicate a massive
increase in fertilizer use within the Baltic catchment if the
agricultural practices of Western Europe are applied
everywhere (Fig. 7). The anticipated intensification of
agricultural production may lead to increased nutrient
leakages, nullifying the gains of improved sewage treat-
ment. The scenario presented here illustrates not only the
importance of developing measures to reduce loads from
agriculture but also the strong heterogeneity in agricultural
practices, soil types, and hydrology within the region. The
0
5000
10000
15000
20000
25000
N lo
ad r
edu
ctio
n (
ton
nes
)
At source In sea
Fig. 10 Comparison of N abatement at source with N load reductions achieved in the Danish Straits (at sea) by Denmark (DK), Germany (DE),
and Sweden (SE) from the various N abatement measures
22 AMBIO 2014, 43:11–25
123� The Author(s) 2013. This article is published with open access at Springerlink.com
www.kva.se/en
most cost-effective measures in, for instance, Denmark,
may not be relevant in Poland. The databases and models
described here should be useful in further discussions
among stakeholders, managers, and scientists in search of a
sustainable productive agricultural system while still
reducing nutrient loads and restoring the Baltic Sea.
The BALTCOST model supplements existing cost-
modeling tools for the Baltic, as it is built on intensive,
detailed interdisciplinary work and data exchange between
natural scientists and economists within the RECOCA pro-
ject. This economic model indicates that it is possible to
achieve the BSAP load reduction targets for N and P in most
Baltic Sea regions, with the exception of the P load target in
the Baltic Proper and the N reduction target in the Danish
Straits, where only 74 and 88 % respectively, of the desired
BSAP load reductions can be delivered within modeled
abatement capacity constraints. The minimized total cost per
year of delivering these near-BSAP load reductions across
the 9 Baltic littoral countries is estimated to be 4.69 billion €.
This result is comparable with the cost predictions produced
in previous studies. For example, Elofsson (2010b) con-
cluded that previous models predicted costs of 2.6–5.0 bil-
lion € per year to deliver the load reductions specified in the
BSAP. The differences between the cost predictions of the
models can be explained by variations in the number of
abatement measures included, differences in the modeled
cost estimates, differences in the implementation of the load
reduction targets, and—particularly important in a REC-
OCA context—differences in the spatial resolution of the
modeled nutrient retention. Our results show that differences
in the way in which retention is modeled can exert consid-
erable influence over the minimum predicted abatement
costs. Retention varies not only between catchments but also
within catchments depending on hydrological pathways
(e.g., between tile drained and non-tile drained areas). Thus,
future research into identification and mapping of areas with
low retention could further stimulate application of cost-
effective measures.
These models can be used to explore comparisons of
nutrient management strategies between different regions,
which could be relevant for policy analysis of coastal load
reductions to the entire Baltic. It is obvious that the country
allocation scheme that is used now, based on the principle
of ‘‘polluters pay,’’ is far more expensive than a scheme
based on cost minimization, but implementing such a
minimum-cost scheme would require some form of com-
pensation or a nutrient-trading system to be adopted on at
least a regional scale. Nutrient trading has been imple-
mented in other regions, particularly in the US (EPA 2013).
For the Baltic Sea, the trading system would necessarily be
international, and realization of such a system is unlikely in
the immediate term (Ollikainen and Honkatukia 2001).
Regulatory disincentives have frozen many water quality-
trading initiatives, especially those involving nonpoint
sources (King 2005). Nutrient trading requires decisions on
the extent to which, and where, excessive nutrient loads
should be eliminated; in a Baltic context, this is defined by
the BSAP. As pointed out by, e.g., NEFCO (2008), a
prerequisite for successful implementation of a nutrient-
trading regime is the availability of good data on the costs
and effectiveness of abatement measures undertaken at
different locations. The studies reported here clearly show
that we are rapidly closing the gap between nutrient-trading
policy and science.
Acknowledgments This paper is a contribution from the RECOCA
project, which has received funding from the BONUS ? program
funded jointly by European Community’s Seventh framework Pro-
gramme (FP7/2007-2013, grant agreement 217246) and Baltic Sea
national funding institutions.
Open Access This article is distributed under the terms of the
Creative Commons Attribution License which permits any use, dis-
tribution, and reproduction in any medium, provided the original
author(s) and the source are credited.
REFERENCES
Ahtiainen, H. 2009. Valuing international marine resources: A meta-
analysis on the Baltic Sea. MTT Discussion Papers, 1-2009.
Andersen, H.E., B. Kronvang, and S.E. Larsen. 1999. Agricultural
practices and diffuse nitrogen pollution in Denmark: Empirical
leaching and catchment models. Water Science and Technology
39: 257–264.
Backer, H., J.-M. Leppanen, A.C. Brusendorff, K. Forsius, M.
Stankiewicz, J. Mehtonen, M. Pyhala, M. Laamanen, et al. 2010.
HELCOM Baltic Sea Action Plan—A regional programme of
measures for the marine environment based on the Ecosystem
Approach. Marine Pollution Bulletin 60: 642–649.
Berbeka, K., M. Czajkowski, and A. Markowska. 2012. Municipal
wastewater treatment in Poland—Efficiency, costs and returns to
scale. Water Science and Technology 66: 394–401. doi:10.2166/
wst.2012.199.
BNI. 2007. Management options, nutrient loads and ecosystem
responses for the Baltic Sea; Policy scenarios from BNI/NEST.
Retrieved February 11, 2013, from http://www.helcom.fi/BSAP/
en_GB/intro/.
Elofsson, K. 2010a. Cost-effectiveness of the Baltic Sea Action Plan.
Marine Policy 34: 1043–1050.
Elofsson, K. 2010b. The costs of meeting the environmental objectives
for the Baltic Sea: A review of the literature. AMBIO 39: 49–58.
Elofsson, K. 2011. Delegation of decision-rights for wetlands.
Environmental & Resource Economics 50: 285–303.
EPA. 2013. Water Quality Trading. Retrieved February 11, 2013,
from http://water.epa.gov/type/watersheds/trading.cfm.
Gren, I.-M. 2008. Costs and benefits from nutrient reductions to the
Baltic Sea. Swedish Environmental Protection Agency Report
5877, December 2008. Retrieved February 20, 2013, from http://
www.naturvardsverket.se/Documents/publikationer/978-91-620-
5877-7.pdf.
Grimvall, A., and P. Stalnacke. 1996. Statistical methods for source
apportionment of riverine loads of pollutants. Environmetrics 7:
201–213.
AMBIO 2014, 43:11–25 23
� The Author(s) 2013. This article is published with open access at Springerlink.com
www.kva.se/en 123
Hasler, B., J.C.R. Smart, A. Fonnesbech-Wulff. 2012. Structure of
BALTCOST Drainage Basin scale abatement cost minimisation
model for nutrient reductions in Baltic Sea regions Deliverable
8.1. RECOCA. Retrieved December 8, 2013, from http://nest.su.
se/recoca/deliverable_8.1.pdf.
HELCOM. 2007. Baltic Sea Action Plan. HELCOM Ministerial
Meeting, Krakow, Poland, 15 Nov 2007, 101 pp. Retrieved
March 26, 2013, from http://www.helcom.fi/stc/files/BSAP/
BSAP_Final.pdf.
HELCOM. 2012. The Fifth Baltic Sea Pollution Load Compilation
(PLC-5)—An executive summary. Baltic Sea Environment
Proceedings No. 128A. Helsinki Commission. Baltic Marine
Environment Protection Commission. Retrieved March 26, 2013,
from http://www.helcom.fi/stc/files/Publications/Proceedings/
BSEP128A.pdf.
Hong, B., D.P. Swaney, C.-M. Morth, E. Smedberg, H.E. Hagg, and
C. Humborg. 2011. NANI/NAPI Calculator Toolbox version 2.0
documentation: Net Anthropogenic Nutrient Inputs in Baltic Sea
catchments. BNI Technical Report Series, Technical Report 3,
ISBN: 978-91-86655-02-0. Retrieved February 11, 2013, from
http://www.balticnest.org/balticnest/research/publications/
publications/naninapicalculatortoolboxversion20document
ationnetanthropogenicnutrientinputsinbalticseacatchments.
5.2beb0a011325eb5811a8000123394.html.
Hong, B., D.P. Swaney, C.-M. Morth, E. Smedberg, H.E. Hagg, C.
Humborg, R.W. Howarth, and F. Bouraoui. 2012. Evaluating
regional variation of net anthropogenic nitrogen and phosphorus
inputs (NANI/NAPI), major drivers, nutrient retention pattern
and management implications in the multinational areas of Baltic
Sea basin. Ecological Modelling 227: 117–135.
Howarth, R.W., G. Billen, D.P. Swaney, A. Townsend, N. Jaworski, K.
Lajtha, J.A. Downing, R. Elmgren, et al. 1996. Riverine Inputs of
Nitrogen to the North Atlantic Ocean: Fluxes and Human
Influences. Biogeochemistry 35: 75–139.
Howarth, R.W., D.P. Swaney, G. Billen, J. Garnier, B. Hong, C.
Humborg, P. Johnes, C.-M. Morth, et al. 2012. Nitrogen fluxes
from large watersheds to coastal ecosystems controlled by Net
Anthropogenic Nitrogen Inputs and climate. Frontiers in Ecol-
ogy and the Environment 10: 37–43.
Hagg, H., C. Humborg, C.-M. Morth, M. Rodriguez Medina, and F.
Wulff. 2010. Scenario Analysis on Protein Consumption and
Climate Change Effects on Riverine N Export to the Baltic Sea.
Environmental Science and Technology 44: 2379–2385.
King, D. 2005. Crunch time for water quality trading. Choices 20:
71–75.
Kronvang, B., H.E. Andersen, C.D. Børgesen, T. Dalgaard, S.E.
Larsen, J. Bøgestrand, and G. Blicher-Mathiesen. 2008. Effects
of policy measures implemented in Denmark on nitrogen
pollution of the aquatic environment. Environmental Science &
Policy 11: 144–152.
Maracchi, G., O. Sirotenko, and M. Bindi. 2005. Impacts of present
and future climate variability on agriculture and forestry in the
temperate regions: Europe. Climatic Change 70: 117–135.
Markowska, A., and T. Zylicz. 1999. Costing an international public
good: The case of the Baltic Sea. Ecological Economics 30:
301–316.
NEFCO. 2008. Framework for a Nutrient Quota and Credits’ Trading
System for the Contracting Parties of HELCOM in order to
reduce Eutrophication in the Baltic Sea, March 2008. Retrieved
February 11, 2013, from http://www.nefco.org:8080/files/Nefco_
BS%20NTS_GSN_Final%20Report_20080229.pdf.
Olesen, J.E., and M. Bindi. 2002. Consequences of climate change for
European agricultural productivity, land use and policy. Euro-
pean Journal of Agronomy 16: 239–262.
Ollikainen, M., and J. Honkatukia. 2001. Towards efficient pollution
control in the Baltic Sea. An anatomy of current failure with
suggestions. AMBIO 30: 245–253.
Pyhala, M. 2012. HELCOM Baltic Sea Action Plan: An Ecosystem
Approach to the Management of Human Activities. In Climateimpacts on the Baltic Sea: From science to Policy. School of
Environmental Research, ed. M. Reckermann, K. Brander, B.R.
MacKenzie, and A. Omstedt, 45–69. Helmholtz-Zentrum,
Geesthacht: Springer Earth System Sciences.
Rose, A., B. Stevens, J. Edmonds, and M. Wise. 1998. International
equity and differentiation in global warming policy. Environ-
mental & Resource Economics 12: 25–51.
Schou, J.S., S.T. Neye, T. Lundhede, L. Martinsen, and B. Hasler.
2006. Modelling cost-efficient reductions of nutrient loads to the
Baltic Sea. NERI Technical Report No. 592.
Stalnacke, P., A. Grimvall, C. Libiseller, A. Laznik, and I. Kokorite.
2003. Trends in nutrient concentrations in Latvian rivers and the
response to the dramatic change in agriculture. Journal of
Hydrology 283: 184–205.
Von Schiller, D., E. Marti, J.L. Riera, M. Ribot, A. Argerich, P.
Fonolla, and F. Sabater. 2008. Inter-annual, annual, and seasonal
variation of P and N retention in a perennial and an intermittent
stream. Ecosystems 11: 670–687.
Wulff, F., O.P. Savchuk, A. Sokolov, C. Humborg, and C.-M. Morth.
2007. Management options and effects on a marine ecosystem:
Assessing the future of the Baltic. AMBIO 36: 243–249.
AUTHOR BIOGRAPHIES
Fredrik Wulff (&) is Professor in Marine Systems Ecology at the
Department of Ecology, Environment, and Plant Sciences and Senior
Advisor at the Baltic Sea Center and Baltic Nest Institute, Stockholm
University, Sweden.
Address: Department of Ecology, Environment and Plant Sciences,
Baltic Nest Institute (BNI), Stockholm University, 106 91 Stockholm,
Sweden.
e-mail: [email protected]
Christoph Humborg is Professor in Coastal Biogeochemistry at the
Department of Applied Environmental Science and Baltic Nest
Institute, Stockholm University, 106 91 Stockholm, Sweden.
Address: Department of Applied Environmental Science and Baltic
Nest Institute, Stockholm University, 106 91 Stockholm, Sweden.
e-mail: [email protected]
Hans Estrup Andersen is Senior Scientist and working with
Catchment Management and Biophysical Modeling at Aarhus Uni-
versity.
Address: Department of Bioscience, Aarhus University, 8600 Silke-
borg, Denmark.
e-mail: [email protected]
Gitte Blicher-Mathiesen is Senior Advisor working with Monitoring
and Catchment Management at Aarhus University.
Address: Department of Bioscience, Aarhus University, 8600 Silke-
borg, Denmark.
e-mail: [email protected]
24 AMBIO 2014, 43:11–25
123� The Author(s) 2013. This article is published with open access at Springerlink.com
www.kva.se/en
Mikołaj Czajkowski is Assistant Professor at the University of
Warsaw.
Address: Warsaw Ecological Economics Center, University of War-
saw, Dluga 44/50, 00-241 Warsaw, Poland.
e-mail: [email protected]
Katarina Elofsson is Associate Professor at the Swedish University
of Agricultural Sciences.
Address: Department of Economics, Swedish University of Agricul-
tural Sciences, 750 07 Uppsala, Sweden.
e-mail: [email protected]
Anders Fonnesbech-Wulff is Scientific Assistant at the Department
of Environmental Science, Aarhus University, 4000 Roskilde, Den-
mark.
Address: Department of Environmental Science, Aarhus University,
4000 Roskilde, Denmark.
e-mail: [email protected]
Berit Hasler is Senior Researcher at the Department of Environ-
mental Science, Aarhus University, 4000 Roskilde, Denmark.
Address: Department of Environmental Science, Aarhus University,
4000 Roskilde, Denmark.
e-mail: [email protected]
Bongghi Hong is Research Associate at the Department of Ecology
and Evolutionary Biology, Cornell University, Ithaca, NY 14853,
USA.
Address: Department of Ecology and Evolutionary Biology, Cornell
University, Ithaca, NY 14853, USA.
e-mail: [email protected]
Viesturs Jansons is Professor and Head of Department of Environ-
mental Engineering and Water Management, Latvia University of
Agriculture, 19 Akademijas Str., Jelgava, LV 3001, Latvia.
Address: Department of Environmental Engineering and Water
Management, Latvia University of Agriculture, 19 Akademijas Str.,
Jelgava 3001, Latvia.
e-mail: [email protected]
Carl-Magnus Morth is Professor in Environmental Geochemistry at
the Department of Geological Sciences, Stockholm University, 106
91 Stockholm, Sweden.
Address: Department of Geological Sciences, Stockholm University,
106 91 Stockholm, Sweden.
e-mail: [email protected]
James C. R. Smart is Senior Lecturer at Griffith School of Envi-
ronment, Griffith University, South Brisbane, Queensland 4111,
Australia.
Address: Griffith School of Environment, Griffith University, South
Brisbane, QLD 4111, Australia.
e-mail: [email protected]
Erik Smedberg Ph.D., is Research Scientist at the Baltic Nest
Institute, Stockholm University, 106 91 Stockholm, Sweden.
Address: Baltic Nest Institute, Stockholm University, 106 91 Stock-
holm, Sweden.
e-mail: [email protected]
Per Stalnacke Ph.D., is Head of Department of Water Quality and
Hydrology at the Norwegian Institute for Agricultural and Environ-
mental Research (Bioforsk), 1432 As, Norway.
Address: Department of Water Quality and Hydrology, Norwegian
Institute for Agricultural and Environmental Research (Bioforsk),
1432 As, Norway.
e-mail: [email protected]
Dennis P. Swaney is a Research Scientist, currently working on
biogeochemical processes and dynamics of watersheds and estuaries,
at the Department of Ecology and Evolutionary Biology, Cornell
University, Ithaca, NY 14853, USA.
Address: Department of Ecology and Evolutionary Biology, Cornell
University, Ithaca, NY 14853, USA.
e-mail: [email protected]
Hans Thodsen is Scientist and working with GIS and Biophysical
Modeling.
Address: Institute of Bioscience, Aarhus University, 8600 Silkeborg,
Denmark.
e-mail: [email protected]
Adam Was Ph.D., is Assistant Professor at Warsaw University of
Life Sciences, Faculty of Economic Sciences, Dluga 44/50, 00-241
Warsaw, Poland.
Address: Faculty of Economic Sciences, Warsaw University of Life
Sciences, Dluga 44/50, 00-241 Warsaw, Poland.
e-mail: [email protected]
Tomasz _Zylicz is Professor of economics at the University of War-
saw, Faculty of Economic Sciences, Dluga 44/50, 00-241 Warsaw,
Poland.
Address: Faculty of Economic Sciences, University of Warsaw,
Dluga 44/50, 00-241 Warsaw, Poland.
e-mail: [email protected]
AMBIO 2014, 43:11–25 25
� The Author(s) 2013. This article is published with open access at Springerlink.com
www.kva.se/en 123