Embed Size (px)
Citation preview
NUREG/CR-6890, Vol. 2 INL/EXT-05-00501, Vol. 2
Reevaluation of StationBlackout Risk atNuclear Power Plants
Analysis of Station Blackout Risk
Idaho National Laboratory
U.S. Nuclear Regulatory CommissionOffice of Nuclear Regulatory ResearchWashington, DC 20555-0001
NUREG/CR-6890, Vol. 2 INL/EXT-05-00501, Vol. 2
Reevaluation of StationBlackout Risk atNuclear Power Plants
Analysis of Station Blackout RiskManuscript Completed: November 2005Published: December 2005
Prepared byS.A. Eide, C.D. Gentillon, T.E. Wierman, INLD.M. Rasmuson, NRC
Idaho National LaboratoryRisk, Reliability, and NRC Programs Department Idaho Falls, ID 83415
Anne-Marie Grady, NRC Project Manager
Prepared forDivision of Risk Analysis and Applications Office of Nuclear Regulatory ResearchU.S. Nuclear Regulatory CommissionWashington, DC 20555-0001NRC Job Code Y6546
iii
ABSTRACT
This report is an update of previous reports analyzing loss of offsite power (LOOP) events and the associated station blackout (SBO) core damage risk at U.S. commercial nuclear power plants. LOOP data for 1986–2004 were collected and analyzed. Frequency and duration estimates for critical and shutdown operations were generated for four categories of LOOPs: plant centered, switchyard centered, grid related, and weather related. Overall, LOOP frequencies during critical operation have decreased significantly in recent years, while LOOP durations have increased. Various additional topics of interest are also addressed, including comparisons with results from other studies, seasonal impacts on LOOP frequencies, and consequential LOOPs. Finally, additional engineering analyses of the LOOP data were performed. To obtain SBO results, updated LOOP frequencies and offsite power nonrecovery curves were input into standardized plant analysis risk (SPAR) models covering the 103 operating commercial nuclear power plants. Core damage frequency results indicating contributions from SBO and other LOOP-initiated scenarios are presented for each of the 103 plants, along with plant class and industry averages. In addition, a comprehensive review of emergency diesel generator performance was performed to obtain current estimates for the SPAR models. Overall, SPAR results indicate that core damage frequencies for LOOP and SBO are lower than previous estimates. Improvements in emergency diesel generator performance contribute to this risk reduction.

Abstract
iv
v
FOREWORD
The availability of alternating current (ac) electrical power is essential for the safe operation and accident recovery of commercial nuclear power plants (NPPs). Offsite power sources normally supply this essential power from the electrical grid to which the plant is connected. If the plant loses offsite power, highly reliable emergency diesel generators provide onsite ac electrical power. A total loss of ac power at an NPP as a result of complete failure of both offsite and onsite ac power sources, which rarely occurs, is referred to as a “station blackout” (SBO).
Unavailability of power can have a significant adverse impact on a plant’s ability to achieve and maintain safe-shutdown conditions. In fact, risk analyses performed for NPPs indicate that the loss of all ac power can be a significant contributor to the risk associated with plant operation, contributing more than 70 percent of the overall risk at some plants. Therefore, a loss of offsite power (LOOP) and its subsequent restoration are important inputs to plant risk models, and these inputs must reflect current industry performance in order for plant risk models to accurately estimate the risk associated with LOOP-initiated scenarios.
One extremely important subset of LOOP-initiated scenarios involves SBO situations, in which the affected plant must achieve safe shutdown by relying on components that do not require ac power, such as turbine- or diesel-driven pumps. Thus, the reliability of such components, direct current (dc) battery depletion times, and characteristics of offsite power restoration are important contributors to SBO risk.
Based on concerns about SBO risk and associated reliability of emergency diesel generators, the U.S. Nuclear Regulatory Commission (NRC) established Task Action Plan (TAP) A-44 in 1980. Then, in 1988, the NRC issued the SBO rule and the associated Regulatory Guide (RG) 1.155, entitled “Station Blackout.” The SBO rule requires that NPPs must have the capability to withstand an SBO and maintain core cooling for a specified duration. As a result, NPPs were required to enhance procedures and training for restoring both offsite and onsite ac power sources. Also, in order to meet the requirements of the SBO rule, some licensees chose to make NPP modifications, such as adding additional emergency ac power sources. The NRC and its licensees also increased their emphasis on establishing and maintaining high reliability of onsite emergency power sources.
On August 14, 2003, a widespread loss of the Nation’s electrical power grid (blackout) resulted in LOOPs at nine U.S. commercial NPPs. As a result, the NRC initiated a comprehensive program to review grid stability and offsite power issues as they relate to NPPs. That program included updating and reevaluating LOOP frequencies and durations, as well as the associated SBO risk, to provide risk insights to guide agency actions. This report, published in three volumes, presents the results of those evaluations.
Volume 1 constitutes an update of two reports that the NRC previously published to document analyses of LOOP events at U.S. commercial NPPs. The first report, NUREG-1032, “Evaluation of Station Blackout Accidents at Nuclear Power Plants,” covered events that occurred in 1968–1985 and incorporated many of the actions performed as part of TAP A-44. The second, NUREG/CR-5496, “Evaluation of Loss of Offsite Power Events at Nuclear Power Plants: 1980–1996,” covered those that occurred in 1980–1996. This update was necessary, in part, because of a change in electrical power grid regulations beginning around 1997 and the associated concern about the impact that deregulation might have on LOOP frequencies and/or durations and, therefore, on nuclear plant safety.
The analyses documented in Volume 1 provide frequency estimates for NPPs at power and shutdown operations under four categories: plant-centered, switchyard-centered, grid-related, and weather-related LOOPs. For power operation, grid-related LOOPs contribute 52 percent to the total frequency of 0.036 per reactor critical year (rcry), while switchyard-centered LOOPs contribute
Foreword
vi
29 percent, weather-related LOOPs contribute 13 percent, and plant-centered LOOPs contribute 6 percent. By contrast, for shutdown operation, switchyard-centered LOOPs contribute 51 percent to the total frequency of 0.20 per reactor shutdown year, while plant-centered LOOPs contribute 26 percent.
Overall, LOOP frequencies during power operation decreased significantly over the 37 years from 1968 through 2004. The overall trend shows a statistically significant decrease through 1996, and then stabilized from 1997 through 2002. This decrease in the frequency of LOOP events is largely attributable to a decrease in the number of plant-centered and switchyard-centered events beginning in the mid-1990s. In fact, only one plant-centered event occurred during the period from 1997 through 2004. Nonetheless, the number of LOOP events in 2003 and 2004 was much higher than in previous years. Specifically, 12 LOOP events occurred in 2003, and 5 occurred in 2004.
The analyses documented in Volume 1 also indicate that, on average, LOOP events lasted longer in 1997–2004 than in 1986–1996. However, the LOOP duration data for 1986–1996 exhibited a statistically significant increasing trend over time. By contrast, no statistically significant trend exists for 1997–2004.
Volume 2 presents the current core damage risk associated with SBO scenarios at all 103 operating U.S. commercial NPPs. The results indicate an industry average SBO core damage frequency (point estimate) of about 3 × 10⁻⁶ rcry, which Volume 2 compares with historical estimates that show a decreasing trend from a high of approximately 2 × 10⁻⁵/rcry during the period from 1980 through the present. This historical decrease in SBO core damage frequency is the result of many factors, including plant modifications in response to the SBO rule, as well as improved plant risk modeling and component performance.
Volume 2 also documents several sensitivity studies, showing that SBO core damage frequency is sensitive to emergency diesel generator performance, as expected. Degraded diesel performance and/or large increases in diesel unavailability can significantly increase SBO risk. In addition, SBO risk is significantly higher during the “summer” period (May–September), compared with the annual average result, because the LOOP frequency is significantly higher at that time, as discussed in Volume 1.
Using data from 1997 through 2004, the NRC’s SBO reevaluation reveals that SBO risk was low when evaluated on an average annual basis. However, when we focus on grid-related LOOP events, the SBO risk has increased. Our current results show that the grid contributes 53 percent to the SBO core damage frequency. Severe and extreme weather events, which are generally related to grid events, contribute another 28 percent. Therefore, the increasing number of grid-related LOOP events in 2003 and 2004 is a cause for concern. Additionally, if we consider only data from the “summer” period, the SBO risk increases by approximately a factor of two.
Volume 3 lists review comments received on draft versions of Volumes 1 and 2. This final report benefited greatly from the resolution of those comments.
Overall, this study succeeded in updating the LOOP frequencies and nonrecovery probabilities, as well as evaluating the risk of SBO core damage frequency for U.S. commercial NPPs. The NRC staff has already begun to apply these results and insights, and they will continue to guide agency actions related to grid stability and offsite power issues at the Nation’s NPPs.
vii
CONTENTS
ABSTRACT.................................................................................................................................................iii
FOREWORD ................................................................................................................................................ v
EXECUTIVE SUMMARY .........................................................................................................................xi
ACKNOWLEDGMENTS ........................................................................................................................xvii
ACRONYMS.............................................................................................................................................xix
1. INTRODUCTION ................................................................................................................................ 1
2. SPAR MODELS ................................................................................................................................... 3 2.1 SPAR Enhancements................................................................................................................. 3 2.2 SPAR Modeling of LOOP and SBO ......................................................................................... 5
3. LOOP FREQUENCY AND DURATION............................................................................................ 9
4. EPS MODELING AND PERFORMANCE ....................................................................................... 17 4.1 EPS Designs and SPAR Modeling .......................................................................................... 17 4.2 EDG and Other Emergency Power Source Performance ........................................................ 17 4.3 EPS Total UR Results ............................................................................................................. 27
5. SBO COPING FEATURES................................................................................................................ 29
6. BASELINE SPAR CDF RESULTS FOR SBO.................................................................................. 33
7. SENSITIVITY ANALYSIS RESULTS ............................................................................................. 41
8. SUMMARY AND CONCLUSIONS ................................................................................................. 47
9. REFERENCES ................................................................................................................................... 49
10. GLOSSARY ....................................................................................................................................... 51
APPENDIXES
Appendix A—Use of Emergency Diesel Generator Unplanned Demand History (1997–2003) for Data Validation...............................................................................................................................A-1
Appendix B—Plant-Specific Emergency Power System Unreliability Results .......................................B-1
Appendix C—Plant-Specific Station Blackout Results Using Industry Data...........................................C-1
Appendix D—Baseline and Sensitivity Case Input Parameters ...............................................................D-1
Appendix E—Plant-Specific Station Blackout Results Using Plant-Specific Loss of Offsite Power Frequencies..........................................................................................................................E-1
Contents
viii
FIGURES
ES-1. LOOP frequency historical trend. ...................................................................................................xii
ES-2. LOOP duration historical trends. ...................................................................................................xiii
ES-3. EDG fail to start and total unreliability historical trend.................................................................xiii
ES-4. Turbine-driven pump fail-to-start and total unreliability historical trend. ..................................... xiv
ES-5. SBO core damage frequency historical trend.................................................................................. xv
2-1. Representative LOOP event tree for Westinghouse PWRs. ............................................................. 6
2-2. Representative SBO event tree for Westinghouse PWRs. ................................................................ 7
3-1. Overall industry LOOP frequency trend with time........................................................................... 9
3-2. Summary of probability of exceedance versus duration curves...................................................... 14
3-3. Trend plot of LOOP duration for 1986–1996 and 1997–2004........................................................ 15
3-4. Frequency of exceedance versus duration for critical operation..................................................... 15
3-5. Comparison of frequency of exceedance versus duration for critical operation............................. 16
4-1. EDG FTS and total UR trend with time.......................................................................................... 26
4-2. EPS total UR point estimate range by class and industry. .............................................................. 28
4-3. EPS total UR distributions by class and industry............................................................................ 28
5-1. TDP FTS and total UR trend with time. ......................................................................................... 29
5-2. HPCS MDP/EDG FTS and total UR trend with time. .................................................................... 30
5-3. AFW DDP FTS and total UR trend with time. ............................................................................... 30
6-1. SBO CDF point estimate range by class, type, and industry. ......................................................... 33
6-2. SBO CDF distributions by class, type, and industry....................................................................... 36
6-3. Decomposition of overall SBO CDF into LOOP category contributions. ...................................... 38
6-4. Summary of historical estimates of SBO CDF. .............................................................................. 38
7-1. SBO CDF point estimate ranges for EDG sensitivity cases. .......................................................... 43
7-2. SBO CDF point estimate ranges for offsite power nonrestoration curve sensitivity cases............. 44
7-3. SBO CDF point estimate ranges for historical inputs sensitivity cases. ......................................... 45
7-4. SBO CDF point estimate ranges for seasonal and plant-specific sensitivity cases......................... 45
Contents
ix
TABLES 3-1. Plant-level LOOP frequencies. ........................................................................................................... 9
3-2. Plant-level LOOP frequency distributions. ...................................................................................... 12
3-3. Probability of exceedance versus duration curve fits and summary statistics. ................................. 13
4-1. EPS configurations at U.S. commercial nuclear power plants. ........................................................ 18
4-2. SPAR emergency power source failure parameters and supporting data. ........................................ 24
4-3. Emergency power source CCF parameters. ..................................................................................... 27
5-1. Probability of exceedance for EDG repair times. ............................................................................. 31
6-1. SPAR CDF point estimates by class, type, and industry. ................................................................. 34
6-2. SPAR SBO CDF distributions by class, type, and industry. ............................................................ 35
6-3. Baseline SBO CDF contributions by LOOP category...................................................................... 37
7-1. Summary of sensitivity analysis results............................................................................................ 42

Contents
x
xi
EXECUTIVE SUMMARY
This report, Reevaluation of Station Blackout Risk at Nuclear Power Plants, contains three volumes. Volume 1 addresses the reevaluation of loss of offsite power (LOOP) events over 1986–2004 and efforts to generate updated LOOP frequencies and associated offsite power recovery curves. Volume 2 covers the associated station blackout (SBO) core damage risk for the 103 operating commercial nuclear power plants. Finally, Volume 3 lists the comments received on the draft volumes and their resolution. The executive summary presented below covers the SBO-related work. Volume 1 contains the executive summary for the LOOP work.
The availability of alternating current (ac) power is essential for safe operations and accident recovery at commercial nuclear power plants. This ac power is normally supplied by offsite power sources via the electrical grid but can be supplied by onsite sources such as emergency diesel generators (EDGs). A subset of LOOP scenarios involves the total loss of ac power as a result of complete failure of both offsite and onsite ac power sources. This is termed station blackout (SBO). In SBO scenarios, safe shutdown relies on components that do not require ac power, such as turbine-driven pumps or diesel-driven pumps. The reliability of such components, along with direct current battery depletion times and the characteristics of offsite power restoration, are important contributors to SBO risk. Historically, risk models have indicated that SBO is an important contributor to overall plant risk, contributing as much as 70 percent or more. Therefore, LOOP, restoration of offsite power, and reliability of onsite power sources are important inputs to plant probabilistic risk assessments (PRAs).
Based on concerns about SBO risk and associated emergency diesel generator reliability, the U.S. Nuclear Regulatory Commission (NRC) established Task Action Plan (TAP) A-44 in 1980. The NRC report NUREG-1032, Evaluation of Station Blackout Accidents at Nuclear Power Plants, issued in 1988, integrated many of the efforts performed as part of TAP A-44. In 1988 NRC also issued the SBO rule, 10 CFR 50.63, and the accompanying regulatory guide, RG 1.155. That rule required plants to be able to withstand an SBO for a specified duration and maintain core cooling during that duration. As a result of the SBO rule, plants were required to enhance procedures and training for restoring offsite and onsite ac power sources. In addition, to meet the rule’s requirements, some plants chose to make modifications such as adding additional emergency ac power sources. Emphasis was also placed on establishing and maintaining high reliability of the emergency power sources.
Finally, a widespread grid-related LOOP occurred on August 14, 2003. That event resulted in LOOPs at nine U.S. commercial nuclear power plants. As a result of that event, the NRC initiated a comprehensive program that included updating and reevaluating LOOP frequencies and durations as well as SBO risk. This volume is part of that overall program and focuses on SBO risk.
This study evaluated the current core damage risk from SBO scenarios at U.S. commercial nuclear power plants. All 103 operating commercial nuclear power plants were included in the analysis. Risk was evaluated only for internal events during critical operation; risk from shutdown operation was not addressed. In addition, external events such as seismic, fire, and flood were not addressed. (However, all historical causes of LOOP events were included in the analysis, including events external to the plant boundary.) The standardized plant analysis risk (SPAR) models developed by the NRC for the 103 operating plants were used to evaluate core damage risk. An extensive set of enhancements was added to the existing SPAR models to provide up-to-date modeling of LOOP and SBO risk. In addition, emergency diesel generator performance was reevaluated based on recent data to establish current reliability levels.
SBO risk in terms of core damage can be viewed roughly as the product of the LOOP frequency, the failure probability of the onsite emergency power system (EPS), and the composite failure probability of SBO coping features at a given plant. Each of these three contributors to SBO risk is discussed below.
Executive Summary
xii
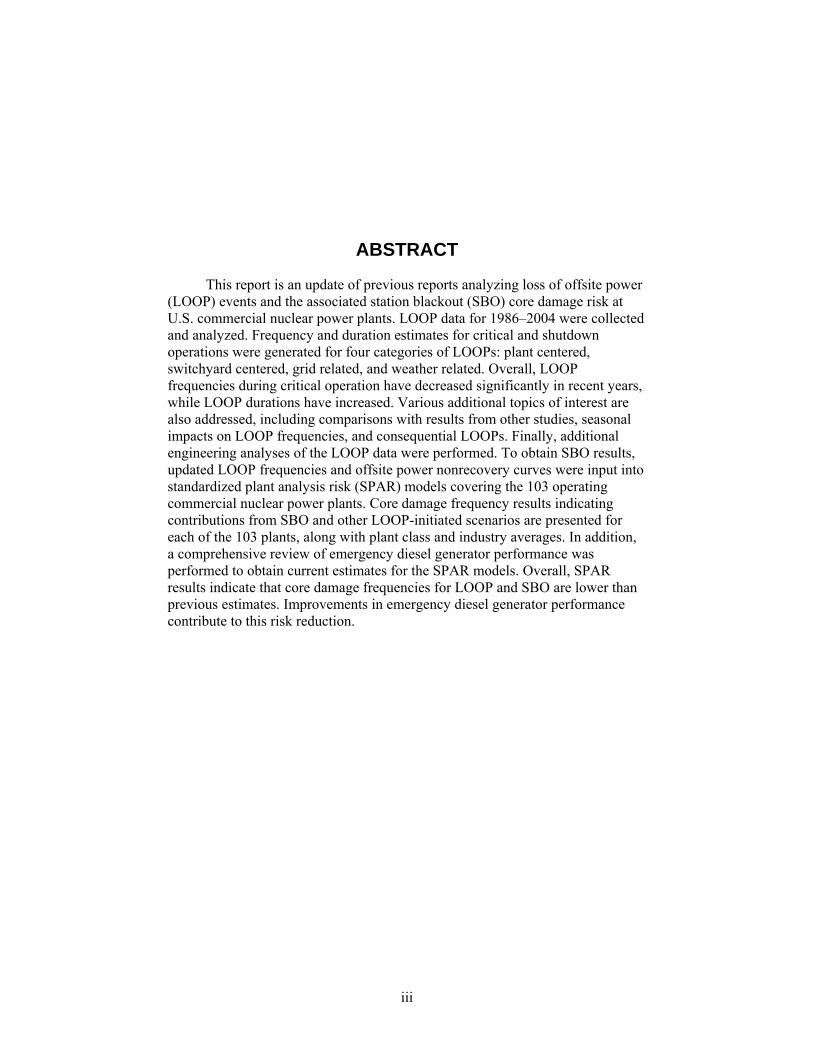
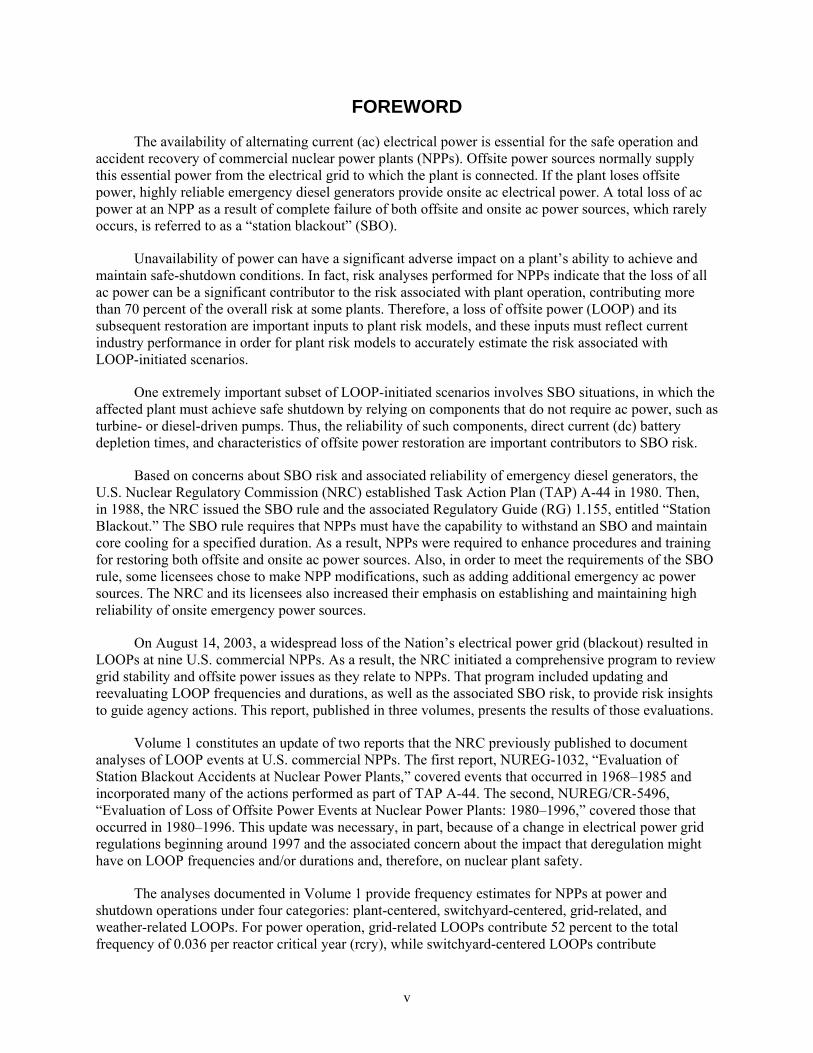
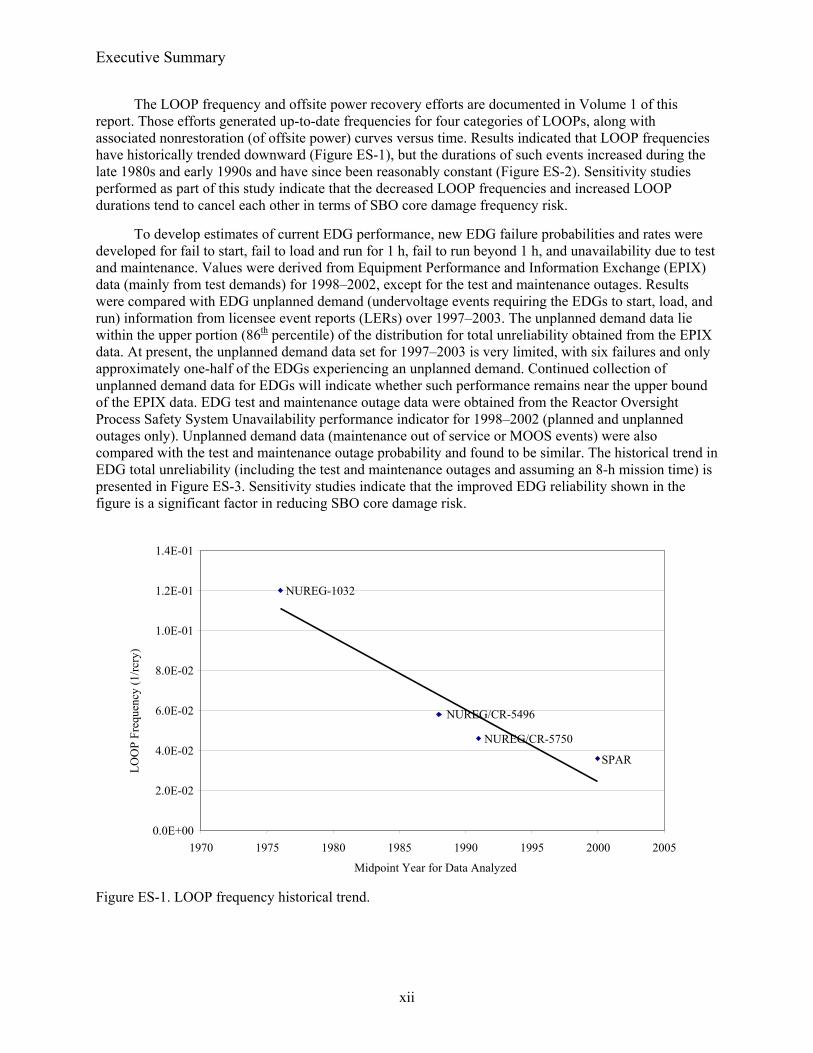
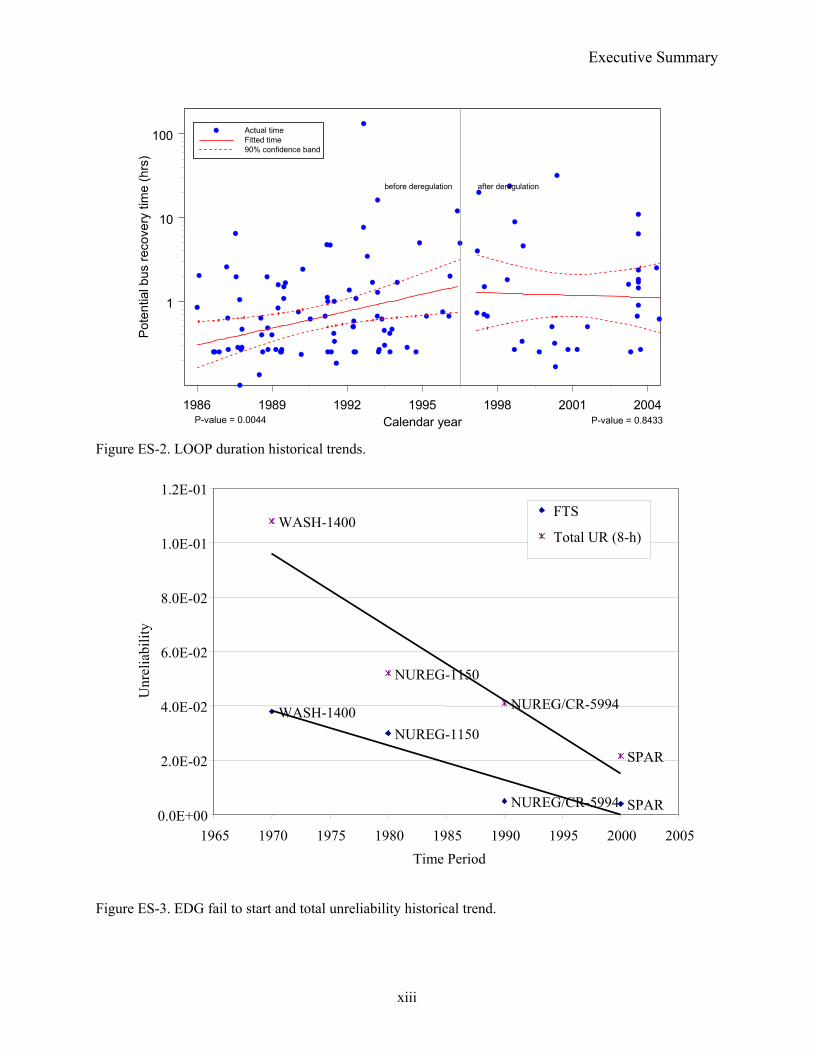
The LOOP frequency and offsite power recovery efforts are documented in Volume 1 of this report. Those efforts generated up-to-date frequencies for four categories of LOOPs, along with associated nonrestoration (of offsite power) curves versus time. Results indicated that LOOP frequencies have historically trended downward (Figure ES-1), but the durations of such events increased during the late 1980s and early 1990s and have since been reasonably constant (Figure ES-2). Sensitivity studies performed as part of this study indicate that the decreased LOOP frequencies and increased LOOP durations tend to cancel each other in terms of SBO core damage frequency risk.
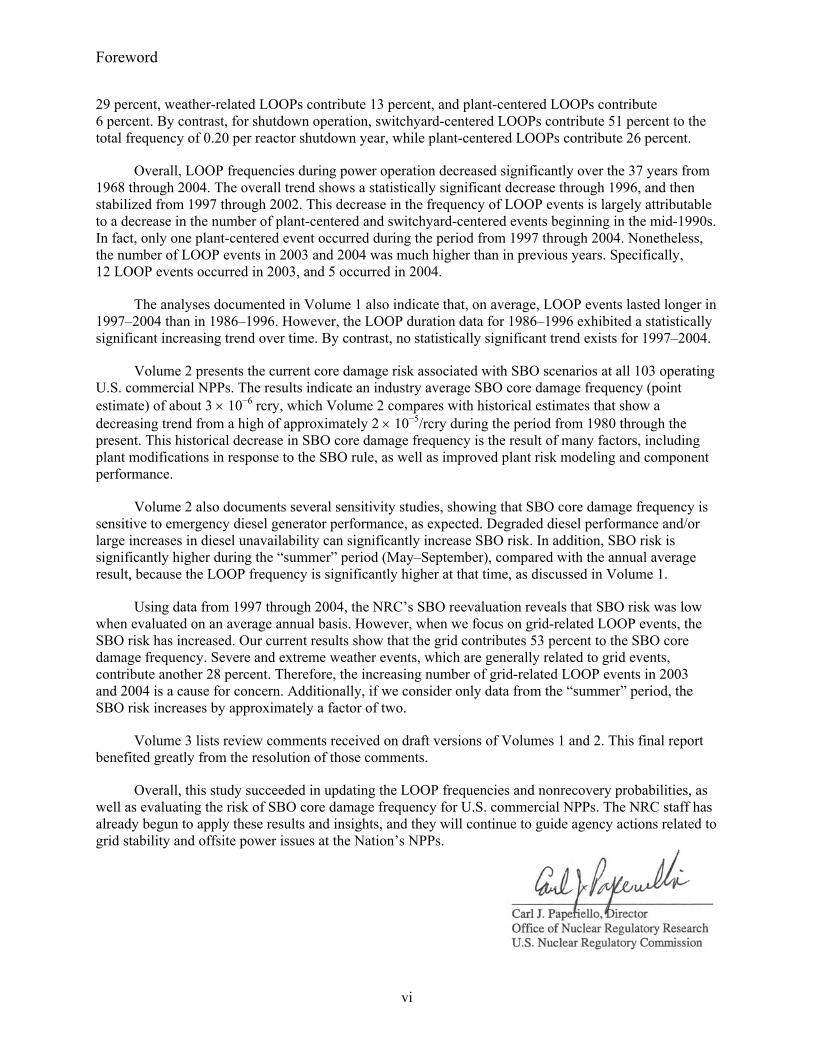
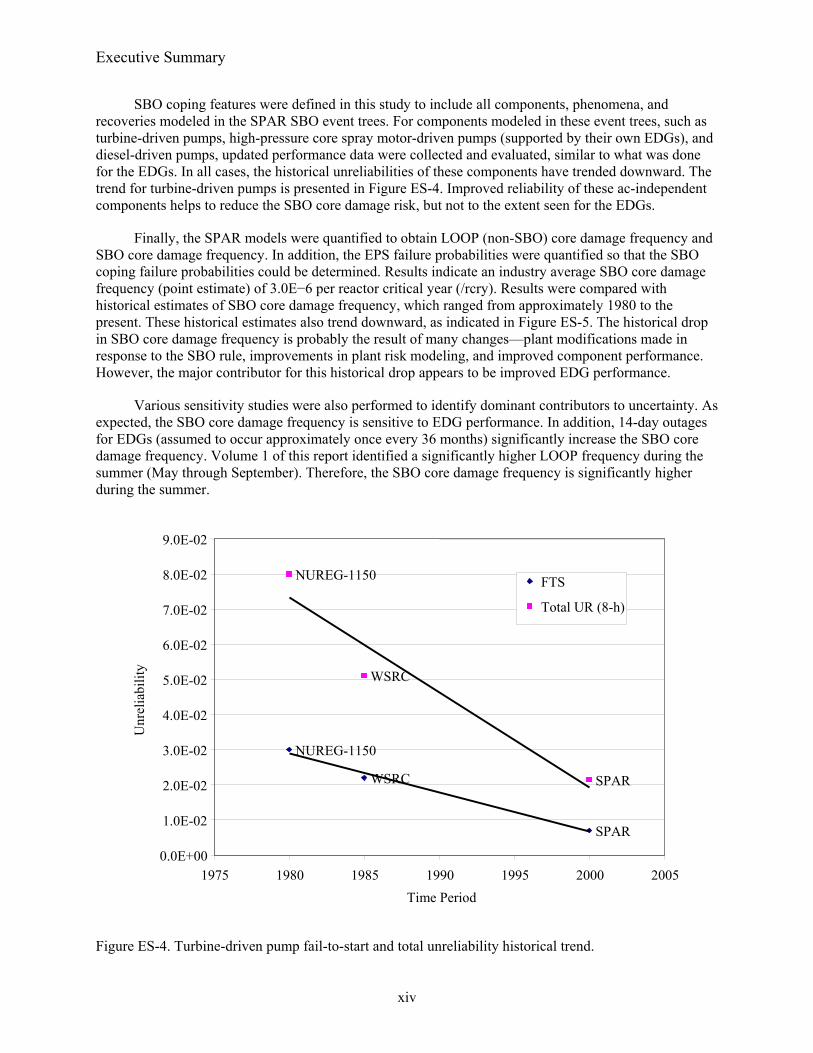
To develop estimates of current EDG performance, new EDG failure probabilities and rates were developed for fail to start, fail to load and run for 1 h, fail to run beyond 1 h, and unavailability due to test and maintenance. Values were derived from Equipment Performance and Information Exchange (EPIX) data (mainly from test demands) for 1998–2002, except for the test and maintenance outages. Results were compared with EDG unplanned demand (undervoltage events requiring the EDGs to start, load, and run) information from licensee event reports (LERs) over 1997–2003. The unplanned demand data lie within the upper portion (86th percentile) of the distribution for total unreliability obtained from the EPIX data. At present, the unplanned demand data set for 1997–2003 is very limited, with six failures and only approximately one-half of the EDGs experiencing an unplanned demand. Continued collection of unplanned demand data for EDGs will indicate whether such performance remains near the upper bound of the EPIX data. EDG test and maintenance outage data were obtained from the Reactor Oversight Process Safety System Unavailability performance indicator for 1998–2002 (planned and unplanned outages only). Unplanned demand data (maintenance out of service or MOOS events) were also compared with the test and maintenance outage probability and found to be similar. The historical trend in EDG total unreliability (including the test and maintenance outages and assuming an 8-h mission time) is presented in Figure ES-3. Sensitivity studies indicate that the improved EDG reliability shown in the figure is a significant factor in reducing SBO core damage risk.
Figure ES-1. LOOP frequency historical trend.
SPAR NUREG/CR-5750
NUREG/CR-5496
NUREG-1032
0.0E+00
2.0E-02
4.0E-02
6.0E-02
8.0E-02
1.0E-01
1.2E-01
1.4E-01
1970 1975 1980 1985 1990 1995 2000 2005
Midpoint Year for Data Analyzed
LOO
P Fr
eque
ncy
(1/rc
ry)
Executive Summary
xiii
1986 1989 1992 1995 1998 2001 2004Calendar year
1
10
100Po
tent
ial b
us re
cove
ry ti
me
(hrs
)Actual timeFitted time90% confidence band
P-value = 0.0044 P-value = 0.8433
before deregulation after deregulation
Figure ES-2. LOOP duration historical trends.
Figure ES-3. EDG fail to start and total unreliability historical trend.
SPAR NUREG/CR-5994
NUREG-1150WASH-1400
SPAR
NUREG/CR-5994
NUREG-1150
WASH-1400
0.0E+00
2.0E-02
4.0E-02
6.0E-02
8.0E-02
1.0E-01
1.2E-01
1965 1970 1975 1980 1985 1990 1995 2000 2005Time Period
Unr
elia
bilit
y
FTS
Total UR (8-h)
Executive Summary
xiv
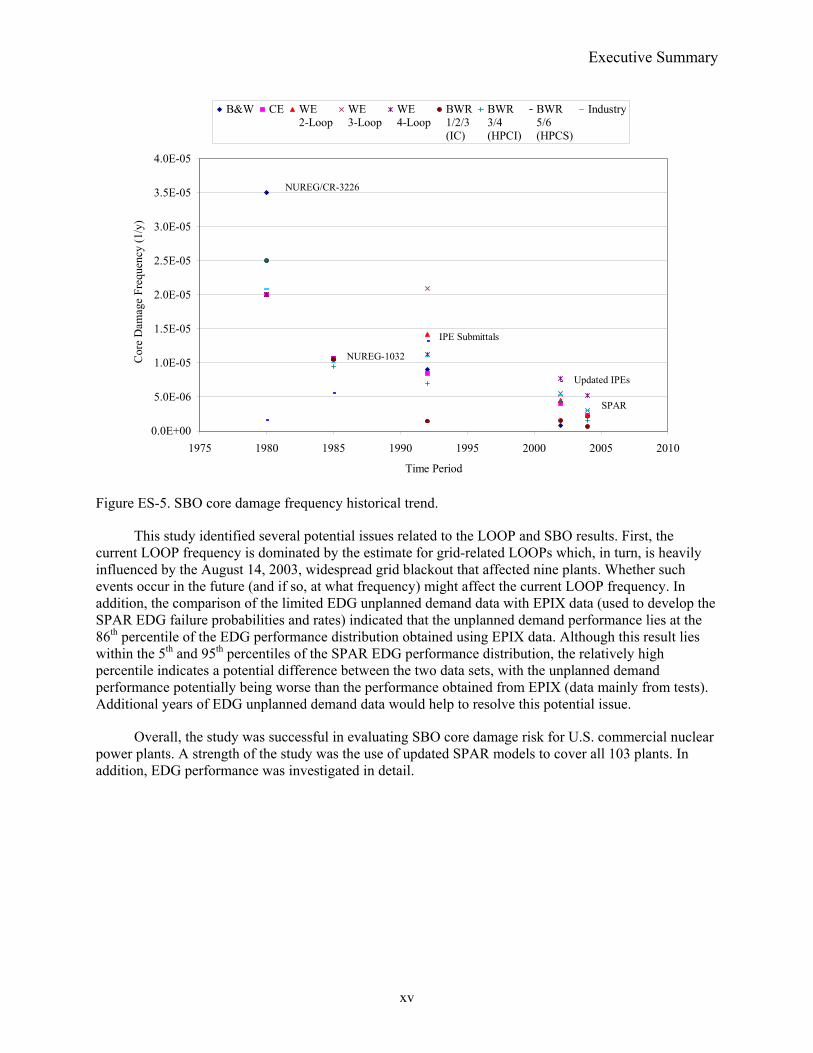
SBO coping features were defined in this study to include all components, phenomena, and recoveries modeled in the SPAR SBO event trees. For components modeled in these event trees, such as turbine-driven pumps, high-pressure core spray motor-driven pumps (supported by their own EDGs), and diesel-driven pumps, updated performance data were collected and evaluated, similar to what was done for the EDGs. In all cases, the historical unreliabilities of these components have trended downward. The trend for turbine-driven pumps is presented in Figure ES-4. Improved reliability of these ac-independent components helps to reduce the SBO core damage risk, but not to the extent seen for the EDGs.
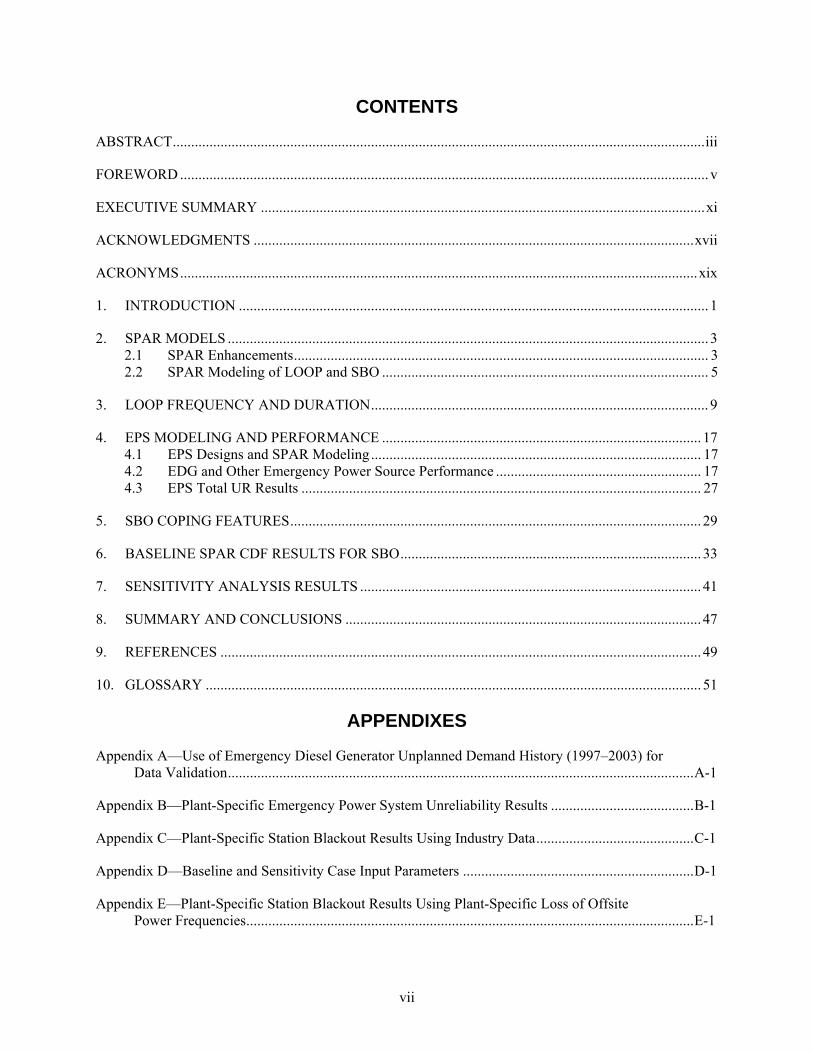
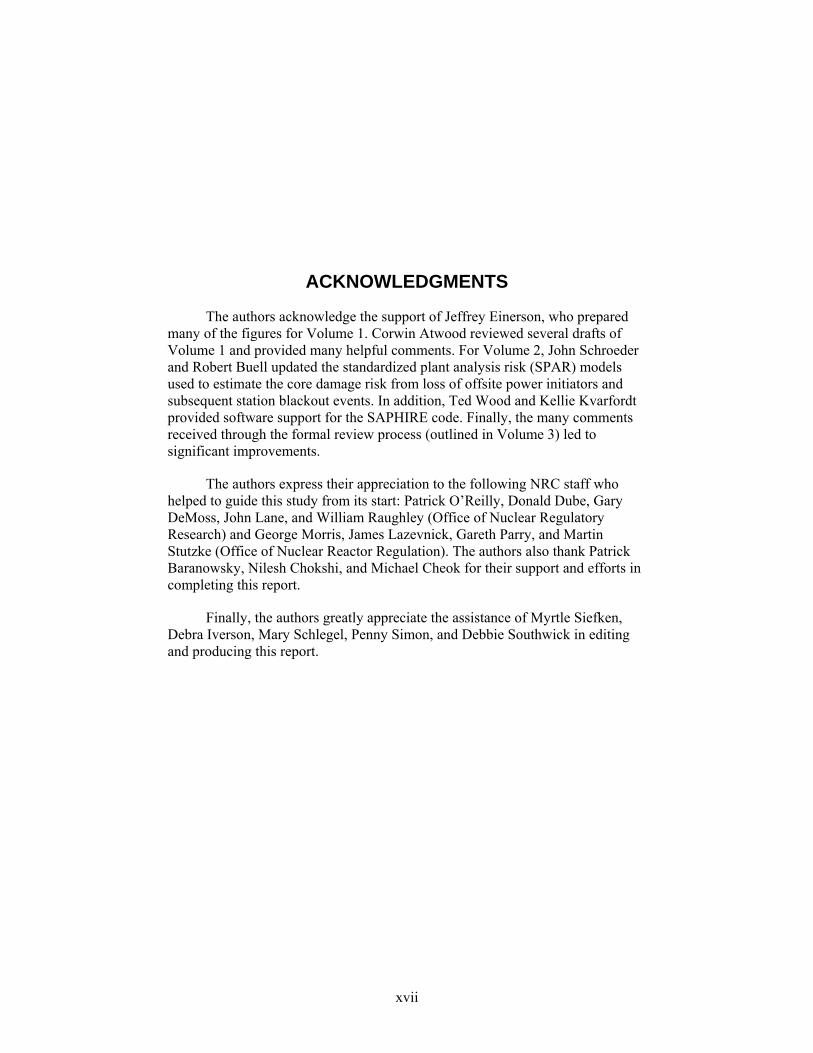
Finally, the SPAR models were quantified to obtain LOOP (non-SBO) core damage frequency and SBO core damage frequency. In addition, the EPS failure probabilities were quantified so that the SBO coping failure probabilities could be determined. Results indicate an industry average SBO core damage frequency (point estimate) of 3.0E−6 per reactor critical year (/rcry). Results were compared with historical estimates of SBO core damage frequency, which ranged from approximately 1980 to the present. These historical estimates also trend downward, as indicated in Figure ES-5. The historical drop in SBO core damage frequency is probably the result of many changes—plant modifications made in response to the SBO rule, improvements in plant risk modeling, and improved component performance. However, the major contributor for this historical drop appears to be improved EDG performance.
Various sensitivity studies were also performed to identify dominant contributors to uncertainty. As expected, the SBO core damage frequency is sensitive to EDG performance. In addition, 14-day outages for EDGs (assumed to occur approximately once every 36 months) significantly increase the SBO core damage frequency. Volume 1 of this report identified a significantly higher LOOP frequency during the summer (May through September). Therefore, the SBO core damage frequency is significantly higher during the summer.
Figure ES-4. Turbine-driven pump fail-to-start and total unreliability historical trend.
SPAR
WSRC
NUREG-1150
SPAR
WSRC
NUREG-1150
0.0E+00
1.0E-02
2.0E-02
3.0E-02
4.0E-02
5.0E-02
6.0E-02
7.0E-02
8.0E-02
9.0E-02
1975 1980 1985 1990 1995 2000 2005Time Period
Unr
elia
bilit
y
FTS
Total UR (8-h)
Executive Summary
xv
0.0E+00
5.0E-06
1.0E-05
1.5E-05
2.0E-05
2.5E-05
3.0E-05
3.5E-05
4.0E-05
1975 1980 1985 1990 1995 2000 2005 2010
Time Period
Cor
e D
amag
e Fr
eque
ncy
(1/y
)
B&W CE WE2-Loop
WE3-Loop
WE4-Loop
BWR1/2/3(IC)
BWR3/4(HPCI)
BWR5/6(HPCS)
Industry
NUREG/CR-3226
NUREG-1032
IPE Submittals
Updated IPEs
SPAR
Figure ES-5. SBO core damage frequency historical trend.
This study identified several potential issues related to the LOOP and SBO results. First, the current LOOP frequency is dominated by the estimate for grid-related LOOPs which, in turn, is heavily influenced by the August 14, 2003, widespread grid blackout that affected nine plants. Whether such events occur in the future (and if so, at what frequency) might affect the current LOOP frequency. In addition, the comparison of the limited EDG unplanned demand data with EPIX data (used to develop the SPAR EDG failure probabilities and rates) indicated that the unplanned demand performance lies at the 86th percentile of the EDG performance distribution obtained using EPIX data. Although this result lies within the 5th and 95th percentiles of the SPAR EDG performance distribution, the relatively high percentile indicates a potential difference between the two data sets, with the unplanned demand performance potentially being worse than the performance obtained from EPIX (data mainly from tests). Additional years of EDG unplanned demand data would help to resolve this potential issue.
Overall, the study was successful in evaluating SBO core damage risk for U.S. commercial nuclear power plants. A strength of the study was the use of updated SPAR models to cover all 103 plants. In addition, EDG performance was investigated in detail.

Executive Summary
xvi
xvii
ACKNOWLEDGMENTS
The authors acknowledge the support of Jeffrey Einerson, who prepared many of the figures for Volume 1. Corwin Atwood reviewed several drafts of Volume 1 and provided many helpful comments. For Volume 2, John Schroeder and Robert Buell updated the standardized plant analysis risk (SPAR) models used to estimate the core damage risk from loss of offsite power initiators and subsequent station blackout events. In addition, Ted Wood and Kellie Kvarfordt provided software support for the SAPHIRE code. Finally, the many comments received through the formal review process (outlined in Volume 3) led to significant improvements.
The authors express their appreciation to the following NRC staff who helped to guide this study from its start: Patrick O’Reilly, Donald Dube, Gary DeMoss, John Lane, and William Raughley (Office of Nuclear Regulatory Research) and George Morris, James Lazevnick, Gareth Parry, and Martin Stutzke (Office of Nuclear Reactor Regulation). The authors also thank Patrick Baranowsky, Nilesh Chokshi, and Michael Cheok for their support and efforts in completing this report.
Finally, the authors greatly appreciate the assistance of Myrtle Siefken, Debra Iverson, Mary Schlegel, Penny Simon, and Debbie Southwick in editing and producing this report.

Acknowledgements
xviii
xix
ACRONYMS
ac alternating current
AFW auxiliary feedwater system
ATWS anticipated transient without scram
BW Babcock & Wilcox
BWR boiling water reactor
CCF common-cause failure
CD core damage
CDF core damage frequency
CE Combustion Engineering
CNID constrained noninformative distribution
DDP diesel-driven pump
EDG emergency diesel generator
EPIX Equipment Performance and Information Exchange
EPS emergency power system
ERF emergency response facility
FTLR fail to load and run (for 1 h)
FTR fail to run (beyond 1 h)
FTS fail to start
GE General Electric
GTG gas turbine generator
HPCI high-pressure coolant injection
HPCS high-pressure core spray
HTG hydro turbine generator
IC isolation condenser system
INL Idaho National Laboratory
INPO Institute for Nuclear Power Operations
IPE Individual Plant Examination
LER licensee event report
LERF large early release fraction
LOCA loss-of-coolant accident
LOOP loss of offsite power
LS load shedding
MDP motor-driven pump
Acronyms
xx
MLE maximum likelihood estimate
MOOS Maintenance out of service
MSPI Mitigating Systems Performance Index
nc no credit
NPP nuclear power plant
PORV power-operated relief valve
PRA probabilistic risk assessment
PWR pressurized water reactor
RADS Reliability and Availability Database System
RCIC reactor core isolation cooling
RCP reactor coolant pump
ROP Reactor Oversight Process
rcry reactor critical year
rcy reactor calendar year
SBO station blackout
SER safety evaluation report
SPAR standardized plant analysis risk
SSF safe shutdown facility
SSU safety system unavailability
TAP task action plan
TDP turbine-driven pump
TM test and maintenance outage
TSC technical support center
UA unavailability
UR unreliability
WE Westinghouse
WSRC Westinghouse Savannah River Company
1
REEVALUATION OF STATION BLACKOUT RISK AT NUCLEAR POWER PLANTS
Analysis of Station Blackout Risk 1. INTRODUCTION
The availability of alternating current (ac) power is essential for safe operations and accident recovery at commercial nuclear power plants. This ac power normally is supplied by offsite power sources via the electrical grid, but it can be supplied by onsite emergency ac power sources if offsite power is lost. Therefore, loss of offsite power (LOOP), reliability of onsite emergency ac power sources, and subsequent restoration of offsite power are important inputs to plant probabilistic risk assessments (PRAs).
Total loss of ac power at a commercial nuclear power plant, i.e. failure of both offsite and onsite ac power sources, is termed station blackout (SBO). (The detailed definitions of LOOP and SBO are presented in the Glossary.) In SBO situations, safe shutdown must be accomplished by components that do not rely on ac power, such as turbine-driven pumps (TDPs) or diesel-driven pumps (DDPs). The reliability of such components, along with direct current (dc) battery depletion times and the characteristics of offsite power restoration, are important contributors to SBO risk. Historically, risk models have indicated that SBO is an important contributor to overall plant risk, contributing up to 70% or more to the overall core damage frequency (CDF).
Based on concerns about SBO risk and associated emergency diesel generator (EDG) reliability, the U.S. Nuclear Regulatory Commission (NRC) established Task Action Plan (TAP) A-44 in 1980 [1]. To support TAP A-44, the report Station Blackout Accident Analyses (Part of NRC Task Action Plan A-44), NUREG/CR-3226 [2] was issued in 1983. That report, one of the first comprehensive looks at SBO risk at U.S. commercial nuclear power plants, estimated SBO CDFs for two classes of pressurized water reactors (PWRs) and three classes of boiling water reactors (BWRs). The range was 1.5E−6 to 3.5E−5 per reactor calendar year (/rcy). No industry average or typical plant estimate was listed in the report, but based on the mix of plant types presently operating, the industry average for SBO risk would be approximately 2E−5/rcy. The NRC report NUREG-1032, Evaluation of Station Blackout Accidents at Nuclear Power Plants [3], issued in 1988, integrated many of the efforts performed as part of TAP A-44. That report comprehensively addressed the entire industry and included a detailed analysis of LOOP frequencies and a survey of EDG unreliability parameters. NUREG-1032 estimated that SBO CDF at plants ranged from 1E−6 to 1E−4/rcy, with a typical plant value of approximately 1E−5/rcy.
NUREG-1032 provided the technical basis for NRC issuing the SBO rule, 10 CFR 50.63 [4], and the accompanying regulatory guide, RG 1.155 [5], in 1988. That rule required plants to be able to withstand an SBO for a specified duration and maintain core cooling during that duration. The plant-specific duration depended upon four factors:
• Redundancy of emergency ac power sources
• Reliability of those sources
• Frequency of LOOP at the plant
• Offsite power restoration characteristics.
Introduction
2
As a result of the SBO rule, plants were required to enhance procedures and training for restoring offsite and onsite ac power sources. In addition, some plants chose to make modifications such as adding additional emergency ac power sources, typically EDGs or gas turbine generators (GTGs). Finally, emphasis was placed on establishing and maintaining high reliability of the EDGs.
Individual plant examination (IPE) submittals by licensees in the early 1990s provided a follow-on picture of industry SBO risk. These plant risk model results were representative of plant configurations around 1990, so some of the studies reflected plant modifications resulting from the SBO rule and some did not. The industry average SBO CDF from these IPE submittals was 1.1E−5/rcy [6], with individual plant results ranging from negligible to 6.5E−5/rcy.
The widespread grid event on August 14, 2003, resulted in LOOPs at nine U.S. commercial nuclear power plants. As a result of that event, the NRC initiated a comprehensive program that included updating and reevaluating LOOP frequencies and durations and SBO risk. This report is part of that overall program and focuses on SBO risk.
This volume evaluates the current core damage risk from SBO scenarios at U.S. commercial nuclear power plants. It also covers non-SBO LOOP scenarios that lead to core damage. All 103 operating commercial nuclear power plants are addressed. Risk is evaluated only for critical operation, not for shutdown operation. External events, such as seismic, fire, or flood, are also excluded. (However, all historical causes of LOOP events were included in the analysis, including events external to the plant boundary.) Risk is defined as CDF. Other risk measures, such as large early release fraction (LERF), are not covered. The standardized plant analysis risk (SPAR) models developed by the NRC for the 103 operating plants were used to evaluate CDF risk. These models presently cover only Level 1 (core damage frequency) internal events. Similar models covering external events and shutdown operation are not yet available, so the scope of this study was limited to CDF risk from LOOPs during critical operation.
The structure of the rest of this volume is as follows. Section 2 describes the SPAR models and enhancements used for this study. Section 3 summarizes the LOOP frequency and duration results from Volume 1 of this report. Characteristics and performance of emergency power systems (EPSs) are described in Section 4. SBO coping characteristics and performance are discussed in Section 5. Baseline SBO (and non-SBO, LOOP) CDF results are summarized in Section 6, and sensitivity results are in Section 7. Finally, the summary and conclusions are presented in Section 8 followed by the references and glossary.
3
2. SPAR MODELS
The NRC maintains a set of CDF risk models covering the 103 nuclear power plants operating in the U.S. These SPAR models started out in the mid-1990s as simplified risk models for use in accident sequence precursor (ASP) analyses. However, the current SPAR models are much more detailed, with expanded support system modeling and a broader range of initiating events.
2.1 SPAR Enhancements
The SPAR models have been enhanced as part of the ongoing SPAR development program and to support this SBO study. These enhancements are in the areas of reactor coolant pump (RCP) seal leakage models, LOOP frequency and duration models, basic event and initiating event updates, and common-cause failure (CCF) updates.
For RCP seal leakage during loss of seal cooling conditions, the SPAR enhancements are listed below:
• For Westinghouse (WE) plants, the SPAR models now use the RCP seal failure and loss-of-coolant accident (LOCA) models outlined in the recent Westinghouse Owners’ Group submittal to NRC, as accepted in the related NRC Safety Evaluation Report (SER) [7]. This new model postulates a range of leakage rates for plants with newer RCP o-ring seals, allowing for more time to recover ac power for many of the SBO accident sequences.
• For Combustion Engineering (CE) plants, the SPAR models use the RCP seal failure and LOCA models outlined in the recent CE Owners Group submittal to NRC [8]. (The related NRC SER has not been completed, but the CE submittal is expected to be accepted with few changes or conditions.) The leakage probabilities for this new model are significantly lower than those previously included in the SPAR models.
• For Babcock & Wilcox plants, there is no recent or pending submittal to NRC. Therefore, the existing SPAR models were used for Babcock & Wilcox plants.
• For General Electric (GE) plants, no changes were made to the SPAR models.
Overall, these changes in the RCP seal leakage models result in lower leakage rates or lower probabilities of high leakage rates, thereby reducing the estimates of SBO risk.
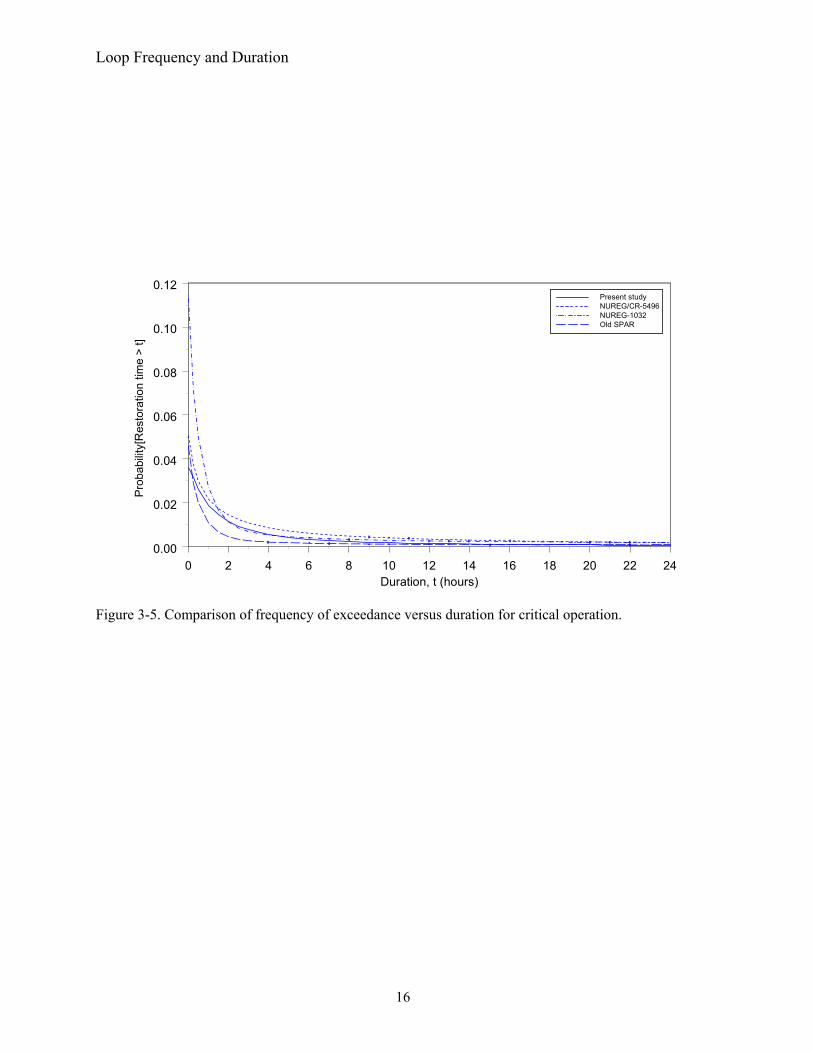
The LOOP frequencies and offsite power nonrestoration curves in the SPAR models were modified to incorporate the updated information presented in Volume 1 of this report. This involved subdividing LOOPs into four categories, each with its own frequency and offsite power nonrestoration curve. The combined effects of LOOP frequency and offsite power nonrestoration curve on SBO risk can be examined by reviewing the frequency of exceedance curves as explained in Volume 1. The updated frequency of exceedance composite curve lies above that previously used in SPAR except for the first half hour, so these updates tend to increase the SPAR SBO risk estimates (these curves are discussed further in Section 3 and shown in Figure 3-5).
The SPAR enhancements also included a comprehensive update of component failure rates, test and maintenance (TM) outage probabilities (also termed unavailability or UA), and initiating event frequencies to reflect industry average performance centered about the year 2000. The component failure rates were obtained from the Equipment Performance and Information Exchange (EPIX) [9] database maintained by the Institute for Nuclear Power Operations (INPO), which was accessed using the NRC-developed Reliability and Availability Database System software [10]. Data for 1998–2002 were
SPAR Models
4
used to develop the failure rates. For train UA, data from the Reactor Oversight Process (ROP) Safety System Unavailability (SSU) database (planned and unplanned outages only) for 1998–2002 were used [11]. Finally, initiating event frequencies were obtained from the initiating events database maintained by the NRC [12]. The baseline periods used to determine the frequencies varied by initiator but all ended in 2002. In general, almost all of the updated component failure rates, UA probabilities, and initiating event frequencies are lower than those previously used in the SPAR models. This reflects general improvements in industry performance from the late 1980s and early 1990s to the present. These enhancements generally reduce the SPAR SBO risk estimates.
Additionally, the CCF modeling in the SPAR models was updated. This effort included regenerating CCF parameters (alpha factors) using the updated CCF database maintained by the NRC [13]. The updated CCF parameters generally are lower than those previously used in SPAR, so again these updates tend to reduce the SPAR SBO risk estimates.
The enhanced SPAR models developed for this study use industry average values for component unreliability, train UA probabilities, and initiating event frequencies. An alternative would be to use plant-specific values obtained by updating the industry average results with plant-specific data from a recent period such as 3, 5, or 7 yr. This plant-specific alternative was not used because plant-to-plant variations are smaller than before and because plants that trend away from the norm generally return to the norm within a few years. Plant-to-plant variation in component performance, train UA, and initiating event frequencies is not as large as it was in the past. This is probably the result of programs such as the Maintenance Rule [14] and ROP [15], and more licensee awareness of typical industry performance. If a plant is deviating significantly from the norm, efforts are expended to bring the plant back into the norm. A limited review of component failure data and initiating event data supports this view. For EDGs and TDPs, plant-specific unreliability estimates were generated using the industry averages as priors and EPIX plant-specific data for 1997–1999 and 2001–2003. The plants were then ranked from worst to best in terms of the resulting component unreliability estimates. Of the ten plants with the highest unreliabilities for 1997–1999, only one was also in the ten with highest unreliabilities for 2001–2003. This was true for both EDGs and TDPs. In addition, a similar analysis was performed for five initiating events: PWR and BWR general transients, PWR and BWR loss of heat sink, and LOOP. Only approximately two (depending on the type of initiating event) of the ten plants with highest initiating event frequencies using 1997–1999 data were also among the ten highest plants using 2001–2003 data. This data review supports the view that plants that trend away from industry norm performance generally move back into the norm within a few years. Therefore, if baseline SPAR models were to use plant-specific data, the SPAR inputs would need to be updated frequently to attempt to reflect these short-term deviations from the norm. It is recognized that in a few cases, plant data may reflect continuing performance that is outside of the industry norm. In such cases, plant-specific analyses may need to account for such deviations. In addition, special analyses may require the use of plant-specific data. However, for the purposes of this study, the industry average inputs are appropriate.
The enhanced SPAR models used to support this study are up to date in essentially all areas related to LOOP and SBO modeling. They employ
• Plant-specific design • Standardized modeling • Standardized, industry average data representative of industry performance in the year 2000 (1998–
2002 data) • Conservative recovery modeling for LOOP and SBO accident sequences (no convolution to address
the potential for failure-to-run events occurring significantly beyond time zero, and limited credit for component operation and recovery following dc battery depletion).
SPAR Models
5
2.2 SPAR Modeling of LOOP and SBO
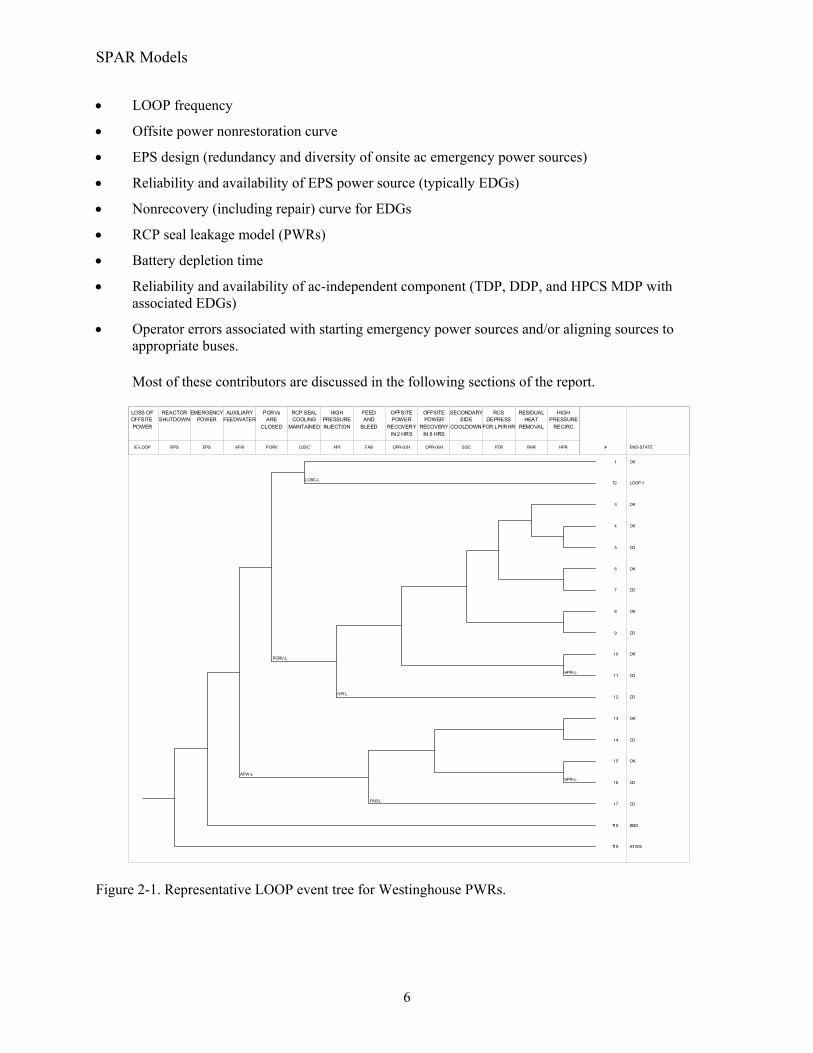
A representative LOOP event tree for WE (PWR) SPAR models is presented in Figure 2-1 [16]. Following the initiating event, the next top event questions whether the control rods drop into the core to shut down the reactor. If not, the sequence transfers to the anticipated transient without scram (ATWS) event tree for further development. The third top event questions whether the onsite ac EPS successfully starts and provides power to essential buses. If the EPS fails, then the plant is in an SBO situation, and the sequence transfers to a separate SBO event tree (Figure 2-2) for further development. The remaining top events in Figure 2-1 question whether auxiliary feedwater (AFW) is successful, whether a power-operated relief valve (PORV) opens and fails to reclose, whether RCP seal cooling is lost, whether feed and bleed is successful, and whether long-term residual heat removal is successful. Depending upon the combinations of system successes and failures, the remaining accident sequences are flagged as “OK,” meaning the plant is successfully shut down without core damage, “CD,” meaning the sequence ends in core damage, or transferring to additional LOOP event trees. Of special note are the two top events questioning whether offsite power is recovered by 2 or 6 h. Nonrecovery probabilities for these events are determined from the nonrestoration curves presented in Volume 1. (If alternative ac power sources not modeled in EPS are available, then the probability of failure of these sources is factored into this nonrecovery probability using an “AND” gate.) All of the sequences ending with “CD” in Figure 2-1 (and its transfers to other event trees, except for the transfer to the SBO event tree) contribute to what is termed the non-SBO, LOOP CDF for the plant.
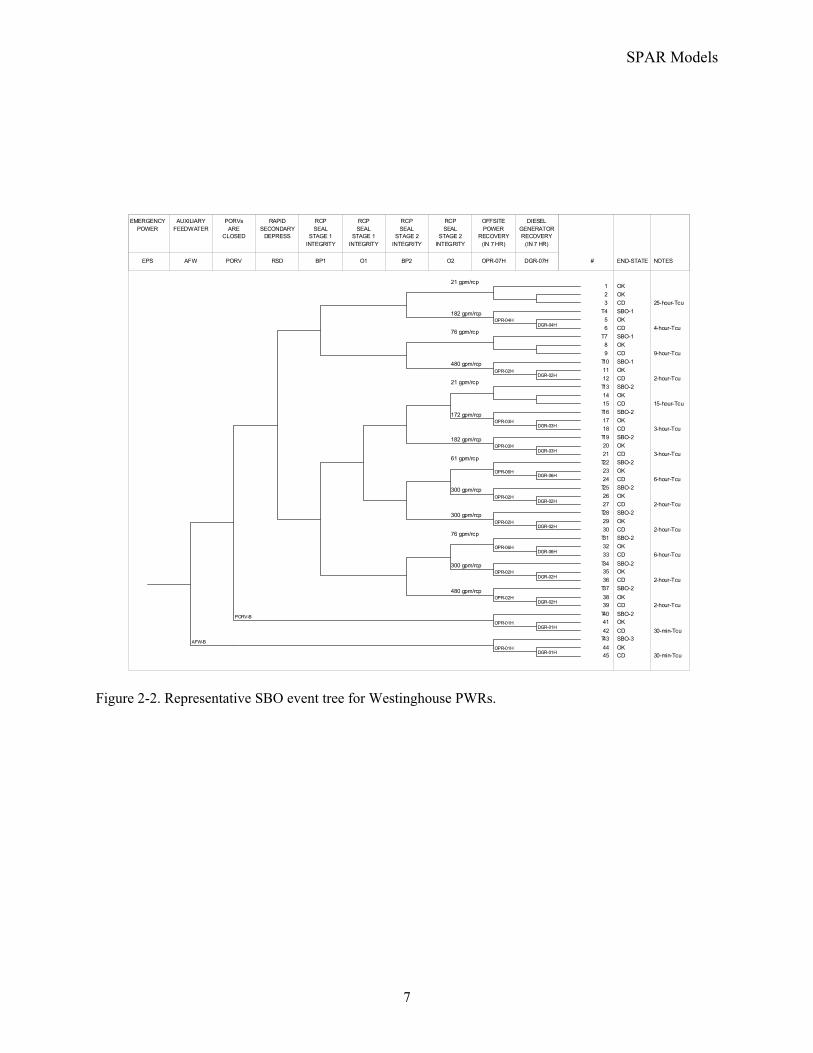
The representative SBO event tree is presented in Figure 2-2. The frequency of entering this event tree is termed the SBO frequency, and is the product of the LOOP frequency and the failure probability of the EPS, as modeled in the EPS fault tree. However, the SBO frequency is not the SBO CDF frequency. Only a fraction of SBO events is predicted to lead to core damage, because the plant coping features modeled in the SBO event tree successfully mitigate most such events. The structure of the SBO event tree is similar to the LOOP event tree in terms of systems and functions questioned. However, feed and bleed is not included (pumps available for the feed function require ac power), but RCP seal leakage is questioned. In addition, during SBO conditions, only the auxiliary AFW TDP (or DDP for some plants) is available for core cooling. In addition, until ac power is recovered no system is available to provide coolant injection if RCP seal leakage occurs. Again, of special note is the top event questioning whether offsite power is recovered by certain times following the LOOP. Depending upon the specific accident sequence, the nonrecovery times are 1, 2, 3, 4, 6, or 7 h. Nonrecovery probabilities for these events are determined from the nonrestoration curves presented in Volume 1. These nonrecovery probabilities also include credit for starting alternative ac power sources (such as GTGs) not modeled in the EPS fault tree, if such sources exist at the plant. In addition, recovery (including repair) of a failed EDG is modeled as the last top event in the SBO event tree. All of the sequences in the SBO event tree in Figure 2-2 (and in transfers to additional SBO event trees) ending with “CD” contribute to the SBO CDF for the plant.
BWR LOOP and SBO event trees are generally similar to the PWR trees in terms of safety functions required. However, for BWRs, RCP seal leakage is not a significant concern during SBO conditions. In addition, most BWRs have two systems available for short-term core cooling—high pressure coolant injection (HPCI) or high pressure core spray (HPCS), and reactor core isolation cooling (RCIC)—both of which have TDPs (or a motor-driven pump, MDP, with its own EDG to supply ac power for HPCS) that can function under SBO conditions.
Based on the typical LOOP and SBO event trees within the SPAR models, the following are potentially important contributors to SBO risk:
SPAR Models
6
• LOOP frequency
• Offsite power nonrestoration curve
• EPS design (redundancy and diversity of onsite ac emergency power sources)
• Reliability and availability of EPS power source (typically EDGs)
• Nonrecovery (including repair) curve for EDGs
• RCP seal leakage model (PWRs)
• Battery depletion time
• Reliability and availability of ac-independent component (TDP, DDP, and HPCS MDP with associated EDGs)
• Operator errors associated with starting emergency power sources and/or aligning sources to appropriate buses.
Most of these contributors are discussed in the following sections of the report.
HPR
HIGHPRESSURE
RECIRC
RHR
RESIDUALHEAT
REMOVAL
PZR
RCSDEPRESS
FOR LPI/RHR
SSC
SECONDARYSIDE
COOLDOWN
OPR-06H
OFFSITEPOWER
RECOVERYIN 6 HRS
OPR-02H
OFFSITEPOWER
RECOVERYIN 2 HRS
FAB
FEEDAND
BLEED
HPI
HIGHPRESSUREINJECTION
LOSC
RCP SEALCOOLING
MAINTAINED
PORV
PORVsARE
CLOSED
AFW
AUXILIARYFEEDWATER
EPS
EMERGENCYPOWER
RPS
REACTORSHUTDOWN
IE-LOOP
LOSS OFOFFSITE POWER
# END-STATE
1 OK
2T LOOP-1
3 OK
4 OK
5 CD
6 OK
7 CD
8 OK
9 CD
10 OK
11 CD
12 CD
13 OK
14 CD
15 OK
16 CD
17 CD
18T SBO
19T ATWS
HPR-L
HPR-L
FAB-L
AFW-L
PORV-L
LOSC-L
HPI-L
Figure 2-1. Representative LOOP event tree for Westinghouse PWRs.
SPAR Models
7
DGR-07H
DIESELGENERATORRECOVERY
(IN 7 HR)
OPR-07H
OFFSITEPOWER
RECOVERY(IN 7 HR)
O2
RCPSEAL
STAGE 2INTEGRITY
BP2
RCPSEAL
STAGE 2INTEGRITY
O1
RCPSEAL
STAGE 1INTEGRITY
BP1
RCPSEAL
STAGE 1INTEGRITY
RSD
RAPIDSECONDARY
DEPRESS
PORV
PORVsARE
CLOSED
AFW
AUXILIARYFEEDWATER
EPS
EMERGENCYPOWER
# END-STATE NOTES
1 OK 2 OK 3 CD 25-hour-Tcu 4T SBO-1 5 OK 6 CD 4-hour-Tcu 7T SBO-1 8 OK 9 CD 9-hour-Tcu 10T SBO-1 11 OK 12 CD 2-hour-Tcu 13T SBO-2 14 OK 15 CD 15-hour-Tcu 16T SBO-2 17 OK 18 CD 3-hour-Tcu 19T SBO-2 20 OK 21 CD 3-hour-Tcu 22T SBO-2 23 OK 24 CD 6-hour-Tcu 25T SBO-2 26 OK 27 CD 2-hour-Tcu 28T SBO-2 29 OK 30 CD 2-hour-Tcu 31T SBO-2 32 OK 33 CD 6-hour-Tcu 34T SBO-2 35 OK 36 CD 2-hour-Tcu 37T SBO-2 38 OK 39 CD 2-hour-Tcu 40T SBO-2 41 OK 42 CD 30-min-Tcu 43T SBO-3 44 OK 45 CD 30-min-Tcu
OPR-01H
OPR-01H
21 gpm/rcp
182 gpm/rcp
76 gpm/rcp
480 gpm/rcp
21 gpm/rcp
172 gpm/rcp
182 gpm/rcp
61 gpm/rcp
300 gpm/rcp
300 gpm/rcp
76 gpm/rcp
300 gpm/rcp
480 gpm/rcp
OPR-04H
OPR-02H
OPR-03H
OPR-03H
OPR-06H
OPR-02H
OPR-02H
OPR-06H
OPR-02H
OPR-02H
DGR-04H
DGR-02H
DGR-03H
DGR-03H
DGR-06H
DGR-02H
DGR-02H
DGR-06H
DGR-02H
DGR-02H
AFW-B
PORV-B
DGR-01H
DGR-01H
Figure 2-2. Representative SBO event tree for Westinghouse PWRs.

SPAR Models
8
9
3. LOOP FREQUENCY AND DURATION
As indicated earlier in this report, LOOP frequency and duration information have been updated to reflect current performance across the U.S. nuclear power plant industry. Results of that effort are documented in Volume 1 of this report. A brief summary of those results is presented in this section.
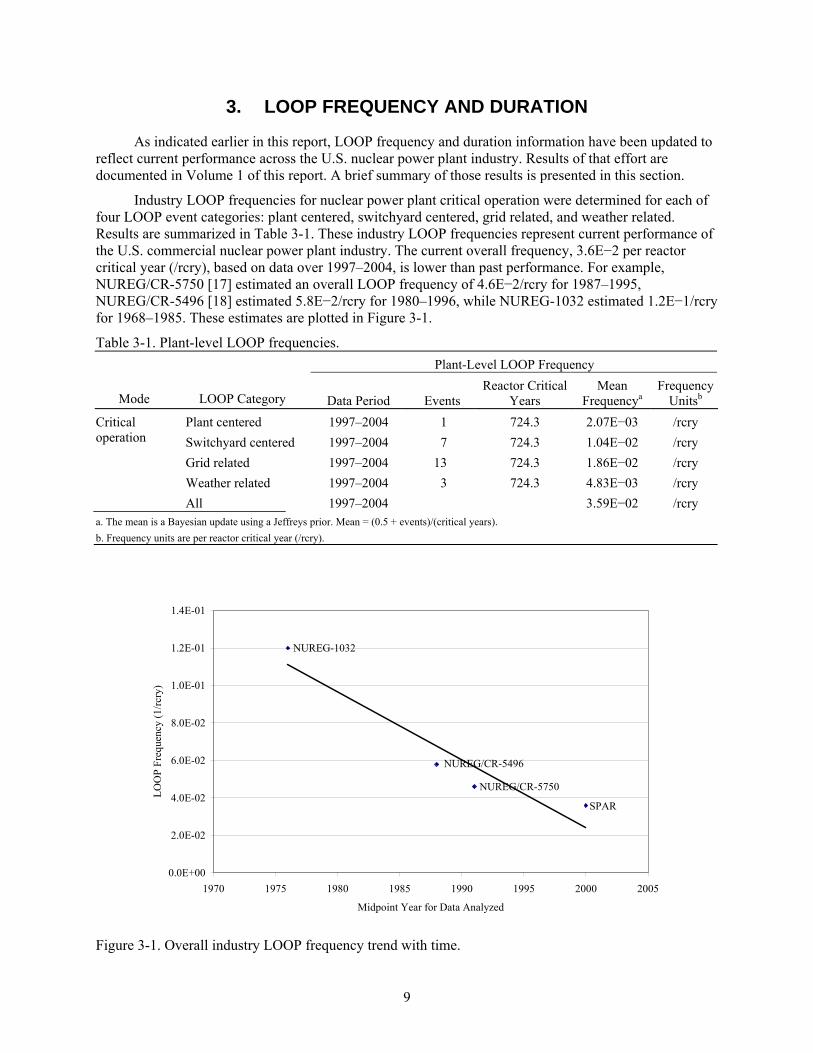
Industry LOOP frequencies for nuclear power plant critical operation were determined for each of four LOOP event categories: plant centered, switchyard centered, grid related, and weather related. Results are summarized in Table 3-1. These industry LOOP frequencies represent current performance of the U.S. commercial nuclear power plant industry. The current overall frequency, 3.6E−2 per reactor critical year (/rcry), based on data over 1997–2004, is lower than past performance. For example, NUREG/CR-5750 [17] estimated an overall LOOP frequency of 4.6E−2/rcry for 1987–1995, NUREG/CR-5496 [18] estimated 5.8E−2/rcry for 1980–1996, while NUREG-1032 estimated 1.2E−1/rcry for 1968–1985. These estimates are plotted in Figure 3-1.
Table 3-1. Plant-level LOOP frequencies. Plant-Level LOOP Frequency
Mode LOOP Category Data Period Events Reactor Critical
Years Mean
Frequencya Frequency
Unitsb Plant centered 1997–2004 1 724.3 2.07E−03 /rcry Critical
operation Switchyard centered 1997–2004 7 724.3 1.04E−02 /rcry Grid related 1997–2004 13 724.3 1.86E−02 /rcry Weather related 1997–2004 3 724.3 4.83E−03 /rcry All 1997–2004 3.59E−02 /rcry a. The mean is a Bayesian update using a Jeffreys prior. Mean = (0.5 + events)/(critical years). b. Frequency units are per reactor critical year (/rcry).
SPAR
NUREG/CR-5750
NUREG/CR-5496
NUREG-1032
0.0E+00
2.0E-02
4.0E-02
6.0E-02
8.0E-02
1.0E-01
1.2E-01
1.4E-01
1970 1975 1980 1985 1990 1995 2000 2005
Midpoint Year for Data Analyzed
LOO
P Fr
eque
ncy
(1/rc
ry)
Figure 3-1. Overall industry LOOP frequency trend with time.
Loop Frequency and Duration
10
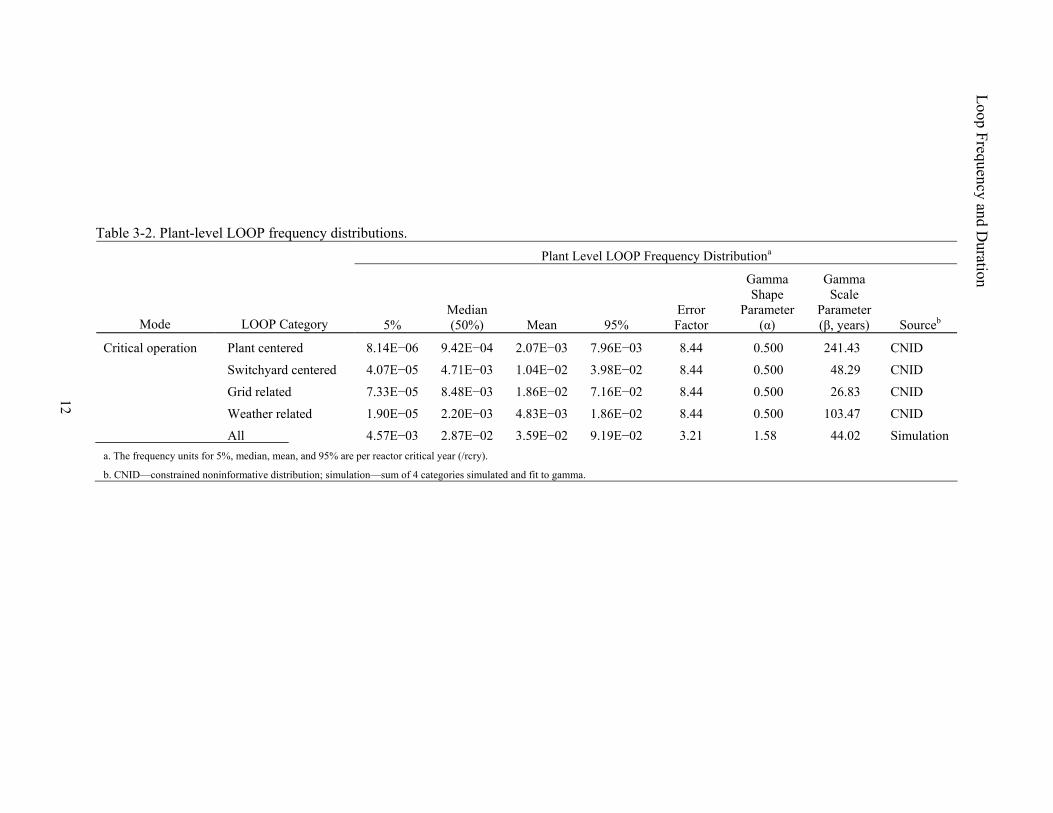
Uncertainty distributions for the industry LOOP frequencies are presented in Table 3-2. The 5%, median, mean, 95%, error factor (95%/median), and shape (α) and scale (β) parameters for the gamma distributions are given. The overall mean frequency of 3.6E−2/rcry has a lower bound (5%) of 4.6E−3/rcry and an upper bound (95%) of 9.2E−2/rcry. The error factor for this gamma distribution is 3.2.
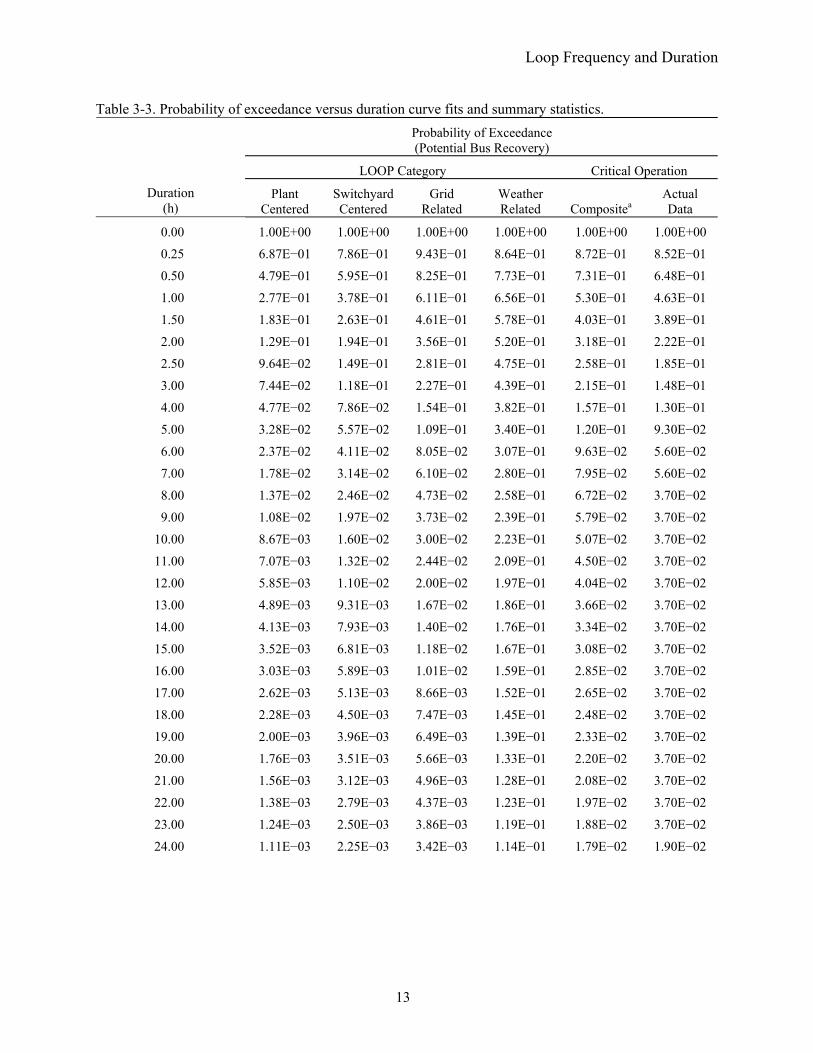
In Volume 1 of this report, the LOOP duration data were converted to probability of exceedance versus duration lognormal curves for each of the four LOOP categories. The lognormal density and cumulative distribution functions used in Volume 1 are:
⎥⎦⎤
⎢⎣⎡ −
−= σ
µ
σπ
)ln(21
21)(
t
et
tf (1)
⎥⎦⎤
⎢⎣⎡ −
Φ=σ
µ)ln()( ttF (2)
where
t = offsite power recovery time
µ = mean of natural logarithms of data
σ = standard deviation of natural logarithms of data
Ф = error function.
Volume 1 addressed three possible offsite power restoration times: time to restore offsite power to the switchyard, potential time to recover offsite power to a safety bus, and actual time to restore offsite power to a safety bus. As discussed in Volume 1, the appropriate restoration time for use in PRAs is the potential bus recovery time. Results of the lognormal curve fits to the potential bus recovery times are summarized in Table 3-3. As an example of how to interpret these results, consider a duration of 2 h following initiation of the LOOP. For plant-centered LOOPs, there is a 0.13 probability of not restoring offsite power to a safety bus within 2 h. If the LOOP had been switchyard centered, the probability is 0.19. Similarly, the grid-related and weather-related LOOP probabilities are 0.36 and 0.52, respectively. However, the baseline SPAR model uses an overall LOOP frequency (sum of the four LOOP category frequencies) and its associated composite nonrestoration curve. The composite nonrestoration curve is just a frequency-weighted average of the four LOOP category nonrestoration curves. The composite curve presented in Table 3-3 indicates a 0.32 probability of not restoring offsite power to a safety bus within 2 h.
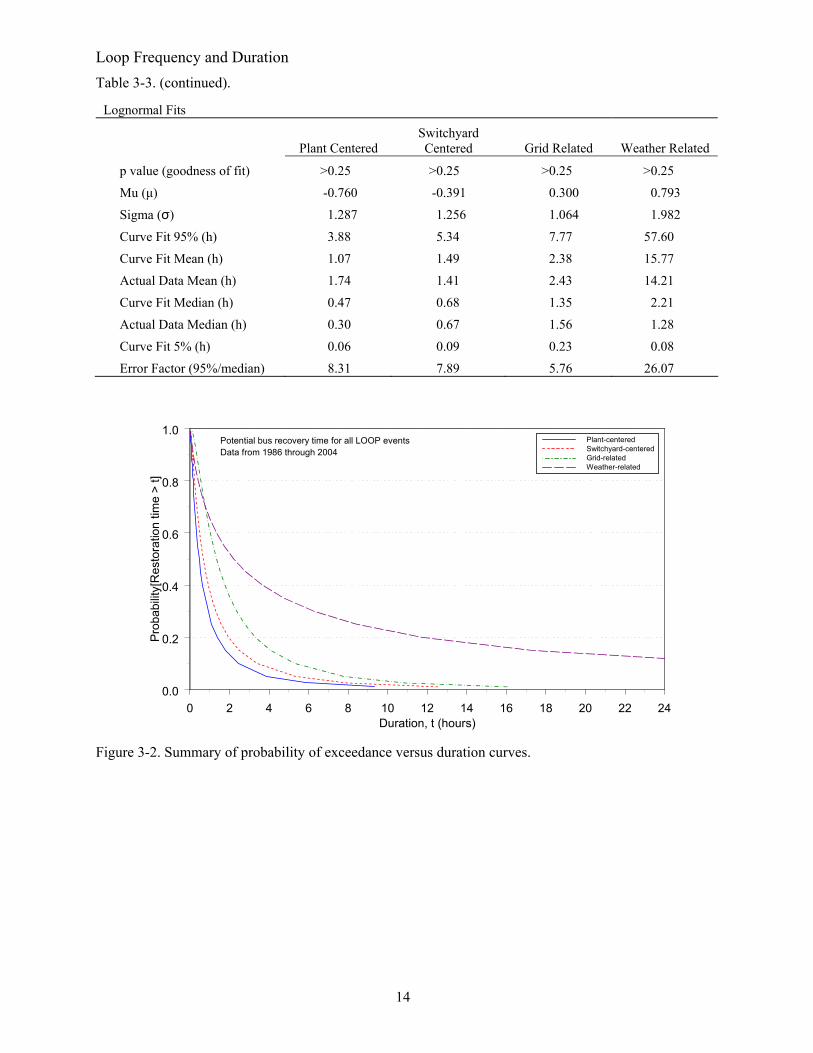
As can be seen in Figure 3-2, the plant-centered and switchyard-centered LOOPs result in the lowest probabilities of exceedance versus duration. Grid-related LOOPs have higher probabilities of exceedance—up to 14 h. Finally, weather-related LOOPs result in the highest probabilities of exceedance except for the first hour.
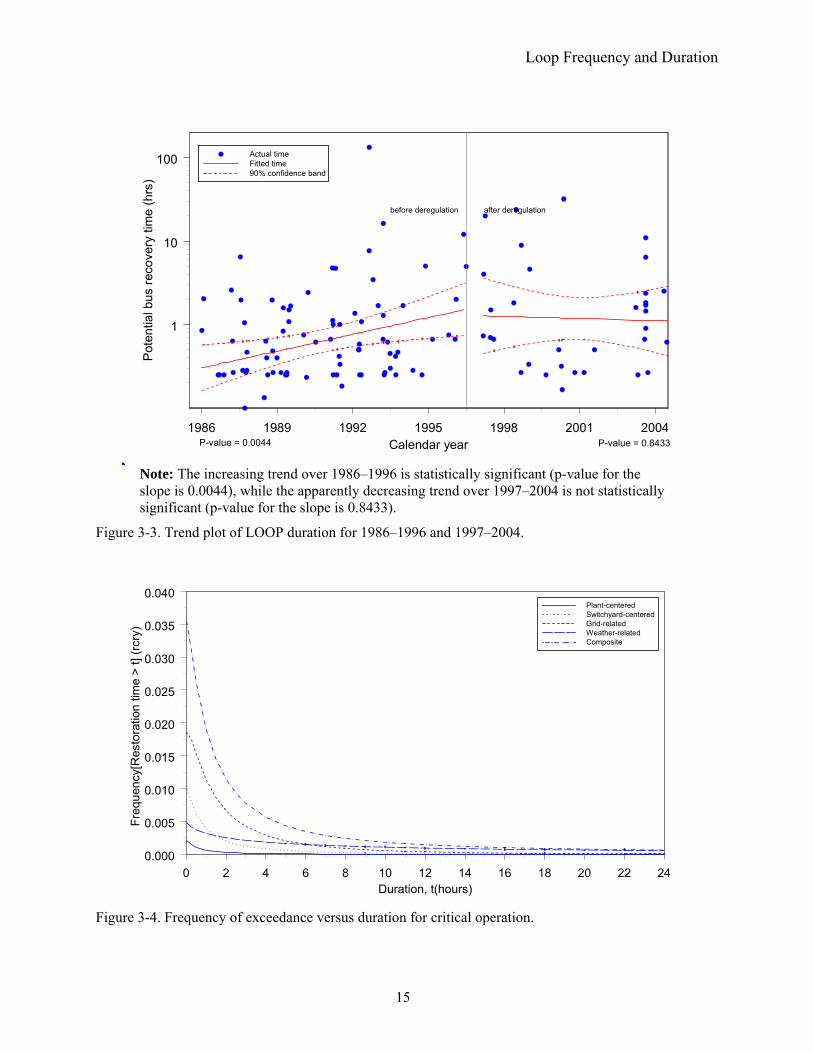
LOOP duration data over the entire period of 1986–2004 were used to generate probability of exceedance versus duration curves for each of the four LOOP categories. Statistical analyses indicated that within each category, there was not a statistically significant difference between the 1986–1996 data and the 1997–2004 data. However, if all of the LOOP data are combined, a statistically significant increasing trend in durations is observed over 1986–1996. In contrast, the 1997–2004 data do not exhibit
Loop Frequency and Duration
11
a significant trend. The results of this trending analysis are presented in Figure 3-3. Finally, if the entire period of 1986–2004 is considered, there is no statistically significant trend in LOOP durations.
The combined impact of LOOP frequency and LOOP duration on plant risk can be examined by generating frequency of exceedance versus duration curves. These curves are similar to the conditional probability of exceedance curves, but multiplied by the LOOP frequency. The results for the four LOOP categories from Volume 1 are presented in Figure 3-4. Given a plant risk model with constant input parameters except for the LOOP category frequencies and durations, the curves in Figure 3-4 are approximate indications of the relative risk from SBO core damage scenarios from each LOOP category. The higher the curve, the higher the SBO core damage risk.
As indicated in Figure 3-4, for critical operation grid-centered LOOPs dominate the frequency of exceedance versus duration curves up to approximately 6 h. This reflects the relatively high frequency for grid-related LOOPs during critical operation and the moderate durations. Beyond 6 h, the weather-related LOOPs dominate. In addition, up to approximately 2 h, the switchyard-centered LOOPs are important contributors, again mainly because of the relatively high frequency.
Finally, Figure 3-5 compares the composite frequency of exceedance curve for critical operation with historical results and with the old SPAR inputs (before making the changes described in Section 2.1). The new curve generally lies below the NUREG-1032 and NUREG/CR-5496 curves. However, the new curve lies above the old SPAR curve except for the first half hour.
Loop Frequency and Duration
12
Table 3-2. Plant-level LOOP frequency distributions.
Plant Level LOOP Frequency Distributiona
Mode LOOP Category 5% Median (50%) Mean 95%
Error Factor
Gamma Shape
Parameter(α)
Gamma Scale
Parameter(β, years) Sourceb
Plant centered 8.14E−06 9.42E−04 2.07E−03 7.96E−03 8.44 0.500 241.43 CNID
Switchyard centered 4.07E−05 4.71E−03 1.04E−02 3.98E−02 8.44 0.500 48.29 CNID
Grid related 7.33E−05 8.48E−03 1.86E−02 7.16E−02 8.44 0.500 26.83 CNID
Weather related 1.90E−05 2.20E−03 4.83E−03 1.86E−02 8.44 0.500 103.47 CNID
Critical operation
All 4.57E−03 2.87E−02 3.59E−02 9.19E−02 3.21 1.58 44.02 Simulation a. The frequency units for 5%, median, mean, and 95% are per reactor critical year (/rcry).
b. CNID—constrained noninformative distribution; simulation—sum of 4 categories simulated and fit to gamma.
Loop Frequency and Duration
13
Table 3-3. Probability of exceedance versus duration curve fits and summary statistics. Probability of Exceedance (Potential Bus Recovery)
LOOP Category Critical Operation
Duration (h)
Plant Centered
Switchyard Centered
Grid Related
Weather Related Compositea
Actual Data
0.00 1.00E+00 1.00E+00 1.00E+00 1.00E+00 1.00E+00 1.00E+00
0.25 6.87E−01 7.86E−01 9.43E−01 8.64E−01 8.72E−01 8.52E−01
0.50 4.79E−01 5.95E−01 8.25E−01 7.73E−01 7.31E−01 6.48E−01
1.00 2.77E−01 3.78E−01 6.11E−01 6.56E−01 5.30E−01 4.63E−01
1.50 1.83E−01 2.63E−01 4.61E−01 5.78E−01 4.03E−01 3.89E−01
2.00 1.29E−01 1.94E−01 3.56E−01 5.20E−01 3.18E−01 2.22E−01
2.50 9.64E−02 1.49E−01 2.81E−01 4.75E−01 2.58E−01 1.85E−01
3.00 7.44E−02 1.18E−01 2.27E−01 4.39E−01 2.15E−01 1.48E−01
4.00 4.77E−02 7.86E−02 1.54E−01 3.82E−01 1.57E−01 1.30E−01
5.00 3.28E−02 5.57E−02 1.09E−01 3.40E−01 1.20E−01 9.30E−02
6.00 2.37E−02 4.11E−02 8.05E−02 3.07E−01 9.63E−02 5.60E−02
7.00 1.78E−02 3.14E−02 6.10E−02 2.80E−01 7.95E−02 5.60E−02
8.00 1.37E−02 2.46E−02 4.73E−02 2.58E−01 6.72E−02 3.70E−02
9.00 1.08E−02 1.97E−02 3.73E−02 2.39E−01 5.79E−02 3.70E−02
10.00 8.67E−03 1.60E−02 3.00E−02 2.23E−01 5.07E−02 3.70E−02
11.00 7.07E−03 1.32E−02 2.44E−02 2.09E−01 4.50E−02 3.70E−02
12.00 5.85E−03 1.10E−02 2.00E−02 1.97E−01 4.04E−02 3.70E−02
13.00 4.89E−03 9.31E−03 1.67E−02 1.86E−01 3.66E−02 3.70E−02
14.00 4.13E−03 7.93E−03 1.40E−02 1.76E−01 3.34E−02 3.70E−02
15.00 3.52E−03 6.81E−03 1.18E−02 1.67E−01 3.08E−02 3.70E−02
16.00 3.03E−03 5.89E−03 1.01E−02 1.59E−01 2.85E−02 3.70E−02
17.00 2.62E−03 5.13E−03 8.66E−03 1.52E−01 2.65E−02 3.70E−02
18.00 2.28E−03 4.50E−03 7.47E−03 1.45E−01 2.48E−02 3.70E−02
19.00 2.00E−03 3.96E−03 6.49E−03 1.39E−01 2.33E−02 3.70E−02
20.00 1.76E−03 3.51E−03 5.66E−03 1.33E−01 2.20E−02 3.70E−02
21.00 1.56E−03 3.12E−03 4.96E−03 1.28E−01 2.08E−02 3.70E−02
22.00 1.38E−03 2.79E−03 4.37E−03 1.23E−01 1.97E−02 3.70E−02
23.00 1.24E−03 2.50E−03 3.86E−03 1.19E−01 1.88E−02 3.70E−02
24.00 1.11E−03 2.25E−03 3.42E−03 1.14E−01 1.79E−02 1.90E−02
Loop Frequency and Duration Table 3-3. (continued).
14
Lognormal Fits
Plant Centered Switchyard Centered Grid Related Weather Related
p value (goodness of fit) >0.25 >0.25 >0.25 >0.25
Mu (µ) -0.760 -0.391 0.300 0.793
Sigma (σ) 1.287 1.256 1.064 1.982
Curve Fit 95% (h) 3.88 5.34 7.77 57.60
Curve Fit Mean (h) 1.07 1.49 2.38 15.77
Actual Data Mean (h) 1.74 1.41 2.43 14.21
Curve Fit Median (h) 0.47 0.68 1.35 2.21
Actual Data Median (h) 0.30 0.67 1.56 1.28
Curve Fit 5% (h) 0.06 0.09 0.23 0.08
Error Factor (95%/median) 8.31 7.89 5.76 26.07
0 2 4 6 8 10 12 14 16 18 20 22 24Duration, t (hours)
0.0
0.2
0.4
0.6
0.8
1.0
Pro
babi
lity[
Res
tora
tion
time
> t]
Plant-centeredSwitchyard-centeredGrid-relatedWeather-related
Potential bus recovery time for all LOOP eventsData from 1986 through 2004
Figure 3-2. Summary of probability of exceedance versus duration curves.
Loop Frequency and Duration
15
1986 1989 1992 1995 1998 2001 2004Calendar year
1
10
100P
oten
tial b
us re
cove
ry ti
me
(hrs
)Actual timeFitted time90% confidence band
P-value = 0.0044 P-value = 0.8433
before deregulation after deregulation
Note: The increasing trend over 1986–1996 is statistically significant (p-value for the slope is 0.0044), while the apparently decreasing trend over 1997–2004 is not statistically significant (p-value for the slope is 0.8433).
Figure 3-3. Trend plot of LOOP duration for 1986–1996 and 1997–2004.
0 2 4 6 8 10 12 14 16 18 20 22 24Duration, t(hours)
0.000
0.005
0.010
0.015
0.020
0.025
0.030
0.035
0.040
Freq
uenc
y[R
esto
ratio
n tim
e >
t] (r
cry)
Plant-centeredSwitchyard-centeredGrid-relatedWeather-relatedComposite
Figure 3-4. Frequency of exceedance versus duration for critical operation.
Loop Frequency and Duration
16
0 2 4 6 8 10 12 14 16 18 20 22 24Duration, t (hours)
0.00
0.02
0.04
0.06
0.08
0.10
0.12Present studyNUREG/CR-5496NUREG-1032Old SPAR
Prob
abili
ty[R
esto
ratio
n tim
e >
t]
Figure 3-5. Comparison of frequency of exceedance versus duration for critical operation.
17
4. EPS MODELING AND PERFORMANCE
This section discusses EPS designs, EDG (and other emergency power source) performance, and results of EPS fault tree quantification.
4.1 EPS Designs and SPAR Modeling
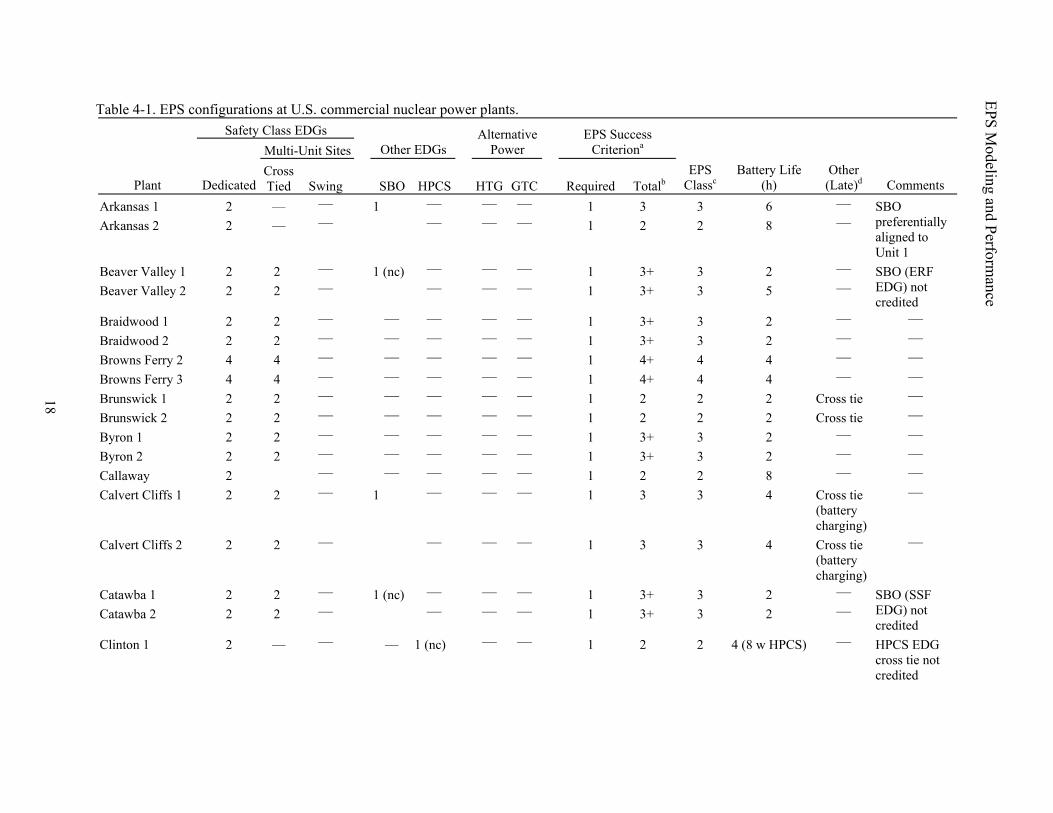
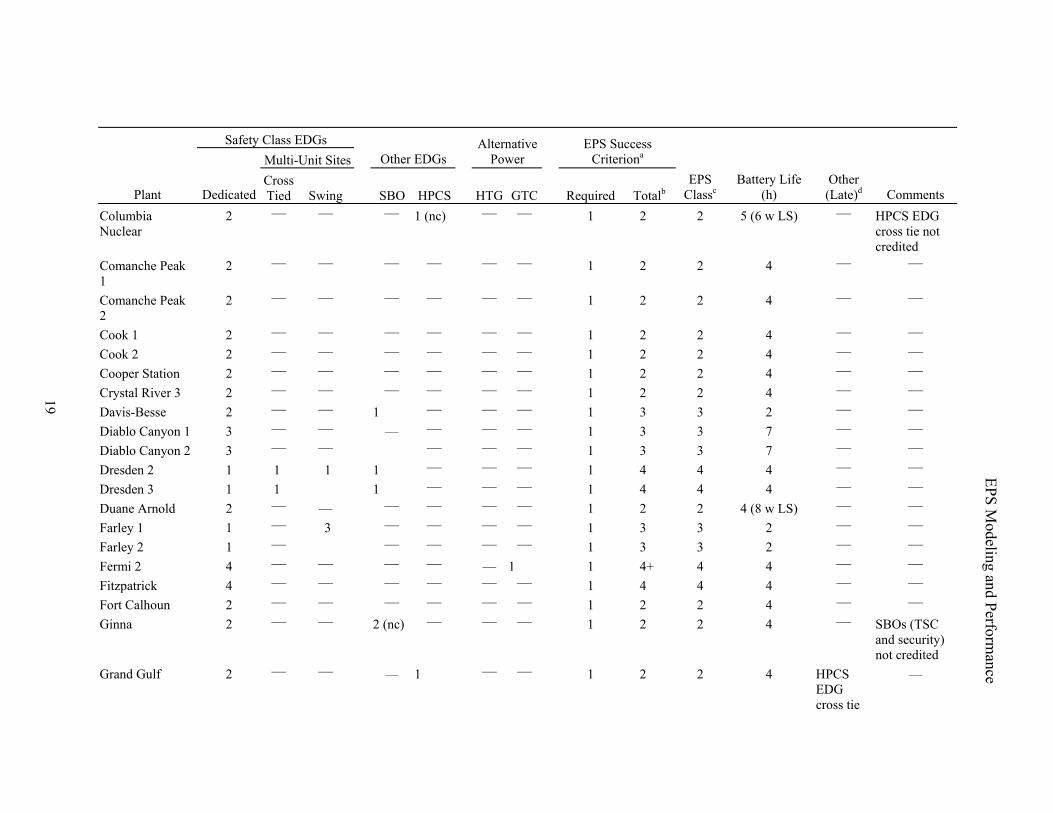
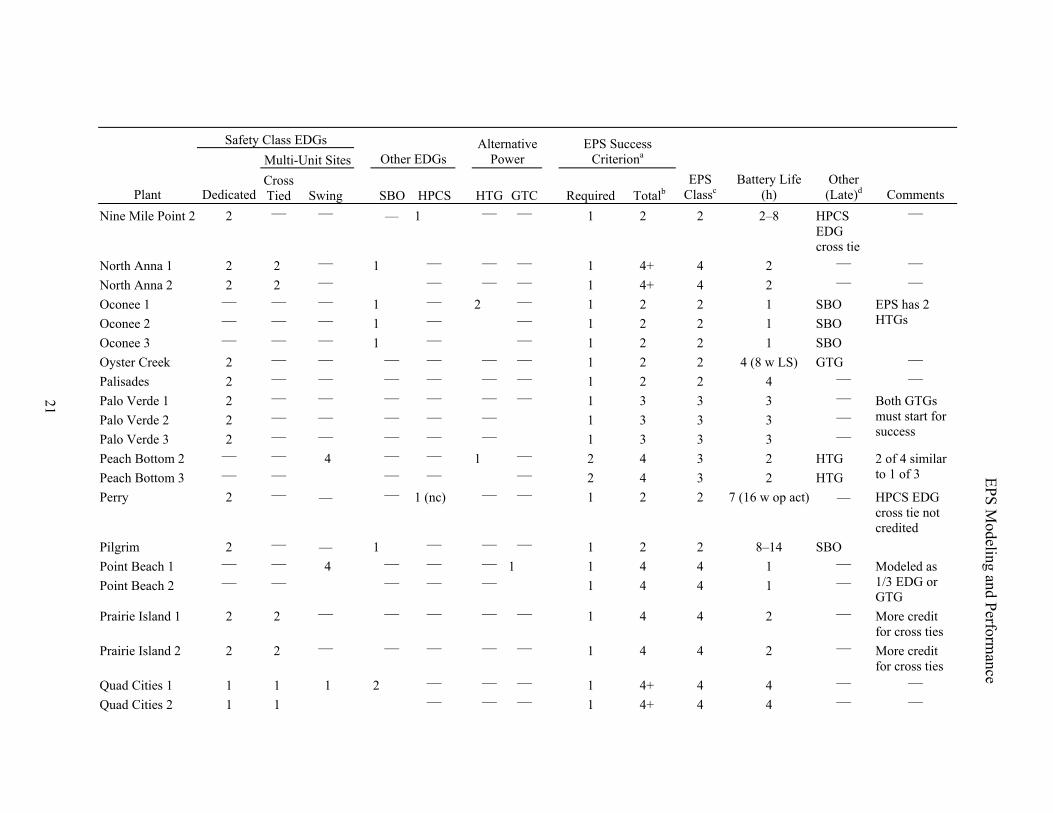
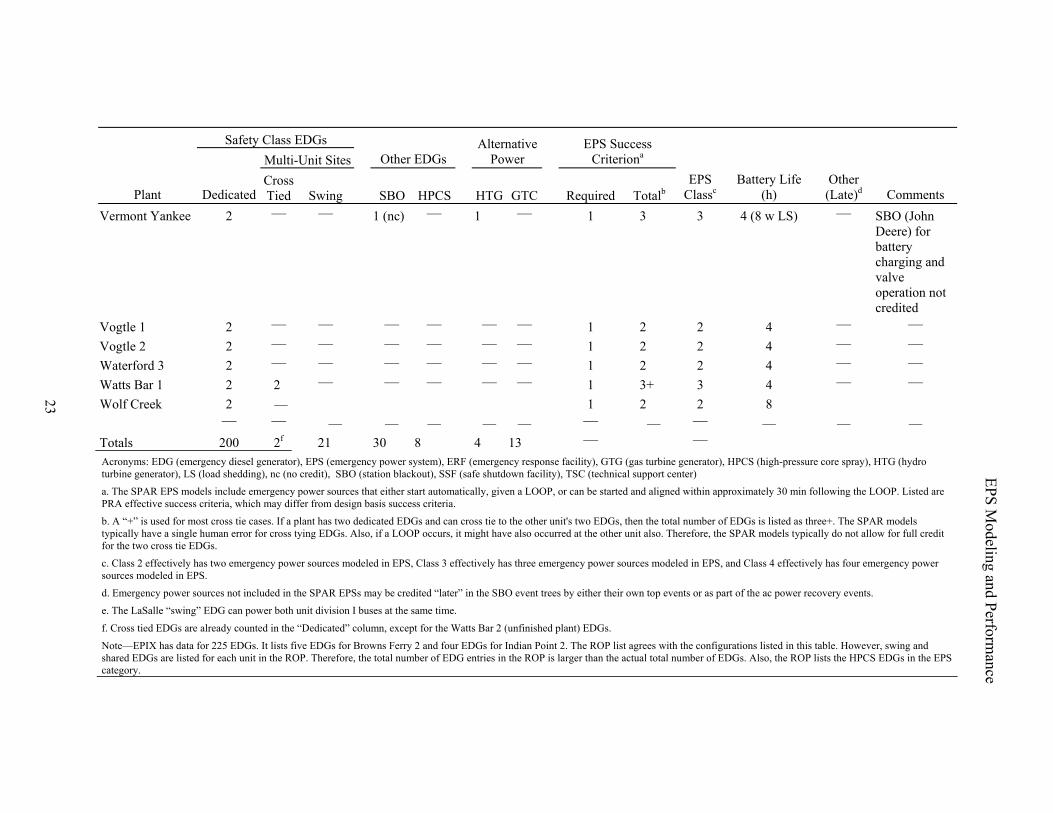
The EPS is designed to provide backup, onsite, ac power to essential buses. EPS designs vary widely among the 103 .S. commercial nuclear power plants. A summary of those designs is presented in Table 4-1. Typical EPS designs include two, three, or four EDGs, with only one of the EDGs required for success. However, as indicated in Table 4-1, there are many variations of these typical designs, including shared EDGs and/or the ability to cross-tie to other EDGs (at multi-plant sites), and availability of alternative ac sources such as GTGs or hydro turbine generators (HTGs). In addition, several of the plants require two EDGs for success, rather than one.
SPAR modeling of EPSs incorporates the plant-to-plant design and operational differences indicated in Table 4-1. All ac emergency power sources that either are automatically started and aligned to essential buses when a LOOP occurs, or can be manually started and aligned within approximately 30 min, are included in the SPAR EPS fault trees. Additional emergency power sources such as GTGs or HTGs that require more than 30 min to start and align to essential buses are included in other parts of the SBO event tree, typically as additional credit for recovery of ac power. Included in the SPAR EPS fault trees are dependencies such as room cooling, service water cooling, and dc power.
4.2 EDG and Other Emergency Power Source Performance
EDG failure modes in the SPAR models include failure to start (FTS), failure to load and run for 1 h (FTLR), failure to run (beyond 1 h) (FTR), and TM outage. In this report, unreliability (UR) is defined to include FTS, FTLR, and FTR. Unavailability (UA) is defined as the TM contribution. Finally, total UR is defined to include both UR and UA. Various CCF events are also included at the system level. SPAR models use industry average failure probabilities and rates for FTS, FTLR, and FTR. These were obtained from EPIX data for 1998–2002, using the RADS software. The data and resulting values are presented in Table 4-2.
Table 4-2 also compares the EPIX data with unplanned demand (actual undervoltage conditions requiring the EDG to start, load, and run) data obtained from a review of licensee event reports (LERs) covering 1997–2003. The detailed list of EDG unplanned demand data is presented in Appendix A. These unplanned demands are relatively rare, as indicated by the number of demands. Over 1997–2003 there were 162 such unplanned demands. If the data are limited to 1998–2002 to agree with the EPIX data collection period, there were 94 such unplanned demands. This compares with 23,983 demands from both tests and unplanned demands from EPIX. Therefore, there are approximately 250 test demands for every unplanned (undervoltage) demand on the EDGs. For the 104 plants included in this unplanned demand data set, only approximately one-half experienced an unplanned demand during 1997–2003.
In terms of failures, the EDG unplanned demand data set includes nine failures (excluding the MOOS events that occurred during shutdown). Three of these failures were easily and quickly recovered. However, the remaining six failures were not quickly recovered. These include one FTS, two FTLR, and three FTR events. In contrast, the EPIX database contains 206 EDG failures over the shorter period of 1998–2002.
18
EPS Modeling and Perform
ance
Table 4-1. EPS configurations at U.S. commercial nuclear power plants. Safety Class EDGs
Multi-Unit Sites Other EDGs Alternative
Power EPS Success
Criteriona
Plant Dedicated Cross Tied Swing SBO HPCS HTG GTC Required Totalb
EPS Classc
Battery Life (h)
Other (Late)d Comments
Arkansas 1 2 — — — — — 1 3 3 6 — Arkansas 2 2 — —
1 — — — 1 2 2 8 —
SBO preferentially aligned to Unit 1
Beaver Valley 1 2 2 — — — — 1 3+ 3 2 — Beaver Valley 2 2 2 —
1 (nc) — — — 1 3+ 3 5 —
SBO (ERF EDG) not credited
Braidwood 1 2 2 — — — — — 1 3+ 3 2 — — Braidwood 2 2 2 — — — — — 1 3+ 3 2 — — Browns Ferry 2 4 4 — — — — — 1 4+ 4 4 — — Browns Ferry 3 4 4 — — — — — 1 4+ 4 4 — — Brunswick 1 2 2 — — — — — 1 2 2 2 Cross tie — Brunswick 2 2 2 — — — — — 1 2 2 2 Cross tie — Byron 1 2 2 — — — — — 1 3+ 3 2 — — Byron 2 2 2 — — — — — 1 3+ 3 2 — — Callaway 2 — — — — — 1 2 2 8 — — Calvert Cliffs 1 2 2 — — — — 1 3 3 4 Cross tie
(battery charging)
—
Calvert Cliffs 2 2 2 —
1
— — — 1 3 3 4 Cross tie (battery charging)
—
Catawba 1 2 2 — — — — 1 3+ 3 2 — Catawba 2 2 2 —
1 (nc) — — — 1 3+ 3 2 —
SBO (SSF EDG) not credited
Clinton 1 2 — — — 1 (nc) — — 1 2 2 4 (8 w HPCS) — HPCS EDG cross tie not credited
19
EPS Modeling and Perform
ance
Safety Class EDGs Multi-Unit Sites Other EDGs
Alternative Power
EPS Success Criteriona
Plant Dedicated Cross Tied Swing SBO HPCS HTG GTC Required Totalb
EPS Classc
Battery Life (h)
Other (Late)d Comments
Columbia Nuclear
2 — — — 1 (nc) — — 1 2 2 5 (6 w LS) — HPCS EDG cross tie not credited
Comanche Peak 1
2 — — — — — — 1 2 2 4 — —
Comanche Peak 2
2 — — — — — — 1 2 2 4 — —
Cook 1 2 — — — — — — 1 2 2 4 — — Cook 2 2 — — — — — — 1 2 2 4 — — Cooper Station 2 — — — — — — 1 2 2 4 — — Crystal River 3 2 — — — — — — 1 2 2 4 — — Davis-Besse 2 — — 1 — — — 1 3 3 2 — — Diablo Canyon 1 3 — — — — — — 1 3 3 7 — — Diablo Canyon 2 3 — — — — — 1 3 3 7 — — Dresden 2 1 1 1 — — — 1 4 4 4 — — Dresden 3 1 1
1 1 — — — 1 4 4 4 — —
Duane Arnold 2 — — — — — — 1 2 2 4 (8 w LS) — — Farley 1 1 — — — — — 1 3 3 2 — — Farley 2 1 —
3 — — — — 1 3 3 2 — —
Fermi 2 4 — — — — — 1 1 4+ 4 4 — — Fitzpatrick 4 — — — — — — 1 4 4 4 — — Fort Calhoun 2 — — — — — — 1 2 2 4 — — Ginna 2 — — 2 (nc) — — — 1 2 2 4 — SBOs (TSC
and security) not credited
Grand Gulf 2 — — — 1 — — 1 2 2 4 HPCS EDG cross tie
—
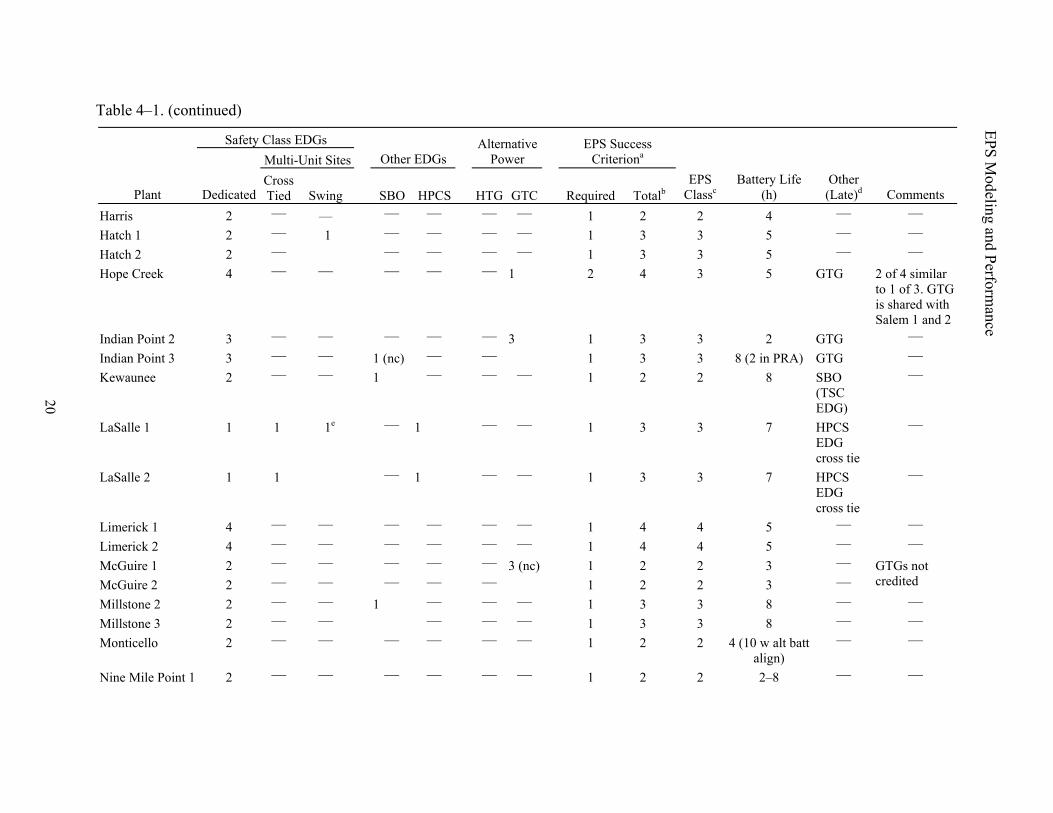
Table 4–1. (continued)
EPS Modeling and Perform
ance
20
Safety Class EDGs Multi-Unit Sites Other EDGs
Alternative Power
EPS Success Criteriona
Plant Dedicated Cross Tied Swing SBO HPCS HTG GTC Required Totalb
EPS Classc
Battery Life (h)
Other (Late)d Comments
Harris 2 — — — — — — 1 2 2 4 — — Hatch 1 2 — — — — — 1 3 3 5 — — Hatch 2 2 —
1 — — — — 1 3 3 5 — —
Hope Creek 4 — — — — — 1 2 4 3 5 GTG 2 of 4 similar to 1 of 3. GTG is shared with Salem 1 and 2
Indian Point 2 3 — — — — — 1 3 3 2 GTG — Indian Point 3 3 — — 1 (nc) — —
3 1 3 3 8 (2 in PRA) GTG —
Kewaunee 2 — — 1 — — — 1 2 2 8 SBO (TSC EDG)
—
LaSalle 1 1 1 — 1 — — 1 3 3 7 HPCS EDG cross tie
—
LaSalle 2 1 1
1e
— 1 — — 1 3 3 7 HPCS EDG cross tie
—
Limerick 1 4 — — — — — — 1 4 4 5 — — Limerick 2 4 — — — — — — 1 4 4 5 — — McGuire 1 2 — — — — — 1 2 2 3 — McGuire 2 2 — — — — —
3 (nc) 1 2 2 3 —
GTGs not credited
Millstone 2 2 — — — — — 1 3 3 8 — — Millstone 3 2 — —
1 — — — 1 3 3 8 — —
Monticello 2 — — — — — — 1 2 2 4 (10 w alt batt align)
— —
Nine Mile Point 1 2 — — — — — — 1 2 2 2–8 — —
21
EPS Modeling and Perform
ance
Safety Class EDGs Multi-Unit Sites Other EDGs
Alternative Power
EPS Success Criteriona
Plant Dedicated Cross Tied Swing SBO HPCS HTG GTC Required Totalb
EPS Classc
Battery Life (h)
Other (Late)d Comments
Nine Mile Point 2 2 — — — 1 — — 1 2 2 2–8 HPCS EDG cross tie
—
North Anna 1 2 2 — — — — 1 4+ 4 2 — — North Anna 2 2 2 —
1 — — — 1 4+ 4 2 — —
Oconee 1 — — — 1 — — 1 2 2 1 SBO Oconee 2 — — — 1 — — 1 2 2 1 SBO Oconee 3 — — — 1 —
2
— 1 2 2 1 SBO
EPS has 2 HTGs
Oyster Creek 2 — — — — — — 1 2 2 4 (8 w LS) GTG — Palisades 2 — — — — — — 1 2 2 4 — — Palo Verde 1 2 — — — — — 1 3 3 3 — Palo Verde 2 2 — — — — — 1 3 3 3 — Palo Verde 3 2 — — — — —
—
1 3 3 3 —
Both GTGs must start for success
Peach Bottom 2 — — — — — 2 4 3 2 HTG Peach Bottom 3 — —
4 — —
1 — 2 4 3 2 HTG
2 of 4 similar to 1 of 3
Perry 2 — — — 1 (nc) — — 1 2 2 7 (16 w op act) — HPCS EDG cross tie not credited
Pilgrim 2 — — 1 — — — 1 2 2 8–14 SBO Point Beach 1 — — — — — 1 4 4 1 — Point Beach 2 — —
4 — — —
1 1 4 4 1 —
Modeled as 1/3 EDG or GTG
Prairie Island 1 2 2 — — — — — 1 4 4 2 — More credit for cross ties
Prairie Island 2 2 2 — — — — — 1 4 4 2 — More credit for cross ties
Quad Cities 1 1 1 — — — 1 4+ 4 4 — — Quad Cities 2 1 1
1
2 — — — 1 4+ 4 4 — —
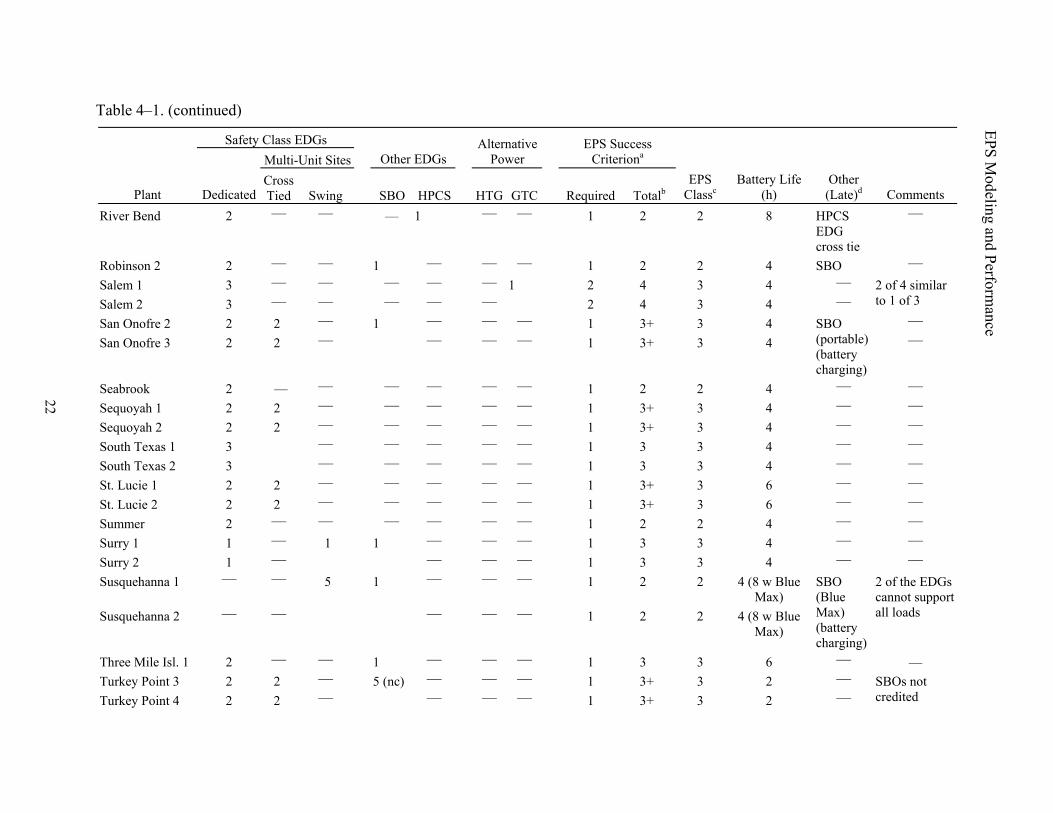
Table 4–1. (continued)
EPS Modeling and Perform
ance
22
Safety Class EDGs Multi-Unit Sites Other EDGs
Alternative Power
EPS Success Criteriona
Plant Dedicated Cross Tied Swing SBO HPCS HTG GTC Required Totalb
EPS Classc
Battery Life (h)
Other (Late)d Comments
River Bend 2 — — — 1 — — 1 2 2 8 HPCS EDG cross tie
—
Robinson 2 2 — — 1 — — — 1 2 2 4 SBO — Salem 1 3 — — — — — 2 4 3 4 — Salem 2 3 — — — — —
1 2 4 3 4 —
2 of 4 similar to 1 of 3
San Onofre 2 2 2 — — — — 1 3+ 3 4 — San Onofre 3 2 2 —
1 — — — 1 3+ 3 4
SBO (portable) (battery charging)
—
Seabrook 2 — — — — — — 1 2 2 4 — — Sequoyah 1 2 2 — — — — — 1 3+ 3 4 — — Sequoyah 2 2 2 — — — — — 1 3+ 3 4 — — South Texas 1 3 — — — — — 1 3 3 4 — — South Texas 2 3 — — — — — 1 3 3 4 — — St. Lucie 1 2 2 — — — — — 1 3+ 3 6 — — St. Lucie 2 2 2 — — — — — 1 3+ 3 6 — — Summer 2 — — — — — — 1 2 2 4 — — Surry 1 1 — — — — 1 3 3 4 — — Surry 2 1 —
1
1 — — — 1 3 3 4 — —
Susquehanna 1 — — — — — 1 2 2 4 (8 w Blue Max)
Susquehanna 2 — —
5
1
— — — 1 2 2 4 (8 w Blue Max)
SBO (Blue Max) (battery charging)
2 of the EDGs cannot support all loads
Three Mile Isl. 1 2 — — 1 — — — 1 3 3 6 — — Turkey Point 3 2 2 — — — — 1 3+ 3 2 — Turkey Point 4 2 2 —
5 (nc) — — — 1 3+ 3 2 —
SBOs not credited
23
EPS Modeling and Perform
ance
Safety Class EDGs Multi-Unit Sites Other EDGs
Alternative Power
EPS Success Criteriona
Plant Dedicated Cross Tied Swing SBO HPCS HTG GTC Required Totalb
EPS Classc
Battery Life (h)
Other (Late)d Comments
Vermont Yankee 2 — — 1 (nc) — 1 — 1 3 3 4 (8 w LS) — SBO (John Deere) for battery charging and valve operation not credited
Vogtle 1 2 — — — — — — 1 2 2 4 — — Vogtle 2 2 — — — — — — 1 2 2 4 — — Waterford 3 2 — — — — — — 1 2 2 4 — — Watts Bar 1 2 2 — — — — — 1 3+ 3 4 — — Wolf Creek 2 — 1 2 2 8 — — — — — — — — — — — — — Totals 200 2f 21 30 8 4 13 — — Acronyms: EDG (emergency diesel generator), EPS (emergency power system), ERF (emergency response facility), GTG (gas turbine generator), HPCS (high-pressure core spray), HTG (hydro turbine generator), LS (load shedding), nc (no credit), SBO (station blackout), SSF (safe shutdown facility), TSC (technical support center)
a. The SPAR EPS models include emergency power sources that either start automatically, given a LOOP, or can be started and aligned within approximately 30 min following the LOOP. Listed are PRA effective success criteria, which may differ from design basis success criteria.
b. A “+” is used for most cross tie cases. If a plant has two dedicated EDGs and can cross tie to the other unit's two EDGs, then the total number of EDGs is listed as three+. The SPAR models typically have a single human error for cross tying EDGs. Also, if a LOOP occurs, it might have also occurred at the other unit also. Therefore, the SPAR models typically do not allow for full credit for the two cross tie EDGs.
c. Class 2 effectively has two emergency power sources modeled in EPS, Class 3 effectively has three emergency power sources modeled in EPS, and Class 4 effectively has four emergency power sources modeled in EPS.
d. Emergency power sources not included in the SPAR EPSs may be credited “later” in the SBO event trees by either their own top events or as part of the ac power recovery events.
e. The LaSalle “swing” EDG can power both unit division I buses at the same time.
f. Cross tied EDGs are already counted in the “Dedicated” column, except for the Watts Bar 2 (unfinished plant) EDGs.
Note—EPIX has data for 225 EDGs. It lists five EDGs for Browns Ferry 2 and four EDGs for Indian Point 2. The ROP list agrees with the configurations listed in this table. However, swing and shared EDGs are listed for each unit in the ROP. Therefore, the total number of EDG entries in the ROP is larger than the actual total number of EDGs. Also, the ROP lists the HPCS EDGs in the EPS category.
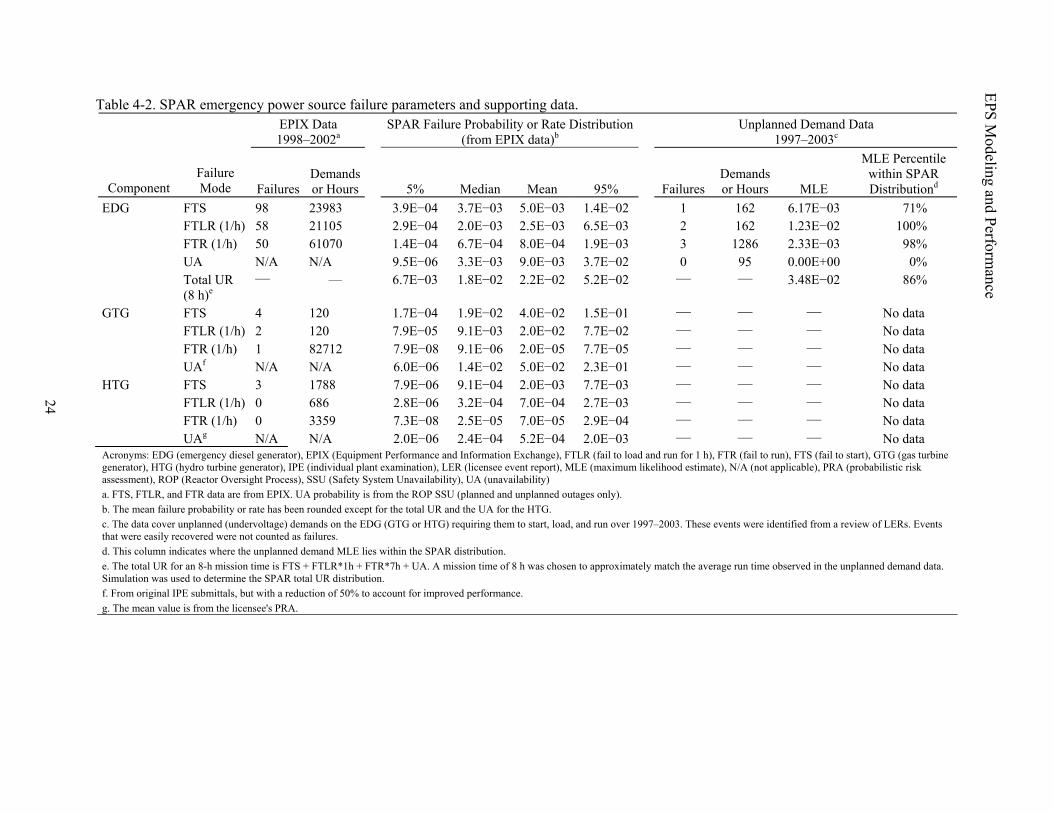
24
EPS Modeling and Perform
ance
Table 4-2. SPAR emergency power source failure parameters and supporting data. EPIX Data 1998–2002a
SPAR Failure Probability or Rate Distribution (from EPIX data)b
Unplanned Demand Data 1997–2003c
Component Failure Mode Failures
Demands or Hours 5% Median Mean 95% Failures
Demands or Hours MLE
MLE Percentile within SPAR Distributiond
EDG FTS 98 23983 3.9E−04 3.7E−03 5.0E−03 1.4E−02 1 162 6.17E−03 71% FTLR (1/h) 58 21105 2.9E−04 2.0E−03 2.5E−03 6.5E−03 2 162 1.23E−02 100% FTR (1/h) 50 61070 1.4E−04 6.7E−04 8.0E−04 1.9E−03 3 1286 2.33E−03 98% UA N/A N/A 9.5E−06 3.3E−03 9.0E−03 3.7E−02 0 95 0.00E+00 0% Total UR
(8 h)e — — 6.7E−03 1.8E−02 2.2E−02 5.2E−02 — — 3.48E−02 86%
GTG FTS 4 120 1.7E−04 1.9E−02 4.0E−02 1.5E−01 — — — No data FTLR (1/h) 2 120 7.9E−05 9.1E−03 2.0E−02 7.7E−02 — — — No data FTR (1/h) 1 82712 7.9E−08 9.1E−06 2.0E−05 7.7E−05 — — — No data UAf N/A N/A 6.0E−06 1.4E−02 5.0E−02 2.3E−01 — — — No data HTG FTS 3 1788 7.9E−06 9.1E−04 2.0E−03 7.7E−03 — — — No data FTLR (1/h) 0 686 2.8E−06 3.2E−04 7.0E−04 2.7E−03 — — — No data FTR (1/h) 0 3359 7.3E−08 2.5E−05 7.0E−05 2.9E−04 — — — No data UAg N/A N/A 2.0E−06 2.4E−04 5.2E−04 2.0E−03 — — — No data Acronyms: EDG (emergency diesel generator), EPIX (Equipment Performance and Information Exchange), FTLR (fail to load and run for 1 h), FTR (fail to run), FTS (fail to start), GTG (gas turbine generator), HTG (hydro turbine generator), IPE (individual plant examination), LER (licensee event report), MLE (maximum likelihood estimate), N/A (not applicable), PRA (probabilistic risk assessment), ROP (Reactor Oversight Process), SSU (Safety System Unavailability), UA (unavailability) a. FTS, FTLR, and FTR data are from EPIX. UA probability is from the ROP SSU (planned and unplanned outages only). b. The mean failure probability or rate has been rounded except for the total UR and the UA for the HTG. c. The data cover unplanned (undervoltage) demands on the EDG (GTG or HTG) requiring them to start, load, and run over 1997–2003. These events were identified from a review of LERs. Events that were easily recovered were not counted as failures. d. This column indicates where the unplanned demand MLE lies within the SPAR distribution. e. The total UR for an 8-h mission time is FTS + FTLR*1h + FTR*7h + UA. A mission time of 8 h was chosen to approximately match the average run time observed in the unplanned demand data. Simulation was used to determine the SPAR total UR distribution. f. From original IPE submittals, but with a reduction of 50% to account for improved performance. g. The mean value is from the licensee's PRA.
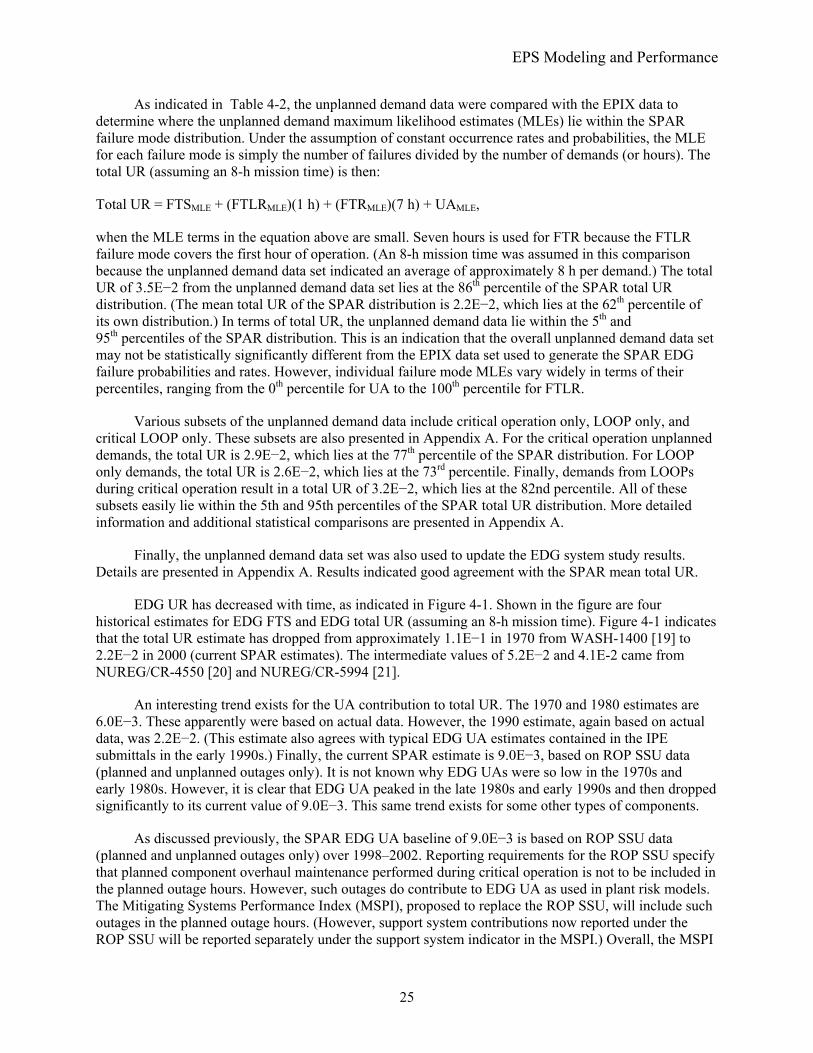
EPS Modeling and Performance
25
As indicated in Table 4-2, the unplanned demand data were compared with the EPIX data to determine where the unplanned demand maximum likelihood estimates (MLEs) lie within the SPAR failure mode distribution. Under the assumption of constant occurrence rates and probabilities, the MLE for each failure mode is simply the number of failures divided by the number of demands (or hours). The total UR (assuming an 8-h mission time) is then:
Total UR = FTSMLE + (FTLRMLE)(1 h) + (FTRMLE)(7 h) + UAMLE,
when the MLE terms in the equation above are small. Seven hours is used for FTR because the FTLR failure mode covers the first hour of operation. (An 8-h mission time was assumed in this comparison because the unplanned demand data set indicated an average of approximately 8 h per demand.) The total UR of 3.5E−2 from the unplanned demand data set lies at the 86th percentile of the SPAR total UR distribution. (The mean total UR of the SPAR distribution is 2.2E−2, which lies at the 62th percentile of its own distribution.) In terms of total UR, the unplanned demand data lie within the 5th and 95th percentiles of the SPAR distribution. This is an indication that the overall unplanned demand data set may not be statistically significantly different from the EPIX data set used to generate the SPAR EDG failure probabilities and rates. However, individual failure mode MLEs vary widely in terms of their percentiles, ranging from the 0th percentile for UA to the 100th percentile for FTLR.
Various subsets of the unplanned demand data include critical operation only, LOOP only, and critical LOOP only. These subsets are also presented in Appendix A. For the critical operation unplanned demands, the total UR is 2.9E−2, which lies at the 77th percentile of the SPAR distribution. For LOOP only demands, the total UR is 2.6E−2, which lies at the 73rd percentile. Finally, demands from LOOPs during critical operation result in a total UR of 3.2E−2, which lies at the 82nd percentile. All of these subsets easily lie within the 5th and 95th percentiles of the SPAR total UR distribution. More detailed information and additional statistical comparisons are presented in Appendix A.
Finally, the unplanned demand data set was also used to update the EDG system study results. Details are presented in Appendix A. Results indicated good agreement with the SPAR mean total UR.
EDG UR has decreased with time, as indicated in Figure 4-1. Shown in the figure are four historical estimates for EDG FTS and EDG total UR (assuming an 8-h mission time). Figure 4-1 indicates that the total UR estimate has dropped from approximately 1.1E−1 in 1970 from WASH-1400 [19] to 2.2E−2 in 2000 (current SPAR estimates). The intermediate values of 5.2E−2 and 4.1E-2 came from NUREG/CR-4550 [20] and NUREG/CR-5994 [21].
An interesting trend exists for the UA contribution to total UR. The 1970 and 1980 estimates are 6.0E−3. These apparently were based on actual data. However, the 1990 estimate, again based on actual data, was 2.2E−2. (This estimate also agrees with typical EDG UA estimates contained in the IPE submittals in the early 1990s.) Finally, the current SPAR estimate is 9.0E−3, based on ROP SSU data (planned and unplanned outages only). It is not known why EDG UAs were so low in the 1970s and early 1980s. However, it is clear that EDG UA peaked in the late 1980s and early 1990s and then dropped significantly to its current value of 9.0E−3. This same trend exists for some other types of components.
As discussed previously, the SPAR EDG UA baseline of 9.0E−3 is based on ROP SSU data (planned and unplanned outages only) over 1998–2002. Reporting requirements for the ROP SSU specify that planned component overhaul maintenance performed during critical operation is not to be included in the planned outage hours. However, such outages do contribute to EDG UA as used in plant risk models. The Mitigating Systems Performance Index (MSPI), proposed to replace the ROP SSU, will include such outages in the planned outage hours. (However, support system contributions now reported under the ROP SSU will be reported separately under the support system indicator in the MSPI.) Overall, the MSPI
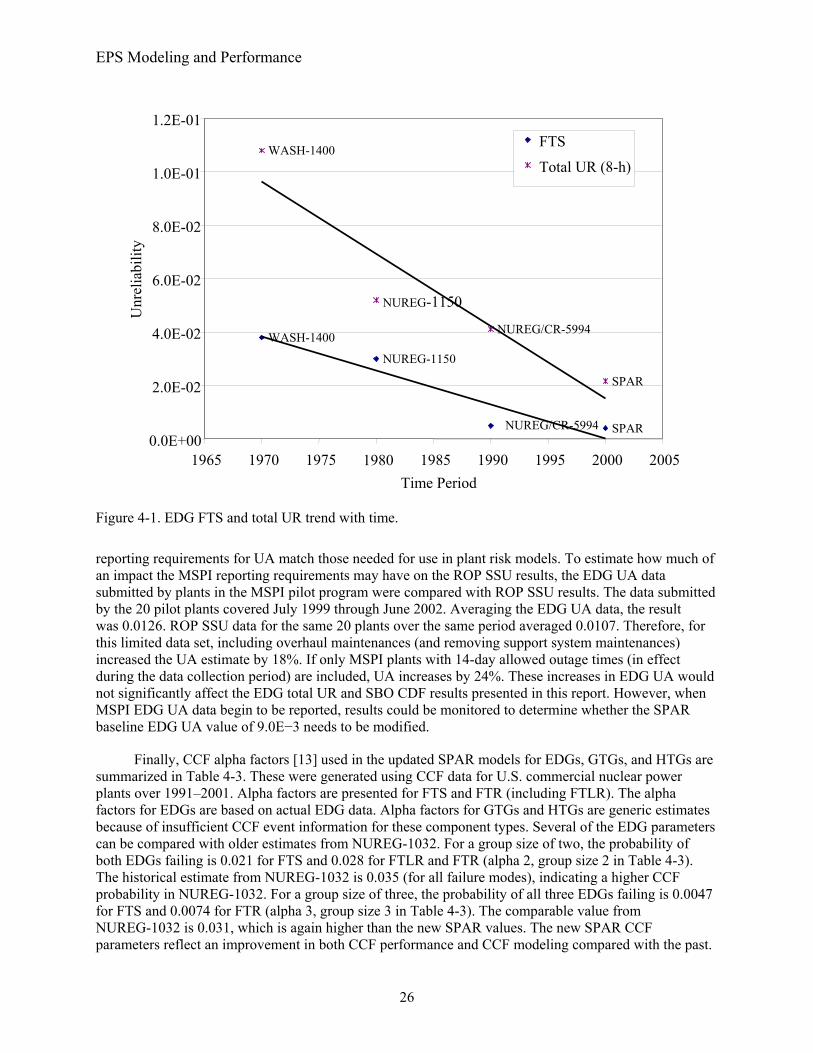
EPS Modeling and Performance
26
Figure 4-1. EDG FTS and total UR trend with time.
reporting requirements for UA match those needed for use in plant risk models. To estimate how much of an impact the MSPI reporting requirements may have on the ROP SSU results, the EDG UA data submitted by plants in the MSPI pilot program were compared with ROP SSU results. The data submitted by the 20 pilot plants covered July 1999 through June 2002. Averaging the EDG UA data, the result was 0.0126. ROP SSU data for the same 20 plants over the same period averaged 0.0107. Therefore, for this limited data set, including overhaul maintenances (and removing support system maintenances) increased the UA estimate by 18%. If only MSPI plants with 14-day allowed outage times (in effect during the data collection period) are included, UA increases by 24%. These increases in EDG UA would not significantly affect the EDG total UR and SBO CDF results presented in this report. However, when MSPI EDG UA data begin to be reported, results could be monitored to determine whether the SPAR baseline EDG UA value of 9.0E−3 needs to be modified.
Finally, CCF alpha factors [13] used in the updated SPAR models for EDGs, GTGs, and HTGs are summarized in Table 4-3. These were generated using CCF data for U.S. commercial nuclear power plants over 1991–2001. Alpha factors are presented for FTS and FTR (including FTLR). The alpha factors for EDGs are based on actual EDG data. Alpha factors for GTGs and HTGs are generic estimates because of insufficient CCF event information for these component types. Several of the EDG parameters can be compared with older estimates from NUREG-1032. For a group size of two, the probability of both EDGs failing is 0.021 for FTS and 0.028 for FTLR and FTR (alpha 2, group size 2 in Table 4-3). The historical estimate from NUREG-1032 is 0.035 (for all failure modes), indicating a higher CCF probability in NUREG-1032. For a group size of three, the probability of all three EDGs failing is 0.0047 for FTS and 0.0074 for FTR (alpha 3, group size 3 in Table 4-3). The comparable value from NUREG-1032 is 0.031, which is again higher than the new SPAR values. The new SPAR CCF parameters reflect an improvement in both CCF performance and CCF modeling compared with the past.
SPAR NUREG/CR-5994
NUREG-1150
WASH-1400
SPAR
NUREG/CR-5994
NUREG-1150
WASH-1400
0.0E+00
2.0E-02
4.0E-02
6.0E-02
8.0E-02
1.0E-01
1.2E-01
1965 1970 1975 1980 1985 1990 1995 2000 2005Time Period
Unr
elia
bilit
y FTS
Total UR (8-h)
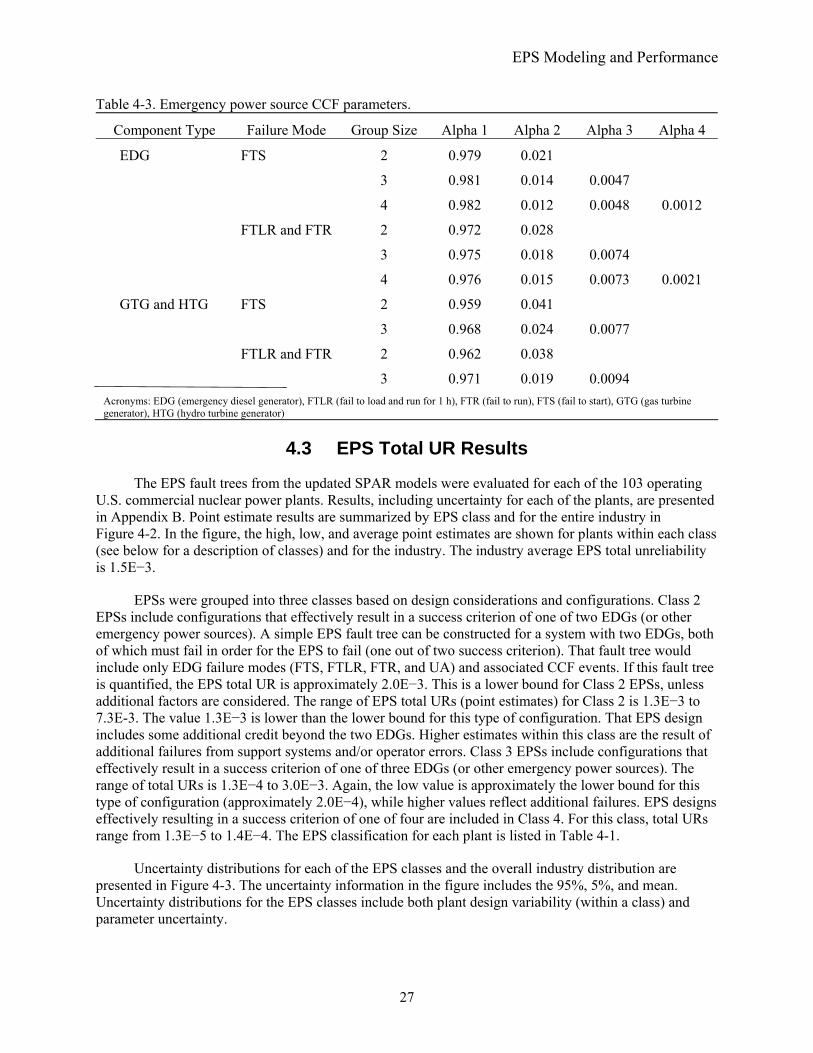
EPS Modeling and Performance
27
Table 4-3. Emergency power source CCF parameters.
Component Type Failure Mode Group Size Alpha 1 Alpha 2 Alpha 3 Alpha 4
EDG 2 0.979 0.021
3 0.981 0.014 0.0047
FTS
4 0.982 0.012 0.0048 0.0012
2 0.972 0.028
3 0.975 0.018 0.0074
FTLR and FTR
4 0.976 0.015 0.0073 0.0021
GTG and HTG 2 0.959 0.041
FTS
3 0.968 0.024 0.0077
2 0.962 0.038
FTLR and FTR
3 0.971 0.019 0.0094 Acronyms: EDG (emergency diesel generator), FTLR (fail to load and run for 1 h), FTR (fail to run), FTS (fail to start), GTG (gas turbine generator), HTG (hydro turbine generator)
4.3 EPS Total UR Results
The EPS fault trees from the updated SPAR models were evaluated for each of the 103 operating U.S. commercial nuclear power plants. Results, including uncertainty for each of the plants, are presented in Appendix B. Point estimate results are summarized by EPS class and for the entire industry in Figure 4-2. In the figure, the high, low, and average point estimates are shown for plants within each class (see below for a description of classes) and for the industry. The industry average EPS total unreliability is 1.5E−3.
EPSs were grouped into three classes based on design considerations and configurations. Class 2 EPSs include configurations that effectively result in a success criterion of one of two EDGs (or other emergency power sources). A simple EPS fault tree can be constructed for a system with two EDGs, both of which must fail in order for the EPS to fail (one out of two success criterion). That fault tree would include only EDG failure modes (FTS, FTLR, FTR, and UA) and associated CCF events. If this fault tree is quantified, the EPS total UR is approximately 2.0E−3. This is a lower bound for Class 2 EPSs, unless additional factors are considered. The range of EPS total URs (point estimates) for Class 2 is 1.3E−3 to 7.3E-3. The value 1.3E−3 is lower than the lower bound for this type of configuration. That EPS design includes some additional credit beyond the two EDGs. Higher estimates within this class are the result of additional failures from support systems and/or operator errors. Class 3 EPSs include configurations that effectively result in a success criterion of one of three EDGs (or other emergency power sources). The range of total URs is 1.3E−4 to 3.0E−3. Again, the low value is approximately the lower bound for this type of configuration (approximately 2.0E−4), while higher values reflect additional failures. EPS designs effectively resulting in a success criterion of one of four are included in Class 4. For this class, total URs range from 1.3E−5 to 1.4E−4. The EPS classification for each plant is listed in Table 4-1.
Uncertainty distributions for each of the EPS classes and the overall industry distribution are presented in Figure 4-3. The uncertainty information in the figure includes the 95%, 5%, and mean. Uncertainty distributions for the EPS classes include both plant design variability (within a class) and parameter uncertainty.
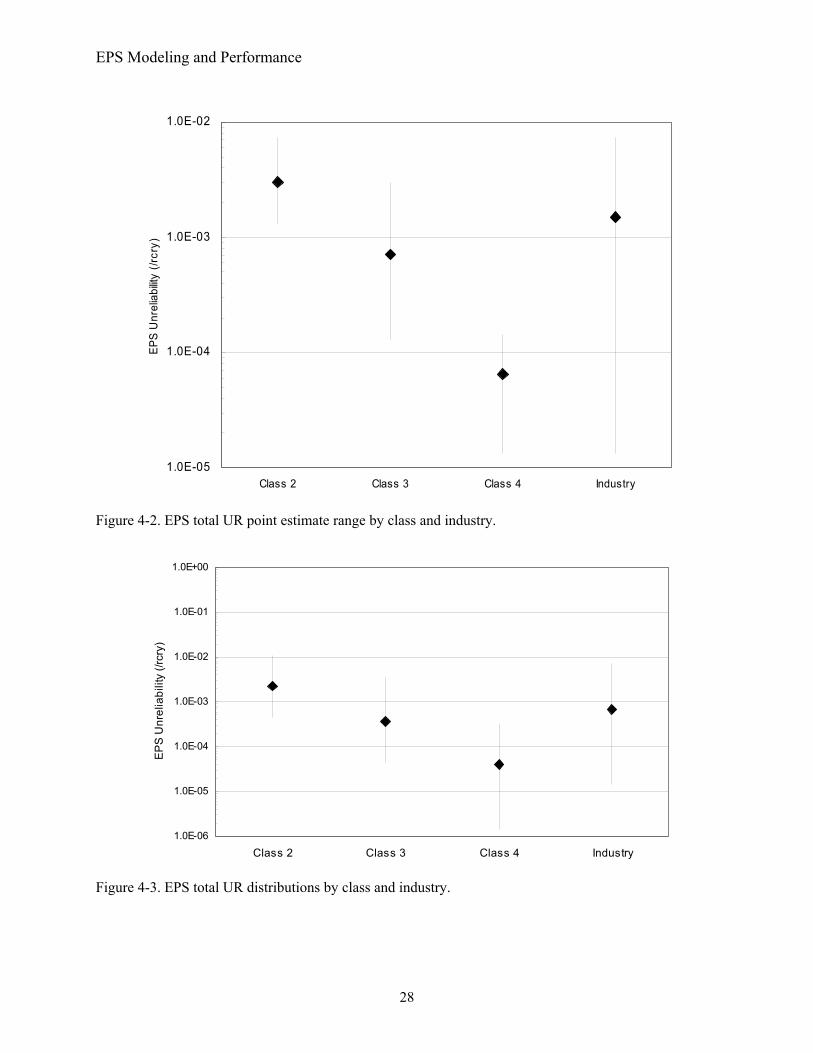
EPS Modeling and Performance
28
1.0E-05
1.0E-04
1.0E-03
1.0E-02
Class 2 Class 3 Class 4 Industry
EPS
Unr
elia
bility
(/rc
ry)
Figure 4-2. EPS total UR point estimate range by class and industry.
1.0E-06
1.0E-05
1.0E-04
1.0E-03
1.0E-02
1.0E-01
1.0E+00
Class 2 Class 3 Class 4 Industry
EPS
Unr
elia
bilit
y (/r
cry)
Figure 4-3. EPS total UR distributions by class and industry.
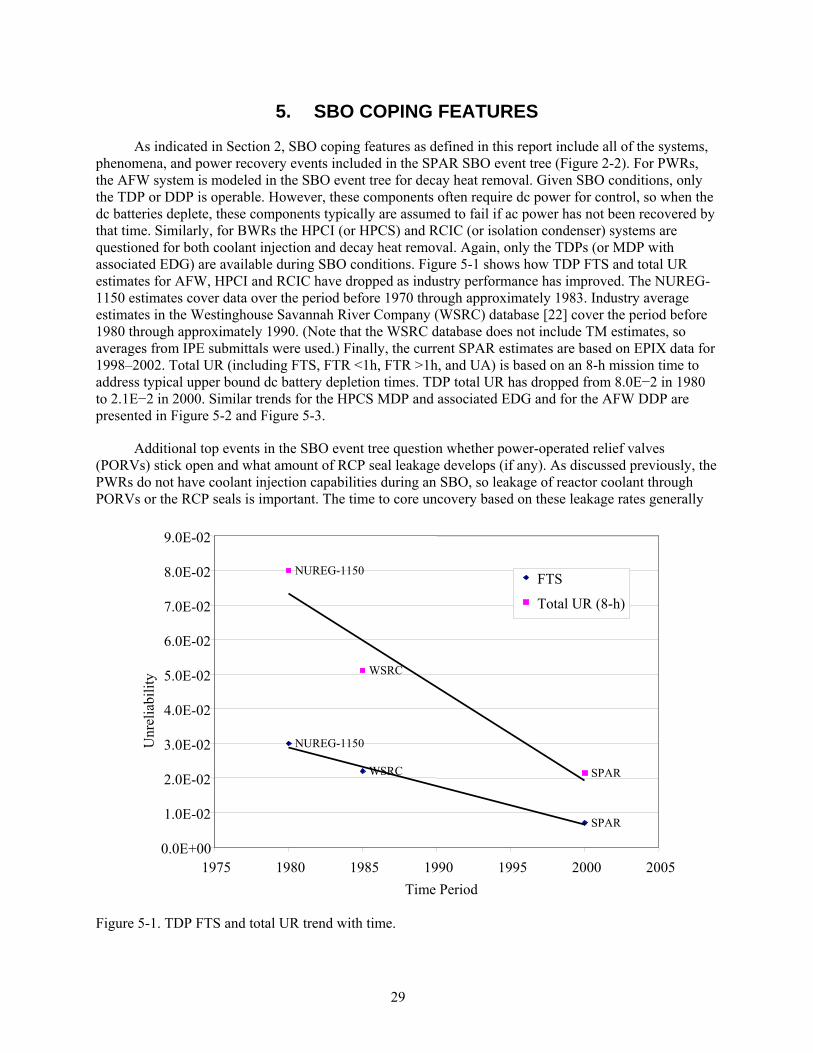
29
5. SBO COPING FEATURES
As indicated in Section 2, SBO coping features as defined in this report include all of the systems, phenomena, and power recovery events included in the SPAR SBO event tree (Figure 2-2). For PWRs, the AFW system is modeled in the SBO event tree for decay heat removal. Given SBO conditions, only the TDP or DDP is operable. However, these components often require dc power for control, so when the dc batteries deplete, these components typically are assumed to fail if ac power has not been recovered by that time. Similarly, for BWRs the HPCI (or HPCS) and RCIC (or isolation condenser) systems are questioned for both coolant injection and decay heat removal. Again, only the TDPs (or MDP with associated EDG) are available during SBO conditions. Figure 5-1 shows how TDP FTS and total UR estimates for AFW, HPCI and RCIC have dropped as industry performance has improved. The NUREG-1150 estimates cover data over the period before 1970 through approximately 1983. Industry average estimates in the Westinghouse Savannah River Company (WSRC) database [22] cover the period before 1980 through approximately 1990. (Note that the WSRC database does not include TM estimates, so averages from IPE submittals were used.) Finally, the current SPAR estimates are based on EPIX data for 1998–2002. Total UR (including FTS, FTR <1h, FTR >1h, and UA) is based on an 8-h mission time to address typical upper bound dc battery depletion times. TDP total UR has dropped from 8.0E−2 in 1980 to 2.1E−2 in 2000. Similar trends for the HPCS MDP and associated EDG and for the AFW DDP are presented in Figure 5-2 and Figure 5-3.
Additional top events in the SBO event tree question whether power-operated relief valves (PORVs) stick open and what amount of RCP seal leakage develops (if any). As discussed previously, the PWRs do not have coolant injection capabilities during an SBO, so leakage of reactor coolant through PORVs or the RCP seals is important. The time to core uncovery based on these leakage rates generally
Figure 5-1. TDP FTS and total UR trend with time.
SPAR
WSRC
NUREG-1150
SPAR
WSRC
NUREG-1150
0.0E+00
1.0E-02
2.0E-02
3.0E-02
4.0E-02
5.0E-02
6.0E-02
7.0E-02
8.0E-02
9.0E-02
1975 1980 1985 1990 1995 2000 2005Time Period
Unr
elia
bilit
y
FTS
Total UR (8-h)
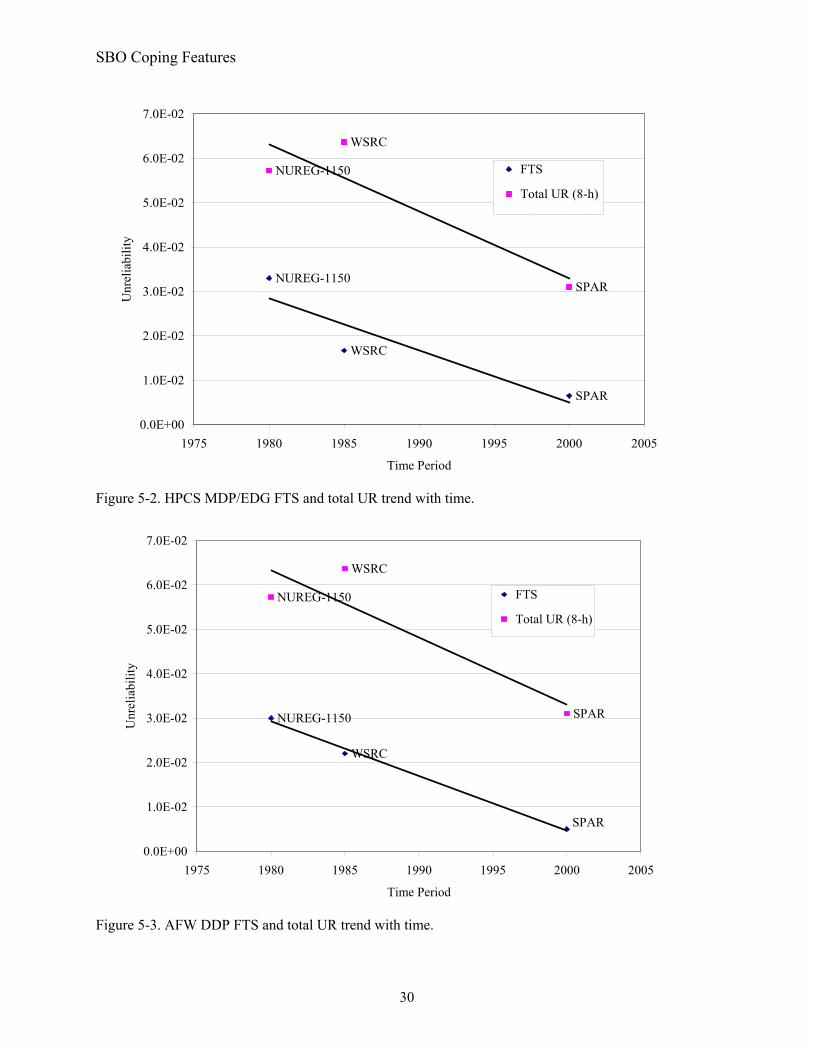
SBO Coping Features
30
SPAR
WSRC
NUREG-1150SPAR
WSRC
NUREG-1150
0.0E+00
1.0E-02
2.0E-02
3.0E-02
4.0E-02
5.0E-02
6.0E-02
7.0E-02
1975 1980 1985 1990 1995 2000 2005
Time Period
Unr
elia
bilit
y
FTS
Total UR (8-h)
i ( S)
Figure 5-2. HPCS MDP/EDG FTS and total UR trend with time.
SPAR
WSRC
NUREG-1150 SPAR
WSRC
NUREG-1150
0.0E+00
1.0E-02
2.0E-02
3.0E-02
4.0E-02
5.0E-02
6.0E-02
7.0E-02
1975 1980 1985 1990 1995 2000 2005
Time Period
Unr
elia
bilit
y
FTS
Total UR (8-h)
Figure 5-3. AFW DDP FTS and total UR trend with time.
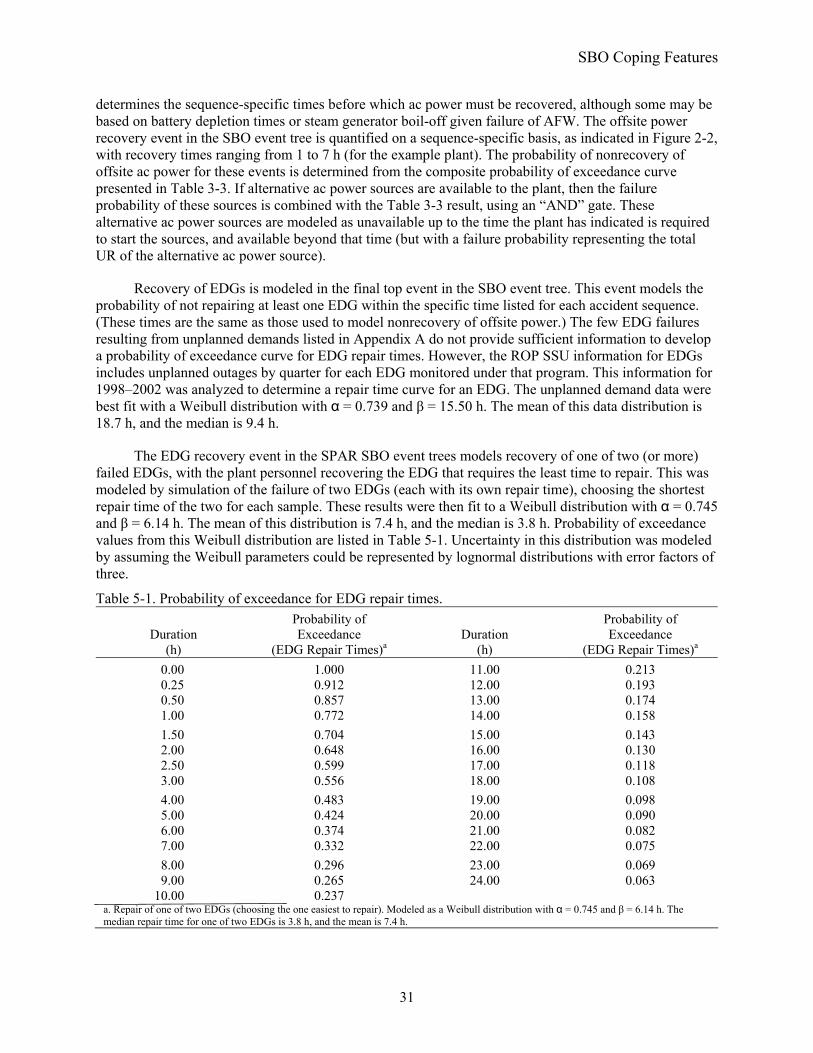
SBO Coping Features
31
determines the sequence-specific times before which ac power must be recovered, although some may be based on battery depletion times or steam generator boil-off given failure of AFW. The offsite power recovery event in the SBO event tree is quantified on a sequence-specific basis, as indicated in Figure 2-2, with recovery times ranging from 1 to 7 h (for the example plant). The probability of nonrecovery of offsite ac power for these events is determined from the composite probability of exceedance curve presented in Table 3-3. If alternative ac power sources are available to the plant, then the failure probability of these sources is combined with the Table 3-3 result, using an “AND” gate. These alternative ac power sources are modeled as unavailable up to the time the plant has indicated is required to start the sources, and available beyond that time (but with a failure probability representing the total UR of the alternative ac power source).
Recovery of EDGs is modeled in the final top event in the SBO event tree. This event models the probability of not repairing at least one EDG within the specific time listed for each accident sequence. (These times are the same as those used to model nonrecovery of offsite power.) The few EDG failures resulting from unplanned demands listed in Appendix A do not provide sufficient information to develop a probability of exceedance curve for EDG repair times. However, the ROP SSU information for EDGs includes unplanned outages by quarter for each EDG monitored under that program. This information for 1998–2002 was analyzed to determine a repair time curve for an EDG. The unplanned demand data were best fit with a Weibull distribution with α = 0.739 and β = 15.50 h. The mean of this data distribution is 18.7 h, and the median is 9.4 h.
The EDG recovery event in the SPAR SBO event trees models recovery of one of two (or more) failed EDGs, with the plant personnel recovering the EDG that requires the least time to repair. This was modeled by simulation of the failure of two EDGs (each with its own repair time), choosing the shortest repair time of the two for each sample. These results were then fit to a Weibull distribution with α = 0.745 and β = 6.14 h. The mean of this distribution is 7.4 h, and the median is 3.8 h. Probability of exceedance values from this Weibull distribution are listed in Table 5-1. Uncertainty in this distribution was modeled by assuming the Weibull parameters could be represented by lognormal distributions with error factors of three.
Table 5-1. Probability of exceedance for EDG repair times.
Duration (h)
Probability of Exceedance
(EDG Repair Times)a Duration
(h)
Probability of Exceedance
(EDG Repair Times)a 0.00 1.000 11.00 0.213 0.25 0.912 12.00 0.193 0.50 0.857 13.00 0.174 1.00 0.772 14.00 0.158 1.50 0.704 15.00 0.143 2.00 0.648 16.00 0.130 2.50 0.599 17.00 0.118 3.00 0.556 18.00 0.108 4.00 0.483 19.00 0.098 5.00 0.424 20.00 0.090 6.00 0.374 21.00 0.082 7.00 0.332 22.00 0.075 8.00 0.296 23.00 0.069 9.00 0.265 24.00 0.063
10.00 0.237 a. Repair of one of two EDGs (choosing the one easiest to repair). Modeled as a Weibull distribution with α = 0.745 and β = 6.14 h. The median repair time for one of two EDGs is 3.8 h, and the mean is 7.4 h.

SBO Coping Features
32
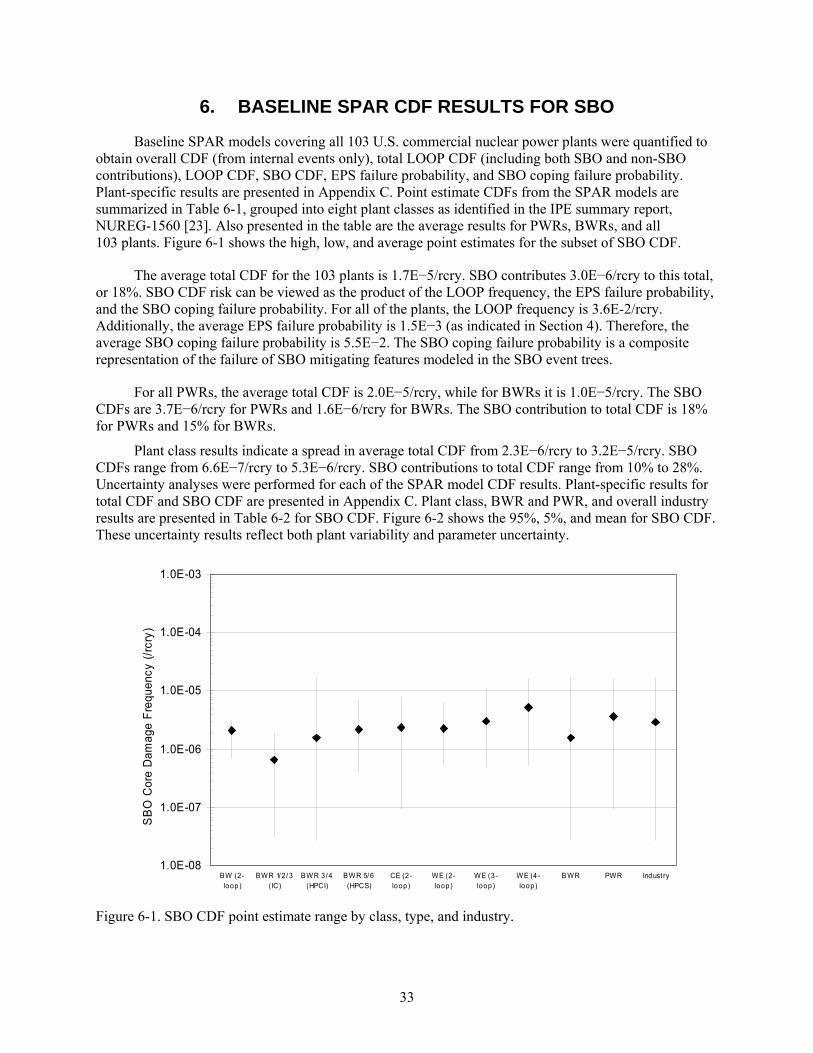
33
6. BASELINE SPAR CDF RESULTS FOR SBO
Baseline SPAR models covering all 103 U.S. commercial nuclear power plants were quantified to obtain overall CDF (from internal events only), total LOOP CDF (including both SBO and non-SBO contributions), LOOP CDF, SBO CDF, EPS failure probability, and SBO coping failure probability. Plant-specific results are presented in Appendix C. Point estimate CDFs from the SPAR models are summarized in Table 6-1, grouped into eight plant classes as identified in the IPE summary report, NUREG-1560 [23]. Also presented in the table are the average results for PWRs, BWRs, and all 103 plants. Figure 6-1 shows the high, low, and average point estimates for the subset of SBO CDF.
The average total CDF for the 103 plants is 1.7E−5/rcry. SBO contributes 3.0E−6/rcry to this total, or 18%. SBO CDF risk can be viewed as the product of the LOOP frequency, the EPS failure probability, and the SBO coping failure probability. For all of the plants, the LOOP frequency is 3.6E-2/rcry. Additionally, the average EPS failure probability is 1.5E−3 (as indicated in Section 4). Therefore, the average SBO coping failure probability is 5.5E−2. The SBO coping failure probability is a composite representation of the failure of SBO mitigating features modeled in the SBO event trees.
For all PWRs, the average total CDF is 2.0E−5/rcry, while for BWRs it is 1.0E−5/rcry. The SBO CDFs are 3.7E−6/rcry for PWRs and 1.6E−6/rcry for BWRs. The SBO contribution to total CDF is 18% for PWRs and 15% for BWRs.
Plant class results indicate a spread in average total CDF from 2.3E−6/rcry to 3.2E−5/rcry. SBO CDFs range from 6.6E−7/rcry to 5.3E−6/rcry. SBO contributions to total CDF range from 10% to 28%. Uncertainty analyses were performed for each of the SPAR model CDF results. Plant-specific results for total CDF and SBO CDF are presented in Appendix C. Plant class, BWR and PWR, and overall industry results are presented in Table 6-2 for SBO CDF. Figure 6-2 shows the 95%, 5%, and mean for SBO CDF. These uncertainty results reflect both plant variability and parameter uncertainty.
1.0E-08
1.0E-07
1.0E-06
1.0E-05
1.0E-04
1.0E-03
BW (2-loop)
BWR 1/2/3(IC)
BWR 3/4(HPCI)
BWR 5/6(HPCS)
CE (2-loop)
WE (2-loop)
WE (3-loop)
WE (4-loop)
B WR PWR Indust ry
SB
O C
ore
Dam
age
Freq
uenc
y (/r
cry)
Figure 6-1. SBO CDF point estimate range by class, type, and industry.
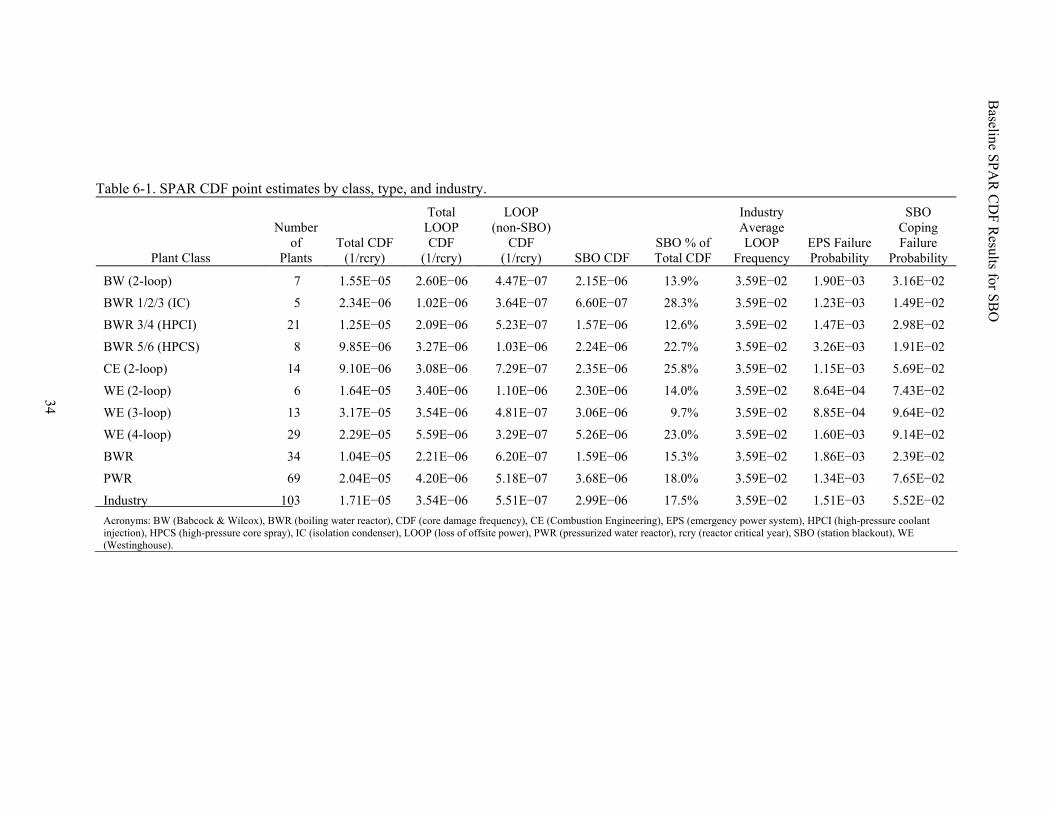
34
Baseline SPA
R C
DF R
esults for SBO
Table 6-1. SPAR CDF point estimates by class, type, and industry.
Plant Class
Number of
Plants Total CDF
(1/rcry)
Total LOOP CDF
(1/rcry)
LOOP (non-SBO)
CDF (1/rcry) SBO CDF
SBO % of Total CDF
Industry Average LOOP
Frequency EPS Failure Probability
SBO Coping Failure
Probability
BW (2-loop) 7 1.55E−05 2.60E−06 4.47E−07 2.15E−06 13.9% 3.59E−02 1.90E−03 3.16E−02
BWR 1/2/3 (IC) 5 2.34E−06 1.02E−06 3.64E−07 6.60E−07 28.3% 3.59E−02 1.23E−03 1.49E−02
BWR 3/4 (HPCI) 21 1.25E−05 2.09E−06 5.23E−07 1.57E−06 12.6% 3.59E−02 1.47E−03 2.98E−02
BWR 5/6 (HPCS) 8 9.85E−06 3.27E−06 1.03E−06 2.24E−06 22.7% 3.59E−02 3.26E−03 1.91E−02
CE (2-loop) 14 9.10E−06 3.08E−06 7.29E−07 2.35E−06 25.8% 3.59E−02 1.15E−03 5.69E−02
WE (2-loop) 6 1.64E−05 3.40E−06 1.10E−06 2.30E−06 14.0% 3.59E−02 8.64E−04 7.43E−02
WE (3-loop) 13 3.17E−05 3.54E−06 4.81E−07 3.06E−06 9.7% 3.59E−02 8.85E−04 9.64E−02
WE (4-loop) 29 2.29E−05 5.59E−06 3.29E−07 5.26E−06 23.0% 3.59E−02 1.60E−03 9.14E−02
BWR 34 1.04E−05 2.21E−06 6.20E−07 1.59E−06 15.3% 3.59E−02 1.86E−03 2.39E−02
PWR 69 2.04E−05 4.20E−06 5.18E−07 3.68E−06 18.0% 3.59E−02 1.34E−03 7.65E−02
Industry 103 1.71E−05 3.54E−06 5.51E−07 2.99E−06 17.5% 3.59E−02 1.51E−03 5.52E−02 Acronyms: BW (Babcock & Wilcox), BWR (boiling water reactor), CDF (core damage frequency), CE (Combustion Engineering), EPS (emergency power system), HPCI (high-pressure coolant injection), HPCS (high-pressure core spray), IC (isolation condenser), LOOP (loss of offsite power), PWR (pressurized water reactor), rcry (reactor critical year), SBO (station blackout), WE (Westinghouse).
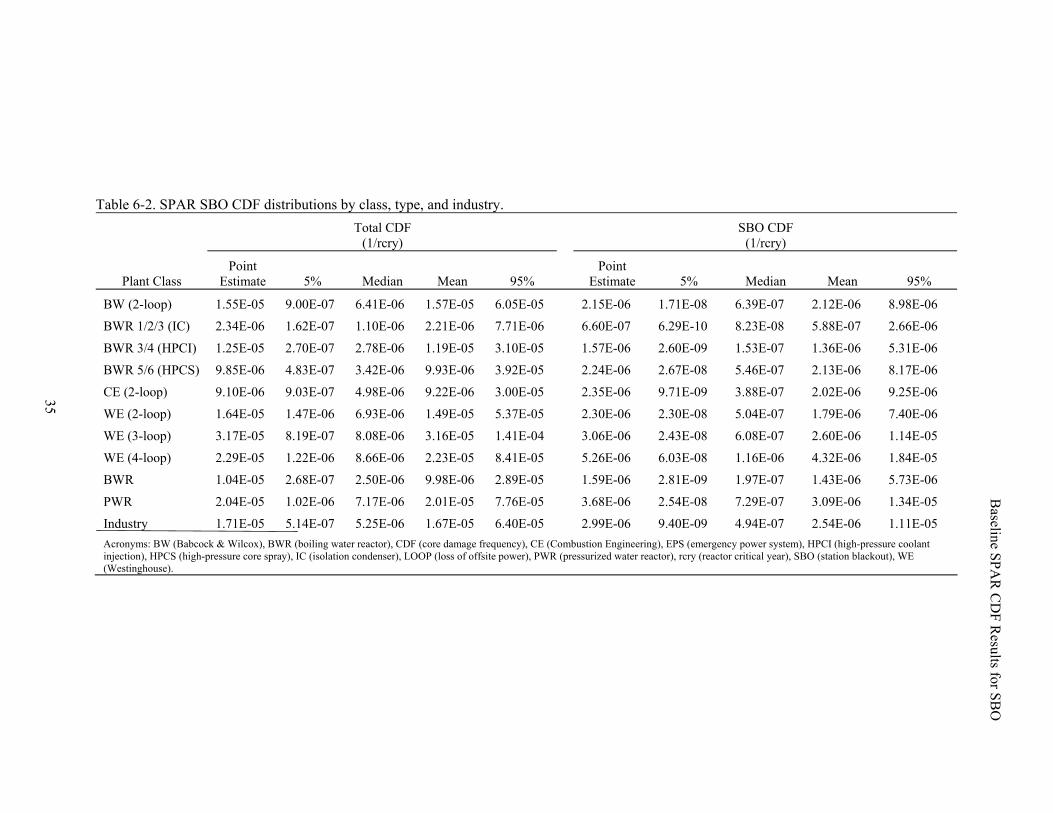
35
Baseline SPA
R C
DF R
esults for SBO
Table 6-2. SPAR SBO CDF distributions by class, type, and industry.
Total CDF
(1/rcry) SBO CDF
(1/rcry)
Plant Class Point
Estimate 5% Median Mean 95% Point
Estimate 5% Median Mean 95%
BW (2-loop) 1.55E-05 9.00E-07 6.41E-06 1.57E-05 6.05E-05 2.15E-06 1.71E-08 6.39E-07 2.12E-06 8.98E-06
BWR 1/2/3 (IC) 2.34E-06 1.62E-07 1.10E-06 2.21E-06 7.71E-06 6.60E-07 6.29E-10 8.23E-08 5.88E-07 2.66E-06
BWR 3/4 (HPCI) 1.25E-05 2.70E-07 2.78E-06 1.19E-05 3.10E-05 1.57E-06 2.60E-09 1.53E-07 1.36E-06 5.31E-06
BWR 5/6 (HPCS) 9.85E-06 4.83E-07 3.42E-06 9.93E-06 3.92E-05 2.24E-06 2.67E-08 5.46E-07 2.13E-06 8.17E-06
CE (2-loop) 9.10E-06 9.03E-07 4.98E-06 9.22E-06 3.00E-05 2.35E-06 9.71E-09 3.88E-07 2.02E-06 9.25E-06
WE (2-loop) 1.64E-05 1.47E-06 6.93E-06 1.49E-05 5.37E-05 2.30E-06 2.30E-08 5.04E-07 1.79E-06 7.40E-06
WE (3-loop) 3.17E-05 8.19E-07 8.08E-06 3.16E-05 1.41E-04 3.06E-06 2.43E-08 6.08E-07 2.60E-06 1.14E-05
WE (4-loop) 2.29E-05 1.22E-06 8.66E-06 2.23E-05 8.41E-05 5.26E-06 6.03E-08 1.16E-06 4.32E-06 1.84E-05
BWR 1.04E-05 2.68E-07 2.50E-06 9.98E-06 2.89E-05 1.59E-06 2.81E-09 1.97E-07 1.43E-06 5.73E-06
PWR 2.04E-05 1.02E-06 7.17E-06 2.01E-05 7.76E-05 3.68E-06 2.54E-08 7.29E-07 3.09E-06 1.34E-05
Industry 1.71E-05 5.14E-07 5.25E-06 1.67E-05 6.40E-05 2.99E-06 9.40E-09 4.94E-07 2.54E-06 1.11E-05 Acronyms: BW (Babcock & Wilcox), BWR (boiling water reactor), CDF (core damage frequency), CE (Combustion Engineering), EPS (emergency power system), HPCI (high-pressure coolant injection), HPCS (high-pressure core spray), IC (isolation condenser), LOOP (loss of offsite power), PWR (pressurized water reactor), rcry (reactor critical year), SBO (station blackout), WE (Westinghouse).
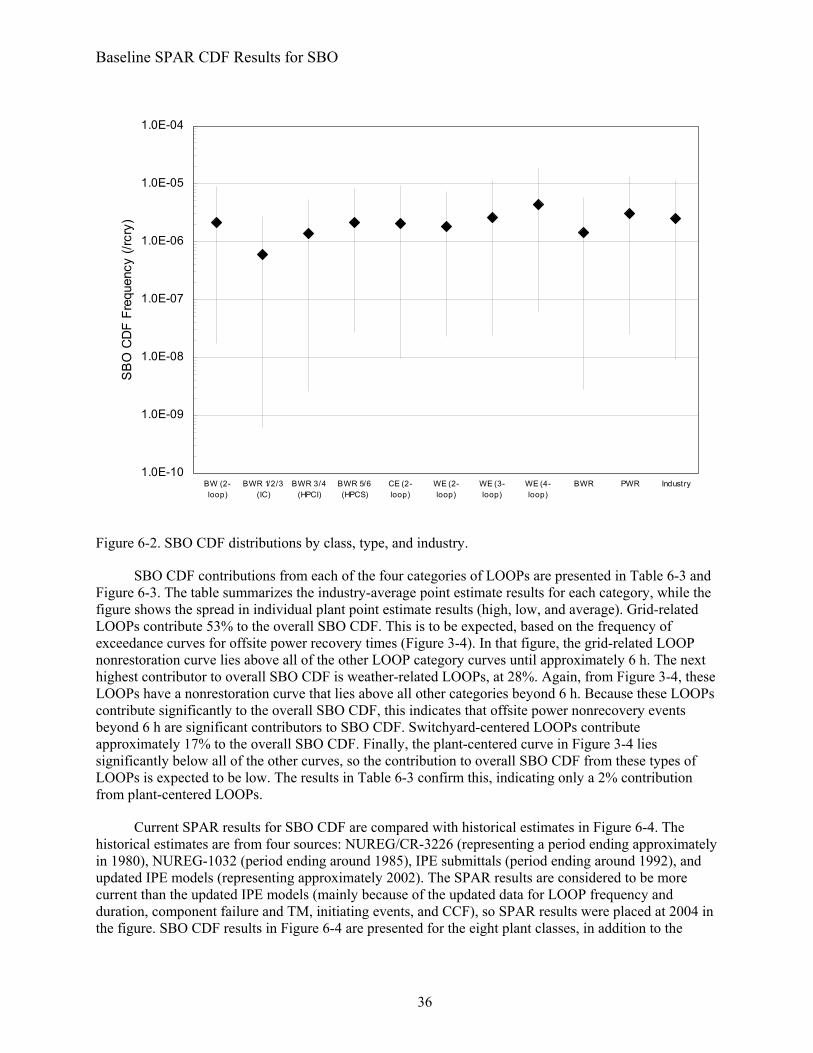
Baseline SPAR CDF Results for SBO
36
1.0E-10
1.0E-09
1.0E-08
1.0E-07
1.0E-06
1.0E-05
1.0E-04
BW (2-loop)
BWR 1/2/3(IC)
BWR 3/4(HPCI)
BWR 5/6(HPCS)
CE (2-loop)
WE (2-loop)
WE (3-loop)
WE (4-loop)
BWR PWR Industry
SB
O C
DF
Freq
uenc
y (/r
cry)
Figure 6-2. SBO CDF distributions by class, type, and industry.
SBO CDF contributions from each of the four categories of LOOPs are presented in Table 6-3 and Figure 6-3. The table summarizes the industry-average point estimate results for each category, while the figure shows the spread in individual plant point estimate results (high, low, and average). Grid-related LOOPs contribute 53% to the overall SBO CDF. This is to be expected, based on the frequency of exceedance curves for offsite power recovery times (Figure 3-4). In that figure, the grid-related LOOP nonrestoration curve lies above all of the other LOOP category curves until approximately 6 h. The next highest contributor to overall SBO CDF is weather-related LOOPs, at 28%. Again, from Figure 3-4, these LOOPs have a nonrestoration curve that lies above all other categories beyond 6 h. Because these LOOPs contribute significantly to the overall SBO CDF, this indicates that offsite power nonrecovery events beyond 6 h are significant contributors to SBO CDF. Switchyard-centered LOOPs contribute approximately 17% to the overall SBO CDF. Finally, the plant-centered curve in Figure 3-4 lies significantly below all of the other curves, so the contribution to overall SBO CDF from these types of LOOPs is expected to be low. The results in Table 6-3 confirm this, indicating only a 2% contribution from plant-centered LOOPs.
Current SPAR results for SBO CDF are compared with historical estimates in Figure 6-4. The historical estimates are from four sources: NUREG/CR-3226 (representing a period ending approximately in 1980), NUREG-1032 (period ending around 1985), IPE submittals (period ending around 1992), and updated IPE models (representing approximately 2002). The SPAR results are considered to be more current than the updated IPE models (mainly because of the updated data for LOOP frequency and duration, component failure and TM, initiating events, and CCF), so SPAR results were placed at 2004 in the figure. SBO CDF results in Figure 6-4 are presented for the eight plant classes, in addition to the
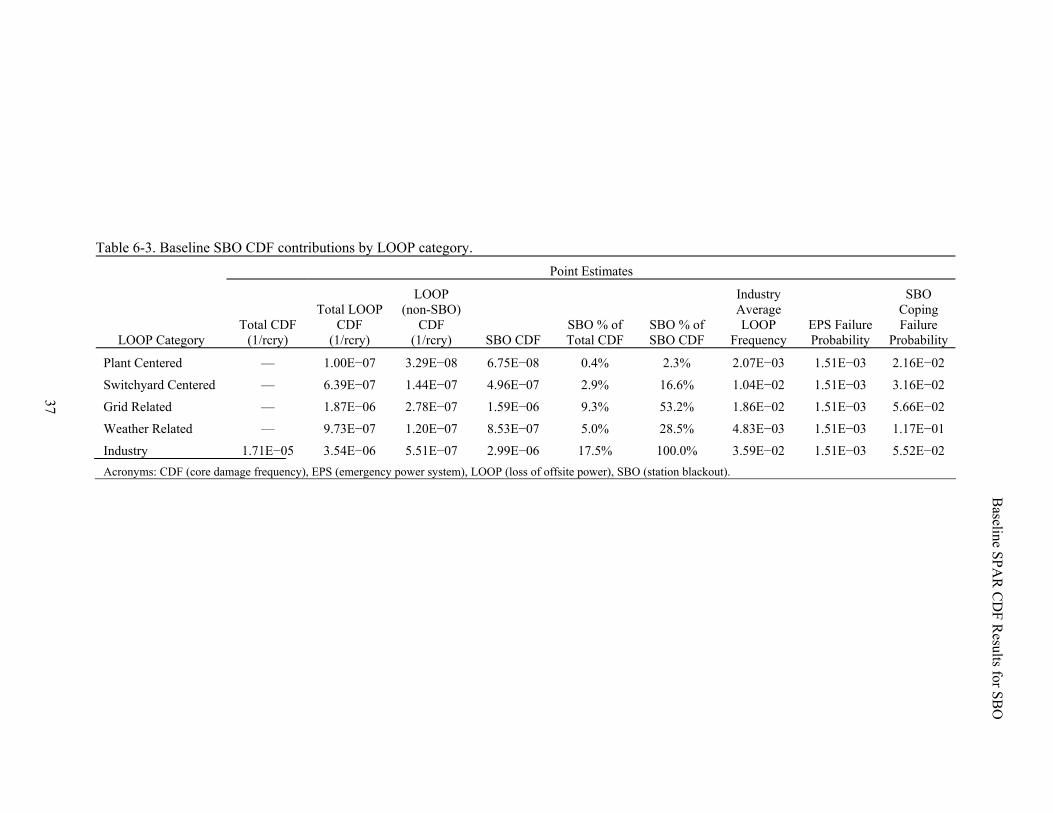
37
Baseline SPA
R C
DF R
esults for SBO
Table 6-3. Baseline SBO CDF contributions by LOOP category.
Point Estimates
LOOP Category Total CDF
(1/rcry)
Total LOOP CDF
(1/rcry)
LOOP (non-SBO)
CDF (1/rcry) SBO CDF
SBO % of Total CDF
SBO % of SBO CDF
Industry Average LOOP
Frequency EPS Failure Probability
SBO Coping Failure
Probability
Plant Centered — 1.00E−07 3.29E−08 6.75E−08 0.4% 2.3% 2.07E−03 1.51E−03 2.16E−02
Switchyard Centered — 6.39E−07 1.44E−07 4.96E−07 2.9% 16.6% 1.04E−02 1.51E−03 3.16E−02
Grid Related — 1.87E−06 2.78E−07 1.59E−06 9.3% 53.2% 1.86E−02 1.51E−03 5.66E−02
Weather Related — 9.73E−07 1.20E−07 8.53E−07 5.0% 28.5% 4.83E−03 1.51E−03 1.17E−01
Industry 1.71E−05 3.54E−06 5.51E−07 2.99E−06 17.5% 100.0% 3.59E−02 1.51E−03 5.52E−02 Acronyms: CDF (core damage frequency), EPS (emergency power system), LOOP (loss of offsite power), SBO (station blackout).
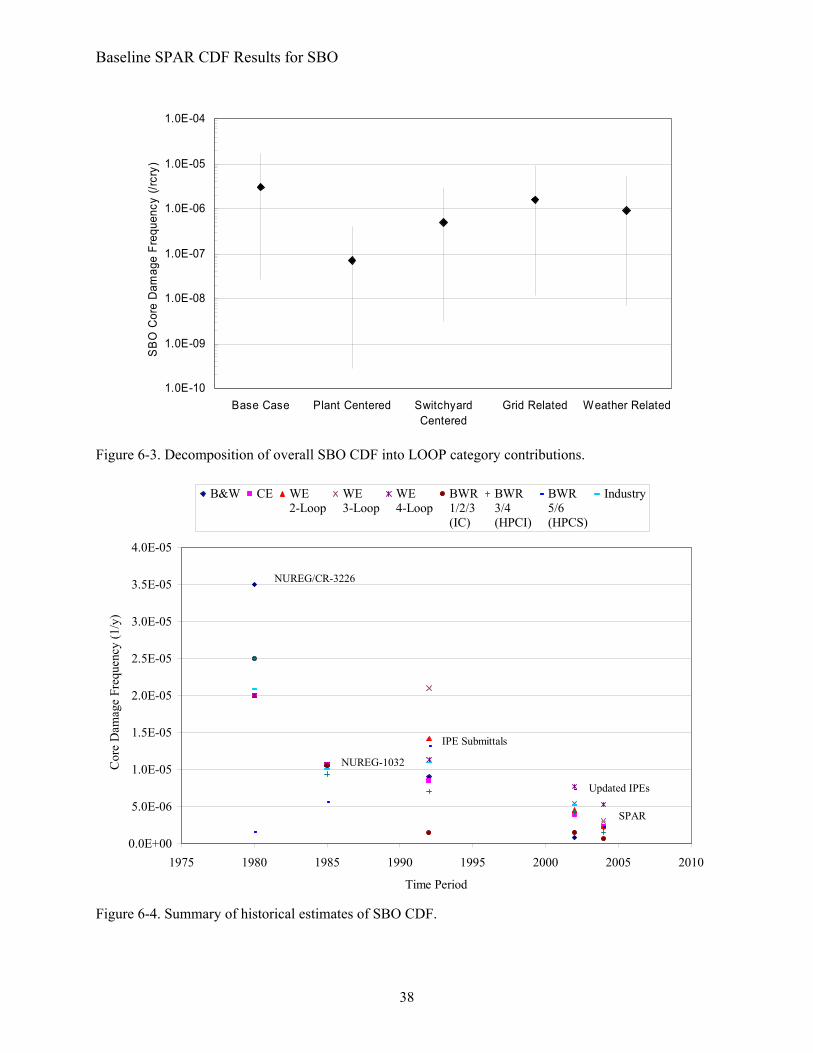
Baseline SPAR CDF Results for SBO
38
1.0E-10
1.0E-09
1.0E-08
1.0E-07
1.0E-06
1.0E-05
1.0E-04
Base Case Plant Centered SwitchyardCentered
Grid Related Weather Related
SB
O C
ore
Dam
age
Freq
uenc
y (/r
cry)
Figure 6-3. Decomposition of overall SBO CDF into LOOP category contributions.
0.0E+00
5.0E-06
1.0E-05
1.5E-05
2.0E-05
2.5E-05
3.0E-05
3.5E-05
4.0E-05
1975 1980 1985 1990 1995 2000 2005 2010
Time Period
Cor
e D
amag
e Fr
eque
ncy
(1/y
)
B&W CE WE2-Loop
WE3-Loop
WE4-Loop
BWR1/2/3(IC)
BWR3/4(HPCI)
BWR5/6(HPCS)
Industry
NUREG/CR-3226
NUREG-1032
IPE Submittals
Updated IPEs
SPAR
Figure 6-4. Summary of historical estimates of SBO CDF.
Baseline SPAR CDF Results for SBO
39
overall average. All of the estimates in Figure 6-4 have been normalized to reflect the 103 plants now in operation. In addition, all results are presented in terms of CDF per reactor critical year, although the earlier estimates were based on CDF per reactor calendar year or per site year. Results in Figure 6-4 show a dramatic reduction in SBO frequency estimates over the years and a corresponding reduction in the spread of estimates for the different plant classes. The overall average SBO CDF from NUREG/CR-3226 is 2.1E-5/rcy, while NUREG-1032 indicated an average of 1.0E-5/rcy. IPE submittals resulted in an average of 1.1E-5/rcy, while updated IPEs indicate an average of 5.2E-6/rcy. (The updated IPE average is actually for total LOOP CDF, rather than SBO CDF. However, the SPAR results indicate that SBO CDF contributes 84% to the total LOOP CDF. Therefore, the results presented in Figure 6-4 for the updated IPE models are probably close to the actual SBO CDF results.) In comparison, the current SPAR result is 3.0E-6/rcry.

Baseline SPAR CDF Results for SBO
40
41
7. SENSITIVITY ANALYSIS RESULTS
Sensitivity analyses were performed to identify what groups of parameters most influence the results and to compare with historical parameters. Sensitivities include four general areas: EDG modeling and performance, offsite power recovery times, seasonal variations, and historical input data. In addition, SBO results were calculated using plant-specific LOOP frequencies. Each of these types of sensitivity analysis is discussed below; the results are summarized in Table 7-1. All sensitivity results presented in this section are point estimates. No uncertainty analyses were performed for the sensitivity cases. Descriptions of the sensitivity case inputs to the SPAR models are presented in Appendix D. All sensitivity case inputs involve changes that remain within the uncertainty distributions of the baseline values, except for the historical parameters case.
To evaluate the sensitivity of the industry SBO CDF baseline results to EDG modeling and performance, four cases were identified. To evaluate the sensitivity to EDG performance, two cases were used, one with all four EDG total UR parameters (FTS, FTLR, FTR, and UA) increased by a factor of two, and the other with all four parameters reduced by a factor of two. These two cases identify how sensitive the SBO CDF results are to increased or degraded EDG performance (relative to the performance reflected in the EPIX data over 1998–2002). If EDG performance degrades by a factor of two (EDG parameters multiplied by two), the industry average SBO CDF increases from 3.0E-6/rcry to 8.2E−6/rcry. If EDG performance is improved by a factor of two (EDG parameters divided by two), the SBO CDF decreases from 3.0E−6/rcry to 1.4E−6/rcry. In the first case, increasing the EDG parameters by a factor of two increases SBO CDF by approximately a factor of three. This behavior is explained by typical cut sets for the EPS fault tree. Because EPSs require more than one EDG to fail in order to fail the system, dominant cut sets involve both CCF events (which increase linearly with increasing EDG failure probability) and combinations of independent EDG failures (which increase by powers of two, three, or four, depending upon the number of EDGs and the success criterion). Therefore, increasing the EDG total UR by a factor of two effectively increases the SBO CDF by a factor of three. However, reducing the EDG total UR by a factor of two does not decrease the SBO CDF by a factor of three (the factor is closer to two) because other EPS failures (support systems and human errors) become significant contributors.
An additional EDG sensitivity case involved approximating a potential increase in EDG TM that could occur for plants with NRC approval for 14-day EDG outages during critical operation. This situation was modeled by assuming such outages occur once every two cycles (36 months). This extra TM outage contribution was added to the baseline probability of 9.0E−3 (which corresponds to approximately 3.3 days/rcry) to obtain a new TM value of 2.3E−2. As indicated in Table 7-1, this sensitivity case increased the SBO CDF from 3.0E−6/rcry to 3.9E−6/rcry.
The final EDG sensitivity case involved changing the EDG mission time in the SPAR models from 24 to 8 h. The updated base SPAR models all use 24 h for the EDG mission times. Changing this mission time to 8 h resulted in the SBO CDF dropping from 3.0E-6/rcry to 1.6E-6/rcry.
All four EDG sensitivity case results are also summarized in Figure 7-1. In that figure, the individual plant SBO CDFs are presented (high, low, and average).
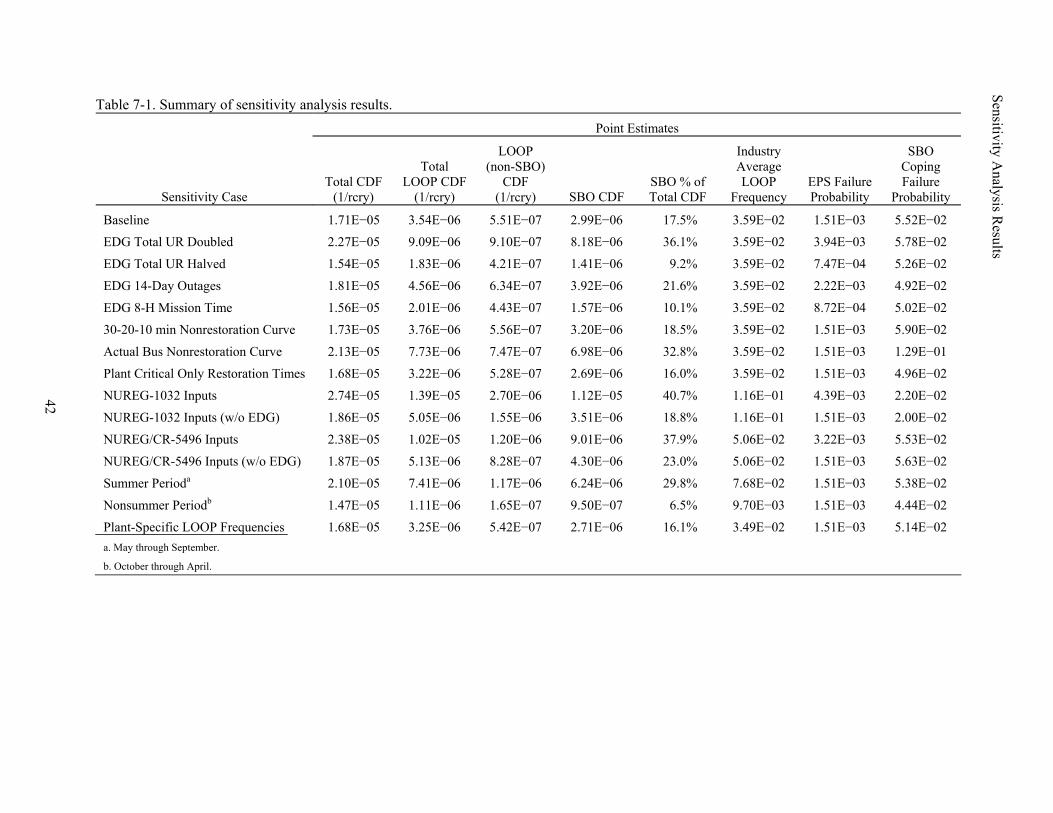
42
Sensitivity Analysis R
esults
Table 7-1. Summary of sensitivity analysis results. Point Estimates
Sensitivity Case Total CDF
(1/rcry)
Total LOOP CDF
(1/rcry)
LOOP (non-SBO)
CDF (1/rcry) SBO CDF
SBO % of Total CDF
Industry Average LOOP
Frequency EPS Failure Probability
SBO Coping Failure
Probability
Baseline 1.71E−05 3.54E−06 5.51E−07 2.99E−06 17.5% 3.59E−02 1.51E−03 5.52E−02
EDG Total UR Doubled 2.27E−05 9.09E−06 9.10E−07 8.18E−06 36.1% 3.59E−02 3.94E−03 5.78E−02
EDG Total UR Halved 1.54E−05 1.83E−06 4.21E−07 1.41E−06 9.2% 3.59E−02 7.47E−04 5.26E−02
EDG 14-Day Outages 1.81E−05 4.56E−06 6.34E−07 3.92E−06 21.6% 3.59E−02 2.22E−03 4.92E−02
EDG 8-H Mission Time 1.56E−05 2.01E−06 4.43E−07 1.57E−06 10.1% 3.59E−02 8.72E−04 5.02E−02
30-20-10 min Nonrestoration Curve 1.73E−05 3.76E−06 5.56E−07 3.20E−06 18.5% 3.59E−02 1.51E−03 5.90E−02
Actual Bus Nonrestoration Curve 2.13E−05 7.73E−06 7.47E−07 6.98E−06 32.8% 3.59E−02 1.51E−03 1.29E−01
Plant Critical Only Restoration Times 1.68E−05 3.22E−06 5.28E−07 2.69E−06 16.0% 3.59E−02 1.51E−03 4.96E−02
NUREG-1032 Inputs 2.74E−05 1.39E−05 2.70E−06 1.12E−05 40.7% 1.16E−01 4.39E−03 2.20E−02
NUREG-1032 Inputs (w/o EDG) 1.86E−05 5.05E−06 1.55E−06 3.51E−06 18.8% 1.16E−01 1.51E−03 2.00E−02
NUREG/CR-5496 Inputs 2.38E−05 1.02E−05 1.20E−06 9.01E−06 37.9% 5.06E−02 3.22E−03 5.53E−02
NUREG/CR-5496 Inputs (w/o EDG) 1.87E−05 5.13E−06 8.28E−07 4.30E−06 23.0% 5.06E−02 1.51E−03 5.63E−02
Summer Perioda 2.10E−05 7.41E−06 1.17E−06 6.24E−06 29.8% 7.68E−02 1.51E−03 5.38E−02
Nonsummer Periodb 1.47E−05 1.11E−06 1.65E−07 9.50E−07 6.5% 9.70E−03 1.51E−03 4.44E−02
Plant-Specific LOOP Frequencies 1.68E−05 3.25E−06 5.42E−07 2.71E−06 16.1% 3.49E−02 1.51E−03 5.14E−02 a. May through September.
b. October through April.
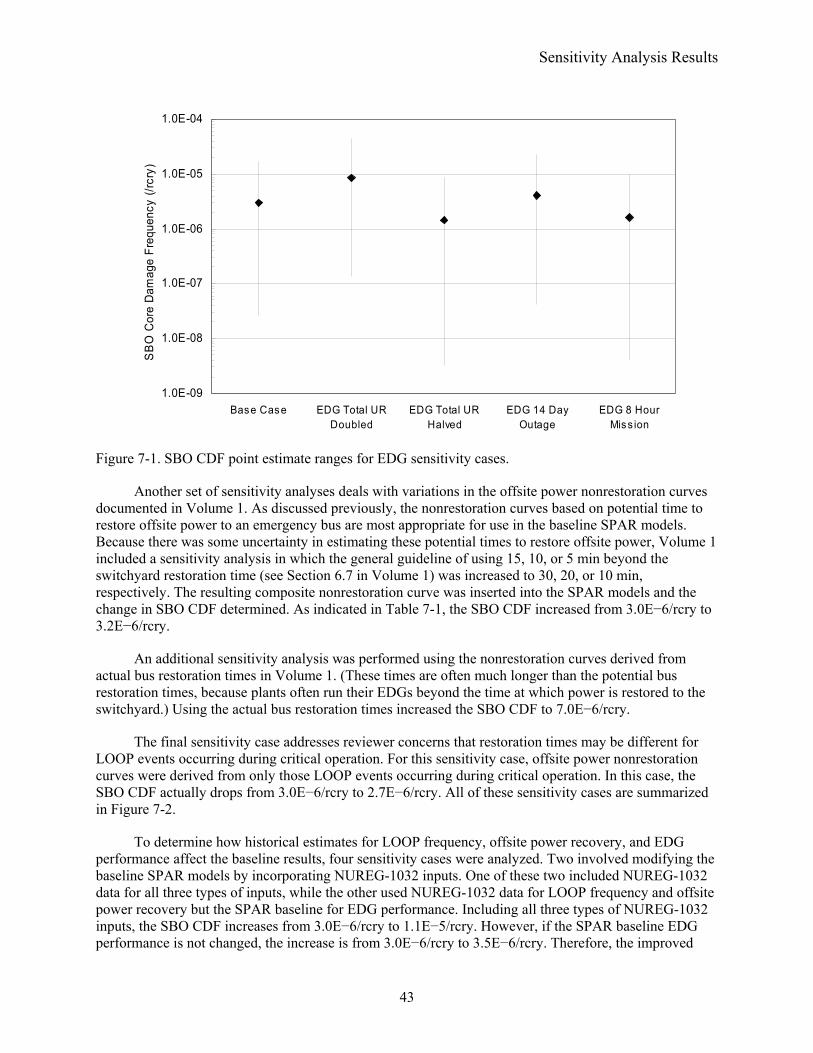
Sensitivity Analysis Results
43
1.0E-09
1.0E-08
1.0E-07
1.0E-06
1.0E-05
1.0E-04
Base Case EDG Total URDoubled
EDG Total URHalved
EDG 14 DayOutage
EDG 8 HourMiss ion
SB
O C
ore
Dam
age
Freq
uenc
y (/r
cry)
Figure 7-1. SBO CDF point estimate ranges for EDG sensitivity cases.
Another set of sensitivity analyses deals with variations in the offsite power nonrestoration curves documented in Volume 1. As discussed previously, the nonrestoration curves based on potential time to restore offsite power to an emergency bus are most appropriate for use in the baseline SPAR models. Because there was some uncertainty in estimating these potential times to restore offsite power, Volume 1 included a sensitivity analysis in which the general guideline of using 15, 10, or 5 min beyond the switchyard restoration time (see Section 6.7 in Volume 1) was increased to 30, 20, or 10 min, respectively. The resulting composite nonrestoration curve was inserted into the SPAR models and the change in SBO CDF determined. As indicated in Table 7-1, the SBO CDF increased from 3.0E−6/rcry to 3.2E−6/rcry.
An additional sensitivity analysis was performed using the nonrestoration curves derived from actual bus restoration times in Volume 1. (These times are often much longer than the potential bus restoration times, because plants often run their EDGs beyond the time at which power is restored to the switchyard.) Using the actual bus restoration times increased the SBO CDF to 7.0E−6/rcry.
The final sensitivity case addresses reviewer concerns that restoration times may be different for LOOP events occurring during critical operation. For this sensitivity case, offsite power nonrestoration curves were derived from only those LOOP events occurring during critical operation. In this case, the SBO CDF actually drops from 3.0E−6/rcry to 2.7E−6/rcry. All of these sensitivity cases are summarized in Figure 7-2.
To determine how historical estimates for LOOP frequency, offsite power recovery, and EDG performance affect the baseline results, four sensitivity cases were analyzed. Two involved modifying the baseline SPAR models by incorporating NUREG-1032 inputs. One of these two included NUREG-1032 data for all three types of inputs, while the other used NUREG-1032 data for LOOP frequency and offsite power recovery but the SPAR baseline for EDG performance. Including all three types of NUREG-1032 inputs, the SBO CDF increases from 3.0E−6/rcry to 1.1E−5/rcry. However, if the SPAR baseline EDG performance is not changed, the increase is from 3.0E−6/rcry to 3.5E−6/rcry. Therefore, the improved
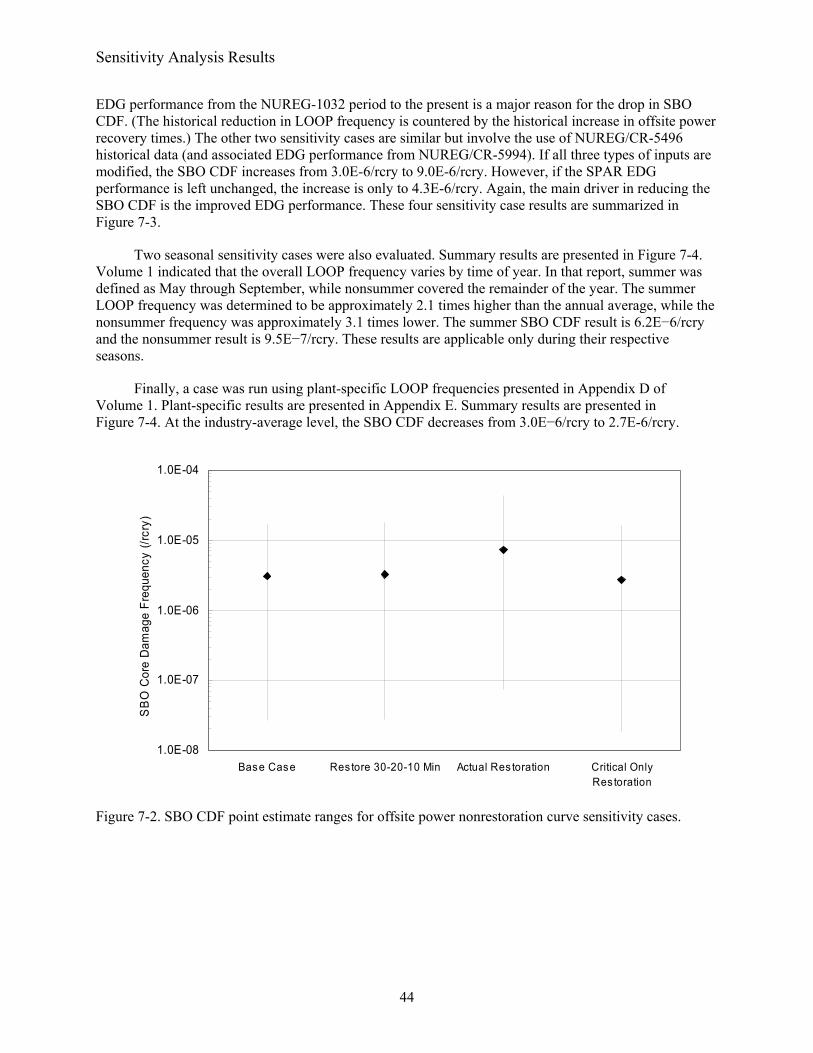
Sensitivity Analysis Results
44
EDG performance from the NUREG-1032 period to the present is a major reason for the drop in SBO CDF. (The historical reduction in LOOP frequency is countered by the historical increase in offsite power recovery times.) The other two sensitivity cases are similar but involve the use of NUREG/CR-5496 historical data (and associated EDG performance from NUREG/CR-5994). If all three types of inputs are modified, the SBO CDF increases from 3.0E-6/rcry to 9.0E-6/rcry. However, if the SPAR EDG performance is left unchanged, the increase is only to 4.3E-6/rcry. Again, the main driver in reducing the SBO CDF is the improved EDG performance. These four sensitivity case results are summarized in Figure 7-3.
Two seasonal sensitivity cases were also evaluated. Summary results are presented in Figure 7-4. Volume 1 indicated that the overall LOOP frequency varies by time of year. In that report, summer was defined as May through September, while nonsummer covered the remainder of the year. The summer LOOP frequency was determined to be approximately 2.1 times higher than the annual average, while the nonsummer frequency was approximately 3.1 times lower. The summer SBO CDF result is 6.2E−6/rcry and the nonsummer result is 9.5E−7/rcry. These results are applicable only during their respective seasons.
Finally, a case was run using plant-specific LOOP frequencies presented in Appendix D of Volume 1. Plant-specific results are presented in Appendix E. Summary results are presented in Figure 7-4. At the industry-average level, the SBO CDF decreases from 3.0E−6/rcry to 2.7E-6/rcry.
1.0E-08
1.0E-07
1.0E-06
1.0E-05
1.0E-04
Base Case Restore 30-20-10 Min Actual Res toration Critical OnlyRes toration
SB
O C
ore
Dam
age
Freq
uenc
y (/r
cry)
Figure 7-2. SBO CDF point estimate ranges for offsite power nonrestoration curve sensitivity cases.
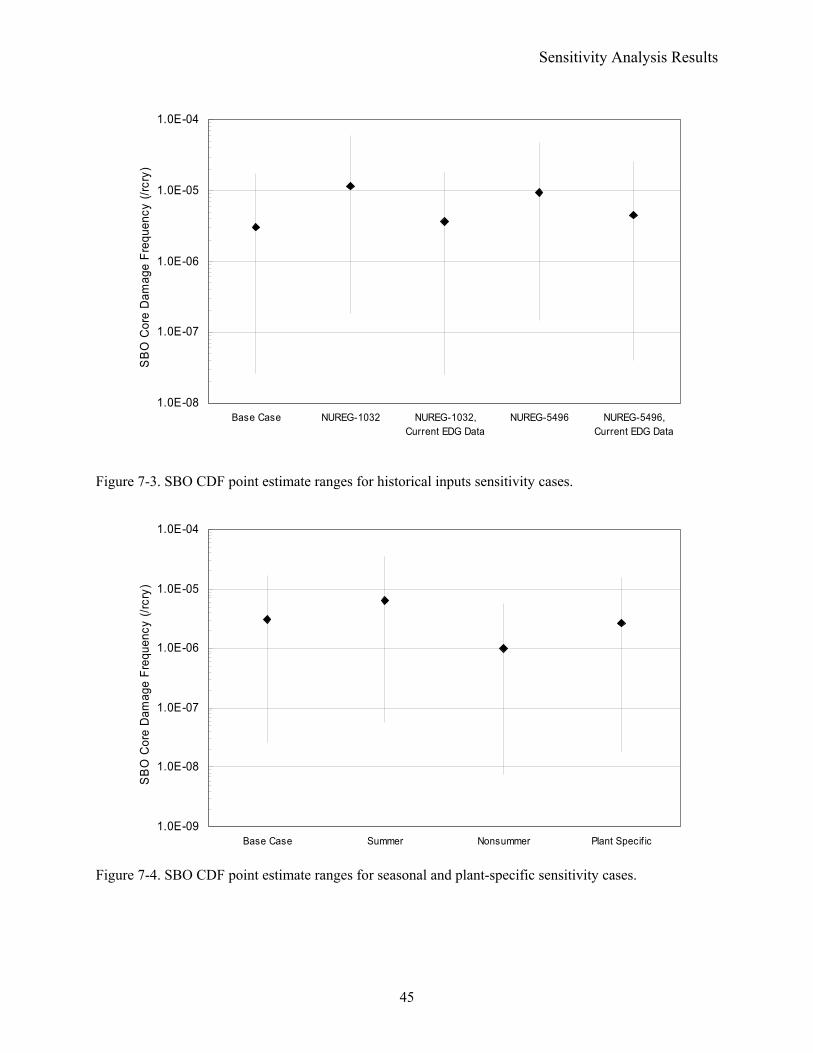
Sensitivity Analysis Results
45
1.0E-08
1.0E-07
1.0E-06
1.0E-05
1.0E-04
Base Case NUREG-1032 NUREG-1032,Current EDG Data
NUREG-5496 NUREG-5496,Current EDG Data
SB
O C
ore
Dam
age
Freq
uenc
y (/r
cry)
Figure 7-3. SBO CDF point estimate ranges for historical inputs sensitivity cases.
1.0E-09
1.0E-08
1.0E-07
1.0E-06
1.0E-05
1.0E-04
Base Case Summer Nonsummer Plant Specif ic
SB
O C
ore
Dam
age
Freq
uenc
y (/r
cry)
Figure 7-4. SBO CDF point estimate ranges for seasonal and plant-specific sensitivity cases.

Sensitivity Analysis Results
46
47
8. SUMMARY AND CONCLUSIONS
This study evaluated the current core damage risk from SBO scenarios at U.S. commercial nuclear power plants. Risk was evaluated for internal events during critical operation. Risk from shutdown operation and LERF risk were not addressed. To accomplish this, the following tasks were successfully completed:
1. Update LOOP and offsite power recovery data and models
2. Enhance the NRC-developed SPAR models covering all 103 U.S. commercial nuclear power plants (as part of the ongoing program to continually improve these models)
3. Update EDG performance data
4. Update modeling and performance data for SBO coping features
5. Quantify the SBO CDF for all 103 plants and summarize the results and sensitivities.
The LOOP frequency and offsite power recovery efforts are documented in Volume 1 of this report. That effort generated up-to-date frequencies for four categories of LOOPs, along with associated nonrecovery (of offsite power) curves versus time. Results indicated that LOOP frequencies have historically trended downward, but the durations of such events increased during the late 1980s and early 1990s and have since been reasonably constant.
To specifically support the SBO effort, SPAR models were enhanced in the following areas: LOOP frequency and offsite power recovery, other initiating event frequencies, RCP seal leakage modeling, basic event data, and CCF data. These enhancements have resulted in SPAR models that are considered up to date in essentially all areas affecting LOOP and SBO predictions of CDF.
To support the development of estimates of current EDG performance, new EDG failure probabilities and rates were developed for FTS, FTLR, FTR, and UA. The FTS, FTLR, and FTR values were derived from EPIX data for 1998–2002. Results were compared with EDG unplanned demand (undervoltage events requiring the EDGs to start, load, and run) information from LERs over 1997–2003. Although the unplanned demand data were shown statistically to not be significantly different from the EPIX data, several issues were identified that merit continued collection and review of such data. EDG UA data were obtained from the ROP SSU for 1998–2002 (planned and unplanned outages only). That result was also compared with unplanned demand data. Finally, a comparison of current EDG UR with previous estimates indicates an historical improving trend.
SBO coping features were defined in this study to include all components, phenomena, and recoveries modeled in the SPAR SBO event trees. For components modeled in these event trees, such as TDPs, HPCS MDPs supported by EDGs, and DDPs, updated performance data were collected and evaluated, similar to what was done for the EDGs. In all cases, the historical URs of these components show improving trends.
Finally, the resulting SPAR models were quantified to obtain total CDF, total LOOP CDF, LOOP (non-SBO) CDF, and SBO CDF. In addition, the EPS failure probabilities were quantified, such that the SBO coping failure probabilities could be determined. Results indicate an industry average SBO CDF (point estimate) of 3.0E−6/rcry. (Individual plant results range from five times higher to 100 times lower than this industry average.) Results were compared with historical estimates of SBO CDF, ranging from approximately 1980 to the present. Again, these historical estimates show improving trends. The historical reduction in SBO CDF is probably the result of many changes—plant modifications made in
Summary and Conclusions
48
response to the SBO rule, improvements in plant risk modeling, and improved component performance. However, the major contributor for this historical reduction appears to be improved EDG performance.
Various sensitivity studies were also performed. As expected, the SBO CDF is sensitive to EDG performance. In addition, Volume 1 identified a significantly higher LOOP frequency during the summer (May through September).
The study identified several potential issues related to the LOOP and SBO results. First, the current LOOP frequency is dominated by the estimate for grid-related LOOPs. The grid-related LOOP frequency is heavily influenced by the August 14, 2003, widespread grid blackout that affected nine plants. Also, 2004 included another grid-related event that affected three plants. Whether such events occur in the future (and if so, at what frequency) might affect the current LOOP frequency. In addition, the comparison of the limited EDG unplanned demand data with EPIX data (used to develop the SPAR EDG failure probabilities and rates) indicated that the unplanned demand performance lies at the 86th percentile of the EDG performance distribution obtained using EPIX data. Although this result lies within the 5th and 95th percentiles of the SPAR EDG performance distribution, the relatively high percentile indicates a potential difference between the two data sets, with the unplanned demand performance potentially being worse than the performance obtained from EPIX (data mainly from tests). To help to resolve this potential issue, additional years of EDG unplanned demand data would be required.
Overall, the study was successful in evaluating SBO CDF risk for U.S. commercial nuclear power plants. A strength of the study was the use of updated SPAR models to cover all 103 plants. In addition, EDG performance was investigated in detail.
49
9. REFERENCES 1. Unresolved Safety Issue, Station Blackout, U.S. Nuclear Regulatory Commission, Task Action
Plan (TAP) A-44, 1979.
2. Kolaczkowski, A. M. and A. C. Payne, Station Blackout Accident Analyses (Part of NRC Task Action Plan A-44), U.S. Nuclear Regulatory Commission, NUREG/CR-3226, May 1983.
3. Baranowsky, P. W., Evaluation of Station Blackout Accidents at Nuclear Power Plants, U.S. Nuclear Regulatory Commission, NUREG-1032, June 1988.
4. 10 CFR 50.63, “Station Blackout,” Code of Federal Regulations, Office of the Federal Register, June 1988.
5. Regulatory Guide (RG) 1.155, Station Blackout, U.S. Nuclear Regulatory Commission, August 1988.
6. Su, T. M. et al., Individual Plant Examination Database – User’s Guide, U.S. Nuclear Regulatory Commission, NUREG-1603, April 1997.
7. “Safety Evaluation By the Office of Nuclear Reactor Regulation, WCAP-15603, Revision 1, WOG 2000 Reactor Coolant Pump Seal Leakage Model for Westinghouse PWRs, Westinghouse Owners Group, Project No. 694,” U.S. Nuclear Regulatory Commission, May 2003.
8. Finnicum, D. J., Model for Failure of RCP Seals Given Loss of Seal Cooling in CE NSSS Plants, Westinghouse Electric Company, WCAP-16175-P, Rev. 0 (proprietary), January 2004.
9. Equipment Performance and Information Exchange System (EPIX), Volume 1 – Instructions for Data Entry, Maintenance Rule, and Reliability Information Module, The Institute of Nuclear Power Operations, INPO 98-001, 1998.
10. Rasmuson, D. M., T. E. Wierman, and K. J. Kvarfordt, “An Overview of the Reliability and Availability Data System (RADS),” International Topical Meeting on Probabilistic Safety Analysis PSA ’05, American Nuclear Society, Inc., 2005.
11. Regulatory Assessment Performance Indicator Guideline, Nuclear Energy Institute, NEI 99-02, March 2000.
12. Reactor Operational Experience Results and Database, http://nrcoe.inel.gov.
13. Marshall, F. M., A. Mosleh, and D. M. Rasmuson, Common-Cause Failure Database and Analysis System: Overview, U.S. Nuclear Regulatory Commission, NUREG/CR-6268, Vol. 1, June 1998.
14. 10 CFR 50.65, “Requirements for Monitoring the Effectiveness of Maintenance at Nuclear Power Plants,” Code of Federal Regulations, Office of the Federal Register, 1999.
15. Reactor Oversight Process, U.S. Nuclear Regulatory Commission, NUREG-1649, July 2000.
References
50
16. Diablo Canyon 1 & 2 Revision 3 SPAR Model (DCAN_3.10.exe), December 10, 2004,
http://saphire.inel.gov.
17. Poloski, J. P. et al., Rates of Initiating Events at U.S. Nuclear Power Plants: 1987–1995, U.S. Nuclear Regulatory Commission, NUREG/CR-5750, February 1999.
18. Atwood, C. L. et al., Evaluation of Loss of Offsite Power Events at Nuclear Power Plants: 1980–1996, U.S. Nuclear Regulatory Commission, NUREG/CR-5496, November 1998.
19. Reactor Safety Study: An Assessment of Accident Risks in U.S. Commercial Nuclear Power Plants, U.S. Nuclear Regulatory Commission, NUREG 75/014 (WASH-1400), 1975.
20. Ericson, E. M. et al., Analysis of Core Damage Frequency: Internal Events Methodology, U.S. Nuclear Regulatory Commission, NUREG/CR-4550, Vol. 1, Rev. 1, January 1990.
21. Samanta, P. et al., Emergency Diesel Generator: Maintenance and Failure Unavailability, and Their Risk Impacts, U.S. Nuclear Regulatory Commission, NUREG/CR-5994, November 1994.
22. Blanton, C. H. and S. A. Eide, Savannah River Site Generic Data Base Development (U), Westinghouse Savannah River Company, WSRC-TR-93-262, June 1993.
23. Individual Plant Examination Program: Perspectives on Reactor Safety and Plant Performance, U.S. Nuclear Regulatory Commission, NUREG-1560, December 1997.
51
10. GLOSSARY
Actual bus restoration time—the duration, in minutes, from event initiation until offsite electrical power is restored to a safety bus. This is the actual time taken to restore offsite power from the first available source to a safety bus.
Extreme-weather-related loss of offsite power event—a LOOP event caused by extreme weather. Examples of extreme weather are hurricanes, strong winds greater than 125 miles per hour, and tornadoes. Extreme-weather-related LOOP events are also distinguished from severe-weather-related LOOP events by their potential to cause significant damage to the electrical transmission system and long offsite power restoration times. Extreme-weather-related events are included in the weather-related events category in this volume.
Grid-related loss of offsite power event—a LOOP event in which the initial failure occurs in the interconnected transmission grid that is outside the direct control of plant personnel. Failures that involve transmission lines from the site switchyard are usually classified as switchyard-centered events if plant personnel can take actions to restore power when the fault is cleared. However, the event should be classified as grid related if the transmission lines fail from voltage or frequency instabilities, overload, or other causes that require restoration efforts or corrective action by the transmission operator.
Loss of offsite power (LOOP) event—the simultaneous loss of electrical power to all unit safety buses (also referred to as emergency buses, Class 1E buses, and vital buses) requiring all emergency power generators to start and supply power to the safety buses. The nonessential buses may also be de-energized as a result of this.
Plant-centered loss of offsite power event—a LOOP event in which the design and operational characteristics of the nuclear power plant unit itself play the major role in the cause and duration of the loss of offsite power. Plant-centered failures typically involve hardware failures, design deficiencies, human errors, and localized weather-induced faults such as lightning. The line of demarcation between plant-centered and switchyard-centered events is the nuclear power plant main and station power transformers high-voltage terminals.
Potential bus recovery time—the duration, in minutes, from the event initiation until offsite electrical power could have been recovered to a safety bus. This estimated time is less than or equal to the actual bus restoration time.
Severe-weather-related loss of offsite power event—a LOOP event caused by severe weather, in which the weather was widespread, not just centered on the site, and capable of major disruption. Severe weather is defined to be weather with forceful and nonlocalized effects. A LOOP is classified as a severe-weather event if it was judged that the weather was widespread, not just centered at the power plant site, and capable of major disruption. An example is storm damage to transmission lines instead of just debris blown into a transformer. This does not mean that the event had to actually result in widespread damage, as long as the potential was there. Examples of severe weather include thunderstorms, snow, and ice storms. Lightning strikes, though forceful, are normally localized to one unit, and so are coded as plant centered or switchyard centered. LOOP events involving hurricanes, strong winds greater than 125 miles per hour, and tornadoes are included in a separate category—extreme-weather-related LOOPs. Severe-weather-related events are included in the weather-related category in this volume.
Glossary
52
Station blackout (SBO)—the complete loss of ac power to safety buses in a nuclear power plant unit. Station blackout involves the loss of offsite power concurrent with the failure of the onsite emergency ac power system. It does not include the loss of available ac power to safety buses fed by station batteries through inverters or successful high pressure core spray operation.
Switchyard-centered loss of offsite power event—a LOOP event in which the equipment, or human-induced failures of equipment, in the switchyard play the major role in the loss of offsite power. The line of demarcation between switchyard-related events and grid-related events is the output bus bar in the switchyard.
Switchyard restoration time—the duration, in minutes, from event initiation until offsite electrical power is actually restored (or could have been restored, whichever time is shorter) to the switchyard. Such items as no further interruptions to the switchyard, adequacy of the frequency and voltage levels to the switchyard, and no transients that could be disruptive to plant electrical equipment should be considered in determining the time.
Total unreliability—the probability of a component failing to accomplish its mission because of either unreliability or unavailability.
Unavailability (UA)—the probability of a component failing to accomplish its mission because it is unavailable when demanded due to being in a test configuration or undergoing maintenance or repair. UA events are identified as test and maintenance outage (TM) events in the SPAR models. UA (or TM) is also identified as maintenance out of service (MOOS) in the NRC system studies.
Unreliability (UR)—the probability of a component failing to accomplish its mission because of either failure to start or failure to run (over a specified mission time). For components that must start and run, UR includes fail to start (FTS), failure to run for the first hour (FTR <1 h), and failure to run for the remainder of the mission time (FTR >1 h). The emergency diesel generators are a special case in that the FTR <1 h failure mode is replaced by a similar event—failure to load and run for 1 h (FTLR).
Weather-related loss of offsite power event—a LOOP event caused by severe or extreme weather.
A-1
Appendix A
Use of Emergency Diesel Generator Unplanned Demand History (1997–2003)
for Data Validation

Appendix A
A-2
Appendix A
A-3
CONTENTS
A-1. LER DATA, 1997–2003..............................................................................................................A-7
A-2. COMPARISONS OF LER AND SPAR DATA........................................................................A-16
A-3. SUBSETS OF 1997–2003 EDG EVENTS................................................................................A-20
A-4. REFERENCES ..........................................................................................................................A-35
TABLES
A-1. SPAR emergency power source failure parameters and supporting data ....................................A-6
A-2. EDG unplanned demands and failures (1997–2003) ...................................................................A-8
A-3. EDG demand and failure data summary ....................................................................................A-15
A-4. Tests of whether the LER rates exceed the EPIX rates (if the rates were constant) ..................A-17
A-5. Comparison with previous study ...............................................................................................A-19
A-6. EDG unplanned demands and failures during critical operation (1997–2003)..........................A-21
A-7. EDG unplanned demands and failures from LOOP events (1997–2003)..................................A-25
A-8. EDG unplanned demands and failures from LOOP events during critical operation (1997–2003)...................................................................................................A-29
A-9. EDG unplanned demands and failures during shutdown operations (1997–2003)....................A-31

Appendix A
A-4
A-5
Appendix A
Use of Emergency Diesel Generator Unplanned Demand History (1997–2003)
for Data Validation Emergency diesel generator (EDG) unplanned demand data were identified for comparison with
data from the Standardized Plant Analysis Risk (SPAR) models used in the emergency power system (EPS) unreliability calculations for this report. The data were used to validate the SPAR data usage. Both the data and the validation analyses are described in this appendix.
The EDG failure modes in the SPAR models are failure to start (FTS), failure to load and run for 1 h (FTLR), failure to run (beyond 1 h) (FTR), and test and maintenance (TM) outage. In this report, component unreliability (UR) is defined to include FTS, FTLR, and FTR. These data were obtained from Equipment Performance Information Exchange (EPIX) for 1998–2002, using the Reliability and Availability Database System (RADS) software. Unavailability (UA) is defined as the TM contribution. EDG UA data are from the Reactor Oversight Process (ROP) Safety System Unavailability (SSU) indicator reports. Finally, total component UR is defined to include both UR and UA. The industry-level SPAR data are presented in the leftmost columns in Table A-1.
For the SPAR data evaluations, EDG unplanned demands involving bus undervoltage were identified from licensee event reports (LERs) for the period 1997–2003 from U.S. commercial nuclear power plants. Those events are listed in Section A-1. Section A-1 also contains a summary of the LER data.
Information from the LER summary carries over in the rightmost columns of Table A-1. Comparisons of the data sets are described in Section A-2.
Section A-3 contains listings of selected subsets from the LER event descriptions, for reference.
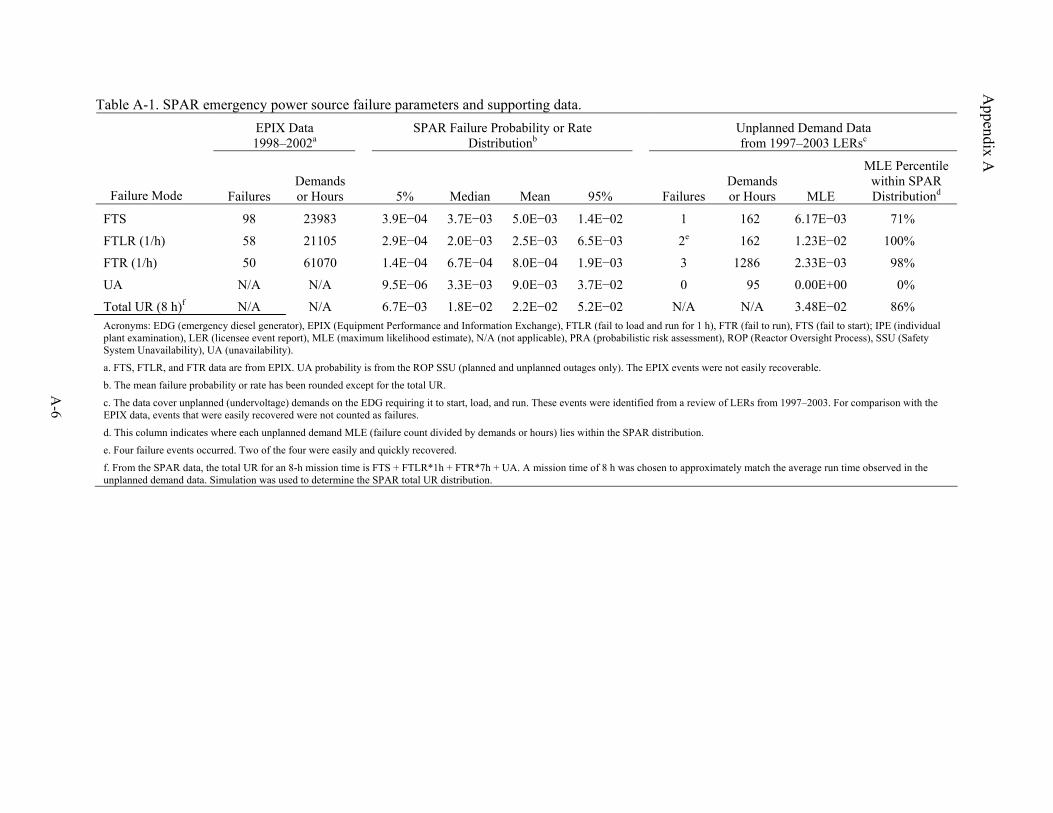
A-6
Table A-1. SPAR emergency power source failure parameters and supporting data.
EPIX Data 1998–2002a
SPAR Failure Probability or Rate Distributionb
Unplanned Demand Data from 1997–2003 LERsc
Failure Mode Failures Demands or Hours 5% Median Mean 95% Failures
Demands or Hours MLE
MLE Percentile within SPAR Distributiond
FTS 98 23983 3.9E−04 3.7E−03 5.0E−03 1.4E−02 1 162 6.17E−03 71%
FTLR (1/h) 58 21105 2.9E−04 2.0E−03 2.5E−03 6.5E−03 2e 162 1.23E−02 100%
FTR (1/h) 50 61070 1.4E−04 6.7E−04 8.0E−04 1.9E−03 3 1286 2.33E−03 98%
UA N/A N/A 9.5E−06 3.3E−03 9.0E−03 3.7E−02 0 95 0.00E+00 0%
Total UR (8 h)f N/A N/A 6.7E−03 1.8E−02 2.2E−02 5.2E−02 N/A N/A 3.48E−02 86% Acronyms: EDG (emergency diesel generator), EPIX (Equipment Performance and Information Exchange), FTLR (fail to load and run for 1 h), FTR (fail to run), FTS (fail to start); IPE (individual plant examination), LER (licensee event report), MLE (maximum likelihood estimate), N/A (not applicable), PRA (probabilistic risk assessment), ROP (Reactor Oversight Process), SSU (Safety System Unavailability), UA (unavailability).
a. FTS, FTLR, and FTR data are from EPIX. UA probability is from the ROP SSU (planned and unplanned outages only). The EPIX events were not easily recoverable.
b. The mean failure probability or rate has been rounded except for the total UR.
c. The data cover unplanned (undervoltage) demands on the EDG requiring it to start, load, and run. These events were identified from a review of LERs from 1997–2003. For comparison with the EPIX data, events that were easily recovered were not counted as failures.
d. This column indicates where each unplanned demand MLE (failure count divided by demands or hours) lies within the SPAR distribution.
e. Four failure events occurred. Two of the four were easily and quickly recovered.
f. From the SPAR data, the total UR for an 8-h mission time is FTS + FTLR*1h + FTR*7h + UA. A mission time of 8 h was chosen to approximately match the average run time observed in the unplanned demand data. Simulation was used to determine the SPAR total UR distribution.
Appendix A
Appendix A
A-7
A-1. LER DATA, 1997–2003
Table A-2 lists all the undervoltage events that required the EDG to start, load, and run for the 1997–2003 period. The events are sorted by event date. The column headings in the tables are defined as follows:
LER Number—The LER number describing the EDG event. If the number ends in “000”, there is no LER.
Event Date—The date of the EDG demand and/or failure event.
Plant Name—The name of the plant experiencing the EDG event.
Plant Status—Critical events are demands that occurred during critical operation, while shutdown events are demands that occurred during shutdown operation.
Demands—The number of EDGs demanded at that time.
Run Time—The time in minutes that each demanded EDG ran.
Run Time Certainty—The degree of information that was available in the LER to accurately determine the run time. “C” if the analyst was certain, “U” if the analyst was uncertain. In general, if the run time was uncertain and no other information was available, 30 min was assumed.
Run Time (>60 min)—The number of run time minutes greater than 60 min. This is the run time used for the fail-to-run (FTR) failure mode.
EDG FTS—The number of observed fail-to-start (FTS) failures of the EDG.
EDG FTLR—The number of observed fail-to-load-and-run (FTLR) failures of the EDG.
EDG FTR—The number of observed FTR failures of the EDG.
EDG MOOS—The number of observed maintenance out-of-service (MOOS) failures of the EDG.
LOOP?—Did a LOOP cause the demand.
Comments—Explanatory notes about the event.
Table A-3 provides a summary of the unplanned demands and failures from Table A-2.
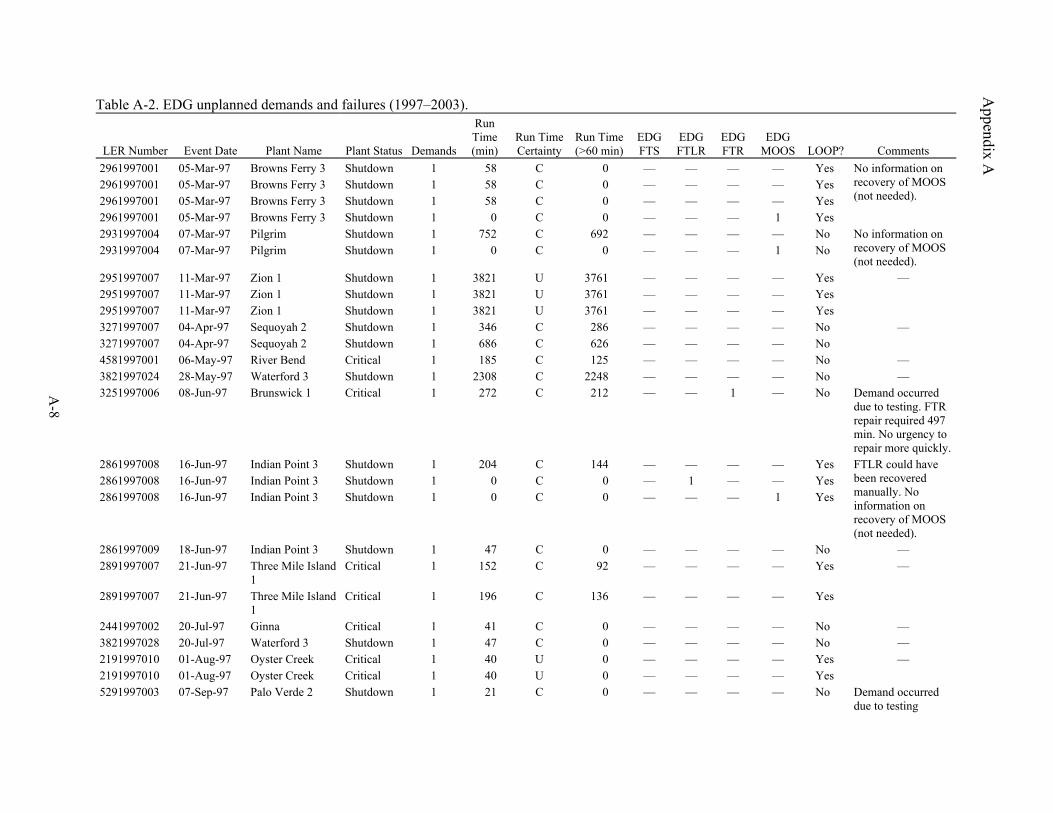
A-8
Table A-2. EDG unplanned demands and failures (1997–2003).
LER Number Event Date Plant Name Plant Status Demands
Run Time (min)
Run Time Certainty
Run Time (>60 min)
EDG FTS
EDG FTLR
EDG FTR
EDG MOOS LOOP? Comments
2961997001 05-Mar-97 Browns Ferry 3 Shutdown 1 58 C 0 — — — — Yes 2961997001 05-Mar-97 Browns Ferry 3 Shutdown 1 58 C 0 — — — — Yes 2961997001 05-Mar-97 Browns Ferry 3 Shutdown 1 58 C 0 — — — — Yes 2961997001 05-Mar-97 Browns Ferry 3 Shutdown 1 0 C 0 — — — 1 Yes
No information on recovery of MOOS (not needed).
2931997004 07-Mar-97 Pilgrim Shutdown 1 752 C 692 — — — — No 2931997004 07-Mar-97 Pilgrim Shutdown 1 0 C 0 — — — 1 No
No information on recovery of MOOS (not needed).
2951997007 11-Mar-97 Zion 1 Shutdown 1 3821 U 3761 — — — — Yes 2951997007 11-Mar-97 Zion 1 Shutdown 1 3821 U 3761 — — — — Yes 2951997007 11-Mar-97 Zion 1 Shutdown 1 3821 U 3761 — — — — Yes
—
3271997007 04-Apr-97 Sequoyah 2 Shutdown 1 346 C 286 — — — — No 3271997007 04-Apr-97 Sequoyah 2 Shutdown 1 686 C 626 — — — — No
—
4581997001 06-May-97 River Bend Critical 1 185 C 125 — — — — No — 3821997024 28-May-97 Waterford 3 Shutdown 1 2308 C 2248 — — — — No — 3251997006 08-Jun-97 Brunswick 1 Critical 1 272 C 212 — — 1 — No Demand occurred
due to testing. FTR repair required 497 min. No urgency to repair more quickly.
2861997008 16-Jun-97 Indian Point 3 Shutdown 1 204 C 144 — — — — Yes 2861997008 16-Jun-97 Indian Point 3 Shutdown 1 0 C 0 — 1 — — Yes 2861997008 16-Jun-97 Indian Point 3 Shutdown 1 0 C 0 — — — 1 Yes
FTLR could have been recovered manually. No information on recovery of MOOS (not needed).
2861997009 18-Jun-97 Indian Point 3 Shutdown 1 47 C 0 — — — — No — 2891997007 21-Jun-97 Three Mile Island
1 Critical 1 152 C 92 — — — — Yes
2891997007 21-Jun-97 Three Mile Island 1
Critical 1 196 C 136 — — — — Yes
—
2441997002 20-Jul-97 Ginna Critical 1 41 C 0 — — — — No — 3821997028 20-Jul-97 Waterford 3 Shutdown 1 47 C 0 — — — — No — 2191997010 01-Aug-97 Oyster Creek Critical 1 40 U 0 — — — — Yes 2191997010 01-Aug-97 Oyster Creek Critical 1 40 U 0 — — — — Yes
—
5291997003 07-Sep-97 Palo Verde 2 Shutdown 1 21 C 0 — — — — No Demand occurred due to testing
Appendix A
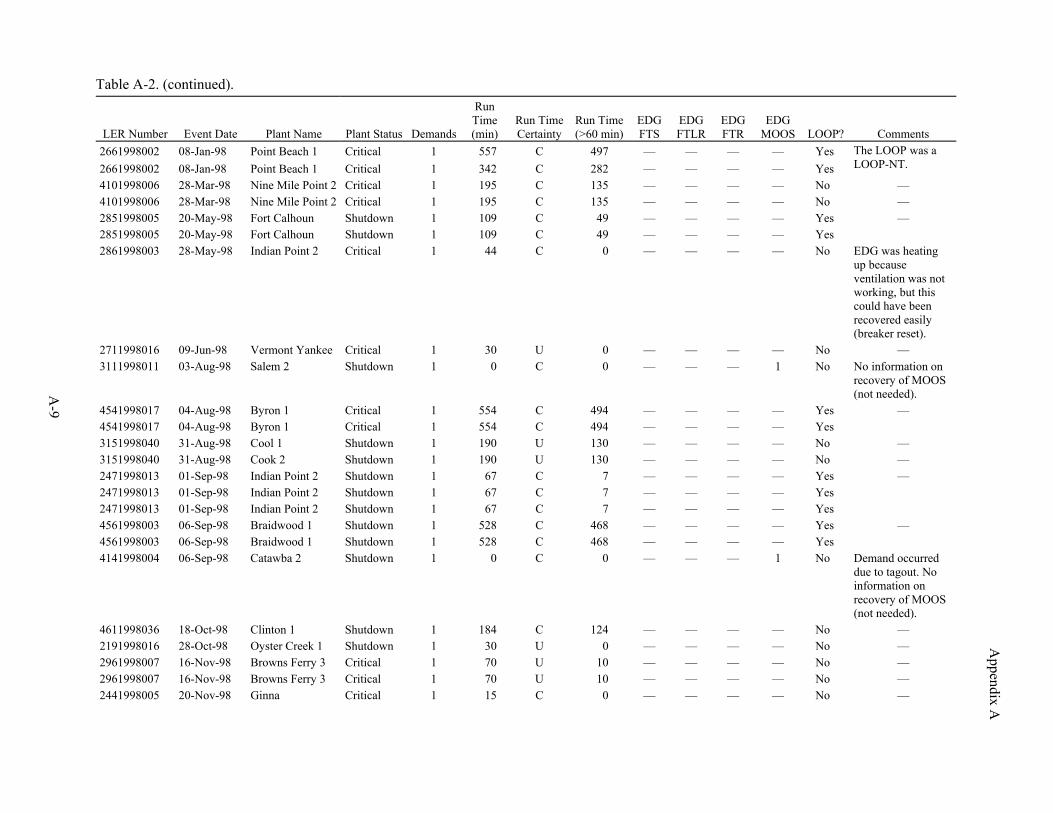
Appendix A
Table A-2. (continued).
A-9
LER Number Event Date Plant Name Plant Status Demands
Run Time (min)
Run Time Certainty
Run Time (>60 min)
EDG FTS
EDG FTLR
EDG FTR
EDG MOOS LOOP? Comments
2661998002 08-Jan-98 Point Beach 1 Critical 1 557 C 497 — — — — Yes 2661998002 08-Jan-98 Point Beach 1 Critical 1 342 C 282 — — — — Yes
The LOOP was a LOOP-NT.
4101998006 28-Mar-98 Nine Mile Point 2 Critical 1 195 C 135 — — — — No — 4101998006 28-Mar-98 Nine Mile Point 2 Critical 1 195 C 135 — — — — No — 2851998005 20-May-98 Fort Calhoun Shutdown 1 109 C 49 — — — — Yes 2851998005 20-May-98 Fort Calhoun Shutdown 1 109 C 49 — — — — Yes
—
2861998003 28-May-98 Indian Point 2 Critical 1 44 C 0 — — — — No EDG was heating up because ventilation was not working, but this could have been recovered easily (breaker reset).
2711998016 09-Jun-98 Vermont Yankee Critical 1 30 U 0 — — — — No — 3111998011 03-Aug-98 Salem 2 Shutdown 1 0 C 0 — — — 1 No No information on
recovery of MOOS (not needed).
4541998017 04-Aug-98 Byron 1 Critical 1 554 C 494 — — — — Yes 4541998017 04-Aug-98 Byron 1 Critical 1 554 C 494 — — — — Yes
—
3151998040 31-Aug-98 Cool 1 Shutdown 1 190 U 130 — — — — No — 3151998040 31-Aug-98 Cook 2 Shutdown 1 190 U 130 — — — — No — 2471998013 01-Sep-98 Indian Point 2 Shutdown 1 67 C 7 — — — — Yes 2471998013 01-Sep-98 Indian Point 2 Shutdown 1 67 C 7 — — — — Yes 2471998013 01-Sep-98 Indian Point 2 Shutdown 1 67 C 7 — — — — Yes
—
4561998003 06-Sep-98 Braidwood 1 Shutdown 1 528 C 468 — — — — Yes 4561998003 06-Sep-98 Braidwood 1 Shutdown 1 528 C 468 — — — — Yes
—
4141998004 06-Sep-98 Catawba 2 Shutdown 1 0 C 0 — — — 1 No Demand occurred due to tagout. No information on recovery of MOOS (not needed).
4611998036 18-Oct-98 Clinton 1 Shutdown 1 184 C 124 — — — — No — 2191998016 28-Oct-98 Oyster Creek 1 Shutdown 1 30 U 0 — — — — No — 2961998007 16-Nov-98 Browns Ferry 3 Critical 1 70 U 10 — — — — No — 2961998007 16-Nov-98 Browns Ferry 3 Critical 1 70 U 10 — — — — No — 2441998005 20-Nov-98 Ginna Critical 1 15 C 0 — — — — No —
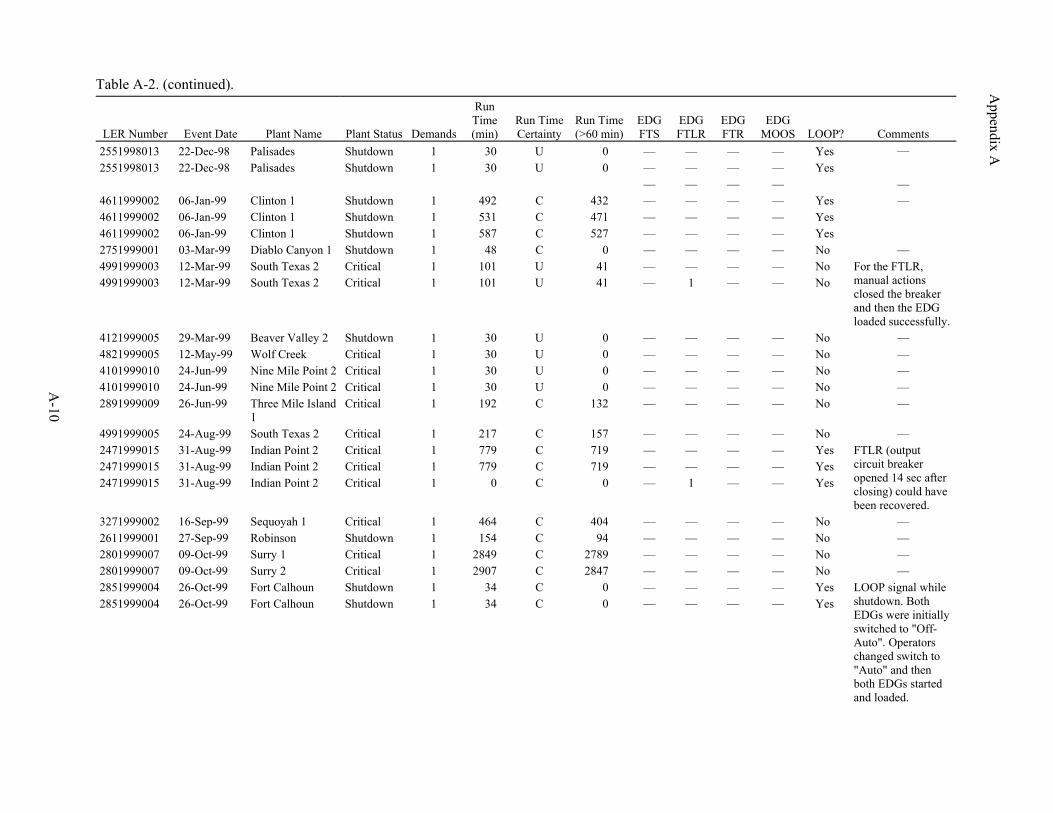
Appendix A
Table A-2. (continued).
A-10
LER Number Event Date Plant Name Plant Status Demands
Run Time (min)
Run Time Certainty
Run Time (>60 min)
EDG FTS
EDG FTLR
EDG FTR
EDG MOOS LOOP? Comments
2551998013 22-Dec-98 Palisades Shutdown 1 30 U 0 — — — — Yes 2551998013 22-Dec-98 Palisades Shutdown 1 30 U 0 — — — — Yes
—
— — — — — 4611999002 06-Jan-99 Clinton 1 Shutdown 1 492 C 432 — — — — Yes 4611999002 06-Jan-99 Clinton 1 Shutdown 1 531 C 471 — — — — Yes 4611999002 06-Jan-99 Clinton 1 Shutdown 1 587 C 527 — — — — Yes
—
2751999001 03-Mar-99 Diablo Canyon 1 Shutdown 1 48 C 0 — — — — No — 4991999003 12-Mar-99 South Texas 2 Critical 1 101 U 41 — — — — No 4991999003 12-Mar-99 South Texas 2 Critical 1 101 U 41 — 1 — — No
For the FTLR, manual actions closed the breaker and then the EDG loaded successfully.
4121999005 29-Mar-99 Beaver Valley 2 Shutdown 1 30 U 0 — — — — No — 4821999005 12-May-99 Wolf Creek Critical 1 30 U 0 — — — — No — 4101999010 24-Jun-99 Nine Mile Point 2 Critical 1 30 U 0 — — — — No — 4101999010 24-Jun-99 Nine Mile Point 2 Critical 1 30 U 0 — — — — No — 2891999009 26-Jun-99 Three Mile Island
1 Critical 1 192 C 132 — — — — No —
4991999005 24-Aug-99 South Texas 2 Critical 1 217 C 157 — — — — No — 2471999015 31-Aug-99 Indian Point 2 Critical 1 779 C 719 — — — — Yes 2471999015 31-Aug-99 Indian Point 2 Critical 1 779 C 719 — — — — Yes 2471999015 31-Aug-99 Indian Point 2 Critical 1 0 C 0 — 1 — — Yes
FTLR (output circuit breaker opened 14 sec after closing) could have been recovered.
3271999002 16-Sep-99 Sequoyah 1 Critical 1 464 C 404 — — — — No — 2611999001 27-Sep-99 Robinson Shutdown 1 154 C 94 — — — — No — 2801999007 09-Oct-99 Surry 1 Critical 1 2849 C 2789 — — — — No — 2801999007 09-Oct-99 Surry 2 Critical 1 2907 C 2847 — — — — No — 2851999004 26-Oct-99 Fort Calhoun Shutdown 1 34 C 0 — — — — Yes 2851999004 26-Oct-99 Fort Calhoun Shutdown 1 34 C 0 — — — — Yes
LOOP signal while shutdown. Both EDGs were initially switched to "Off-Auto". Operators changed switch to "Auto" and then both EDGs started and loaded.
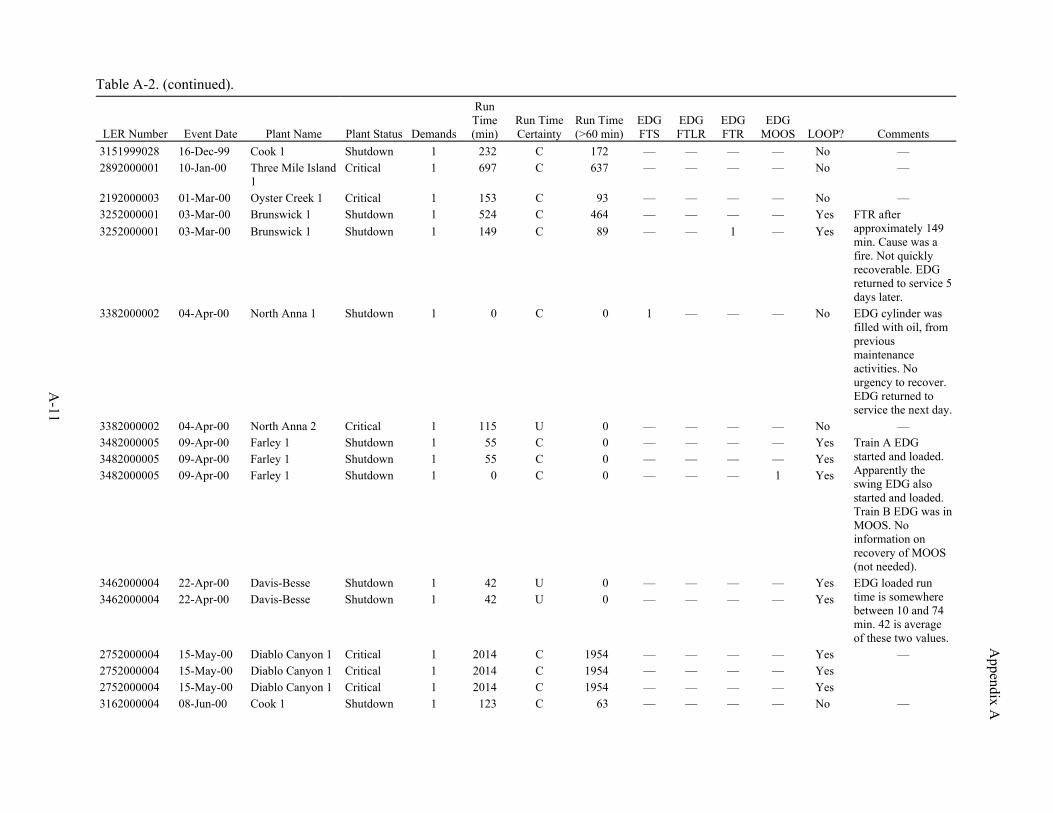
Appendix A
Table A-2. (continued).
A-11
LER Number Event Date Plant Name Plant Status Demands
Run Time (min)
Run Time Certainty
Run Time (>60 min)
EDG FTS
EDG FTLR
EDG FTR
EDG MOOS LOOP? Comments
3151999028 16-Dec-99 Cook 1 Shutdown 1 232 C 172 — — — — No — 2892000001 10-Jan-00 Three Mile Island
1 Critical 1 697 C 637 — — — — No —
2192000003 01-Mar-00 Oyster Creek 1 Critical 1 153 C 93 — — — — No — 3252000001 03-Mar-00 Brunswick 1 Shutdown 1 524 C 464 — — — — Yes 3252000001 03-Mar-00 Brunswick 1 Shutdown 1 149 C 89 — — 1 — Yes
FTR after approximately 149 min. Cause was a fire. Not quickly recoverable. EDG returned to service 5 days later.
3382000002 04-Apr-00 North Anna 1 Shutdown 1 0 C 0 1 — — — No EDG cylinder was filled with oil, from previous maintenance activities. No urgency to recover. EDG returned to service the next day.
3382000002 04-Apr-00 North Anna 2 Critical 1 115 U 0 — — — — No — 3482000005 09-Apr-00 Farley 1 Shutdown 1 55 C 0 — — — — Yes 3482000005 09-Apr-00 Farley 1 Shutdown 1 55 C 0 — — — — Yes 3482000005 09-Apr-00 Farley 1 Shutdown 1 0 C 0 — — — 1 Yes
Train A EDG started and loaded. Apparently the swing EDG also started and loaded. Train B EDG was in MOOS. No information on recovery of MOOS (not needed).
3462000004 22-Apr-00 Davis-Besse Shutdown 1 42 U 0 — — — — Yes 3462000004 22-Apr-00 Davis-Besse Shutdown 1 42 U 0 — — — — Yes
EDG loaded run time is somewhere between 10 and 74 min. 42 is average of these two values.
2752000004 15-May-00 Diablo Canyon 1 Critical 1 2014 C 1954 — — — — Yes 2752000004 15-May-00 Diablo Canyon 1 Critical 1 2014 C 1954 — — — — Yes 2752000004 15-May-00 Diablo Canyon 1 Critical 1 2014 C 1954 — — — — Yes
—
3162000004 08-Jun-00 Cook 1 Shutdown 1 123 C 63 — — — — No —
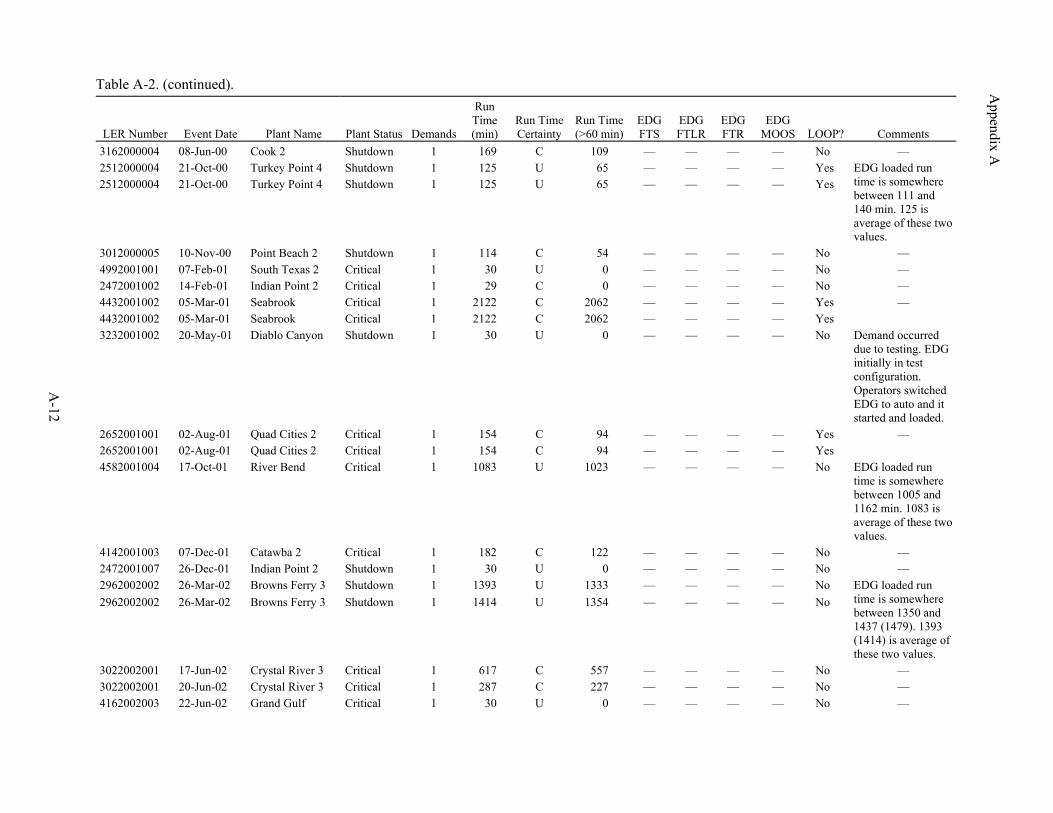
Appendix A
Table A-2. (continued).
A-12
LER Number Event Date Plant Name Plant Status Demands
Run Time (min)
Run Time Certainty
Run Time (>60 min)
EDG FTS
EDG FTLR
EDG FTR
EDG MOOS LOOP? Comments
3162000004 08-Jun-00 Cook 2 Shutdown 1 169 C 109 — — — — No — 2512000004 21-Oct-00 Turkey Point 4 Shutdown 1 125 U 65 — — — — Yes 2512000004 21-Oct-00 Turkey Point 4 Shutdown 1 125 U 65 — — — — Yes
EDG loaded run time is somewhere between 111 and 140 min. 125 is average of these two values.
3012000005 10-Nov-00 Point Beach 2 Shutdown 1 114 C 54 — — — — No — 4992001001 07-Feb-01 South Texas 2 Critical 1 30 U 0 — — — — No — 2472001002 14-Feb-01 Indian Point 2 Critical 1 29 C 0 — — — — No — 4432001002 05-Mar-01 Seabrook Critical 1 2122 C 2062 — — — — Yes 4432001002 05-Mar-01 Seabrook Critical 1 2122 C 2062 — — — — Yes
—
3232001002 20-May-01 Diablo Canyon Shutdown 1 30 U 0 — — — — No Demand occurred due to testing. EDG initially in test configuration. Operators switched EDG to auto and it started and loaded.
2652001001 02-Aug-01 Quad Cities 2 Critical 1 154 C 94 — — — — Yes 2652001001 02-Aug-01 Quad Cities 2 Critical 1 154 C 94 — — — — Yes
—
4582001004 17-Oct-01 River Bend Critical 1 1083 U 1023 — — — — No EDG loaded run time is somewhere between 1005 and 1162 min. 1083 is average of these two values.
4142001003 07-Dec-01 Catawba 2 Critical 1 182 C 122 — — — — No — 2472001007 26-Dec-01 Indian Point 2 Shutdown 1 30 U 0 — — — — No — 2962002002 26-Mar-02 Browns Ferry 3 Shutdown 1 1393 U 1333 — — — — No 2962002002 26-Mar-02 Browns Ferry 3 Shutdown 1 1414 U 1354 — — — — No
EDG loaded run time is somewhere between 1350 and 1437 (1479). 1393 (1414) is average of these two values.
3022002001 17-Jun-02 Crystal River 3 Critical 1 617 C 557 — — — — No — 3022002001 20-Jun-02 Crystal River 3 Critical 1 287 C 227 — — — — No — 4162002003 22-Jun-02 Grand Gulf Critical 1 30 U 0 — — — — No —
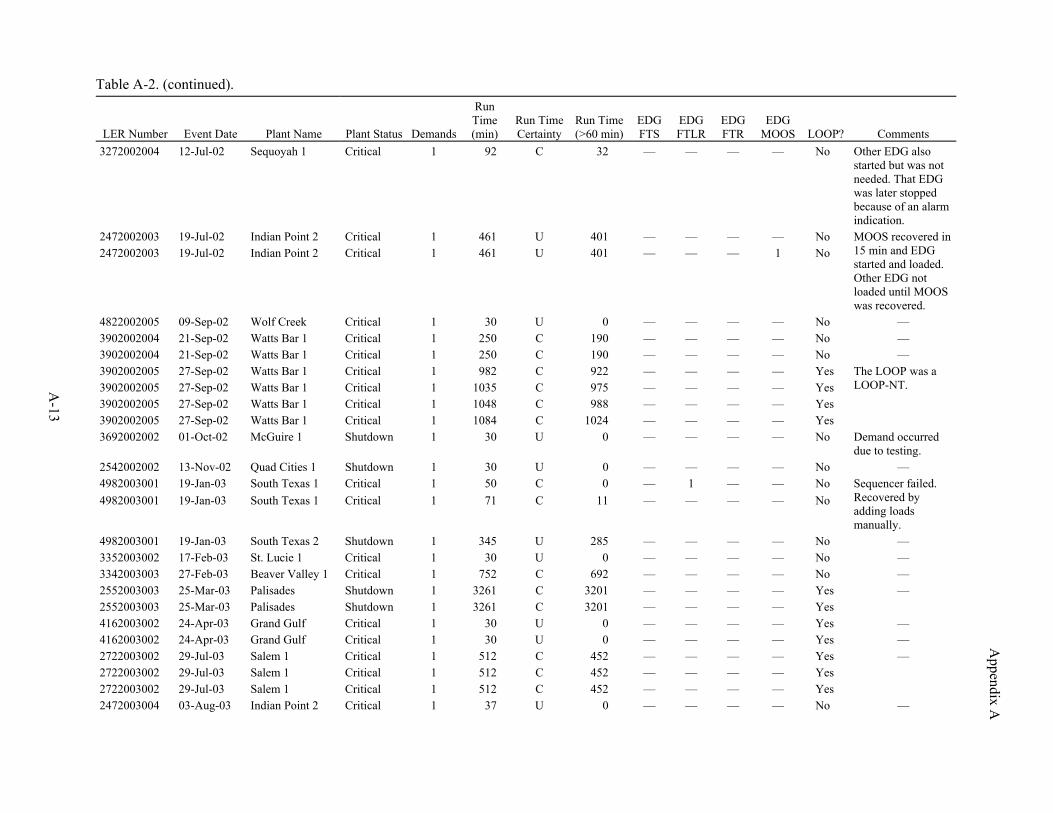
Appendix A
Table A-2. (continued).
A-13
LER Number Event Date Plant Name Plant Status Demands
Run Time (min)
Run Time Certainty
Run Time (>60 min)
EDG FTS
EDG FTLR
EDG FTR
EDG MOOS LOOP? Comments
3272002004 12-Jul-02 Sequoyah 1 Critical 1 92 C 32 — — — — No Other EDG also started but was not needed. That EDG was later stopped because of an alarm indication.
2472002003 19-Jul-02 Indian Point 2 Critical 1 461 U 401 — — — — No 2472002003 19-Jul-02 Indian Point 2 Critical 1 461 U 401 — — — 1 No
MOOS recovered in 15 min and EDG started and loaded. Other EDG not loaded until MOOS was recovered.
4822002005 09-Sep-02 Wolf Creek Critical 1 30 U 0 — — — — No — 3902002004 21-Sep-02 Watts Bar 1 Critical 1 250 C 190 — — — — No — 3902002004 21-Sep-02 Watts Bar 1 Critical 1 250 C 190 — — — — No — 3902002005 27-Sep-02 Watts Bar 1 Critical 1 982 C 922 — — — — Yes 3902002005 27-Sep-02 Watts Bar 1 Critical 1 1035 C 975 — — — — Yes 3902002005 27-Sep-02 Watts Bar 1 Critical 1 1048 C 988 — — — — Yes 3902002005 27-Sep-02 Watts Bar 1 Critical 1 1084 C 1024 — — — — Yes
The LOOP was a LOOP-NT.
3692002002 01-Oct-02 McGuire 1 Shutdown 1 30 U 0 — — — — No Demand occurred due to testing.
2542002002 13-Nov-02 Quad Cities 1 Shutdown 1 30 U 0 — — — — No — 4982003001 19-Jan-03 South Texas 1 Critical 1 50 C 0 — 1 — — No 4982003001 19-Jan-03 South Texas 1 Critical 1 71 C 11 — — — — No
Sequencer failed. Recovered by adding loads manually.
4982003001 19-Jan-03 South Texas 2 Shutdown 1 345 U 285 — — — — No — 3352003002 17-Feb-03 St. Lucie 1 Critical 1 30 U 0 — — — — No — 3342003003 27-Feb-03 Beaver Valley 1 Critical 1 752 C 692 — — — — No — 2552003003 25-Mar-03 Palisades Shutdown 1 3261 C 3201 — — — — Yes 2552003003 25-Mar-03 Palisades Shutdown 1 3261 C 3201 — — — — Yes
—
4162003002 24-Apr-03 Grand Gulf Critical 1 30 U 0 — — — — Yes — 4162003002 24-Apr-03 Grand Gulf Critical 1 30 U 0 — — — — Yes — 2722003002 29-Jul-03 Salem 1 Critical 1 512 C 452 — — — — Yes 2722003002 29-Jul-03 Salem 1 Critical 1 512 C 452 — — — — Yes 2722003002 29-Jul-03 Salem 1 Critical 1 512 C 452 — — — — Yes
—
2472003004 03-Aug-03 Indian Point 2 Critical 1 37 U 0 — — — — No —
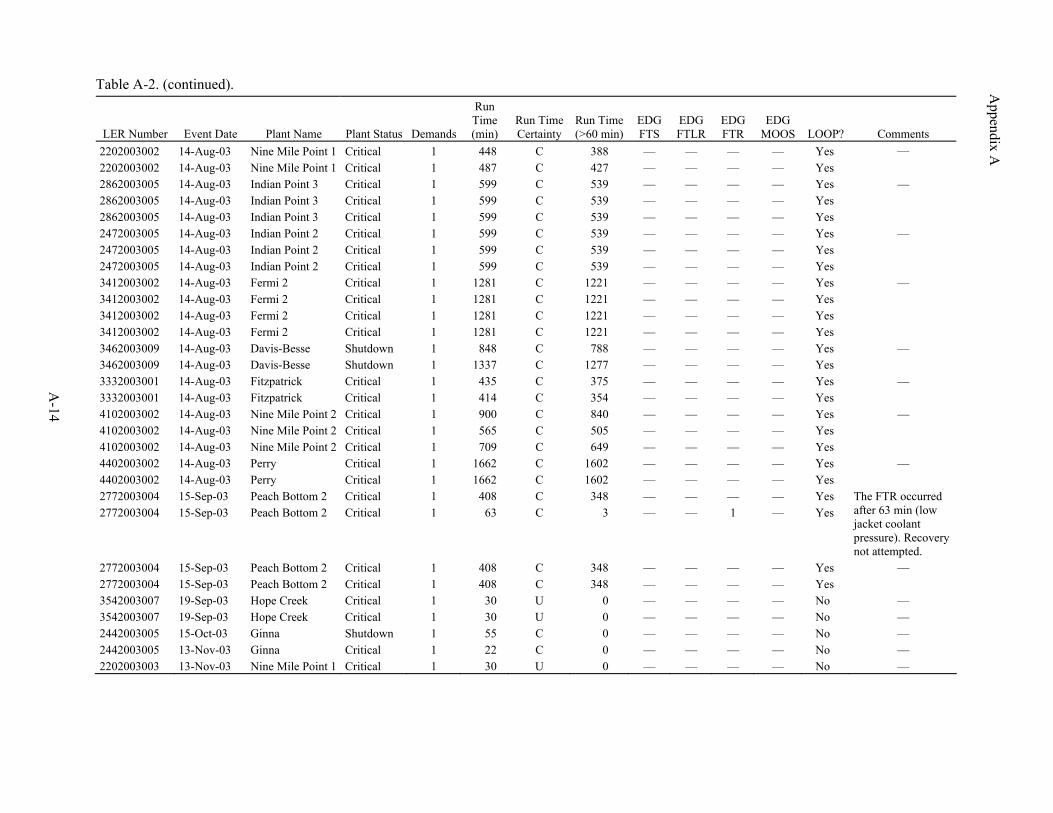
Appendix A
Table A-2. (continued).
A-14
LER Number Event Date Plant Name Plant Status Demands
Run Time (min)
Run Time Certainty
Run Time (>60 min)
EDG FTS
EDG FTLR
EDG FTR
EDG MOOS LOOP? Comments
2202003002 14-Aug-03 Nine Mile Point 1 Critical 1 448 C 388 — — — — Yes 2202003002 14-Aug-03 Nine Mile Point 1 Critical 1 487 C 427 — — — — Yes
—
2862003005 14-Aug-03 Indian Point 3 Critical 1 599 C 539 — — — — Yes 2862003005 14-Aug-03 Indian Point 3 Critical 1 599 C 539 — — — — Yes 2862003005 14-Aug-03 Indian Point 3 Critical 1 599 C 539 — — — — Yes
—
2472003005 14-Aug-03 Indian Point 2 Critical 1 599 C 539 — — — — Yes 2472003005 14-Aug-03 Indian Point 2 Critical 1 599 C 539 — — — — Yes 2472003005 14-Aug-03 Indian Point 2 Critical 1 599 C 539 — — — — Yes
—
3412003002 14-Aug-03 Fermi 2 Critical 1 1281 C 1221 — — — — Yes 3412003002 14-Aug-03 Fermi 2 Critical 1 1281 C 1221 — — — — Yes 3412003002 14-Aug-03 Fermi 2 Critical 1 1281 C 1221 — — — — Yes 3412003002 14-Aug-03 Fermi 2 Critical 1 1281 C 1221 — — — — Yes
—
3462003009 14-Aug-03 Davis-Besse Shutdown 1 848 C 788 — — — — Yes 3462003009 14-Aug-03 Davis-Besse Shutdown 1 1337 C 1277 — — — — Yes
—
3332003001 14-Aug-03 Fitzpatrick Critical 1 435 C 375 — — — — Yes 3332003001 14-Aug-03 Fitzpatrick Critical 1 414 C 354 — — — — Yes
—
4102003002 14-Aug-03 Nine Mile Point 2 Critical 1 900 C 840 — — — — Yes 4102003002 14-Aug-03 Nine Mile Point 2 Critical 1 565 C 505 — — — — Yes 4102003002 14-Aug-03 Nine Mile Point 2 Critical 1 709 C 649 — — — — Yes
—
4402003002 14-Aug-03 Perry Critical 1 1662 C 1602 — — — — Yes 4402003002 14-Aug-03 Perry Critical 1 1662 C 1602 — — — — Yes
—
2772003004 15-Sep-03 Peach Bottom 2 Critical 1 408 C 348 — — — — Yes 2772003004 15-Sep-03 Peach Bottom 2 Critical 1 63 C 3 — — 1 — Yes
The FTR occurred after 63 min (low jacket coolant pressure). Recovery not attempted.
2772003004 15-Sep-03 Peach Bottom 2 Critical 1 408 C 348 — — — — Yes 2772003004 15-Sep-03 Peach Bottom 2 Critical 1 408 C 348 — — — — Yes
—
3542003007 19-Sep-03 Hope Creek Critical 1 30 U 0 — — — — No — 3542003007 19-Sep-03 Hope Creek Critical 1 30 U 0 — — — — No — 2442003005 15-Oct-03 Ginna Shutdown 1 55 C 0 — — — — No — 2442003005 13-Nov-03 Ginna Critical 1 22 C 0 — — — — No — 2202003003 13-Nov-03 Nine Mile Point 1 Critical 1 30 U 0 — — — — No —
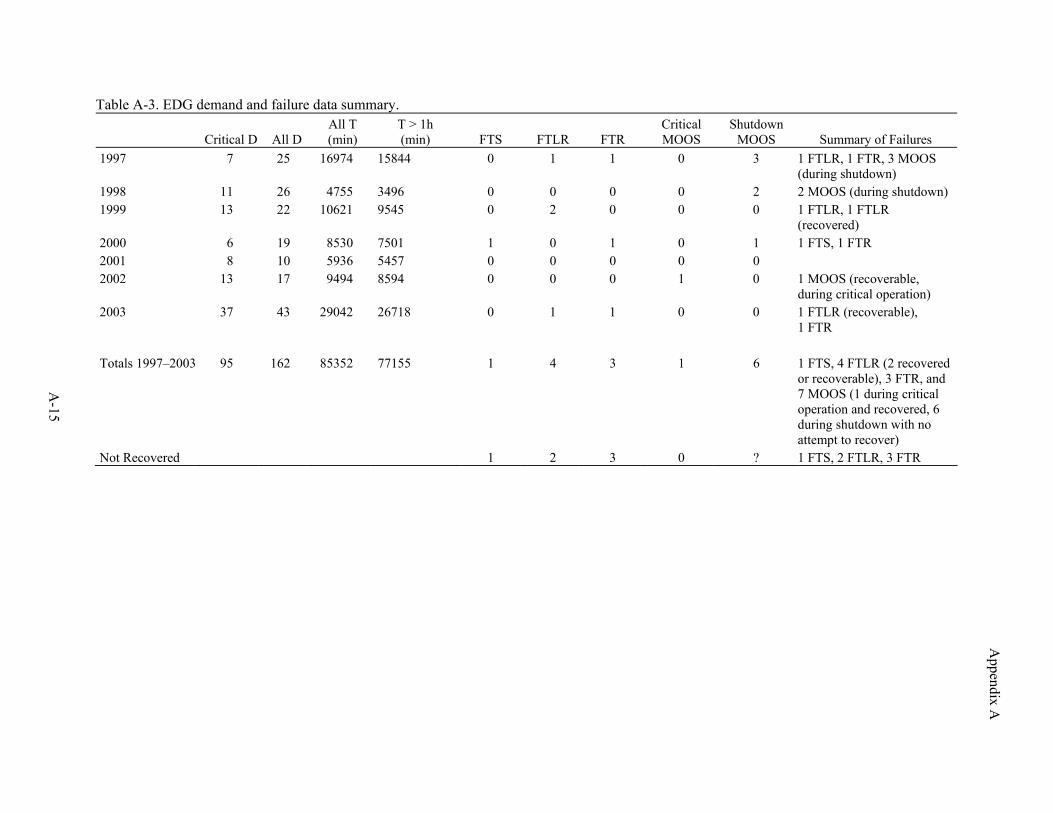
Appendix A
A-15
Table A-3. EDG demand and failure data summary.
Critical D All D All T (min)
T > 1h (min) FTS FTLR FTR
Critical MOOS
Shutdown MOOS Summary of Failures
1997 7 25 16974 15844 0 1 1 0 3 1 FTLR, 1 FTR, 3 MOOS (during shutdown)
1998 11 26 4755 3496 0 0 0 0 2 2 MOOS (during shutdown) 1999 13 22 10621 9545 0 2 0 0 0 1 FTLR, 1 FTLR
(recovered) 2000 6 19 8530 7501 1 0 1 0 1 1 FTS, 1 FTR 2001 8 10 5936 5457 0 0 0 0 0 2002 13 17 9494 8594 0 0 0 1 0 1 MOOS (recoverable,
during critical operation) 2003 37 43 29042 26718 0 1 1 0 0 1 FTLR (recoverable),
1 FTR Totals 1997–2003 95 162 85352 77155 1 4 3 1 6 1 FTS, 4 FTLR (2 recovered
or recoverable), 3 FTR, and 7 MOOS (1 during critical operation and recovered, 6 during shutdown with no attempt to recover)
Not Recovered 1 2 3 0 ? 1 FTS, 2 FTLR, 3 FTR
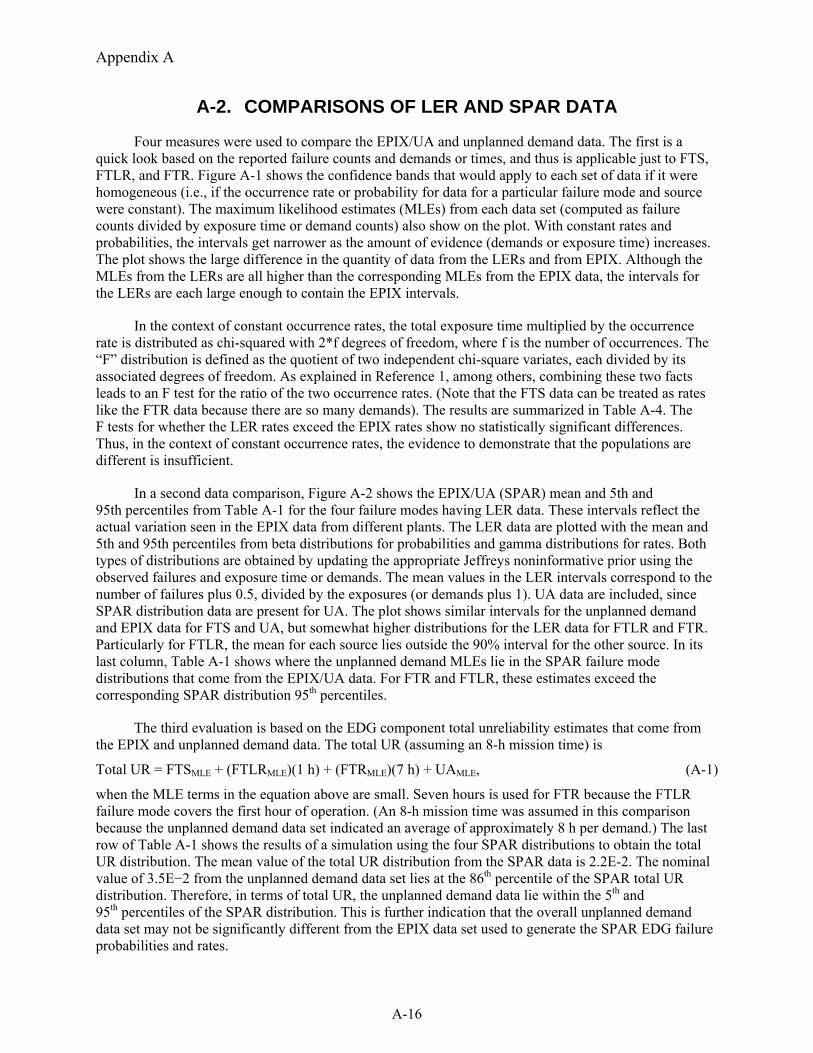
Appendix A
A-16
A-2. COMPARISONS OF LER AND SPAR DATA
Four measures were used to compare the EPIX/UA and unplanned demand data. The first is a quick look based on the reported failure counts and demands or times, and thus is applicable just to FTS, FTLR, and FTR. Figure A-1 shows the confidence bands that would apply to each set of data if it were homogeneous (i.e., if the occurrence rate or probability for data for a particular failure mode and source were constant). The maximum likelihood estimates (MLEs) from each data set (computed as failure counts divided by exposure time or demand counts) also show on the plot. With constant rates and probabilities, the intervals get narrower as the amount of evidence (demands or exposure time) increases. The plot shows the large difference in the quantity of data from the LERs and from EPIX. Although the MLEs from the LERs are all higher than the corresponding MLEs from the EPIX data, the intervals for the LERs are each large enough to contain the EPIX intervals.
In the context of constant occurrence rates, the total exposure time multiplied by the occurrence rate is distributed as chi-squared with 2*f degrees of freedom, where f is the number of occurrences. The “F” distribution is defined as the quotient of two independent chi-square variates, each divided by its associated degrees of freedom. As explained in Reference 1, among others, combining these two facts leads to an F test for the ratio of the two occurrence rates. (Note that the FTS data can be treated as rates like the FTR data because there are so many demands). The results are summarized in Table A-4. The F tests for whether the LER rates exceed the EPIX rates show no statistically significant differences. Thus, in the context of constant occurrence rates, the evidence to demonstrate that the populations are different is insufficient.
In a second data comparison, Figure A-2 shows the EPIX/UA (SPAR) mean and 5th and 95th percentiles from Table A-1 for the four failure modes having LER data. These intervals reflect the actual variation seen in the EPIX data from different plants. The LER data are plotted with the mean and 5th and 95th percentiles from beta distributions for probabilities and gamma distributions for rates. Both types of distributions are obtained by updating the appropriate Jeffreys noninformative prior using the observed failures and exposure time or demands. The mean values in the LER intervals correspond to the number of failures plus 0.5, divided by the exposures (or demands plus 1). UA data are included, since SPAR distribution data are present for UA. The plot shows similar intervals for the unplanned demand and EPIX data for FTS and UA, but somewhat higher distributions for the LER data for FTLR and FTR. Particularly for FTLR, the mean for each source lies outside the 90% interval for the other source. In its last column, Table A-1 shows where the unplanned demand MLEs lie in the SPAR failure mode distributions that come from the EPIX/UA data. For FTR and FTLR, these estimates exceed the corresponding SPAR distribution 95th percentiles.
The third evaluation is based on the EDG component total unreliability estimates that come from the EPIX and unplanned demand data. The total UR (assuming an 8-h mission time) is
Total UR = FTSMLE + (FTLRMLE)(1 h) + (FTRMLE)(7 h) + UAMLE, (A-1)
when the MLE terms in the equation above are small. Seven hours is used for FTR because the FTLR failure mode covers the first hour of operation. (An 8-h mission time was assumed in this comparison because the unplanned demand data set indicated an average of approximately 8 h per demand.) The last row of Table A-1 shows the results of a simulation using the four SPAR distributions to obtain the total UR distribution. The mean value of the total UR distribution from the SPAR data is 2.2E-2. The nominal value of 3.5E−2 from the unplanned demand data set lies at the 86th percentile of the SPAR total UR distribution. Therefore, in terms of total UR, the unplanned demand data lie within the 5th and 95th percentiles of the SPAR distribution. This is further indication that the overall unplanned demand data set may not be significantly different from the EPIX data set used to generate the SPAR EDG failure probabilities and rates.
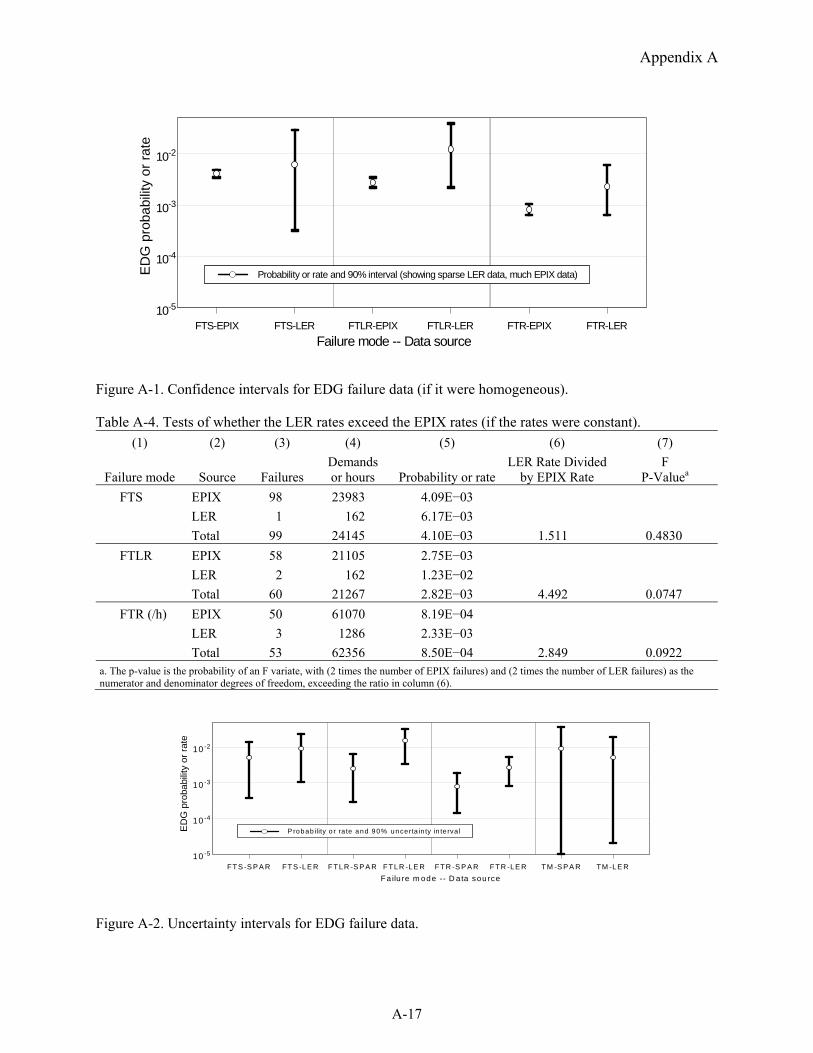
Appendix A
A-17
Figure A-1. Confidence intervals for EDG failure data (if it were homogeneous).
Table A-4. Tests of whether the LER rates exceed the EPIX rates (if the rates were constant). (1) (2) (3) (4) (5) (6) (7)
Failure mode Source Failures Demands or hours Probability or rate
LER Rate Divided by EPIX Rate
F P-Valuea
FTS EPIX 98 23983 4.09E−03 LER 1 162 6.17E−03 Total 99 24145 4.10E−03 1.511 0.4830 FTLR EPIX 58 21105 2.75E−03 LER 2 162 1.23E−02 Total 60 21267 2.82E−03 4.492 0.0747 FTR (/h) EPIX 50 61070 8.19E−04
LER 3 1286 2.33E−03 Total 53 62356 8.50E−04 2.849 0.0922 a. The p-value is the probability of an F variate, with (2 times the number of EPIX failures) and (2 times the number of LER failures) as the numerator and denominator degrees of freedom, exceeding the ratio in column (6).
Figure A-2. Uncertainty intervals for EDG failure data.
FT S -S P A R FT S -LE R F TLR -S P A R F TLR -LE R F TR -S P A R F TR -LE R TM -S P A R TM -LE RFa ilu re m ode -- D ata sou rce
10 -5
10 -4
10 -3
10 -2
ED
G p
roba
bilit
y or
rate
P robab ility o r ra te and 90% uncerta in ty in te rva l
FTS-EPIX FTS-LER FTLR-EPIX FTLR-LER FTR-EPIX FTR-LERFailure mode -- Data source
10-5
10-4
10-3
10-2E
DG
pro
babi
lity
or ra
te
Probability or rate and 90% interval (showing sparse LER data, much EPIX data)
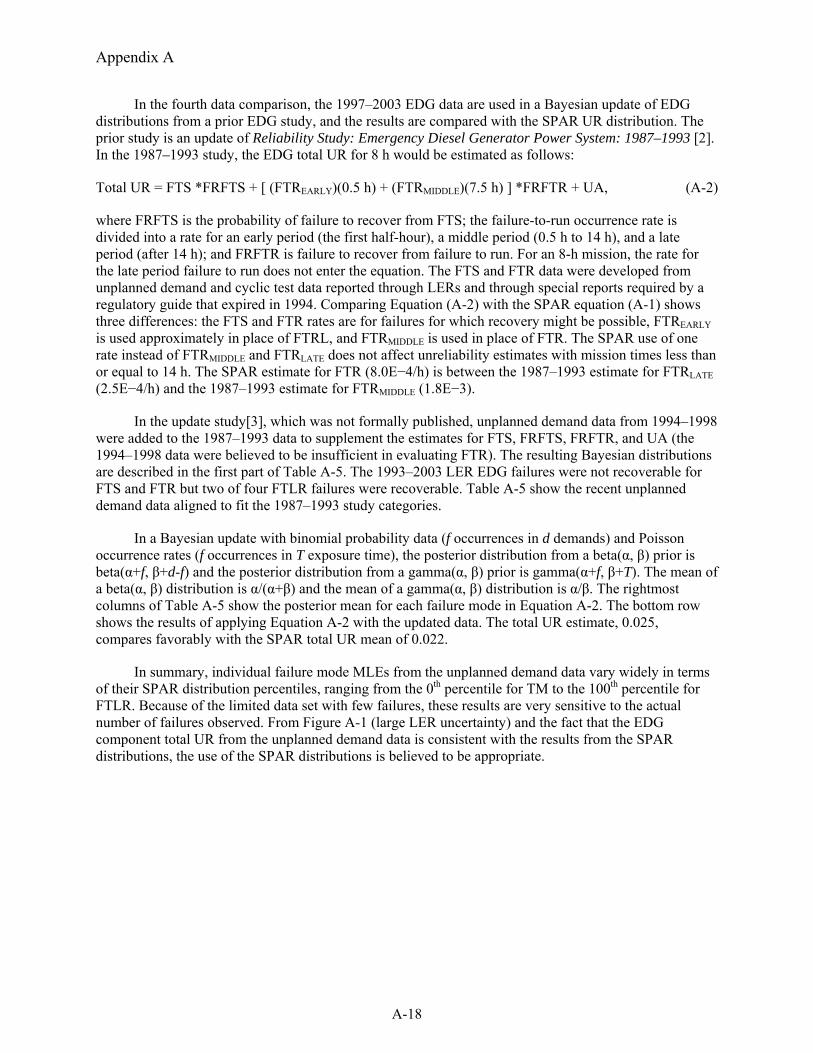
Appendix A
A-18
In the fourth data comparison, the 1997–2003 EDG data are used in a Bayesian update of EDG distributions from a prior EDG study, and the results are compared with the SPAR UR distribution. The prior study is an update of Reliability Study: Emergency Diesel Generator Power System: 1987–1993 [2]. In the 1987–1993 study, the EDG total UR for 8 h would be estimated as follows:
Total UR = FTS *FRFTS + [ (FTREARLY)(0.5 h) + (FTRMIDDLE)(7.5 h) ] *FRFTR + UA, (A-2)
where FRFTS is the probability of failure to recover from FTS; the failure-to-run occurrence rate is divided into a rate for an early period (the first half-hour), a middle period (0.5 h to 14 h), and a late period (after 14 h); and FRFTR is failure to recover from failure to run. For an 8-h mission, the rate for the late period failure to run does not enter the equation. The FTS and FTR data were developed from unplanned demand and cyclic test data reported through LERs and through special reports required by a regulatory guide that expired in 1994. Comparing Equation (A-2) with the SPAR equation (A-1) shows three differences: the FTS and FTR rates are for failures for which recovery might be possible, FTREARLY is used approximately in place of FTRL, and FTRMIDDLE is used in place of FTR. The SPAR use of one rate instead of FTRMIDDLE and FTRLATE does not affect unreliability estimates with mission times less than or equal to 14 h. The SPAR estimate for FTR (8.0E−4/h) is between the 1987–1993 estimate for FTRLATE (2.5E−4/h) and the 1987–1993 estimate for FTRMIDDLE (1.8E−3).
In the update study[3], which was not formally published, unplanned demand data from 1994–1998 were added to the 1987–1993 data to supplement the estimates for FTS, FRFTS, FRFTR, and UA (the 1994–1998 data were believed to be insufficient in evaluating FTR). The resulting Bayesian distributions are described in the first part of Table A-5. The 1993–2003 LER EDG failures were not recoverable for FTS and FTR but two of four FTLR failures were recoverable. Table A-5 show the recent unplanned demand data aligned to fit the 1987–1993 study categories.
In a Bayesian update with binomial probability data (f occurrences in d demands) and Poisson occurrence rates (f occurrences in T exposure time), the posterior distribution from a beta(α, β) prior is beta(α+f, β+d-f) and the posterior distribution from a gamma(α, β) prior is gamma(α+f, β+T). The mean of a beta(α, β) distribution is α/(α+β) and the mean of a gamma(α, β) distribution is α/β. The rightmost columns of Table A-5 show the posterior mean for each failure mode in Equation A-2. The bottom row shows the results of applying Equation A-2 with the updated data. The total UR estimate, 0.025, compares favorably with the SPAR total UR mean of 0.022.
In summary, individual failure mode MLEs from the unplanned demand data vary widely in terms of their SPAR distribution percentiles, ranging from the 0th percentile for TM to the 100th percentile for FTLR. Because of the limited data set with few failures, these results are very sensitive to the actual number of failures observed. From Figure A-1 (large LER uncertainty) and the fact that the EDG component total UR from the unplanned demand data is consistent with the results from the SPAR distributions, the use of the SPAR distributions is believed to be appropriate.
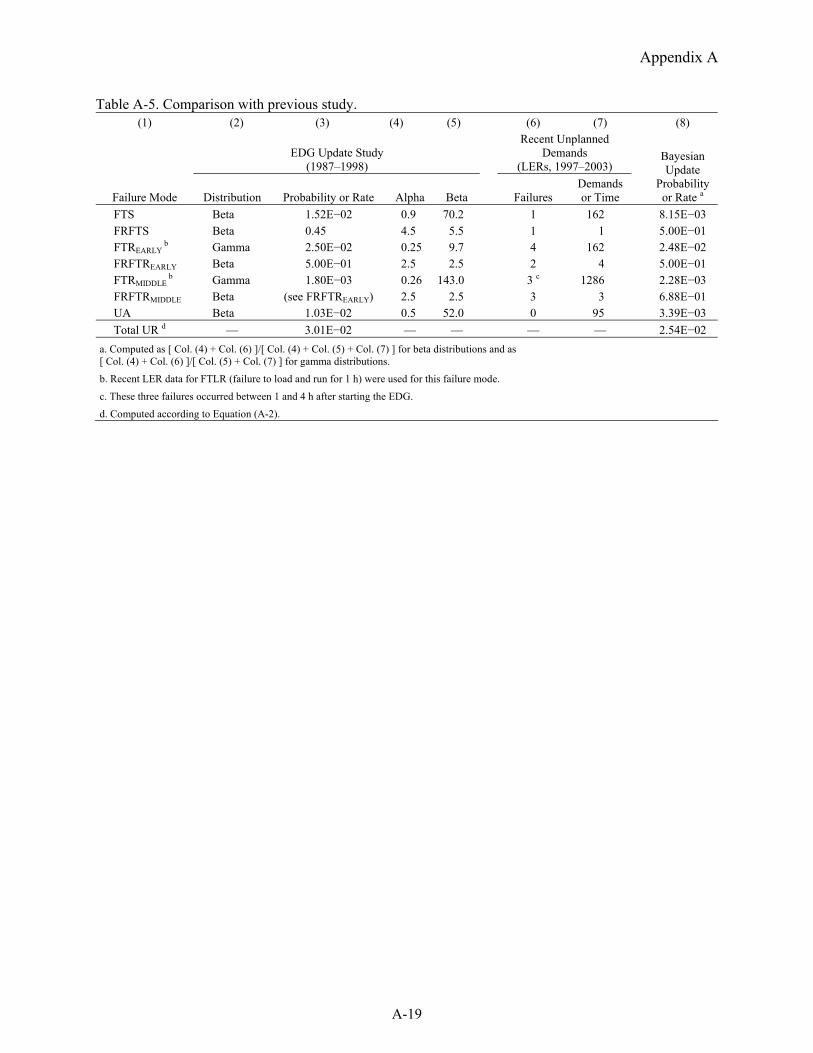
Appendix A
A-19
Table A-5. Comparison with previous study. (1) (2) (3) (4) (5) (6) (7) (8)
EDG Update Study
(1987–1998)
Recent Unplanned Demands
(LERs, 1997–2003)
Failure Mode Distribution Probability or Rate Alpha Beta Failures Demands or Time
Bayesian Update
Probabilityor Rate a
FTS Beta 1.52E−02 0.9 70.2 1 162 8.15E−03 FRFTS Beta 0.45 4.5 5.5 1 1 5.00E−01 FTREARLY
b Gamma 2.50E−02 0.25 9.7 4 162 2.48E−02 FRFTREARLY Beta 5.00E−01 2.5 2.5 2 4 5.00E−01 FTRMIDDLE
b Gamma 1.80E−03 0.26 143.0 3 c 1286 2.28E−03 FRFTRMIDDLE Beta (see FRFTREARLY) 2.5 2.5 3 3 6.88E−01 UA Beta 1.03E−02 0.5 52.0 0 95 3.39E−03 Total UR d — 3.01E−02 — — — — 2.54E−02
a. Computed as [ Col. (4) + Col. (6) ]/[ Col. (4) + Col. (5) + Col. (7) ] for beta distributions and as [ Col. (4) + Col. (6) ]/[ Col. (5) + Col. (7) ] for gamma distributions.
b. Recent LER data for FTLR (failure to load and run for 1 h) were used for this failure mode.
c. These three failures occurred between 1 and 4 h after starting the EDG.
d. Computed according to Equation (A-2).
Appendix A
A-20
A-3. SUBSETS OF 1997–2003 EDG EVENTS
Four tables are presented in this section, each with a different subset of the EDG unplanned demand events:
Table A-6 EDG unplanned demands during critical operation
Table A-7 EDG unplanned demands from loss of offsite power (LOOP) events
Table A-8 EDG unplanned demands from LOOP events during critical operation
Table A-9 EDG unplanned demands during shutdown operation.
Each Table contains data for 1997–2003. The event tables are sorted by date. The column headings are explained in Section A-2.
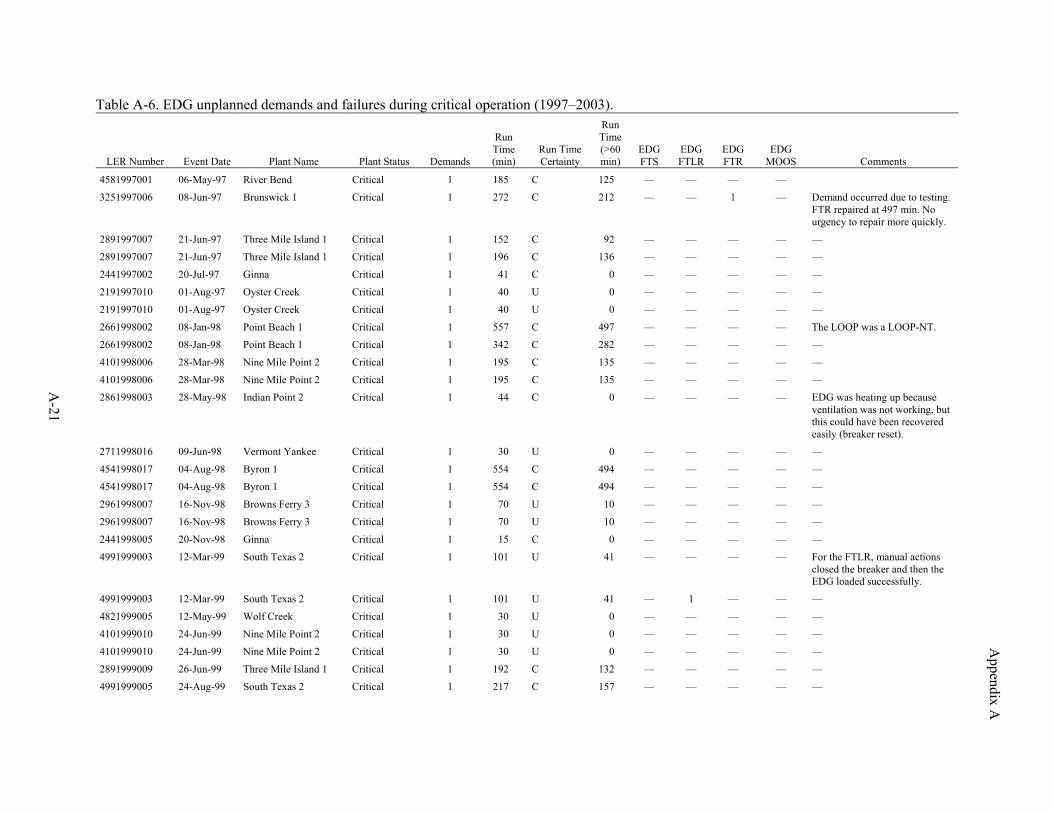
Appendix A
A-21
Table A-6. EDG unplanned demands and failures during critical operation (1997–2003).
LER Number Event Date Plant Name Plant Status Demands
Run Time (min)
Run Time Certainty
Run Time (>60 min)
EDG FTS
EDG FTLR
EDG FTR
EDG MOOS Comments
4581997001 06-May-97 River Bend Critical 1 185 C 125 — — — —
3251997006 08-Jun-97 Brunswick 1 Critical 1 272 C 212 — — 1 — Demand occurred due to testing. FTR repaired at 497 min. No urgency to repair more quickly.
2891997007 21-Jun-97 Three Mile Island 1 Critical 1 152 C 92 — — — — —
2891997007 21-Jun-97 Three Mile Island 1 Critical 1 196 C 136 — — — — —
2441997002 20-Jul-97 Ginna Critical 1 41 C 0 — — — — —
2191997010 01-Aug-97 Oyster Creek Critical 1 40 U 0 — — — — —
2191997010 01-Aug-97 Oyster Creek Critical 1 40 U 0 — — — — —
2661998002 08-Jan-98 Point Beach 1 Critical 1 557 C 497 — — — — The LOOP was a LOOP-NT.
2661998002 08-Jan-98 Point Beach 1 Critical 1 342 C 282 — — — — —
4101998006 28-Mar-98 Nine Mile Point 2 Critical 1 195 C 135 — — — — —
4101998006 28-Mar-98 Nine Mile Point 2 Critical 1 195 C 135 — — — — —
2861998003 28-May-98 Indian Point 2 Critical 1 44 C 0 — — — — EDG was heating up because ventilation was not working, but this could have been recovered easily (breaker reset).
2711998016 09-Jun-98 Vermont Yankee Critical 1 30 U 0 — — — — —
4541998017 04-Aug-98 Byron 1 Critical 1 554 C 494 — — — — —
4541998017 04-Aug-98 Byron 1 Critical 1 554 C 494 — — — — —
2961998007 16-Nov-98 Browns Ferry 3 Critical 1 70 U 10 — — — — —
2961998007 16-Nov-98 Browns Ferry 3 Critical 1 70 U 10 — — — — —
2441998005 20-Nov-98 Ginna Critical 1 15 C 0 — — — — —
4991999003 12-Mar-99 South Texas 2 Critical 1 101 U 41 — — — — For the FTLR, manual actions closed the breaker and then the EDG loaded successfully.
4991999003 12-Mar-99 South Texas 2 Critical 1 101 U 41 — 1 — — —
4821999005 12-May-99 Wolf Creek Critical 1 30 U 0 — — — — —
4101999010 24-Jun-99 Nine Mile Point 2 Critical 1 30 U 0 — — — — —
4101999010 24-Jun-99 Nine Mile Point 2 Critical 1 30 U 0 — — — — —
2891999009 26-Jun-99 Three Mile Island 1 Critical 1 192 C 132 — — — — —
4991999005 24-Aug-99 South Texas 2 Critical 1 217 C 157 — — — — —
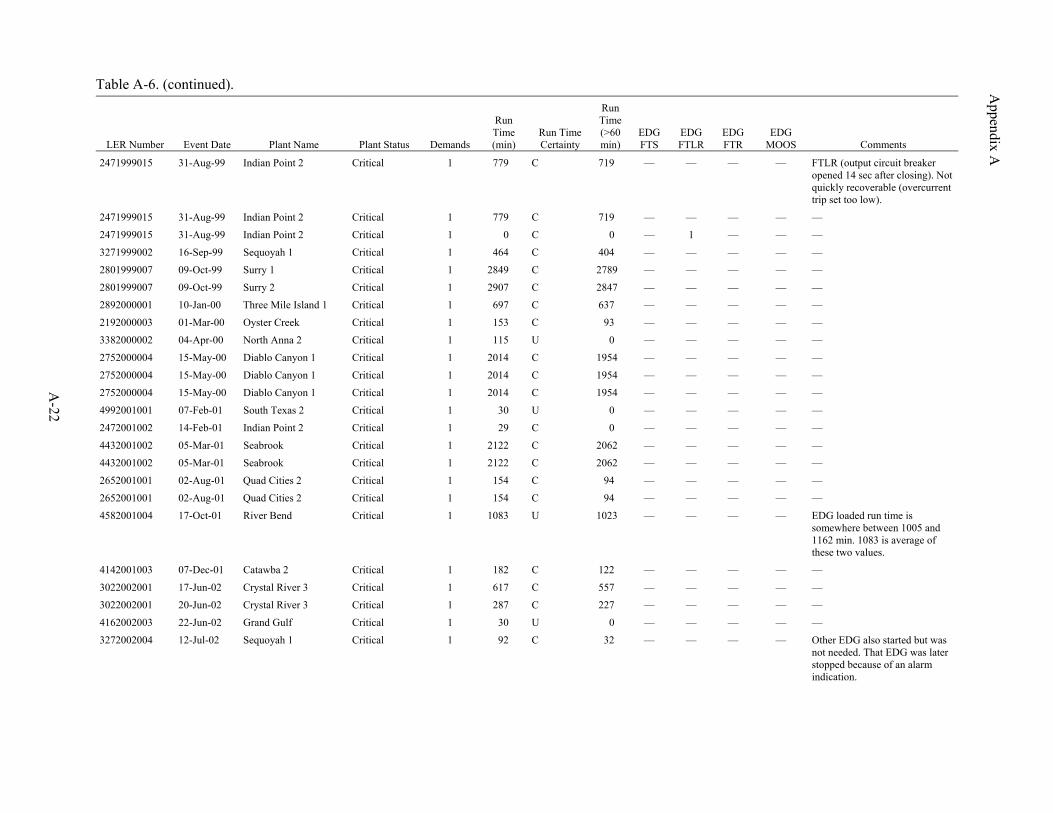
Appendix A
Table A-6. (continued).
A-22
LER Number Event Date Plant Name Plant Status Demands
Run Time (min)
Run Time Certainty
Run Time (>60 min)
EDG FTS
EDG FTLR
EDG FTR
EDG MOOS Comments
2471999015 31-Aug-99 Indian Point 2 Critical 1 779 C 719 — — — — FTLR (output circuit breaker opened 14 sec after closing). Not quickly recoverable (overcurrent trip set too low).
2471999015 31-Aug-99 Indian Point 2 Critical 1 779 C 719 — — — — —
2471999015 31-Aug-99 Indian Point 2 Critical 1 0 C 0 — 1 — — —
3271999002 16-Sep-99 Sequoyah 1 Critical 1 464 C 404 — — — — —
2801999007 09-Oct-99 Surry 1 Critical 1 2849 C 2789 — — — — —
2801999007 09-Oct-99 Surry 2 Critical 1 2907 C 2847 — — — — —
2892000001 10-Jan-00 Three Mile Island 1 Critical 1 697 C 637 — — — — —
2192000003 01-Mar-00 Oyster Creek Critical 1 153 C 93 — — — — —
3382000002 04-Apr-00 North Anna 2 Critical 1 115 U 0 — — — — —
2752000004 15-May-00 Diablo Canyon 1 Critical 1 2014 C 1954 — — — — —
2752000004 15-May-00 Diablo Canyon 1 Critical 1 2014 C 1954 — — — — —
2752000004 15-May-00 Diablo Canyon 1 Critical 1 2014 C 1954 — — — — —
4992001001 07-Feb-01 South Texas 2 Critical 1 30 U 0 — — — — —
2472001002 14-Feb-01 Indian Point 2 Critical 1 29 C 0 — — — — —
4432001002 05-Mar-01 Seabrook Critical 1 2122 C 2062 — — — — —
4432001002 05-Mar-01 Seabrook Critical 1 2122 C 2062 — — — — —
2652001001 02-Aug-01 Quad Cities 2 Critical 1 154 C 94 — — — — —
2652001001 02-Aug-01 Quad Cities 2 Critical 1 154 C 94 — — — — —
4582001004 17-Oct-01 River Bend Critical 1 1083 U 1023 — — — — EDG loaded run time is somewhere between 1005 and 1162 min. 1083 is average of these two values.
4142001003 07-Dec-01 Catawba 2 Critical 1 182 C 122 — — — — —
3022002001 17-Jun-02 Crystal River 3 Critical 1 617 C 557 — — — — —
3022002001 20-Jun-02 Crystal River 3 Critical 1 287 C 227 — — — — —
4162002003 22-Jun-02 Grand Gulf Critical 1 30 U 0 — — — — —
3272002004 12-Jul-02 Sequoyah 1 Critical 1 92 C 32 — — — — Other EDG also started but was not needed. That EDG was later stopped because of an alarm indication.
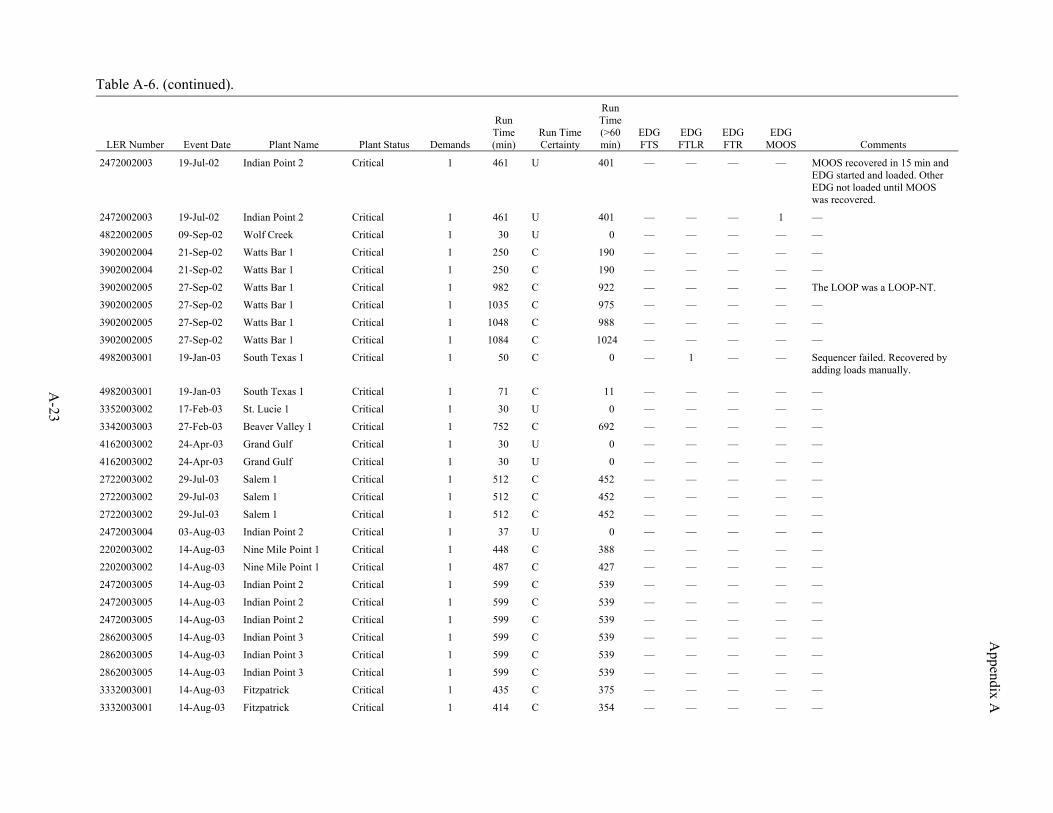
Appendix A
Table A-6. (continued).
A-23
LER Number Event Date Plant Name Plant Status Demands
Run Time (min)
Run Time Certainty
Run Time (>60 min)
EDG FTS
EDG FTLR
EDG FTR
EDG MOOS Comments
2472002003 19-Jul-02 Indian Point 2 Critical 1 461 U 401 — — — — MOOS recovered in 15 min and EDG started and loaded. Other EDG not loaded until MOOS was recovered.
2472002003 19-Jul-02 Indian Point 2 Critical 1 461 U 401 — — — 1 —
4822002005 09-Sep-02 Wolf Creek Critical 1 30 U 0 — — — — —
3902002004 21-Sep-02 Watts Bar 1 Critical 1 250 C 190 — — — — —
3902002004 21-Sep-02 Watts Bar 1 Critical 1 250 C 190 — — — — —
3902002005 27-Sep-02 Watts Bar 1 Critical 1 982 C 922 — — — — The LOOP was a LOOP-NT.
3902002005 27-Sep-02 Watts Bar 1 Critical 1 1035 C 975 — — — — —
3902002005 27-Sep-02 Watts Bar 1 Critical 1 1048 C 988 — — — — —
3902002005 27-Sep-02 Watts Bar 1 Critical 1 1084 C 1024 — — — — —
4982003001 19-Jan-03 South Texas 1 Critical 1 50 C 0 — 1 — — Sequencer failed. Recovered by adding loads manually.
4982003001 19-Jan-03 South Texas 1 Critical 1 71 C 11 — — — — —
3352003002 17-Feb-03 St. Lucie 1 Critical 1 30 U 0 — — — — —
3342003003 27-Feb-03 Beaver Valley 1 Critical 1 752 C 692 — — — — —
4162003002 24-Apr-03 Grand Gulf Critical 1 30 U 0 — — — — —
4162003002 24-Apr-03 Grand Gulf Critical 1 30 U 0 — — — — —
2722003002 29-Jul-03 Salem 1 Critical 1 512 C 452 — — — — —
2722003002 29-Jul-03 Salem 1 Critical 1 512 C 452 — — — — —
2722003002 29-Jul-03 Salem 1 Critical 1 512 C 452 — — — — —
2472003004 03-Aug-03 Indian Point 2 Critical 1 37 U 0 — — — — —
2202003002 14-Aug-03 Nine Mile Point 1 Critical 1 448 C 388 — — — — —
2202003002 14-Aug-03 Nine Mile Point 1 Critical 1 487 C 427 — — — — —
2472003005 14-Aug-03 Indian Point 2 Critical 1 599 C 539 — — — — —
2472003005 14-Aug-03 Indian Point 2 Critical 1 599 C 539 — — — — —
2472003005 14-Aug-03 Indian Point 2 Critical 1 599 C 539 — — — — —
2862003005 14-Aug-03 Indian Point 3 Critical 1 599 C 539 — — — — —
2862003005 14-Aug-03 Indian Point 3 Critical 1 599 C 539 — — — — —
2862003005 14-Aug-03 Indian Point 3 Critical 1 599 C 539 — — — — —
3332003001 14-Aug-03 Fitzpatrick Critical 1 435 C 375 — — — — —
3332003001 14-Aug-03 Fitzpatrick Critical 1 414 C 354 — — — — —
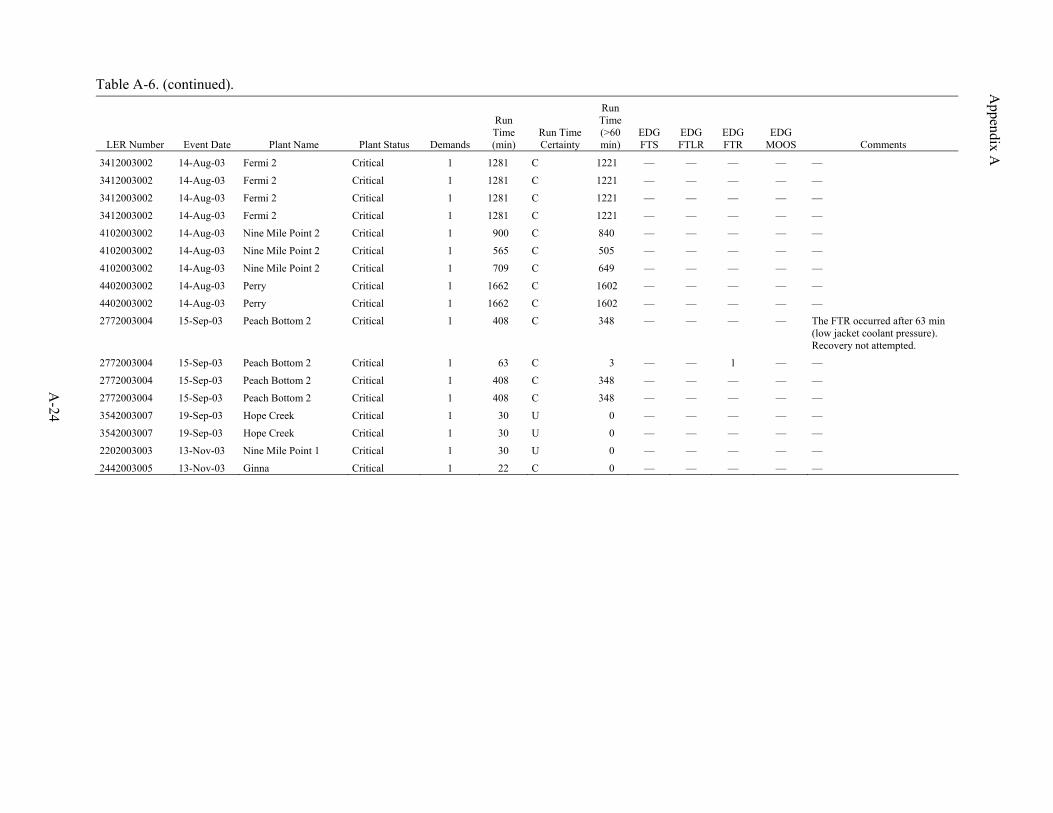
Appendix A
Table A-6. (continued).
A-24
LER Number Event Date Plant Name Plant Status Demands
Run Time (min)
Run Time Certainty
Run Time (>60 min)
EDG FTS
EDG FTLR
EDG FTR
EDG MOOS Comments
3412003002 14-Aug-03 Fermi 2 Critical 1 1281 C 1221 — — — — —
3412003002 14-Aug-03 Fermi 2 Critical 1 1281 C 1221 — — — — —
3412003002 14-Aug-03 Fermi 2 Critical 1 1281 C 1221 — — — — —
3412003002 14-Aug-03 Fermi 2 Critical 1 1281 C 1221 — — — — —
4102003002 14-Aug-03 Nine Mile Point 2 Critical 1 900 C 840 — — — — —
4102003002 14-Aug-03 Nine Mile Point 2 Critical 1 565 C 505 — — — — —
4102003002 14-Aug-03 Nine Mile Point 2 Critical 1 709 C 649 — — — — —
4402003002 14-Aug-03 Perry Critical 1 1662 C 1602 — — — — —
4402003002 14-Aug-03 Perry Critical 1 1662 C 1602 — — — — —
2772003004 15-Sep-03 Peach Bottom 2 Critical 1 408 C 348 — — — — The FTR occurred after 63 min (low jacket coolant pressure). Recovery not attempted.
2772003004 15-Sep-03 Peach Bottom 2 Critical 1 63 C 3 — — 1 — —
2772003004 15-Sep-03 Peach Bottom 2 Critical 1 408 C 348 — — — — —
2772003004 15-Sep-03 Peach Bottom 2 Critical 1 408 C 348 — — — — —
3542003007 19-Sep-03 Hope Creek Critical 1 30 U 0 — — — — —
3542003007 19-Sep-03 Hope Creek Critical 1 30 U 0 — — — — —
2202003003 13-Nov-03 Nine Mile Point 1 Critical 1 30 U 0 — — — — —
2442003005 13-Nov-03 Ginna Critical 1 22 C 0 — — — — —
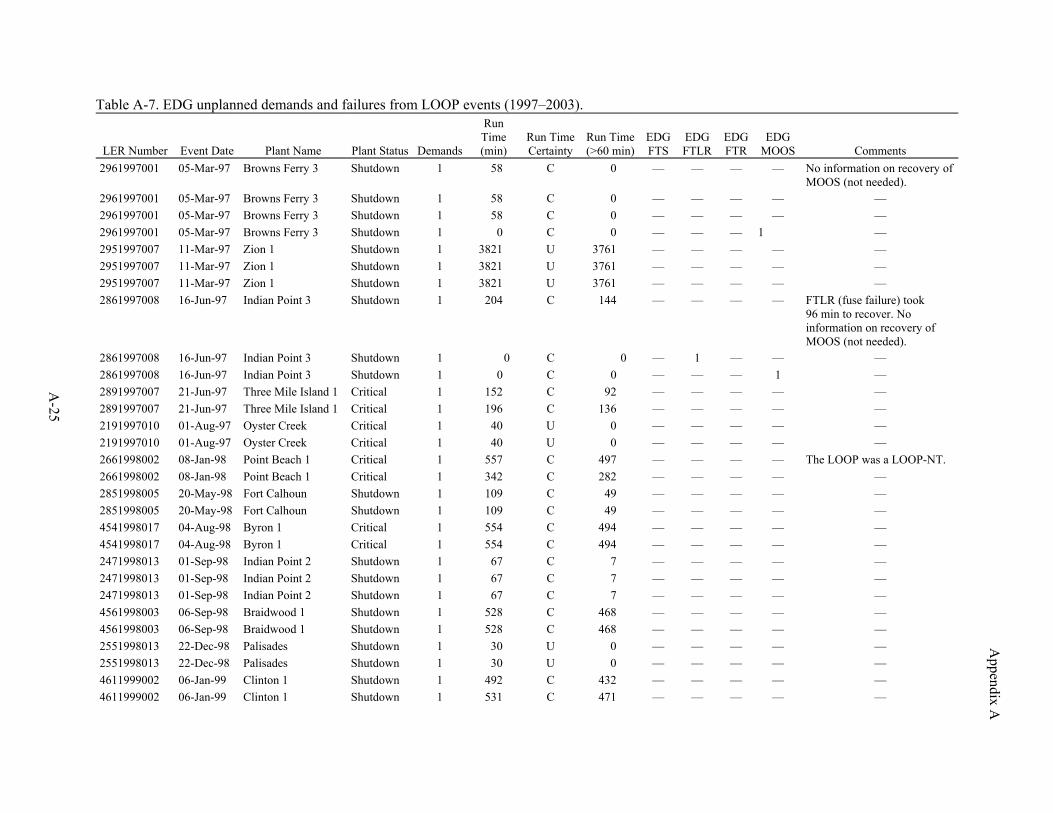
Appendix A
A-25
Table A-7. EDG unplanned demands and failures from LOOP events (1997–2003).
LER Number Event Date Plant Name Plant Status Demands
Run Time (min)
Run Time Certainty
Run Time (>60 min)
EDG FTS
EDG FTLR
EDG FTR
EDG MOOS Comments
2961997001 05-Mar-97 Browns Ferry 3 Shutdown 1 58 C 0 — — — — No information on recovery of MOOS (not needed).
2961997001 05-Mar-97 Browns Ferry 3 Shutdown 1 58 C 0 — — — — — 2961997001 05-Mar-97 Browns Ferry 3 Shutdown 1 58 C 0 — — — — — 2961997001 05-Mar-97 Browns Ferry 3 Shutdown 1 0 C 0 — — — 1 — 2951997007 11-Mar-97 Zion 1 Shutdown 1 3821 U 3761 — — — — — 2951997007 11-Mar-97 Zion 1 Shutdown 1 3821 U 3761 — — — — — 2951997007 11-Mar-97 Zion 1 Shutdown 1 3821 U 3761 — — — — — 2861997008 16-Jun-97 Indian Point 3 Shutdown 1 204 C 144 — — — — FTLR (fuse failure) took
96 min to recover. No information on recovery of MOOS (not needed).
2861997008 16-Jun-97 Indian Point 3 Shutdown 1 0 C 0 — 1 — — — 2861997008 16-Jun-97 Indian Point 3 Shutdown 1 0 C 0 — — — 1 — 2891997007 21-Jun-97 Three Mile Island 1 Critical 1 152 C 92 — — — — — 2891997007 21-Jun-97 Three Mile Island 1 Critical 1 196 C 136 — — — — — 2191997010 01-Aug-97 Oyster Creek Critical 1 40 U 0 — — — — — 2191997010 01-Aug-97 Oyster Creek Critical 1 40 U 0 — — — — — 2661998002 08-Jan-98 Point Beach 1 Critical 1 557 C 497 — — — — The LOOP was a LOOP-NT. 2661998002 08-Jan-98 Point Beach 1 Critical 1 342 C 282 — — — — — 2851998005 20-May-98 Fort Calhoun Shutdown 1 109 C 49 — — — — — 2851998005 20-May-98 Fort Calhoun Shutdown 1 109 C 49 — — — — — 4541998017 04-Aug-98 Byron 1 Critical 1 554 C 494 — — — — — 4541998017 04-Aug-98 Byron 1 Critical 1 554 C 494 — — — — — 2471998013 01-Sep-98 Indian Point 2 Shutdown 1 67 C 7 — — — — — 2471998013 01-Sep-98 Indian Point 2 Shutdown 1 67 C 7 — — — — — 2471998013 01-Sep-98 Indian Point 2 Shutdown 1 67 C 7 — — — — — 4561998003 06-Sep-98 Braidwood 1 Shutdown 1 528 C 468 — — — — — 4561998003 06-Sep-98 Braidwood 1 Shutdown 1 528 C 468 — — — — — 2551998013 22-Dec-98 Palisades Shutdown 1 30 U 0 — — — — — 2551998013 22-Dec-98 Palisades Shutdown 1 30 U 0 — — — — — 4611999002 06-Jan-99 Clinton 1 Shutdown 1 492 C 432 — — — — — 4611999002 06-Jan-99 Clinton 1 Shutdown 1 531 C 471 — — — — —
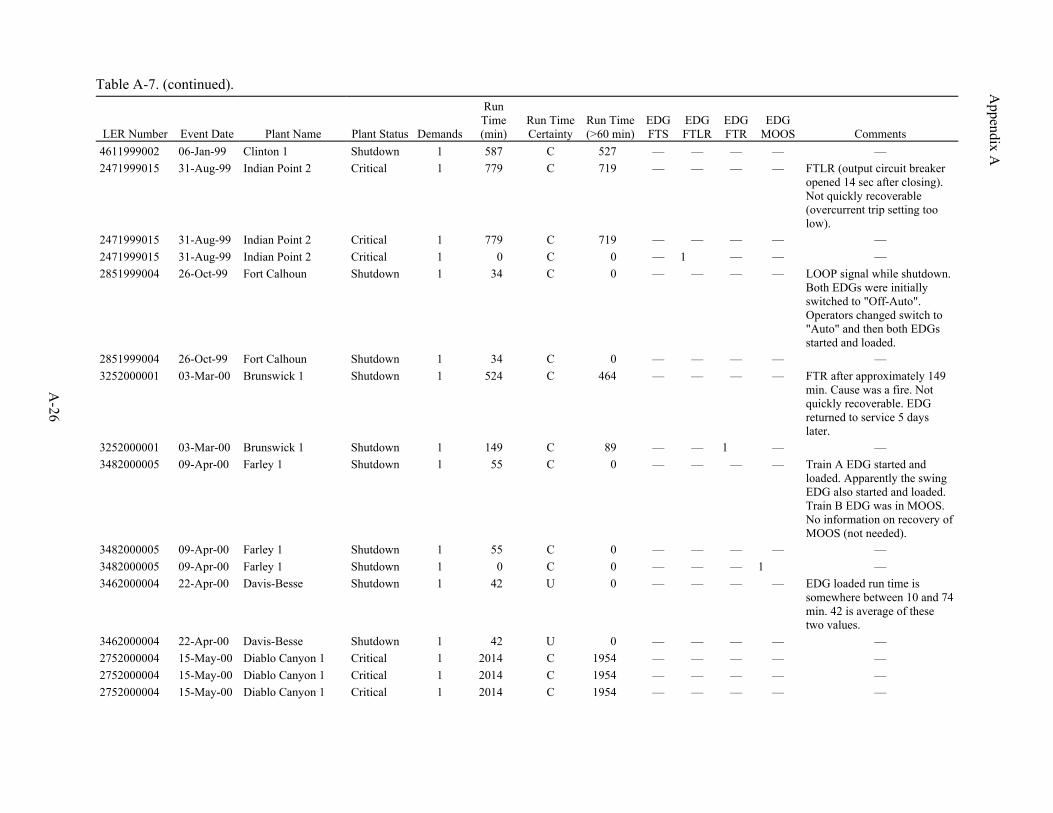
Appendix A
Table A-7. (continued).
A-26
LER Number Event Date Plant Name Plant Status Demands
Run Time (min)
Run Time Certainty
Run Time (>60 min)
EDG FTS
EDG FTLR
EDG FTR
EDG MOOS Comments
4611999002 06-Jan-99 Clinton 1 Shutdown 1 587 C 527 — — — — — 2471999015 31-Aug-99 Indian Point 2 Critical 1 779 C 719 — — — — FTLR (output circuit breaker
opened 14 sec after closing). Not quickly recoverable (overcurrent trip setting too low).
2471999015 31-Aug-99 Indian Point 2 Critical 1 779 C 719 — — — — — 2471999015 31-Aug-99 Indian Point 2 Critical 1 0 C 0 — 1 — — — 2851999004 26-Oct-99 Fort Calhoun Shutdown 1 34 C 0 — — — — LOOP signal while shutdown.
Both EDGs were initially switched to "Off-Auto". Operators changed switch to "Auto" and then both EDGs started and loaded.
2851999004 26-Oct-99 Fort Calhoun Shutdown 1 34 C 0 — — — — — 3252000001 03-Mar-00 Brunswick 1 Shutdown 1 524 C 464 — — — — FTR after approximately 149
min. Cause was a fire. Not quickly recoverable. EDG returned to service 5 days later.
3252000001 03-Mar-00 Brunswick 1 Shutdown 1 149 C 89 — — 1 — — 3482000005 09-Apr-00 Farley 1 Shutdown 1 55 C 0 — — — — Train A EDG started and
loaded. Apparently the swing EDG also started and loaded. Train B EDG was in MOOS. No information on recovery of MOOS (not needed).
3482000005 09-Apr-00 Farley 1 Shutdown 1 55 C 0 — — — — — 3482000005 09-Apr-00 Farley 1 Shutdown 1 0 C 0 — — — 1 — 3462000004 22-Apr-00 Davis-Besse Shutdown 1 42 U 0 — — — — EDG loaded run time is
somewhere between 10 and 74 min. 42 is average of these two values.
3462000004 22-Apr-00 Davis-Besse Shutdown 1 42 U 0 — — — — — 2752000004 15-May-00 Diablo Canyon 1 Critical 1 2014 C 1954 — — — — — 2752000004 15-May-00 Diablo Canyon 1 Critical 1 2014 C 1954 — — — — — 2752000004 15-May-00 Diablo Canyon 1 Critical 1 2014 C 1954 — — — — —
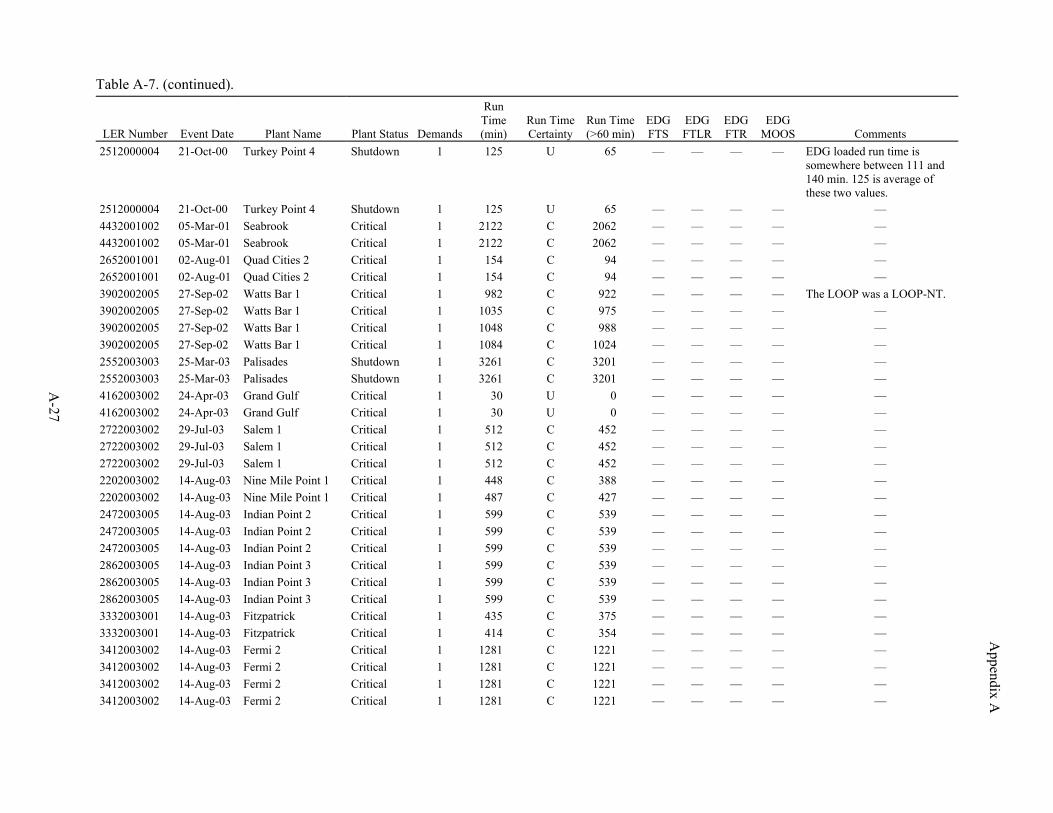
Appendix A
Table A-7. (continued).
A-27
LER Number Event Date Plant Name Plant Status Demands
Run Time (min)
Run Time Certainty
Run Time (>60 min)
EDG FTS
EDG FTLR
EDG FTR
EDG MOOS Comments
2512000004 21-Oct-00 Turkey Point 4 Shutdown 1 125 U 65 — — — — EDG loaded run time is somewhere between 111 and 140 min. 125 is average of these two values.
2512000004 21-Oct-00 Turkey Point 4 Shutdown 1 125 U 65 — — — — — 4432001002 05-Mar-01 Seabrook Critical 1 2122 C 2062 — — — — — 4432001002 05-Mar-01 Seabrook Critical 1 2122 C 2062 — — — — — 2652001001 02-Aug-01 Quad Cities 2 Critical 1 154 C 94 — — — — — 2652001001 02-Aug-01 Quad Cities 2 Critical 1 154 C 94 — — — — — 3902002005 27-Sep-02 Watts Bar 1 Critical 1 982 C 922 — — — — The LOOP was a LOOP-NT. 3902002005 27-Sep-02 Watts Bar 1 Critical 1 1035 C 975 — — — — — 3902002005 27-Sep-02 Watts Bar 1 Critical 1 1048 C 988 — — — — — 3902002005 27-Sep-02 Watts Bar 1 Critical 1 1084 C 1024 — — — — — 2552003003 25-Mar-03 Palisades Shutdown 1 3261 C 3201 — — — — — 2552003003 25-Mar-03 Palisades Shutdown 1 3261 C 3201 — — — — — 4162003002 24-Apr-03 Grand Gulf Critical 1 30 U 0 — — — — — 4162003002 24-Apr-03 Grand Gulf Critical 1 30 U 0 — — — — — 2722003002 29-Jul-03 Salem 1 Critical 1 512 C 452 — — — — — 2722003002 29-Jul-03 Salem 1 Critical 1 512 C 452 — — — — — 2722003002 29-Jul-03 Salem 1 Critical 1 512 C 452 — — — — — 2202003002 14-Aug-03 Nine Mile Point 1 Critical 1 448 C 388 — — — — — 2202003002 14-Aug-03 Nine Mile Point 1 Critical 1 487 C 427 — — — — — 2472003005 14-Aug-03 Indian Point 2 Critical 1 599 C 539 — — — — — 2472003005 14-Aug-03 Indian Point 2 Critical 1 599 C 539 — — — — — 2472003005 14-Aug-03 Indian Point 2 Critical 1 599 C 539 — — — — — 2862003005 14-Aug-03 Indian Point 3 Critical 1 599 C 539 — — — — — 2862003005 14-Aug-03 Indian Point 3 Critical 1 599 C 539 — — — — — 2862003005 14-Aug-03 Indian Point 3 Critical 1 599 C 539 — — — — — 3332003001 14-Aug-03 Fitzpatrick Critical 1 435 C 375 — — — — — 3332003001 14-Aug-03 Fitzpatrick Critical 1 414 C 354 — — — — — 3412003002 14-Aug-03 Fermi 2 Critical 1 1281 C 1221 — — — — — 3412003002 14-Aug-03 Fermi 2 Critical 1 1281 C 1221 — — — — — 3412003002 14-Aug-03 Fermi 2 Critical 1 1281 C 1221 — — — — — 3412003002 14-Aug-03 Fermi 2 Critical 1 1281 C 1221 — — — — —
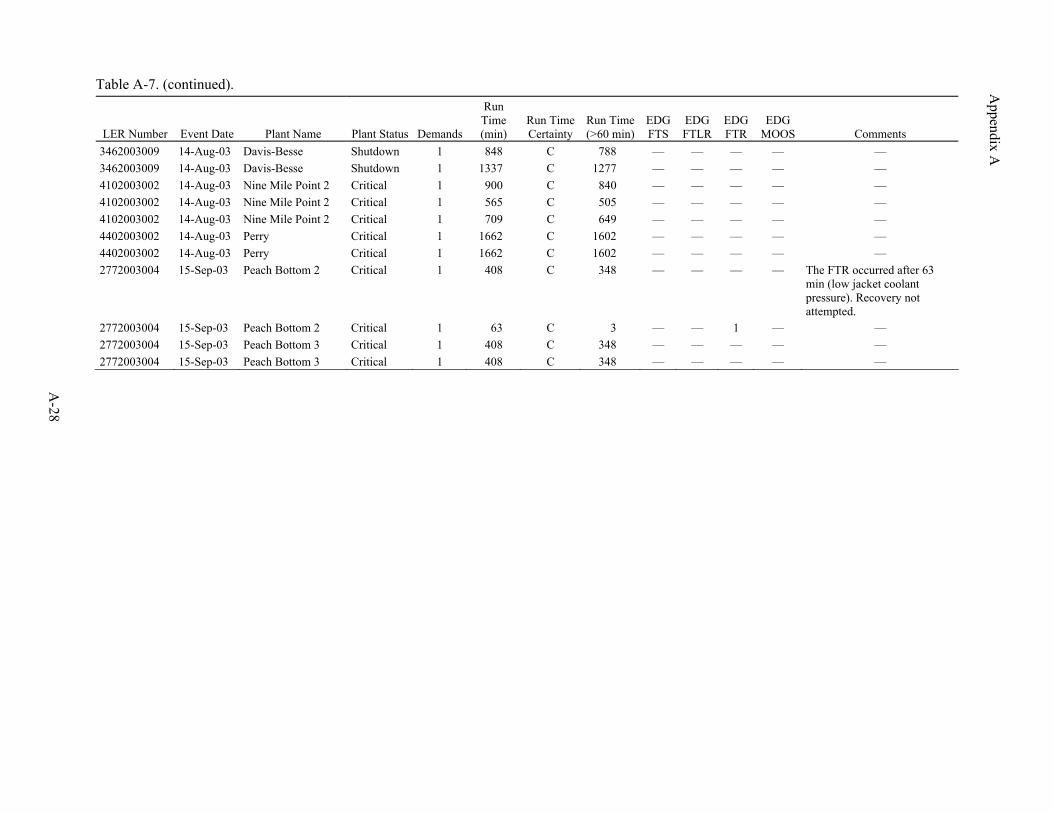
Appendix A
Table A-7. (continued).
A-28
LER Number Event Date Plant Name Plant Status Demands
Run Time (min)
Run Time Certainty
Run Time (>60 min)
EDG FTS
EDG FTLR
EDG FTR
EDG MOOS Comments
3462003009 14-Aug-03 Davis-Besse Shutdown 1 848 C 788 — — — — — 3462003009 14-Aug-03 Davis-Besse Shutdown 1 1337 C 1277 — — — — — 4102003002 14-Aug-03 Nine Mile Point 2 Critical 1 900 C 840 — — — — — 4102003002 14-Aug-03 Nine Mile Point 2 Critical 1 565 C 505 — — — — — 4102003002 14-Aug-03 Nine Mile Point 2 Critical 1 709 C 649 — — — — — 4402003002 14-Aug-03 Perry Critical 1 1662 C 1602 — — — — — 4402003002 14-Aug-03 Perry Critical 1 1662 C 1602 — — — — — 2772003004 15-Sep-03 Peach Bottom 2 Critical 1 408 C 348 — — — — The FTR occurred after 63
min (low jacket coolant pressure). Recovery not attempted.
2772003004 15-Sep-03 Peach Bottom 2 Critical 1 63 C 3 — — 1 — — 2772003004 15-Sep-03 Peach Bottom 3 Critical 1 408 C 348 — — — — — 2772003004 15-Sep-03 Peach Bottom 3 Critical 1 408 C 348 — — — — —
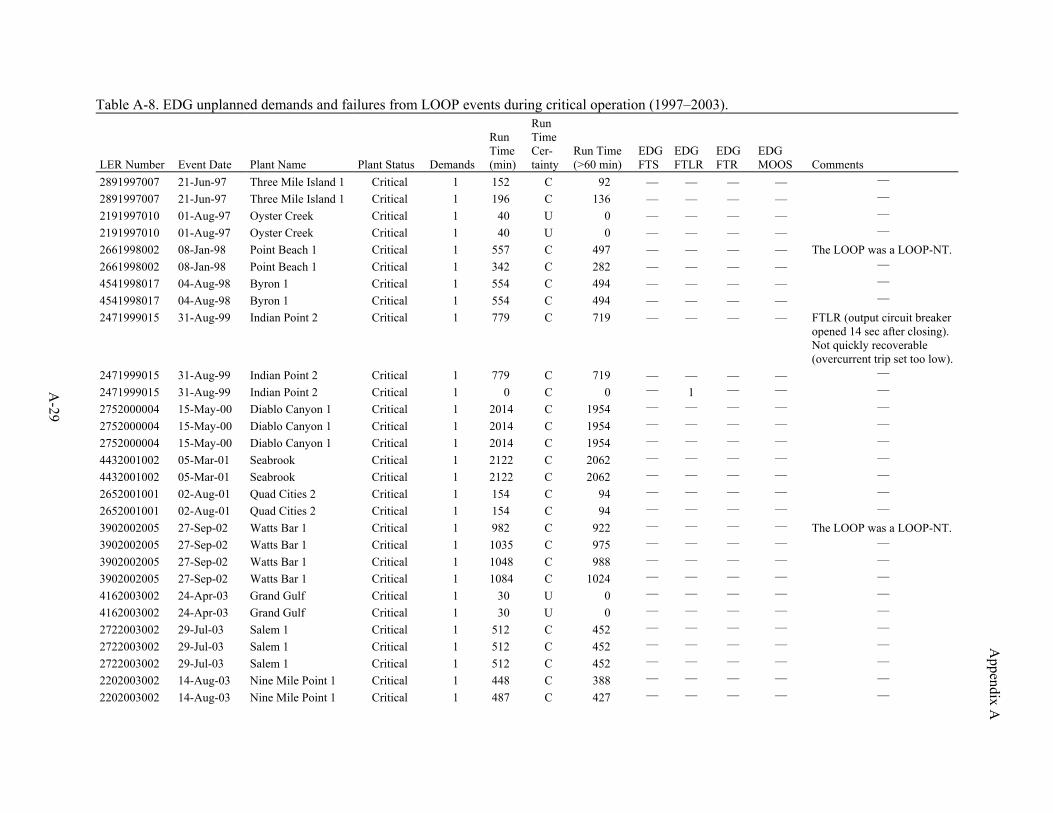
Appendix A
A-29
Table A-8. EDG unplanned demands and failures from LOOP events during critical operation (1997–2003).
LER Number Event Date Plant Name Plant Status Demands
Run Time (min)
Run Time Cer-tainty
Run Time (>60 min)
EDG FTS
EDG FTLR
EDG FTR
EDG MOOS Comments
2891997007 21-Jun-97 Three Mile Island 1 Critical 1 152 C 92 — — — — — 2891997007 21-Jun-97 Three Mile Island 1 Critical 1 196 C 136 — — — — — 2191997010 01-Aug-97 Oyster Creek Critical 1 40 U 0 — — — — — 2191997010 01-Aug-97 Oyster Creek Critical 1 40 U 0 — — — — — 2661998002 08-Jan-98 Point Beach 1 Critical 1 557 C 497 — — — — The LOOP was a LOOP-NT. 2661998002 08-Jan-98 Point Beach 1 Critical 1 342 C 282 — — — — — 4541998017 04-Aug-98 Byron 1 Critical 1 554 C 494 — — — — — 4541998017 04-Aug-98 Byron 1 Critical 1 554 C 494 — — — — — 2471999015 31-Aug-99 Indian Point 2 Critical 1 779 C 719 — — — — FTLR (output circuit breaker
opened 14 sec after closing). Not quickly recoverable (overcurrent trip set too low).
2471999015 31-Aug-99 Indian Point 2 Critical 1 779 C 719 — — — — — 2471999015 31-Aug-99 Indian Point 2 Critical 1 0 C 0 — 1 — — — 2752000004 15-May-00 Diablo Canyon 1 Critical 1 2014 C 1954 — — — — — 2752000004 15-May-00 Diablo Canyon 1 Critical 1 2014 C 1954 — — — — — 2752000004 15-May-00 Diablo Canyon 1 Critical 1 2014 C 1954 — — — — — 4432001002 05-Mar-01 Seabrook Critical 1 2122 C 2062 — — — — — 4432001002 05-Mar-01 Seabrook Critical 1 2122 C 2062 — — — — — 2652001001 02-Aug-01 Quad Cities 2 Critical 1 154 C 94 — — — — — 2652001001 02-Aug-01 Quad Cities 2 Critical 1 154 C 94 — — — — — 3902002005 27-Sep-02 Watts Bar 1 Critical 1 982 C 922 — — — — The LOOP was a LOOP-NT. 3902002005 27-Sep-02 Watts Bar 1 Critical 1 1035 C 975 — — — — — 3902002005 27-Sep-02 Watts Bar 1 Critical 1 1048 C 988 — — — — — 3902002005 27-Sep-02 Watts Bar 1 Critical 1 1084 C 1024 — — — — — 4162003002 24-Apr-03 Grand Gulf Critical 1 30 U 0 — — — — — 4162003002 24-Apr-03 Grand Gulf Critical 1 30 U 0 — — — — — 2722003002 29-Jul-03 Salem 1 Critical 1 512 C 452 — — — — — 2722003002 29-Jul-03 Salem 1 Critical 1 512 C 452 — — — — — 2722003002 29-Jul-03 Salem 1 Critical 1 512 C 452 — — — — — 2202003002 14-Aug-03 Nine Mile Point 1 Critical 1 448 C 388 — — — — — 2202003002 14-Aug-03 Nine Mile Point 1 Critical 1 487 C 427 — — — — —
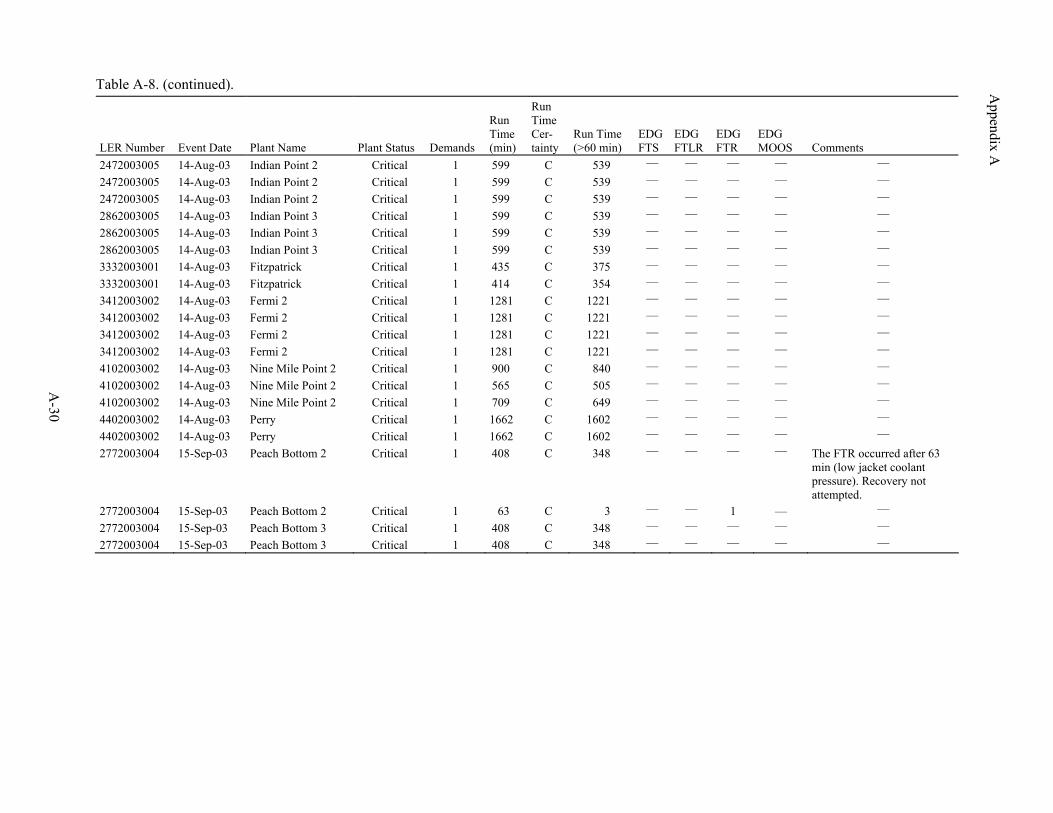
Appendix A
Table A-8. (continued).
A-30
LER Number Event Date Plant Name Plant Status Demands
Run Time (min)
Run Time Cer-tainty
Run Time (>60 min)
EDG FTS
EDG FTLR
EDG FTR
EDG MOOS Comments
2472003005 14-Aug-03 Indian Point 2 Critical 1 599 C 539 — — — — — 2472003005 14-Aug-03 Indian Point 2 Critical 1 599 C 539 — — — — — 2472003005 14-Aug-03 Indian Point 2 Critical 1 599 C 539 — — — — — 2862003005 14-Aug-03 Indian Point 3 Critical 1 599 C 539 — — — — — 2862003005 14-Aug-03 Indian Point 3 Critical 1 599 C 539 — — — — — 2862003005 14-Aug-03 Indian Point 3 Critical 1 599 C 539 — — — — — 3332003001 14-Aug-03 Fitzpatrick Critical 1 435 C 375 — — — — — 3332003001 14-Aug-03 Fitzpatrick Critical 1 414 C 354 — — — — — 3412003002 14-Aug-03 Fermi 2 Critical 1 1281 C 1221 — — — — — 3412003002 14-Aug-03 Fermi 2 Critical 1 1281 C 1221 — — — — — 3412003002 14-Aug-03 Fermi 2 Critical 1 1281 C 1221 — — — — — 3412003002 14-Aug-03 Fermi 2 Critical 1 1281 C 1221 — — — — — 4102003002 14-Aug-03 Nine Mile Point 2 Critical 1 900 C 840 — — — — — 4102003002 14-Aug-03 Nine Mile Point 2 Critical 1 565 C 505 — — — — — 4102003002 14-Aug-03 Nine Mile Point 2 Critical 1 709 C 649 — — — — — 4402003002 14-Aug-03 Perry Critical 1 1662 C 1602 — — — — — 4402003002 14-Aug-03 Perry Critical 1 1662 C 1602 — — — — — 2772003004 15-Sep-03 Peach Bottom 2 Critical 1 408 C 348 — — — — The FTR occurred after 63
min (low jacket coolant pressure). Recovery not attempted.
2772003004 15-Sep-03 Peach Bottom 2 Critical 1 63 C 3 — — 1 — — 2772003004 15-Sep-03 Peach Bottom 3 Critical 1 408 C 348 — — — — — 2772003004 15-Sep-03 Peach Bottom 3 Critical 1 408 C 348 — — — — —
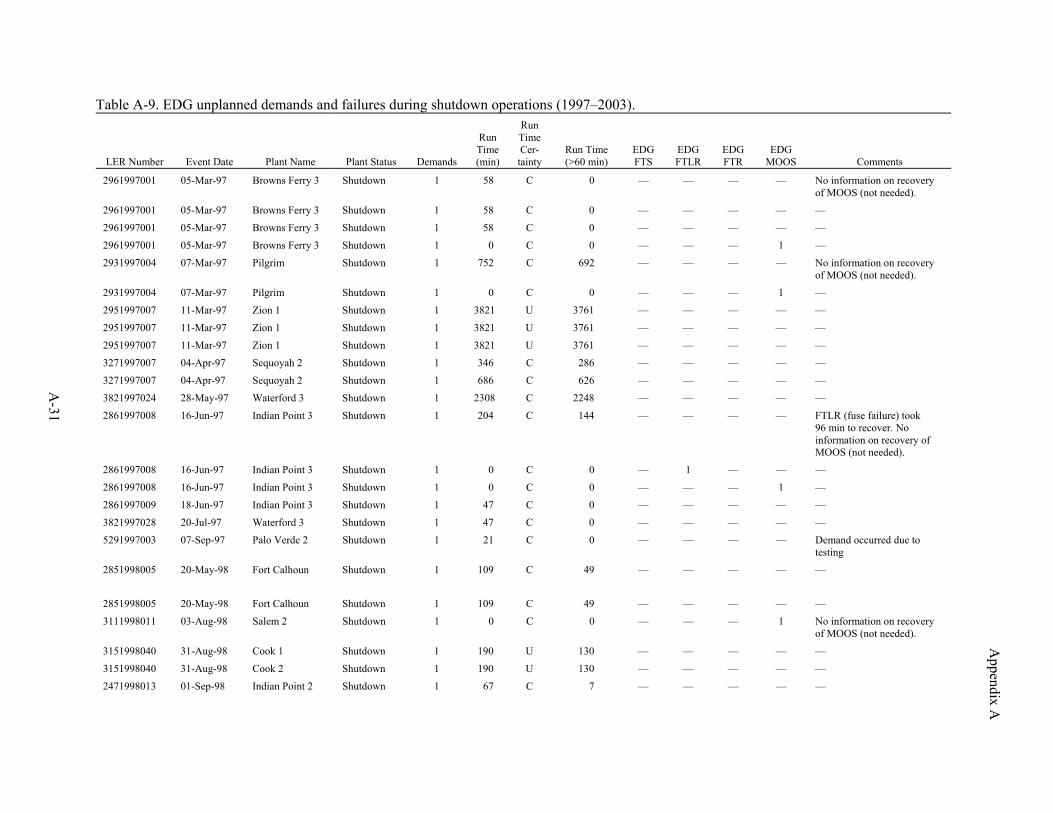
Appendix A
A-31
Table A-9. EDG unplanned demands and failures during shutdown operations (1997–2003).
LER Number Event Date Plant Name Plant Status Demands
Run Time (min)
Run Time Cer-tainty
Run Time (>60 min)
EDG FTS
EDG FTLR
EDG FTR
EDG MOOS Comments
2961997001 05-Mar-97 Browns Ferry 3 Shutdown 1 58 C 0 — — — — No information on recovery of MOOS (not needed).
2961997001 05-Mar-97 Browns Ferry 3 Shutdown 1 58 C 0 — — — — —
2961997001 05-Mar-97 Browns Ferry 3 Shutdown 1 58 C 0 — — — — —
2961997001 05-Mar-97 Browns Ferry 3 Shutdown 1 0 C 0 — — — 1 —
2931997004 07-Mar-97 Pilgrim Shutdown 1 752 C 692 — — — — No information on recovery of MOOS (not needed).
2931997004 07-Mar-97 Pilgrim Shutdown 1 0 C 0 — — — 1 —
2951997007 11-Mar-97 Zion 1 Shutdown 1 3821 U 3761 — — — — —
2951997007 11-Mar-97 Zion 1 Shutdown 1 3821 U 3761 — — — — —
2951997007 11-Mar-97 Zion 1 Shutdown 1 3821 U 3761 — — — — —
3271997007 04-Apr-97 Sequoyah 2 Shutdown 1 346 C 286 — — — — —
3271997007 04-Apr-97 Sequoyah 2 Shutdown 1 686 C 626 — — — — —
3821997024 28-May-97 Waterford 3 Shutdown 1 2308 C 2248 — — — — —
2861997008 16-Jun-97 Indian Point 3 Shutdown 1 204 C 144 — — — — FTLR (fuse failure) took 96 min to recover. No information on recovery of MOOS (not needed).
2861997008 16-Jun-97 Indian Point 3 Shutdown 1 0 C 0 — 1 — — —
2861997008 16-Jun-97 Indian Point 3 Shutdown 1 0 C 0 — — — 1 —
2861997009 18-Jun-97 Indian Point 3 Shutdown 1 47 C 0 — — — — —
3821997028 20-Jul-97 Waterford 3 Shutdown 1 47 C 0 — — — — —
5291997003 07-Sep-97 Palo Verde 2 Shutdown 1 21 C 0 — — — — Demand occurred due to testing
2851998005 20-May-98 Fort Calhoun Shutdown 1 109 C 49 — — — — —
2851998005 20-May-98 Fort Calhoun Shutdown 1 109 C 49 — — — — —
3111998011 03-Aug-98 Salem 2 Shutdown 1 0 C 0 — — — 1 No information on recovery of MOOS (not needed).
3151998040 31-Aug-98 Cook 1 Shutdown 1 190 U 130 — — — — —
3151998040 31-Aug-98 Cook 2 Shutdown 1 190 U 130 — — — — —
2471998013 01-Sep-98 Indian Point 2 Shutdown 1 67 C 7 — — — — —
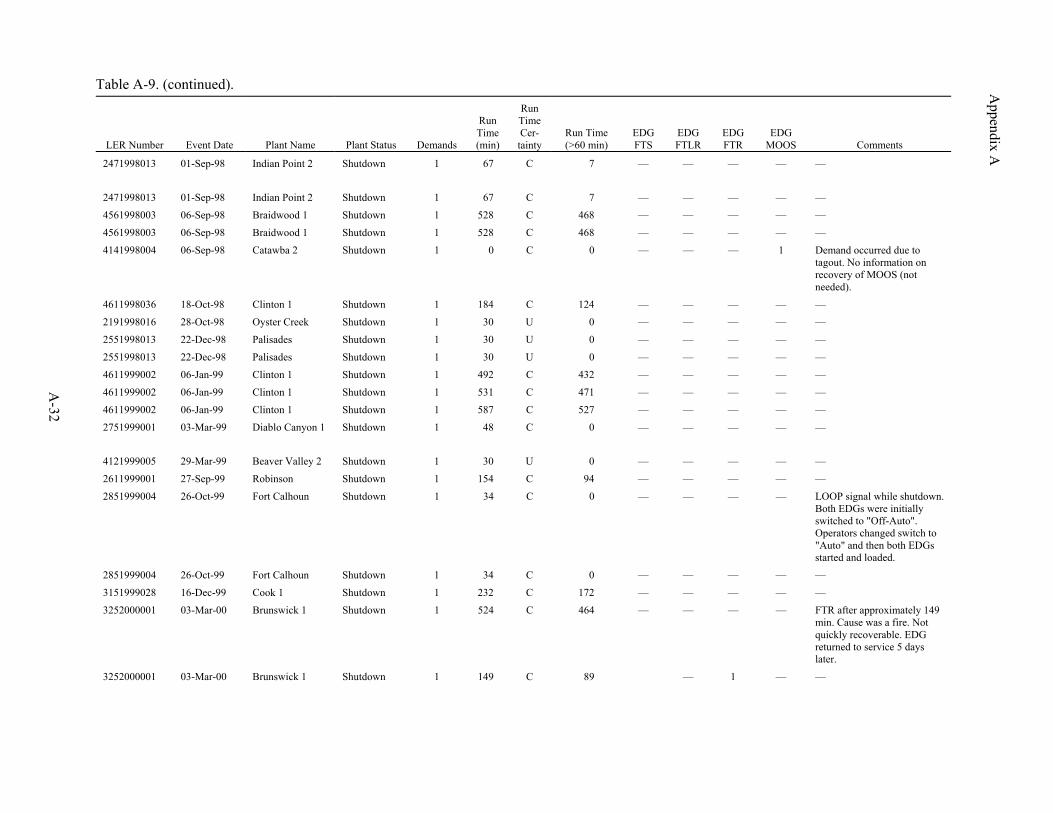
Appendix A
Table A-9. (continued).
A-32
LER Number Event Date Plant Name Plant Status Demands
Run Time (min)
Run Time Cer-tainty
Run Time (>60 min)
EDG FTS
EDG FTLR
EDG FTR
EDG MOOS Comments
2471998013 01-Sep-98 Indian Point 2 Shutdown 1 67 C 7 — — — — —
2471998013 01-Sep-98 Indian Point 2 Shutdown 1 67 C 7 — — — — —
4561998003 06-Sep-98 Braidwood 1 Shutdown 1 528 C 468 — — — — —
4561998003 06-Sep-98 Braidwood 1 Shutdown 1 528 C 468 — — — — —
4141998004 06-Sep-98 Catawba 2 Shutdown 1 0 C 0 — — — 1 Demand occurred due to tagout. No information on recovery of MOOS (not needed).
4611998036 18-Oct-98 Clinton 1 Shutdown 1 184 C 124 — — — — —
2191998016 28-Oct-98 Oyster Creek Shutdown 1 30 U 0 — — — — —
2551998013 22-Dec-98 Palisades Shutdown 1 30 U 0 — — — — —
2551998013 22-Dec-98 Palisades Shutdown 1 30 U 0 — — — — —
4611999002 06-Jan-99 Clinton 1 Shutdown 1 492 C 432 — — — — —
4611999002 06-Jan-99 Clinton 1 Shutdown 1 531 C 471 — — — — —
4611999002 06-Jan-99 Clinton 1 Shutdown 1 587 C 527 — — — — —
2751999001 03-Mar-99 Diablo Canyon 1 Shutdown 1 48 C 0 — — — — —
4121999005 29-Mar-99 Beaver Valley 2 Shutdown 1 30 U 0 — — — — —
2611999001 27-Sep-99 Robinson Shutdown 1 154 C 94 — — — — —
2851999004 26-Oct-99 Fort Calhoun Shutdown 1 34 C 0 — — — — LOOP signal while shutdown. Both EDGs were initially switched to "Off-Auto". Operators changed switch to "Auto" and then both EDGs started and loaded.
2851999004 26-Oct-99 Fort Calhoun Shutdown 1 34 C 0 — — — — —
3151999028 16-Dec-99 Cook 1 Shutdown 1 232 C 172 — — — — —
3252000001 03-Mar-00 Brunswick 1 Shutdown 1 524 C 464 — — — — FTR after approximately 149 min. Cause was a fire. Not quickly recoverable. EDG returned to service 5 days later.
3252000001 03-Mar-00 Brunswick 1 Shutdown 1 149 C 89 — 1 — —
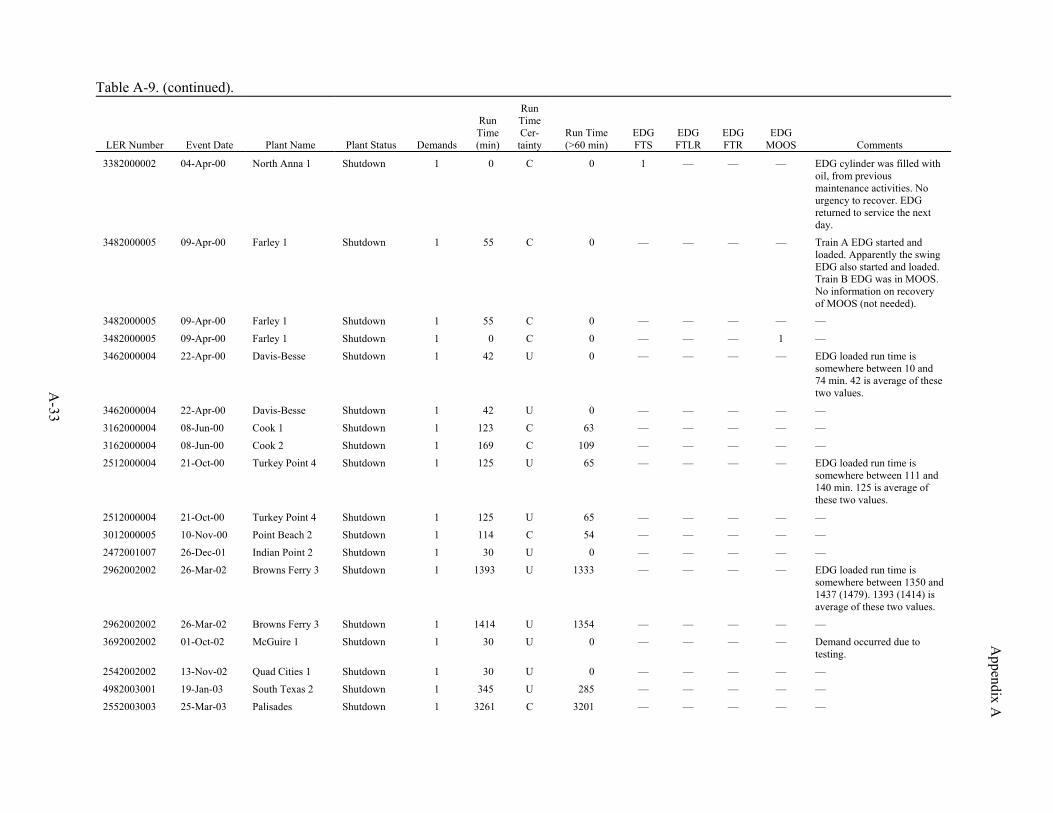
Appendix A
Table A-9. (continued).
A-33
LER Number Event Date Plant Name Plant Status Demands
Run Time (min)
Run Time Cer-tainty
Run Time (>60 min)
EDG FTS
EDG FTLR
EDG FTR
EDG MOOS Comments
3382000002 04-Apr-00 North Anna 1 Shutdown 1 0 C 0 1 — — — EDG cylinder was filled with oil, from previous maintenance activities. No urgency to recover. EDG returned to service the next day.
3482000005 09-Apr-00 Farley 1 Shutdown 1 55 C 0 — — — — Train A EDG started and loaded. Apparently the swing EDG also started and loaded. Train B EDG was in MOOS. No information on recovery of MOOS (not needed).
3482000005 09-Apr-00 Farley 1 Shutdown 1 55 C 0 — — — — —
3482000005 09-Apr-00 Farley 1 Shutdown 1 0 C 0 — — — 1 —
3462000004 22-Apr-00 Davis-Besse Shutdown 1 42 U 0 — — — — EDG loaded run time is somewhere between 10 and 74 min. 42 is average of these two values.
3462000004 22-Apr-00 Davis-Besse Shutdown 1 42 U 0 — — — — —
3162000004 08-Jun-00 Cook 1 Shutdown 1 123 C 63 — — — — —
3162000004 08-Jun-00 Cook 2 Shutdown 1 169 C 109 — — — — —
2512000004 21-Oct-00 Turkey Point 4 Shutdown 1 125 U 65 — — — — EDG loaded run time is somewhere between 111 and 140 min. 125 is average of these two values.
2512000004 21-Oct-00 Turkey Point 4 Shutdown 1 125 U 65 — — — — —
3012000005 10-Nov-00 Point Beach 2 Shutdown 1 114 C 54 — — — — —
2472001007 26-Dec-01 Indian Point 2 Shutdown 1 30 U 0 — — — — —
2962002002 26-Mar-02 Browns Ferry 3 Shutdown 1 1393 U 1333 — — — — EDG loaded run time is somewhere between 1350 and 1437 (1479). 1393 (1414) is average of these two values.
2962002002 26-Mar-02 Browns Ferry 3 Shutdown 1 1414 U 1354 — — — — —
3692002002 01-Oct-02 McGuire 1 Shutdown 1 30 U 0 — — — — Demand occurred due to testing.
2542002002 13-Nov-02 Quad Cities 1 Shutdown 1 30 U 0 — — — — —
4982003001 19-Jan-03 South Texas 2 Shutdown 1 345 U 285 — — — — —
2552003003 25-Mar-03 Palisades Shutdown 1 3261 C 3201 — — — — —
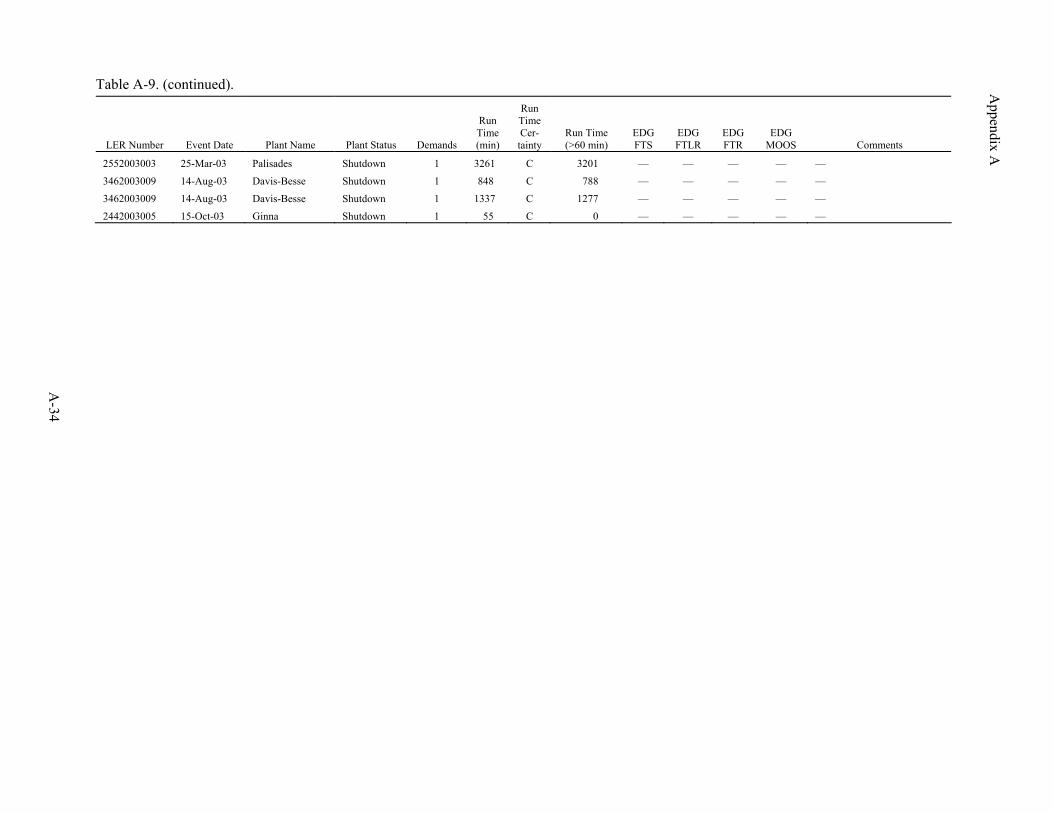
Appendix A
Table A-9. (continued).
A-34
LER Number Event Date Plant Name Plant Status Demands
Run Time (min)
Run Time Cer-tainty
Run Time (>60 min)
EDG FTS
EDG FTLR
EDG FTR
EDG MOOS Comments
2552003003 25-Mar-03 Palisades Shutdown 1 3261 C 3201 — — — — —
3462003009 14-Aug-03 Davis-Besse Shutdown 1 848 C 788 — — — — —
3462003009 14-Aug-03 Davis-Besse Shutdown 1 1337 C 1277 — — — — —
2442003005 15-Oct-03 Ginna Shutdown 1 55 C 0 — — — — —
Appendix A
A-35
A-4. REFERENCES
1. Mann, Nancy R., Ray E. Schafer, and Nozer D. Singpurwalla, Methods for Statistical Analysis of Reliability and Life Data, John Wiley & Sons, New York, 1974, p. 326.
2. Grant, G. M., J. P. Poloski, A. J. Luptak, C. D. Gentillon, W. J. Galyean, Reliability Study: Emergency Diesel Generator Power System, 1987-1993, U.S. Nuclear Regulatory Commission, NUREG/CR-5500, V. 5, September, 1999.
3. Brownson, D. A., J. P. Poloski, C. L. Atwood, C. D. Gentillon, W. J. Galyean, Reliability Study Update: Emergency Diesel Generator (EDG) Power System, 1987–1998, INEEL/EXT-99-01312, Idaho National Engineering and Environmental Laboratory, December, 1999.

Appendix A
A-36
B-1
Appendix B
Plant-Specific Emergency Power System Results

Appendix B
B-2
Appendix B
B-3
CONTENTS
B−1. EPS CLASS ................................................................................................................................ B−5
B−2. CLASS IMPORTANCE ............................................................................................................. B−5
FIGURES
B−1. Point estimate ranges for EPS classes. ........................................................................................... B-10
B−2. Class 2 EPS component importance. ............................................................................................. B-14
B−3. Class 3 EPS component importance. ............................................................................................. B-14
B−4. Class 4 EPS component importance. ............................................................................................. B-15
TABLES
B−1. EPS total unreliability distributions by plant .............................................................................. B−5
B−2. Plants by EPS Class .................................................................................................................... B−9
B−3. EPS total unreliability distributions by class and point estimate .............................................. B−11

Appendix B
B-4
B-5
Appendix B
Plant-Specific Emergency Power System Results
The emergency power system (EPS) fault tree for each plant has been calculated using the standardized plant analysis risk (SPAR) models. This appendix presents the results of those calculations. The EPS system fault tree for each plant was evaluated using the baseline component failure data (which includes a 24-h mission time for the emergency diesel generator). The results of the uncertainty calculations are shown in Table B-1.
B-1. EPS CLASS
The emergency power systems of many plants are configured similarly. In order to summarize the total unreliability results from the SPAR models, a scheme to group the EPS for several plants together was developed. The EPS, as modeled in the SPAR models, consists of the emergency power supplies, support equipment, electrical components, and human actions. The classification scheme follows the effective number of redundant or diverse emergency power sources:
Class 2—Plant EPS effectively has a success criterion of one out of two emergency power sources. Class 3—Plant EPS effectively has a success criterion of one out of three emergency power sources. Class 4—Plant EPS effectively has a success criterion of one out of four (or more) emergency power
sources.
Table B−2 lists the plants within each EPS class. Figure B−1 shows the range of EPS point estimate probabilities for each class. Table B−3 lists the EPS results by class, ordered from the lowest total unreliability to highest within each class.
B-2. CLASS IMPORTANCE
The importances of the major types of equipment modeled in the EPS system are shown for each class in Figure B−2 through Figure B−4 (CCF in theses figures is common-cause failure).
Table B−1. EPS total unreliability distributions by plant. Plant Class Point Estimate 5% Median Mean 95%
Arkansas 1 Class 3 3.01E-04 6.30E-05 2.54E-04 3.70E-04 1.06E-03
Arkansas 2 Class 2 1.73E-03 2.81E-04 1.43E-03 2.22E-03 6.50E-03
Beaver Valley 1 Class 3 1.42E-04 1.73E-05 1.12E-04 2.47E-04 9.17E-04
Beaver Valley 2 Class 3 1.88E-04 1.89E-05 1.39E-04 3.09E-04 1.13E-03
Braidwood 1 Class 3 3.92E-04 8.92E-05 3.27E-04 5.26E-04 1.53E-03
Braidwood 2 Class 3 3.92E-04 8.92E-05 3.27E-04 5.26E-04 1.53E-03
Browns Ferry 2 Class 4 3.27E-05 3.84E-06 2.56E-05 5.79E-05 2.09E-04
Browns Ferry 3 Class 4 3.23E-05 4.09E-06 2.59E-05 5.73E-05 1.84E-04
Brunswick 1 Class 2 2.06E-03 4.35E-04 1.70E-03 2.44E-03 6.73E-03
Brunswick 2 Class 2 2.06E-03 4.35E-04 1.70E-03 2.44E-03 6.73E-03
Appendix B Table B-1. (continued).
B-6
Plant Class Point Estimate 5% Median Mean 95%
Byron 1 Class 3 3.92E-04 8.92E-05 3.27E-04 5.26E-04 1.53E-03
Byron 2 Class 3 3.92E-04 8.92E-05 3.27E-04 5.26E-04 1.53E-03
Callaway Class 2 4.26E-03 8.11E-04 3.41E-03 5.52E-03 1.88E-02
Calvert Cliffs 1 Class 3 1.30E-04 1.46E-05 9.84E-05 1.94E-04 6.79E-04
Calvert Cliffs 2 Class 3 1.30E-04 1.46E-05 9.84E-05 1.94E-04 6.79E-04
Catawba 1 Class 3 1.81E-03 2.94E-04 1.44E-03 2.13E-03 6.56E-03
Catawba 2 Class 3 1.81E-03 2.94E-04 1.44E-03 2.13E-03 6.56E-03
Clinton 1 Class 2 4.58E-03 8.98E-04 3.72E-03 5.90E-03 1.81E-02
Columbia 2 Class 2 4.85E-03 9.79E-04 3.81E-03 6.18E-03 1.87E-02
Comanche Peak 1 Class 2 4.10E-03 7.07E-04 3.07E-03 5.42E-03 1.95E-02
Comanche Peak 2 Class 2 4.10E-03 7.07E-04 3.07E-03 5.42E-03 1.95E-02
Cook 1 Class 2 1.96E-03 3.53E-04 1.67E-03 2.35E-03 6.57E-03
Cook 2 Class 2 1.96E-03 3.53E-04 1.67E-03 2.35E-03 6.57E-03
Cooper Class 2 7.29E-03 9.31E-04 4.57E-03 1.11E-02 4.29E-02
Crystal River 3 Class 2 2.21E-03 4.42E-04 1.93E-03 2.58E-03 6.97E-03
Davis-Besse Class 3 2.81E-03 5.83E-04 2.36E-03 3.27E-03 8.83E-03
Diablo Canyon 1 Class 3 2.42E-04 5.52E-05 2.11E-04 2.91E-04 7.20E-04
Diablo Canyon 2 Class 3 2.42E-04 5.52E-05 2.11E-04 2.91E-04 7.20E-04
Dresden 2 Class 4 1.44E-05 4.06E-07 9.12E-06 3.53E-05 1.39E-04
Dresden 3 Class 4 1.44E-05 4.06E-07 9.12E-06 3.53E-05 1.39E-04
Duane Arnold Class 2 5.29E-03 1.27E-03 4.30E-03 6.57E-03 1.91E-02
Farley 1 Class 3 3.07E-04 1.71E-05 1.85E-04 4.22E-04 1.64E-03
Farley 2 Class 3 3.07E-04 1.71E-05 1.85E-04 4.22E-04 1.64E-03
Fermi 2 Class 4 2.14E-05 9.14E-07 1.35E-05 4.96E-05 1.92E-04
FitzPatrick Class 4 1.43E-04 2.66E-05 1.10E-04 1.96E-04 5.62E-04
Fort Calhoun Class 2 1.88E-03 3.60E-04 1.63E-03 2.26E-03 6.20E-03
Ginna Class 2 1.90E-03 3.88E-04 1.57E-03 2.25E-03 6.16E-03
Grand Gulf Class 2 5.43E-03 1.07E-03 4.23E-03 6.74E-03 1.96E-02
Harris Class 2 4.66E-03 9.29E-04 3.70E-03 5.97E-03 1.84E-02
Hatch 1 Class 3 2.86E-04 5.83E-05 2.29E-04 3.63E-04 1.08E-03
Hatch 2 Class 3 2.86E-04 5.83E-05 2.29E-04 3.63E-04 1.08E-03
Hope Creek Class 3 8.58E-04 1.33E-04 6.49E-04 1.30E-03 4.25E-03
Indian Point 2 Class 3 1.41E-03 2.01E-04 1.03E-03 1.55E-03 4.66E-03
Indian Point 3 Class 3 3.62E-04 1.00E-04 3.29E-04 4.51E-04 1.13E-03
Kewaunee Class 2 2.98E-03 8.25E-04 2.67E-03 3.39E-03 8.52E-03
La Salle 1 Class 3 3.76E-04 4.68E-05 2.85E-04 6.12E-04 2.34E-03
La Salle 2 Class 3 3.76E-04 4.68E-05 2.85E-04 6.12E-04 2.34E-03
Limerick 1 Class 4 1.38E-04 2.47E-05 1.17E-04 2.32E-04 6.74E-04
Appendix B Table B-1. (continued).
B-7
Plant Class Point Estimate 5% Median Mean 95%
Limerick 2 Class 4 1.38E-04 2.47E-05 1.17E-04 2.32E-04 6.74E-04
McGuire 1 Class 2 2.44E-03 3.91E-04 1.94E-03 2.70E-03 7.54E-03
McGuire 2 Class 2 2.44E-03 3.91E-04 1.94E-03 2.70E-03 7.54E-03
Millstone 2 Class 3 3.49E-04 6.81E-05 2.95E-04 4.24E-04 1.24E-03
Millstone 3 Class 3 2.79E-04 5.73E-05 2.29E-04 3.43E-04 9.34E-04
Monticello Class 2 2.35E-03 6.36E-04 2.05E-03 2.75E-03 6.88E-03
Nine Mile Pt. 1 Class 2 4.11E-03 7.76E-04 3.30E-03 5.35E-03 1.71E-02
Nine Mile Pt. 2 Class 2 1.89E-03 3.99E-04 1.62E-03 2.30E-03 6.57E-03
North Anna 1 Class 4 8.76E-05 1.70E-05 6.81E-05 1.18E-04 3.49E-04
North Anna 2 Class 4 8.76E-05 1.70E-05 6.81E-05 1.18E-04 3.49E-04
Oconee 1 Class 2 1.98E-03 3.64E-04 1.64E-03 2.02E-03 5.08E-03
Oconee 2 Class 2 1.98E-03 3.64E-04 1.64E-03 2.02E-03 5.08E-03
Oconee 3 Class 2 1.98E-03 3.64E-04 1.64E-03 2.02E-03 5.08E-03
Oyster Creek Class 2 1.88E-03 3.96E-04 1.58E-03 2.26E-03 5.84E-03
Palisades Class 2 2.01E-03 4.41E-04 1.72E-03 2.40E-03 6.21E-03
Palo Verde 1 Class 3 1.48E-03 2.06E-04 1.04E-03 1.95E-03 6.68E-03
Palo Verde 2 Class 3 1.48E-03 2.06E-04 1.04E-03 1.95E-03 6.68E-03
Palo Verde 3 Class 3 1.48E-03 2.06E-04 1.04E-03 1.95E-03 6.68E-03
Peach Bottom 2 Class 3 1.22E-03 9.75E-05 8.05E-04 1.34E-03 4.39E-03
Peach Bottom 3 Class 3 1.22E-03 9.75E-05 8.05E-04 1.34E-03 4.39E-03
Perry Class 2 4.21E-03 7.06E-04 3.33E-03 5.48E-03 1.67E-02
Pilgrim Class 2 1.88E-03 3.60E-04 1.63E-03 2.26E-03 6.20E-03
Point Beach 1 Class 4 3.65E-05 1.96E-06 1.90E-05 4.58E-05 1.65E-04
Point Beach 2 Class 4 3.65E-05 1.96E-06 1.90E-05 4.58E-05 1.65E-04
Prairie Island 1 Class 4 1.15E-04 2.11E-05 9.55E-05 1.27E-04 3.54E-04
Prairie Island 2 Class 4 1.15E-04 2.11E-05 9.55E-05 1.27E-04 3.54E-04
Quad Cities 1 Class 4 1.34E-05 4.36E-07 8.29E-06 3.78E-05 1.50E-04
Quad Cities 2 Class 4 1.34E-05 4.36E-07 8.29E-06 3.78E-05 1.50E-04
River Bend Class 2 4.37E-03 9.15E-04 3.39E-03 5.18E-03 1.47E-02
Robinson 2 Class 2 2.74E-03 6.86E-04 2.32E-03 3.15E-03 8.07E-03
Salem 1 Class 3 9.50E-04 6.33E-05 5.85E-04 1.11E-03 3.91E-03
Salem 2 Class 3 9.50E-04 6.33E-05 5.85E-04 1.11E-03 3.91E-03
San Onofre 2 Class 3 3.06E-04 3.43E-05 2.43E-04 4.83E-04 1.77E-03
San Onofre 3 Class 3 3.06E-04 3.43E-05 2.43E-04 4.83E-04 1.77E-03
Seabrook Class 2 3.64E-03 8.32E-04 3.10E-03 4.20E-03 1.11E-02
Sequoyah 1 Class 3 4.90E-04 9.68E-05 4.25E-04 6.24E-04 1.78E-03
Sequoyah 2 Class 3 4.90E-04 9.68E-05 4.25E-04 6.24E-04 1.78E-03
South Texas 1 Class 3 2.71E-04 6.77E-05 2.30E-04 3.26E-04 9.24E-04
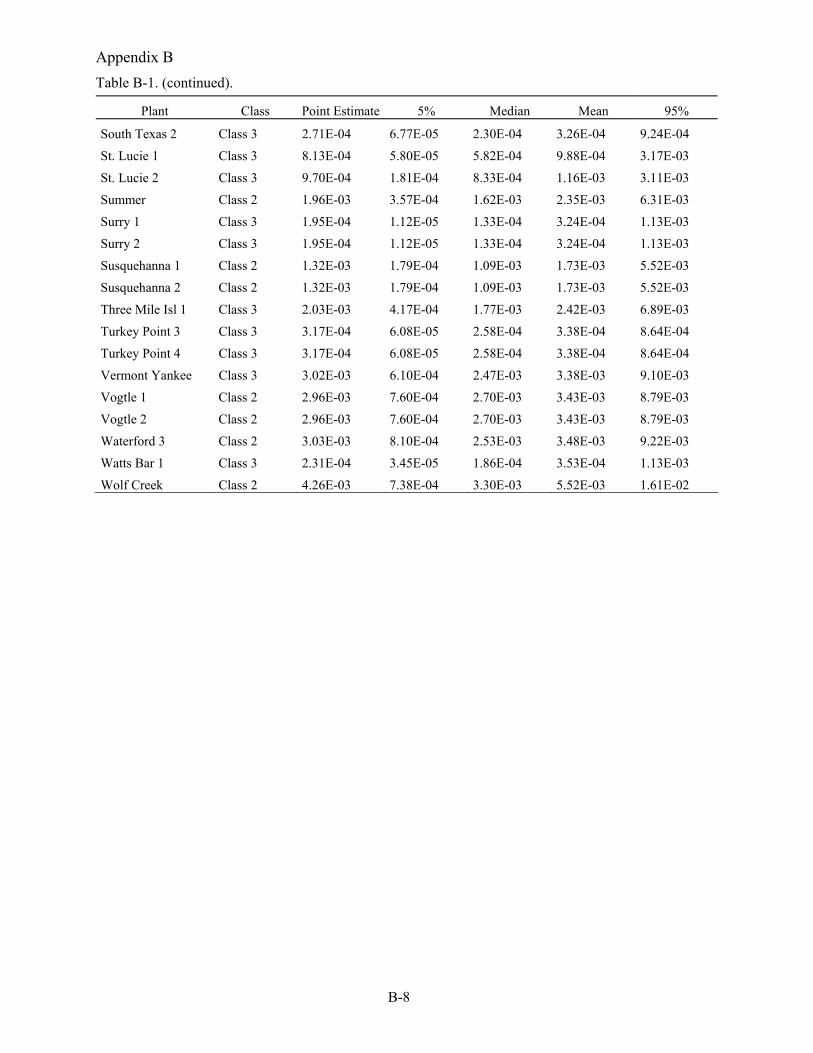
Appendix B Table B-1. (continued).
B-8
Plant Class Point Estimate 5% Median Mean 95%
South Texas 2 Class 3 2.71E-04 6.77E-05 2.30E-04 3.26E-04 9.24E-04
St. Lucie 1 Class 3 8.13E-04 5.80E-05 5.82E-04 9.88E-04 3.17E-03
St. Lucie 2 Class 3 9.70E-04 1.81E-04 8.33E-04 1.16E-03 3.11E-03
Summer Class 2 1.96E-03 3.57E-04 1.62E-03 2.35E-03 6.31E-03
Surry 1 Class 3 1.95E-04 1.12E-05 1.33E-04 3.24E-04 1.13E-03
Surry 2 Class 3 1.95E-04 1.12E-05 1.33E-04 3.24E-04 1.13E-03
Susquehanna 1 Class 2 1.32E-03 1.79E-04 1.09E-03 1.73E-03 5.52E-03
Susquehanna 2 Class 2 1.32E-03 1.79E-04 1.09E-03 1.73E-03 5.52E-03
Three Mile Isl 1 Class 3 2.03E-03 4.17E-04 1.77E-03 2.42E-03 6.89E-03
Turkey Point 3 Class 3 3.17E-04 6.08E-05 2.58E-04 3.38E-04 8.64E-04
Turkey Point 4 Class 3 3.17E-04 6.08E-05 2.58E-04 3.38E-04 8.64E-04
Vermont Yankee Class 3 3.02E-03 6.10E-04 2.47E-03 3.38E-03 9.10E-03
Vogtle 1 Class 2 2.96E-03 7.60E-04 2.70E-03 3.43E-03 8.79E-03
Vogtle 2 Class 2 2.96E-03 7.60E-04 2.70E-03 3.43E-03 8.79E-03
Waterford 3 Class 2 3.03E-03 8.10E-04 2.53E-03 3.48E-03 9.22E-03
Watts Bar 1 Class 3 2.31E-04 3.45E-05 1.86E-04 3.53E-04 1.13E-03
Wolf Creek Class 2 4.26E-03 7.38E-04 3.30E-03 5.52E-03 1.61E-02
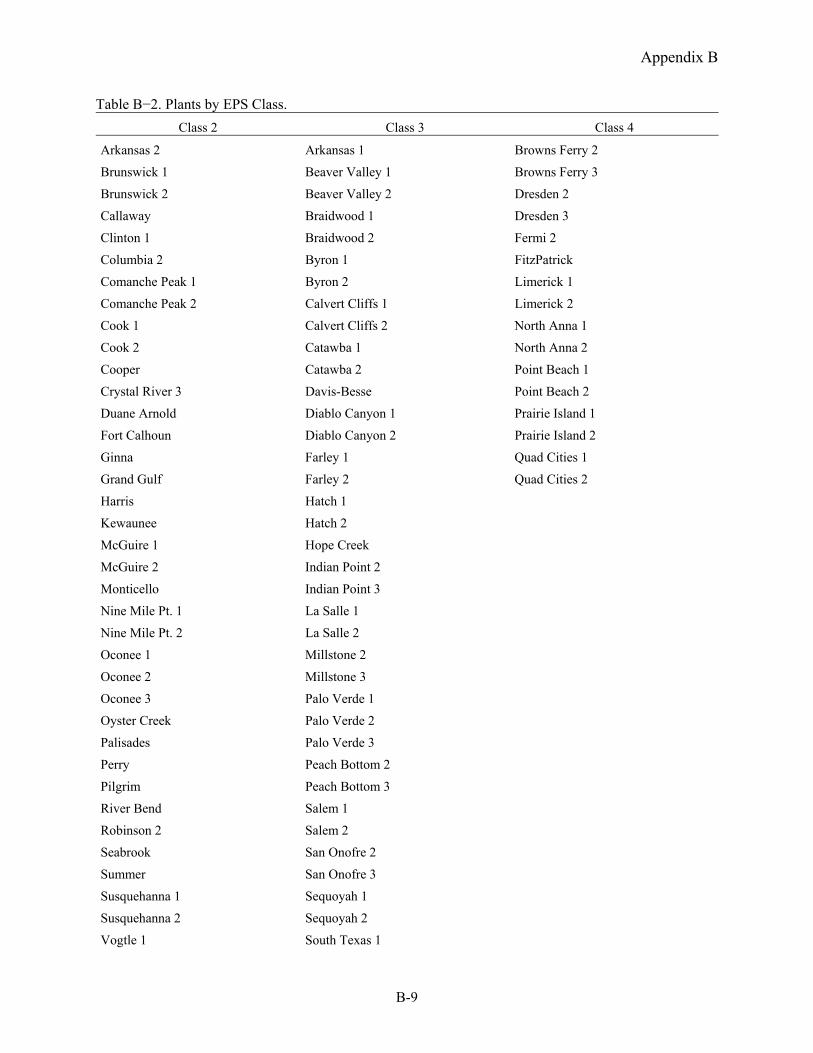
Appendix B
B-9
Table B−2. Plants by EPS Class. Class 2 Class 3 Class 4
Arkansas 2 Arkansas 1 Browns Ferry 2
Brunswick 1 Beaver Valley 1 Browns Ferry 3
Brunswick 2 Beaver Valley 2 Dresden 2
Callaway Braidwood 1 Dresden 3
Clinton 1 Braidwood 2 Fermi 2
Columbia 2 Byron 1 FitzPatrick
Comanche Peak 1 Byron 2 Limerick 1
Comanche Peak 2 Calvert Cliffs 1 Limerick 2
Cook 1 Calvert Cliffs 2 North Anna 1
Cook 2 Catawba 1 North Anna 2
Cooper Catawba 2 Point Beach 1
Crystal River 3 Davis-Besse Point Beach 2
Duane Arnold Diablo Canyon 1 Prairie Island 1
Fort Calhoun Diablo Canyon 2 Prairie Island 2
Ginna Farley 1 Quad Cities 1
Grand Gulf Farley 2 Quad Cities 2
Harris Hatch 1
Kewaunee Hatch 2
McGuire 1 Hope Creek
McGuire 2 Indian Point 2
Monticello Indian Point 3
Nine Mile Pt. 1 La Salle 1
Nine Mile Pt. 2 La Salle 2
Oconee 1 Millstone 2
Oconee 2 Millstone 3
Oconee 3 Palo Verde 1
Oyster Creek Palo Verde 2
Palisades Palo Verde 3
Perry Peach Bottom 2
Pilgrim Peach Bottom 3
River Bend Salem 1
Robinson 2 Salem 2
Seabrook San Onofre 2
Summer San Onofre 3
Susquehanna 1 Sequoyah 1
Susquehanna 2 Sequoyah 2
Vogtle 1 South Texas 1
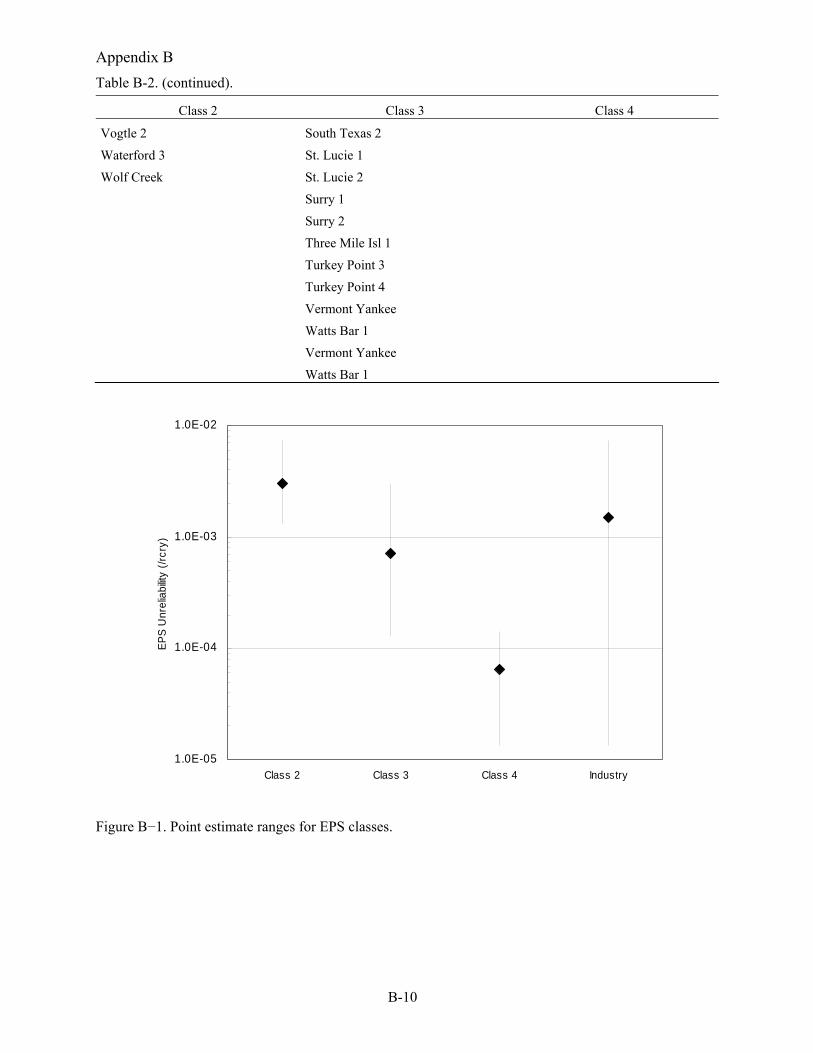
Appendix B Table B-2. (continued).
B-10
Class 2 Class 3 Class 4
Vogtle 2 South Texas 2
Waterford 3 St. Lucie 1
Wolf Creek St. Lucie 2
Surry 1
Surry 2
Three Mile Isl 1
Turkey Point 3
Turkey Point 4
Vermont Yankee
Watts Bar 1
Vermont Yankee
Watts Bar 1
1.0E-05
1.0E-04
1.0E-03
1.0E-02
Class 2 Class 3 Class 4 Industry
EPS
Unr
elia
bility
(/rc
ry)
Figure B−1. Point estimate ranges for EPS classes.
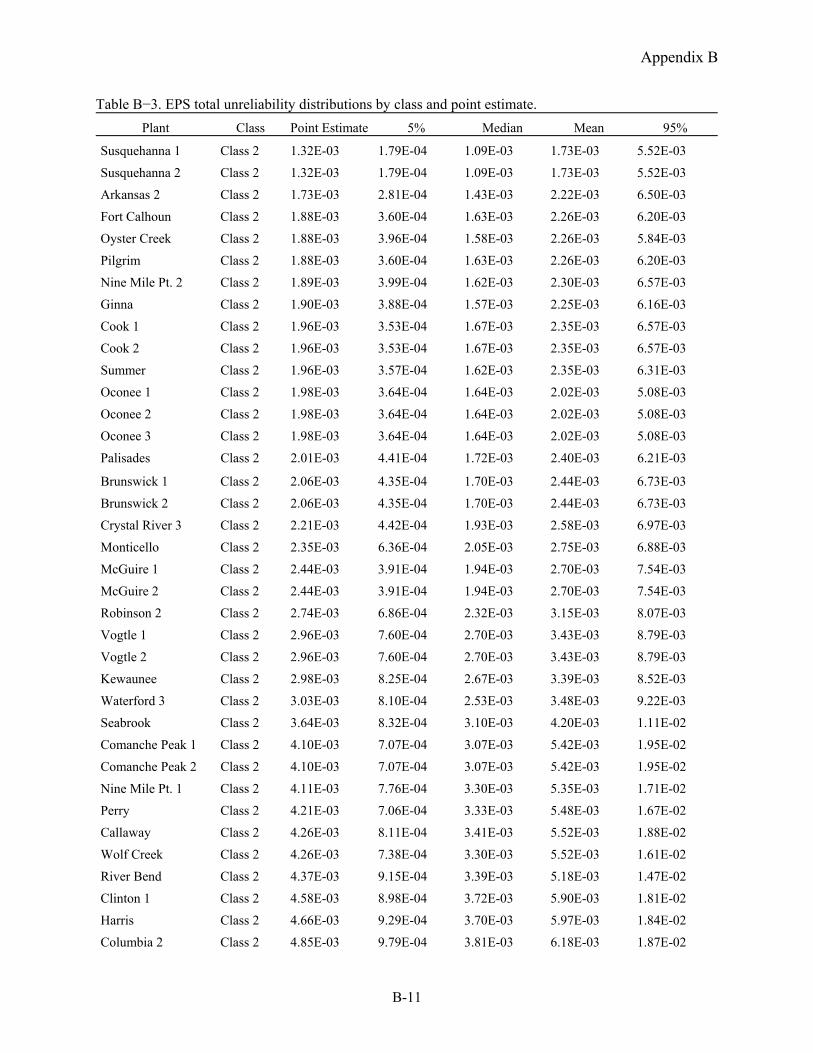
Appendix B
B-11
Table B−3. EPS total unreliability distributions by class and point estimate. Plant Class Point Estimate 5% Median Mean 95%
Susquehanna 1 Class 2 1.32E-03 1.79E-04 1.09E-03 1.73E-03 5.52E-03
Susquehanna 2 Class 2 1.32E-03 1.79E-04 1.09E-03 1.73E-03 5.52E-03
Arkansas 2 Class 2 1.73E-03 2.81E-04 1.43E-03 2.22E-03 6.50E-03
Fort Calhoun Class 2 1.88E-03 3.60E-04 1.63E-03 2.26E-03 6.20E-03
Oyster Creek Class 2 1.88E-03 3.96E-04 1.58E-03 2.26E-03 5.84E-03
Pilgrim Class 2 1.88E-03 3.60E-04 1.63E-03 2.26E-03 6.20E-03
Nine Mile Pt. 2 Class 2 1.89E-03 3.99E-04 1.62E-03 2.30E-03 6.57E-03
Ginna Class 2 1.90E-03 3.88E-04 1.57E-03 2.25E-03 6.16E-03
Cook 1 Class 2 1.96E-03 3.53E-04 1.67E-03 2.35E-03 6.57E-03
Cook 2 Class 2 1.96E-03 3.53E-04 1.67E-03 2.35E-03 6.57E-03
Summer Class 2 1.96E-03 3.57E-04 1.62E-03 2.35E-03 6.31E-03
Oconee 1 Class 2 1.98E-03 3.64E-04 1.64E-03 2.02E-03 5.08E-03
Oconee 2 Class 2 1.98E-03 3.64E-04 1.64E-03 2.02E-03 5.08E-03
Oconee 3 Class 2 1.98E-03 3.64E-04 1.64E-03 2.02E-03 5.08E-03
Palisades Class 2 2.01E-03 4.41E-04 1.72E-03 2.40E-03 6.21E-03
Brunswick 1 Class 2 2.06E-03 4.35E-04 1.70E-03 2.44E-03 6.73E-03
Brunswick 2 Class 2 2.06E-03 4.35E-04 1.70E-03 2.44E-03 6.73E-03
Crystal River 3 Class 2 2.21E-03 4.42E-04 1.93E-03 2.58E-03 6.97E-03
Monticello Class 2 2.35E-03 6.36E-04 2.05E-03 2.75E-03 6.88E-03
McGuire 1 Class 2 2.44E-03 3.91E-04 1.94E-03 2.70E-03 7.54E-03
McGuire 2 Class 2 2.44E-03 3.91E-04 1.94E-03 2.70E-03 7.54E-03
Robinson 2 Class 2 2.74E-03 6.86E-04 2.32E-03 3.15E-03 8.07E-03
Vogtle 1 Class 2 2.96E-03 7.60E-04 2.70E-03 3.43E-03 8.79E-03
Vogtle 2 Class 2 2.96E-03 7.60E-04 2.70E-03 3.43E-03 8.79E-03
Kewaunee Class 2 2.98E-03 8.25E-04 2.67E-03 3.39E-03 8.52E-03
Waterford 3 Class 2 3.03E-03 8.10E-04 2.53E-03 3.48E-03 9.22E-03
Seabrook Class 2 3.64E-03 8.32E-04 3.10E-03 4.20E-03 1.11E-02
Comanche Peak 1 Class 2 4.10E-03 7.07E-04 3.07E-03 5.42E-03 1.95E-02
Comanche Peak 2 Class 2 4.10E-03 7.07E-04 3.07E-03 5.42E-03 1.95E-02
Nine Mile Pt. 1 Class 2 4.11E-03 7.76E-04 3.30E-03 5.35E-03 1.71E-02
Perry Class 2 4.21E-03 7.06E-04 3.33E-03 5.48E-03 1.67E-02
Callaway Class 2 4.26E-03 8.11E-04 3.41E-03 5.52E-03 1.88E-02
Wolf Creek Class 2 4.26E-03 7.38E-04 3.30E-03 5.52E-03 1.61E-02
River Bend Class 2 4.37E-03 9.15E-04 3.39E-03 5.18E-03 1.47E-02
Clinton 1 Class 2 4.58E-03 8.98E-04 3.72E-03 5.90E-03 1.81E-02
Harris Class 2 4.66E-03 9.29E-04 3.70E-03 5.97E-03 1.84E-02
Columbia 2 Class 2 4.85E-03 9.79E-04 3.81E-03 6.18E-03 1.87E-02
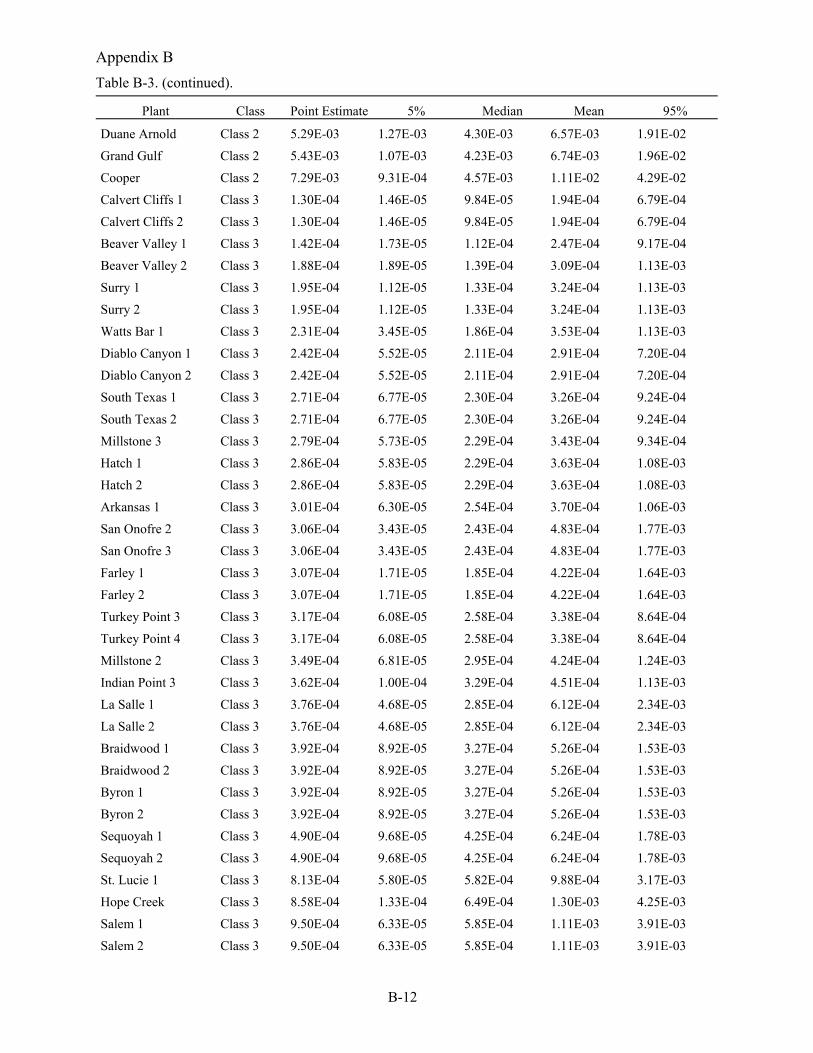
Appendix B Table B-3. (continued).
B-12
Plant Class Point Estimate 5% Median Mean 95%
Duane Arnold Class 2 5.29E-03 1.27E-03 4.30E-03 6.57E-03 1.91E-02
Grand Gulf Class 2 5.43E-03 1.07E-03 4.23E-03 6.74E-03 1.96E-02
Cooper Class 2 7.29E-03 9.31E-04 4.57E-03 1.11E-02 4.29E-02
Calvert Cliffs 1 Class 3 1.30E-04 1.46E-05 9.84E-05 1.94E-04 6.79E-04
Calvert Cliffs 2 Class 3 1.30E-04 1.46E-05 9.84E-05 1.94E-04 6.79E-04
Beaver Valley 1 Class 3 1.42E-04 1.73E-05 1.12E-04 2.47E-04 9.17E-04
Beaver Valley 2 Class 3 1.88E-04 1.89E-05 1.39E-04 3.09E-04 1.13E-03
Surry 1 Class 3 1.95E-04 1.12E-05 1.33E-04 3.24E-04 1.13E-03
Surry 2 Class 3 1.95E-04 1.12E-05 1.33E-04 3.24E-04 1.13E-03
Watts Bar 1 Class 3 2.31E-04 3.45E-05 1.86E-04 3.53E-04 1.13E-03
Diablo Canyon 1 Class 3 2.42E-04 5.52E-05 2.11E-04 2.91E-04 7.20E-04
Diablo Canyon 2 Class 3 2.42E-04 5.52E-05 2.11E-04 2.91E-04 7.20E-04
South Texas 1 Class 3 2.71E-04 6.77E-05 2.30E-04 3.26E-04 9.24E-04
South Texas 2 Class 3 2.71E-04 6.77E-05 2.30E-04 3.26E-04 9.24E-04
Millstone 3 Class 3 2.79E-04 5.73E-05 2.29E-04 3.43E-04 9.34E-04
Hatch 1 Class 3 2.86E-04 5.83E-05 2.29E-04 3.63E-04 1.08E-03
Hatch 2 Class 3 2.86E-04 5.83E-05 2.29E-04 3.63E-04 1.08E-03
Arkansas 1 Class 3 3.01E-04 6.30E-05 2.54E-04 3.70E-04 1.06E-03
San Onofre 2 Class 3 3.06E-04 3.43E-05 2.43E-04 4.83E-04 1.77E-03
San Onofre 3 Class 3 3.06E-04 3.43E-05 2.43E-04 4.83E-04 1.77E-03
Farley 1 Class 3 3.07E-04 1.71E-05 1.85E-04 4.22E-04 1.64E-03
Farley 2 Class 3 3.07E-04 1.71E-05 1.85E-04 4.22E-04 1.64E-03
Turkey Point 3 Class 3 3.17E-04 6.08E-05 2.58E-04 3.38E-04 8.64E-04
Turkey Point 4 Class 3 3.17E-04 6.08E-05 2.58E-04 3.38E-04 8.64E-04
Millstone 2 Class 3 3.49E-04 6.81E-05 2.95E-04 4.24E-04 1.24E-03
Indian Point 3 Class 3 3.62E-04 1.00E-04 3.29E-04 4.51E-04 1.13E-03
La Salle 1 Class 3 3.76E-04 4.68E-05 2.85E-04 6.12E-04 2.34E-03
La Salle 2 Class 3 3.76E-04 4.68E-05 2.85E-04 6.12E-04 2.34E-03
Braidwood 1 Class 3 3.92E-04 8.92E-05 3.27E-04 5.26E-04 1.53E-03
Braidwood 2 Class 3 3.92E-04 8.92E-05 3.27E-04 5.26E-04 1.53E-03
Byron 1 Class 3 3.92E-04 8.92E-05 3.27E-04 5.26E-04 1.53E-03
Byron 2 Class 3 3.92E-04 8.92E-05 3.27E-04 5.26E-04 1.53E-03
Sequoyah 1 Class 3 4.90E-04 9.68E-05 4.25E-04 6.24E-04 1.78E-03
Sequoyah 2 Class 3 4.90E-04 9.68E-05 4.25E-04 6.24E-04 1.78E-03
St. Lucie 1 Class 3 8.13E-04 5.80E-05 5.82E-04 9.88E-04 3.17E-03
Hope Creek Class 3 8.58E-04 1.33E-04 6.49E-04 1.30E-03 4.25E-03
Salem 1 Class 3 9.50E-04 6.33E-05 5.85E-04 1.11E-03 3.91E-03
Salem 2 Class 3 9.50E-04 6.33E-05 5.85E-04 1.11E-03 3.91E-03
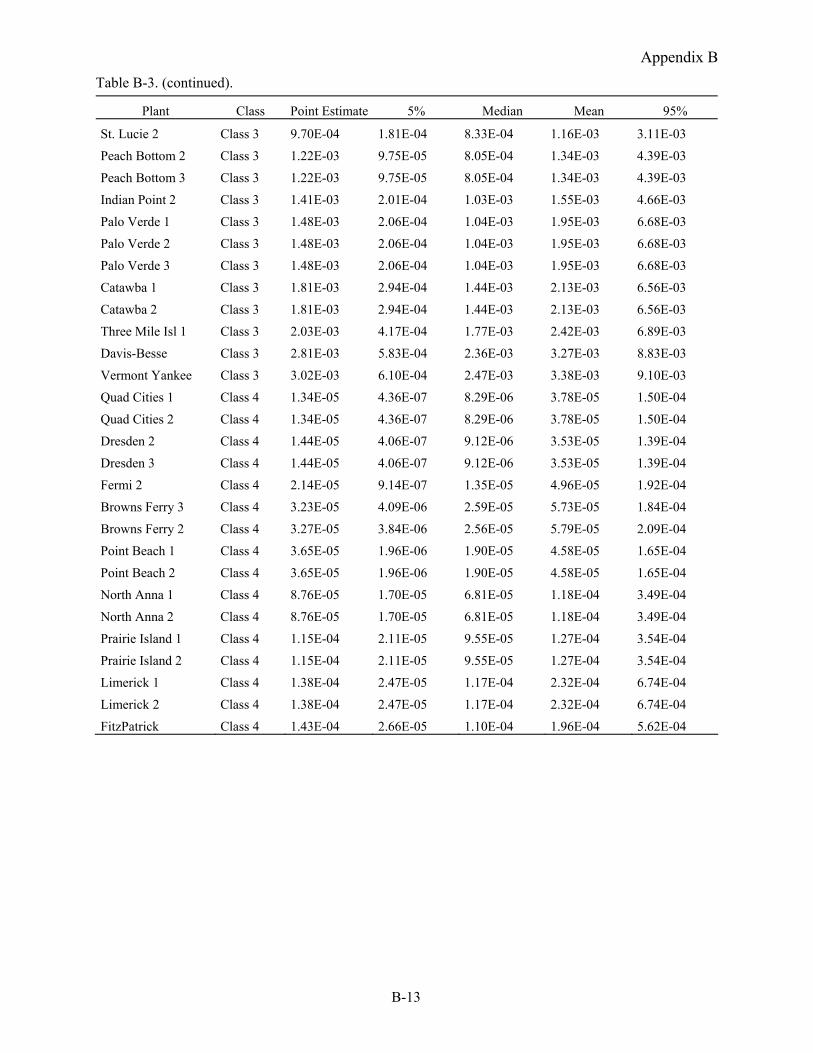
Appendix B Table B-3. (continued).
B-13
Plant Class Point Estimate 5% Median Mean 95%
St. Lucie 2 Class 3 9.70E-04 1.81E-04 8.33E-04 1.16E-03 3.11E-03
Peach Bottom 2 Class 3 1.22E-03 9.75E-05 8.05E-04 1.34E-03 4.39E-03
Peach Bottom 3 Class 3 1.22E-03 9.75E-05 8.05E-04 1.34E-03 4.39E-03
Indian Point 2 Class 3 1.41E-03 2.01E-04 1.03E-03 1.55E-03 4.66E-03
Palo Verde 1 Class 3 1.48E-03 2.06E-04 1.04E-03 1.95E-03 6.68E-03
Palo Verde 2 Class 3 1.48E-03 2.06E-04 1.04E-03 1.95E-03 6.68E-03
Palo Verde 3 Class 3 1.48E-03 2.06E-04 1.04E-03 1.95E-03 6.68E-03
Catawba 1 Class 3 1.81E-03 2.94E-04 1.44E-03 2.13E-03 6.56E-03
Catawba 2 Class 3 1.81E-03 2.94E-04 1.44E-03 2.13E-03 6.56E-03
Three Mile Isl 1 Class 3 2.03E-03 4.17E-04 1.77E-03 2.42E-03 6.89E-03
Davis-Besse Class 3 2.81E-03 5.83E-04 2.36E-03 3.27E-03 8.83E-03
Vermont Yankee Class 3 3.02E-03 6.10E-04 2.47E-03 3.38E-03 9.10E-03
Quad Cities 1 Class 4 1.34E-05 4.36E-07 8.29E-06 3.78E-05 1.50E-04
Quad Cities 2 Class 4 1.34E-05 4.36E-07 8.29E-06 3.78E-05 1.50E-04
Dresden 2 Class 4 1.44E-05 4.06E-07 9.12E-06 3.53E-05 1.39E-04
Dresden 3 Class 4 1.44E-05 4.06E-07 9.12E-06 3.53E-05 1.39E-04
Fermi 2 Class 4 2.14E-05 9.14E-07 1.35E-05 4.96E-05 1.92E-04
Browns Ferry 3 Class 4 3.23E-05 4.09E-06 2.59E-05 5.73E-05 1.84E-04
Browns Ferry 2 Class 4 3.27E-05 3.84E-06 2.56E-05 5.79E-05 2.09E-04
Point Beach 1 Class 4 3.65E-05 1.96E-06 1.90E-05 4.58E-05 1.65E-04
Point Beach 2 Class 4 3.65E-05 1.96E-06 1.90E-05 4.58E-05 1.65E-04
North Anna 1 Class 4 8.76E-05 1.70E-05 6.81E-05 1.18E-04 3.49E-04
North Anna 2 Class 4 8.76E-05 1.70E-05 6.81E-05 1.18E-04 3.49E-04
Prairie Island 1 Class 4 1.15E-04 2.11E-05 9.55E-05 1.27E-04 3.54E-04
Prairie Island 2 Class 4 1.15E-04 2.11E-05 9.55E-05 1.27E-04 3.54E-04
Limerick 1 Class 4 1.38E-04 2.47E-05 1.17E-04 2.32E-04 6.74E-04
Limerick 2 Class 4 1.38E-04 2.47E-05 1.17E-04 2.32E-04 6.74E-04
FitzPatrick Class 4 1.43E-04 2.66E-05 1.10E-04 1.96E-04 5.62E-04
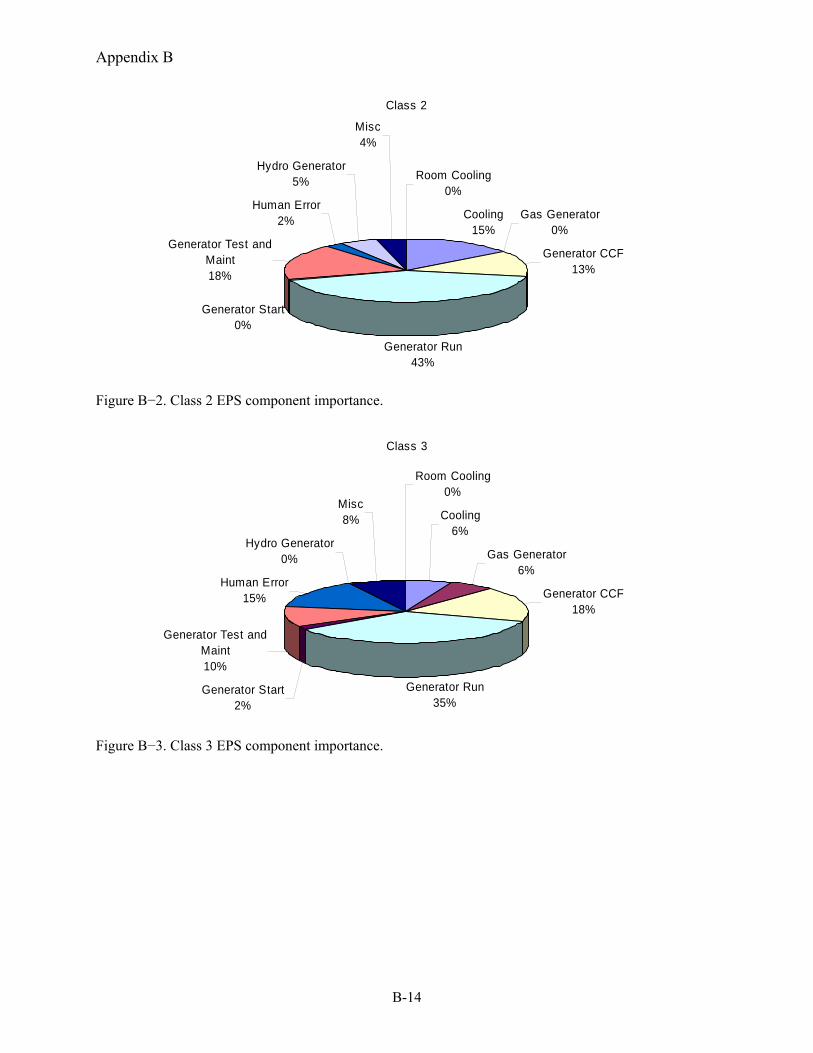
Appendix B
B-14
Class 2
Cooling15%
Gas Generator0%
Generator CCF13%
Generator Run43%
Generator Start0%
Generator Test and Maint18%
Human Error2%
Hydro Generator5%
Misc4%
Room Cooling0%
Figure B−2. Class 2 EPS component importance.
Class 3
Cooling6%
Gas Generator6%
Generator CCF18%
Generator Run35%
Generator Start2%
Generator Test and Maint10%
Human Error15%
Hydro Generator0%
Misc8%
Room Cooling0%
Figure B−3. Class 3 EPS component importance.
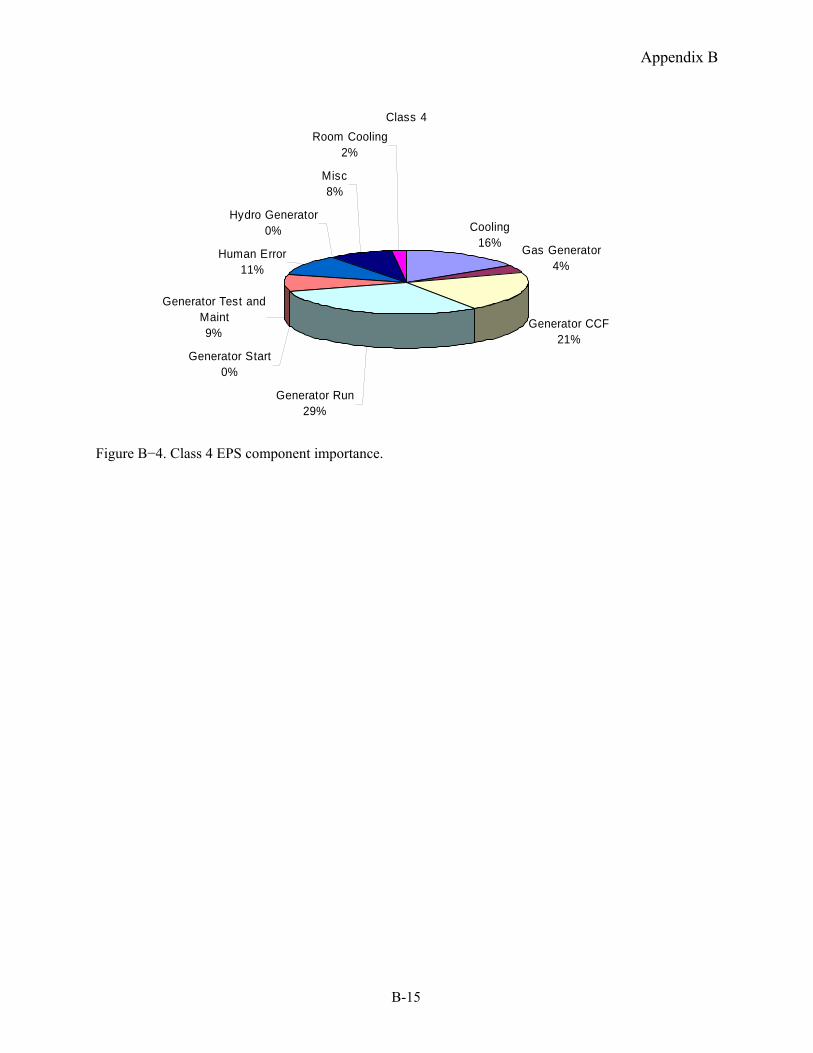
Appendix B
B-15
Class 4
Cooling16% Gas Generator
4%
Generator CCF21%
Generator Run29%
Generator Start0%
Generator Test and Maint9%
Human Error11%
Hydro Generator0%
Misc8%
Room Cooling2%
Figure B−4. Class 4 EPS component importance.

Appendix B
B-16
C-1
Appendix C
Plant-Specific Station Blackout Results Using Industry Data

Appendix C
C-2
Appendix C
C-3
CONTENTS
TABLES
C-1. Summary of industry average LOOP, SBO, and total CDF results. ............................................ C-5
C-2. Plant-specific LOOP, SBO, and Total CDF results. .................................................................... C-6
C−3. Plant-specific CDF and SBO uncertainty table.......................................................................... C-12

Appendix C
C-4
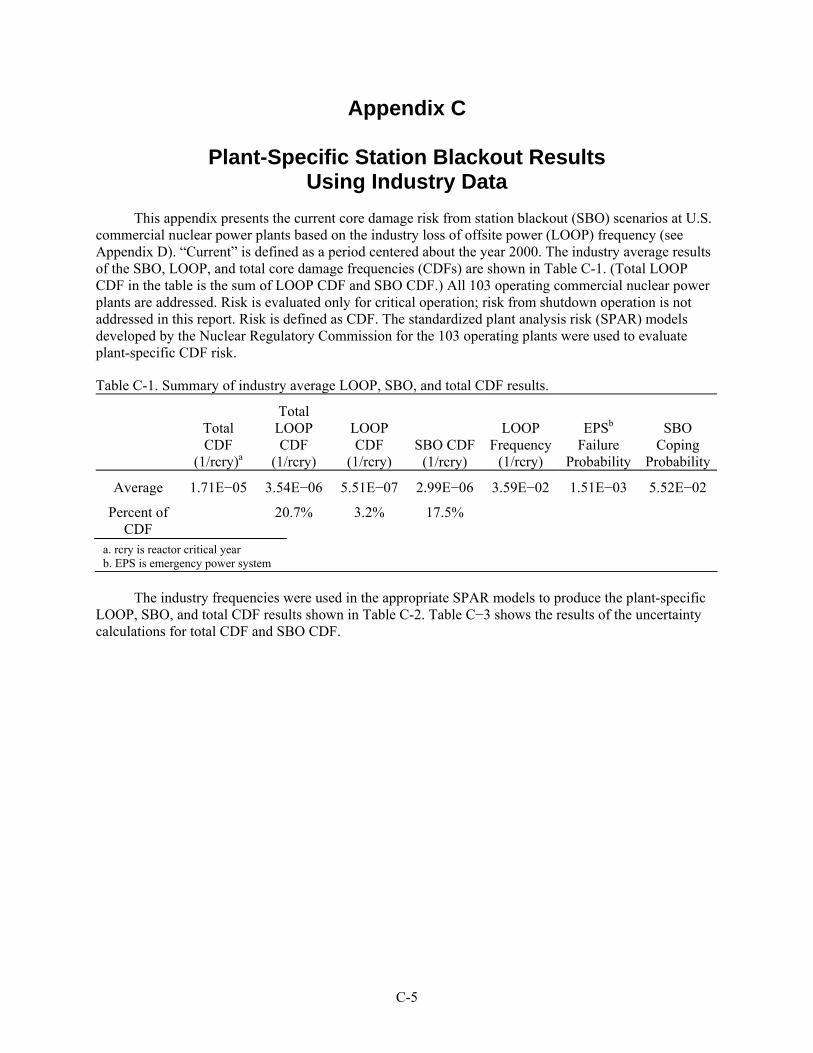
C-5
Appendix C
Plant-Specific Station Blackout Results Using Industry Data
This appendix presents the current core damage risk from station blackout (SBO) scenarios at U.S. commercial nuclear power plants based on the industry loss of offsite power (LOOP) frequency (see Appendix D). “Current” is defined as a period centered about the year 2000. The industry average results of the SBO, LOOP, and total core damage frequencies (CDFs) are shown in Table C-1. (Total LOOP CDF in the table is the sum of LOOP CDF and SBO CDF.) All 103 operating commercial nuclear power plants are addressed. Risk is evaluated only for critical operation; risk from shutdown operation is not addressed in this report. Risk is defined as CDF. The standardized plant analysis risk (SPAR) models developed by the Nuclear Regulatory Commission for the 103 operating plants were used to evaluate plant-specific CDF risk.
Table C-1. Summary of industry average LOOP, SBO, and total CDF results.
Total CDF
(1/rcry)a
Total LOOP CDF
(1/rcry)
LOOP CDF
(1/rcry) SBO CDF
(1/rcry)
LOOP Frequency
(1/rcry)
EPSb Failure
Probability
SBO Coping
Probability
Average 1.71E−05 3.54E−06 5.51E−07 2.99E−06 3.59E−02 1.51E−03 5.52E−02
Percent of CDF
20.7% 3.2% 17.5%
a. rcry is reactor critical year b. EPS is emergency power system
The industry frequencies were used in the appropriate SPAR models to produce the plant-specific
LOOP, SBO, and total CDF results shown in Table C-2. Table C−3 shows the results of the uncertainty calculations for total CDF and SBO CDF.
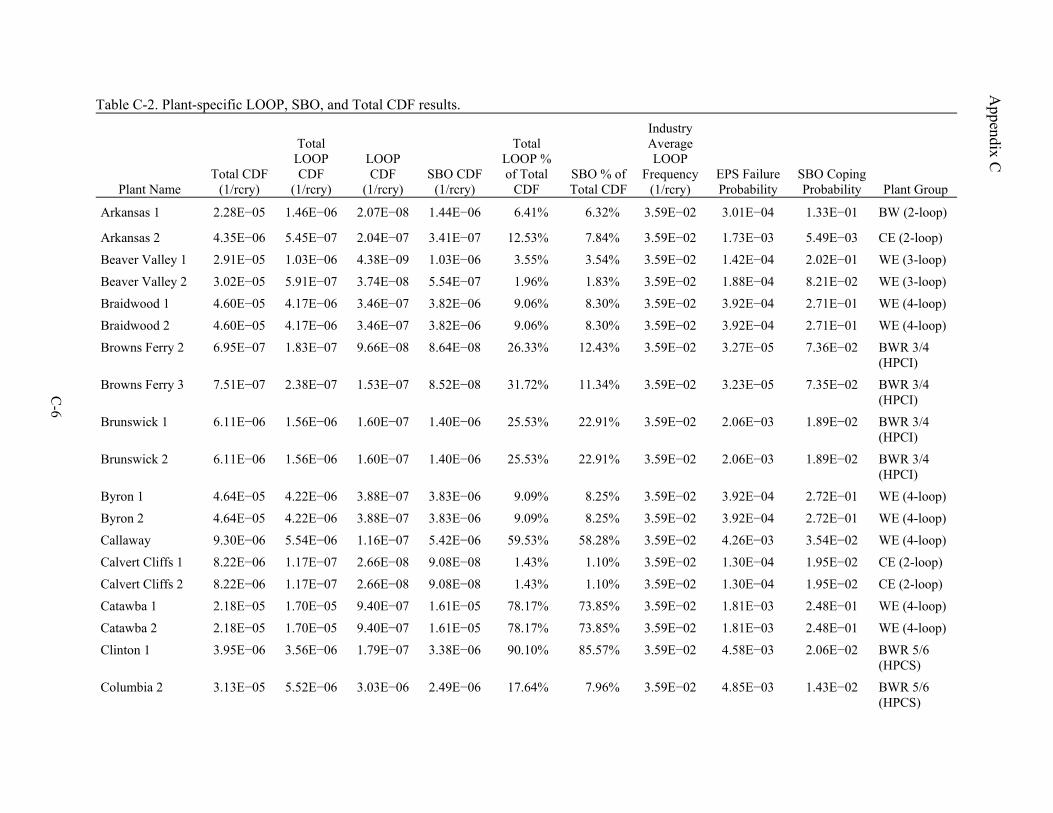
Appendix C
C-6
Table C-2. Plant-specific LOOP, SBO, and Total CDF results.
Plant Name Total CDF
(1/rcry)
Total LOOP CDF
(1/rcry)
LOOP CDF
(1/rcry) SBO CDF
(1/rcry)
Total LOOP % of Total
CDF SBO % of Total CDF
Industry Average LOOP
Frequency(1/rcry)
EPS Failure Probability
SBO Coping Probability Plant Group
Arkansas 1 2.28E−05 1.46E−06 2.07E−08 1.44E−06 6.41% 6.32% 3.59E−02 3.01E−04 1.33E−01 BW (2-loop)
Arkansas 2 4.35E−06 5.45E−07 2.04E−07 3.41E−07 12.53% 7.84% 3.59E−02 1.73E−03 5.49E−03 CE (2-loop)
Beaver Valley 1 2.91E−05 1.03E−06 4.38E−09 1.03E−06 3.55% 3.54% 3.59E−02 1.42E−04 2.02E−01 WE (3-loop)
Beaver Valley 2 3.02E−05 5.91E−07 3.74E−08 5.54E−07 1.96% 1.83% 3.59E−02 1.88E−04 8.21E−02 WE (3-loop)
Braidwood 1 4.60E−05 4.17E−06 3.46E−07 3.82E−06 9.06% 8.30% 3.59E−02 3.92E−04 2.71E−01 WE (4-loop)
Braidwood 2 4.60E−05 4.17E−06 3.46E−07 3.82E−06 9.06% 8.30% 3.59E−02 3.92E−04 2.71E−01 WE (4-loop)
Browns Ferry 2 6.95E−07 1.83E−07 9.66E−08 8.64E−08 26.33% 12.43% 3.59E−02 3.27E−05 7.36E−02 BWR 3/4 (HPCI)
Browns Ferry 3 7.51E−07 2.38E−07 1.53E−07 8.52E−08 31.72% 11.34% 3.59E−02 3.23E−05 7.35E−02 BWR 3/4 (HPCI)
Brunswick 1 6.11E−06 1.56E−06 1.60E−07 1.40E−06 25.53% 22.91% 3.59E−02 2.06E−03 1.89E−02 BWR 3/4 (HPCI)
Brunswick 2 6.11E−06 1.56E−06 1.60E−07 1.40E−06 25.53% 22.91% 3.59E−02 2.06E−03 1.89E−02 BWR 3/4 (HPCI)
Byron 1 4.64E−05 4.22E−06 3.88E−07 3.83E−06 9.09% 8.25% 3.59E−02 3.92E−04 2.72E−01 WE (4-loop)
Byron 2 4.64E−05 4.22E−06 3.88E−07 3.83E−06 9.09% 8.25% 3.59E−02 3.92E−04 2.72E−01 WE (4-loop)
Callaway 9.30E−06 5.54E−06 1.16E−07 5.42E−06 59.53% 58.28% 3.59E−02 4.26E−03 3.54E−02 WE (4-loop)
Calvert Cliffs 1 8.22E−06 1.17E−07 2.66E−08 9.08E−08 1.43% 1.10% 3.59E−02 1.30E−04 1.95E−02 CE (2-loop)
Calvert Cliffs 2 8.22E−06 1.17E−07 2.66E−08 9.08E−08 1.43% 1.10% 3.59E−02 1.30E−04 1.95E−02 CE (2-loop)
Catawba 1 2.18E−05 1.70E−05 9.40E−07 1.61E−05 78.17% 73.85% 3.59E−02 1.81E−03 2.48E−01 WE (4-loop)
Catawba 2 2.18E−05 1.70E−05 9.40E−07 1.61E−05 78.17% 73.85% 3.59E−02 1.81E−03 2.48E−01 WE (4-loop)
Clinton 1 3.95E−06 3.56E−06 1.79E−07 3.38E−06 90.10% 85.57% 3.59E−02 4.58E−03 2.06E−02 BWR 5/6 (HPCS)
Columbia 2 3.13E−05 5.52E−06 3.03E−06 2.49E−06 17.64% 7.96% 3.59E−02 4.85E−03 1.43E−02 BWR 5/6 (HPCS)
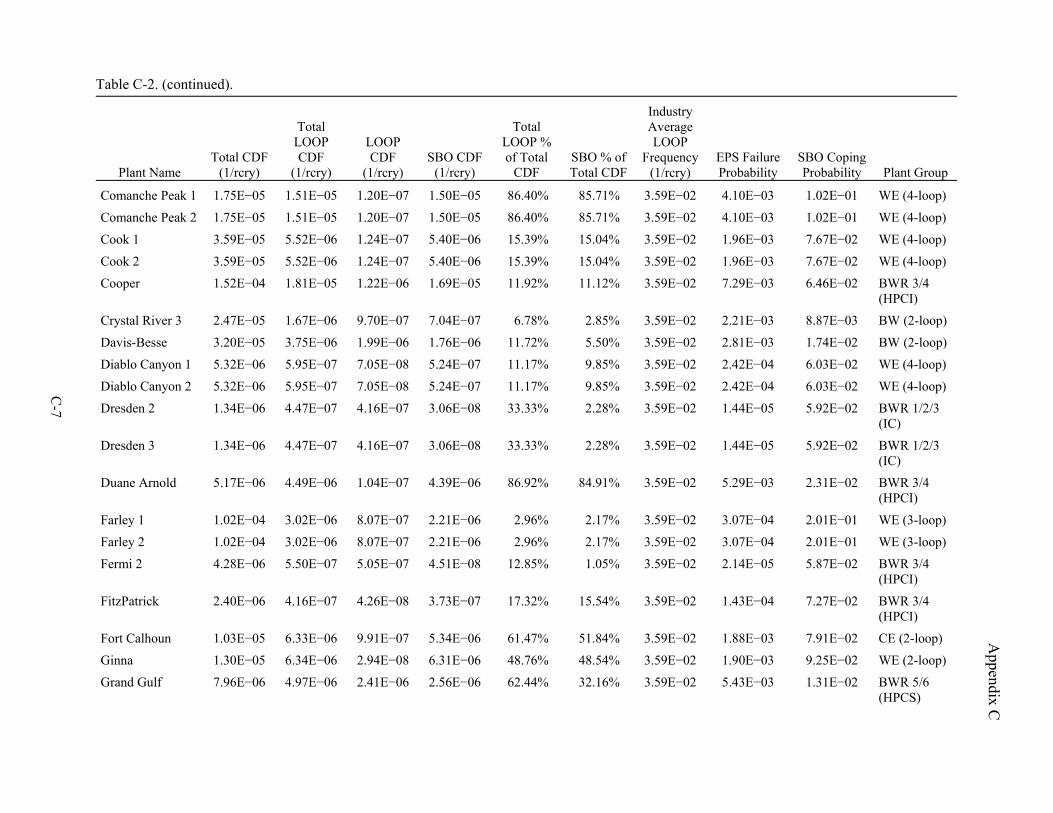
Appendix C
Table C-2. (continued).
C-7
Plant Name Total CDF
(1/rcry)
Total LOOP CDF
(1/rcry)
LOOP CDF
(1/rcry) SBO CDF
(1/rcry)
Total LOOP % of Total
CDF SBO % of Total CDF
Industry Average LOOP
Frequency(1/rcry)
EPS Failure Probability
SBO Coping Probability Plant Group
Comanche Peak 1 1.75E−05 1.51E−05 1.20E−07 1.50E−05 86.40% 85.71% 3.59E−02 4.10E−03 1.02E−01 WE (4-loop)
Comanche Peak 2 1.75E−05 1.51E−05 1.20E−07 1.50E−05 86.40% 85.71% 3.59E−02 4.10E−03 1.02E−01 WE (4-loop)
Cook 1 3.59E−05 5.52E−06 1.24E−07 5.40E−06 15.39% 15.04% 3.59E−02 1.96E−03 7.67E−02 WE (4-loop)
Cook 2 3.59E−05 5.52E−06 1.24E−07 5.40E−06 15.39% 15.04% 3.59E−02 1.96E−03 7.67E−02 WE (4-loop)
Cooper 1.52E−04 1.81E−05 1.22E−06 1.69E−05 11.92% 11.12% 3.59E−02 7.29E−03 6.46E−02 BWR 3/4 (HPCI)
Crystal River 3 2.47E−05 1.67E−06 9.70E−07 7.04E−07 6.78% 2.85% 3.59E−02 2.21E−03 8.87E−03 BW (2-loop)
Davis-Besse 3.20E−05 3.75E−06 1.99E−06 1.76E−06 11.72% 5.50% 3.59E−02 2.81E−03 1.74E−02 BW (2-loop)
Diablo Canyon 1 5.32E−06 5.95E−07 7.05E−08 5.24E−07 11.17% 9.85% 3.59E−02 2.42E−04 6.03E−02 WE (4-loop)
Diablo Canyon 2 5.32E−06 5.95E−07 7.05E−08 5.24E−07 11.17% 9.85% 3.59E−02 2.42E−04 6.03E−02 WE (4-loop)
Dresden 2 1.34E−06 4.47E−07 4.16E−07 3.06E−08 33.33% 2.28% 3.59E−02 1.44E−05 5.92E−02 BWR 1/2/3 (IC)
Dresden 3 1.34E−06 4.47E−07 4.16E−07 3.06E−08 33.33% 2.28% 3.59E−02 1.44E−05 5.92E−02 BWR 1/2/3 (IC)
Duane Arnold 5.17E−06 4.49E−06 1.04E−07 4.39E−06 86.92% 84.91% 3.59E−02 5.29E−03 2.31E−02 BWR 3/4 (HPCI)
Farley 1 1.02E−04 3.02E−06 8.07E−07 2.21E−06 2.96% 2.17% 3.59E−02 3.07E−04 2.01E−01 WE (3-loop)
Farley 2 1.02E−04 3.02E−06 8.07E−07 2.21E−06 2.96% 2.17% 3.59E−02 3.07E−04 2.01E−01 WE (3-loop)
Fermi 2 4.28E−06 5.50E−07 5.05E−07 4.51E−08 12.85% 1.05% 3.59E−02 2.14E−05 5.87E−02 BWR 3/4 (HPCI)
FitzPatrick 2.40E−06 4.16E−07 4.26E−08 3.73E−07 17.32% 15.54% 3.59E−02 1.43E−04 7.27E−02 BWR 3/4 (HPCI)
Fort Calhoun 1.03E−05 6.33E−06 9.91E−07 5.34E−06 61.47% 51.84% 3.59E−02 1.88E−03 7.91E−02 CE (2-loop)
Ginna 1.30E−05 6.34E−06 2.94E−08 6.31E−06 48.76% 48.54% 3.59E−02 1.90E−03 9.25E−02 WE (2-loop)
Grand Gulf 7.96E−06 4.97E−06 2.41E−06 2.56E−06 62.44% 32.16% 3.59E−02 5.43E−03 1.31E−02 BWR 5/6 (HPCS)
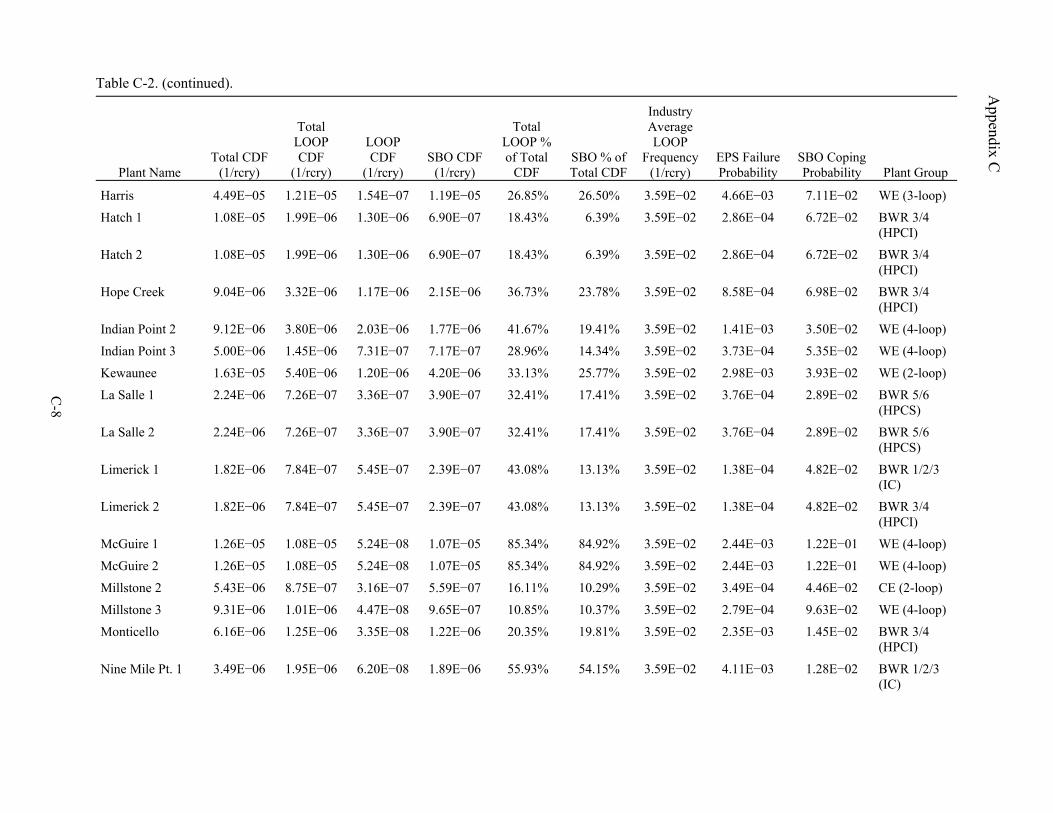
Appendix C
Table C-2. (continued).
C-8
Plant Name Total CDF
(1/rcry)
Total LOOP CDF
(1/rcry)
LOOP CDF
(1/rcry) SBO CDF
(1/rcry)
Total LOOP % of Total
CDF SBO % of Total CDF
Industry Average LOOP
Frequency(1/rcry)
EPS Failure Probability
SBO Coping Probability Plant Group
Harris 4.49E−05 1.21E−05 1.54E−07 1.19E−05 26.85% 26.50% 3.59E−02 4.66E−03 7.11E−02 WE (3-loop)
Hatch 1 1.08E−05 1.99E−06 1.30E−06 6.90E−07 18.43% 6.39% 3.59E−02 2.86E−04 6.72E−02 BWR 3/4 (HPCI)
Hatch 2 1.08E−05 1.99E−06 1.30E−06 6.90E−07 18.43% 6.39% 3.59E−02 2.86E−04 6.72E−02 BWR 3/4 (HPCI)
Hope Creek 9.04E−06 3.32E−06 1.17E−06 2.15E−06 36.73% 23.78% 3.59E−02 8.58E−04 6.98E−02 BWR 3/4 (HPCI)
Indian Point 2 9.12E−06 3.80E−06 2.03E−06 1.77E−06 41.67% 19.41% 3.59E−02 1.41E−03 3.50E−02 WE (4-loop)
Indian Point 3 5.00E−06 1.45E−06 7.31E−07 7.17E−07 28.96% 14.34% 3.59E−02 3.73E−04 5.35E−02 WE (4-loop)
Kewaunee 1.63E−05 5.40E−06 1.20E−06 4.20E−06 33.13% 25.77% 3.59E−02 2.98E−03 3.93E−02 WE (2-loop)
La Salle 1 2.24E−06 7.26E−07 3.36E−07 3.90E−07 32.41% 17.41% 3.59E−02 3.76E−04 2.89E−02 BWR 5/6 (HPCS)
La Salle 2 2.24E−06 7.26E−07 3.36E−07 3.90E−07 32.41% 17.41% 3.59E−02 3.76E−04 2.89E−02 BWR 5/6 (HPCS)
Limerick 1 1.82E−06 7.84E−07 5.45E−07 2.39E−07 43.08% 13.13% 3.59E−02 1.38E−04 4.82E−02 BWR 1/2/3 (IC)
Limerick 2 1.82E−06 7.84E−07 5.45E−07 2.39E−07 43.08% 13.13% 3.59E−02 1.38E−04 4.82E−02 BWR 3/4 (HPCI)
McGuire 1 1.26E−05 1.08E−05 5.24E−08 1.07E−05 85.34% 84.92% 3.59E−02 2.44E−03 1.22E−01 WE (4-loop)
McGuire 2 1.26E−05 1.08E−05 5.24E−08 1.07E−05 85.34% 84.92% 3.59E−02 2.44E−03 1.22E−01 WE (4-loop)
Millstone 2 5.43E−06 8.75E−07 3.16E−07 5.59E−07 16.11% 10.29% 3.59E−02 3.49E−04 4.46E−02 CE (2-loop)
Millstone 3 9.31E−06 1.01E−06 4.47E−08 9.65E−07 10.85% 10.37% 3.59E−02 2.79E−04 9.63E−02 WE (4-loop)
Monticello 6.16E−06 1.25E−06 3.35E−08 1.22E−06 20.35% 19.81% 3.59E−02 2.35E−03 1.45E−02 BWR 3/4 (HPCI)
Nine Mile Pt. 1 3.49E−06 1.95E−06 6.20E−08 1.89E−06 55.93% 54.15% 3.59E−02 4.11E−03 1.28E−02 BWR 1/2/3 (IC)
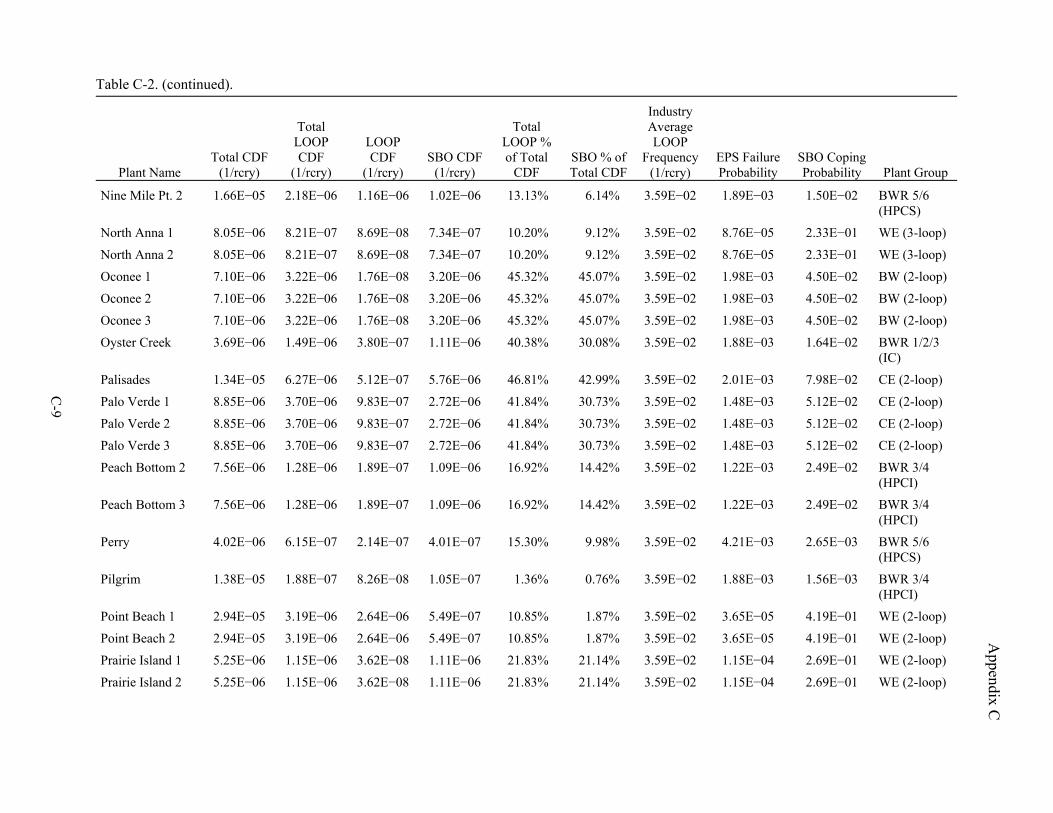
Appendix C
Table C-2. (continued).
C-9
Plant Name Total CDF
(1/rcry)
Total LOOP CDF
(1/rcry)
LOOP CDF
(1/rcry) SBO CDF
(1/rcry)
Total LOOP % of Total
CDF SBO % of Total CDF
Industry Average LOOP
Frequency(1/rcry)
EPS Failure Probability
SBO Coping Probability Plant Group
Nine Mile Pt. 2 1.66E−05 2.18E−06 1.16E−06 1.02E−06 13.13% 6.14% 3.59E−02 1.89E−03 1.50E−02 BWR 5/6 (HPCS)
North Anna 1 8.05E−06 8.21E−07 8.69E−08 7.34E−07 10.20% 9.12% 3.59E−02 8.76E−05 2.33E−01 WE (3-loop)
North Anna 2 8.05E−06 8.21E−07 8.69E−08 7.34E−07 10.20% 9.12% 3.59E−02 8.76E−05 2.33E−01 WE (3-loop)
Oconee 1 7.10E−06 3.22E−06 1.76E−08 3.20E−06 45.32% 45.07% 3.59E−02 1.98E−03 4.50E−02 BW (2-loop)
Oconee 2 7.10E−06 3.22E−06 1.76E−08 3.20E−06 45.32% 45.07% 3.59E−02 1.98E−03 4.50E−02 BW (2-loop)
Oconee 3 7.10E−06 3.22E−06 1.76E−08 3.20E−06 45.32% 45.07% 3.59E−02 1.98E−03 4.50E−02 BW (2-loop)
Oyster Creek 3.69E−06 1.49E−06 3.80E−07 1.11E−06 40.38% 30.08% 3.59E−02 1.88E−03 1.64E−02 BWR 1/2/3 (IC)
Palisades 1.34E−05 6.27E−06 5.12E−07 5.76E−06 46.81% 42.99% 3.59E−02 2.01E−03 7.98E−02 CE (2-loop)
Palo Verde 1 8.85E−06 3.70E−06 9.83E−07 2.72E−06 41.84% 30.73% 3.59E−02 1.48E−03 5.12E−02 CE (2-loop)
Palo Verde 2 8.85E−06 3.70E−06 9.83E−07 2.72E−06 41.84% 30.73% 3.59E−02 1.48E−03 5.12E−02 CE (2-loop)
Palo Verde 3 8.85E−06 3.70E−06 9.83E−07 2.72E−06 41.84% 30.73% 3.59E−02 1.48E−03 5.12E−02 CE (2-loop)
Peach Bottom 2 7.56E−06 1.28E−06 1.89E−07 1.09E−06 16.92% 14.42% 3.59E−02 1.22E−03 2.49E−02 BWR 3/4 (HPCI)
Peach Bottom 3 7.56E−06 1.28E−06 1.89E−07 1.09E−06 16.92% 14.42% 3.59E−02 1.22E−03 2.49E−02 BWR 3/4 (HPCI)
Perry 4.02E−06 6.15E−07 2.14E−07 4.01E−07 15.30% 9.98% 3.59E−02 4.21E−03 2.65E−03 BWR 5/6 (HPCS)
Pilgrim 1.38E−05 1.88E−07 8.26E−08 1.05E−07 1.36% 0.76% 3.59E−02 1.88E−03 1.56E−03 BWR 3/4 (HPCI)
Point Beach 1 2.94E−05 3.19E−06 2.64E−06 5.49E−07 10.85% 1.87% 3.59E−02 3.65E−05 4.19E−01 WE (2-loop)
Point Beach 2 2.94E−05 3.19E−06 2.64E−06 5.49E−07 10.85% 1.87% 3.59E−02 3.65E−05 4.19E−01 WE (2-loop)
Prairie Island 1 5.25E−06 1.15E−06 3.62E−08 1.11E−06 21.83% 21.14% 3.59E−02 1.15E−04 2.69E−01 WE (2-loop)
Prairie Island 2 5.25E−06 1.15E−06 3.62E−08 1.11E−06 21.83% 21.14% 3.59E−02 1.15E−04 2.69E−01 WE (2-loop)
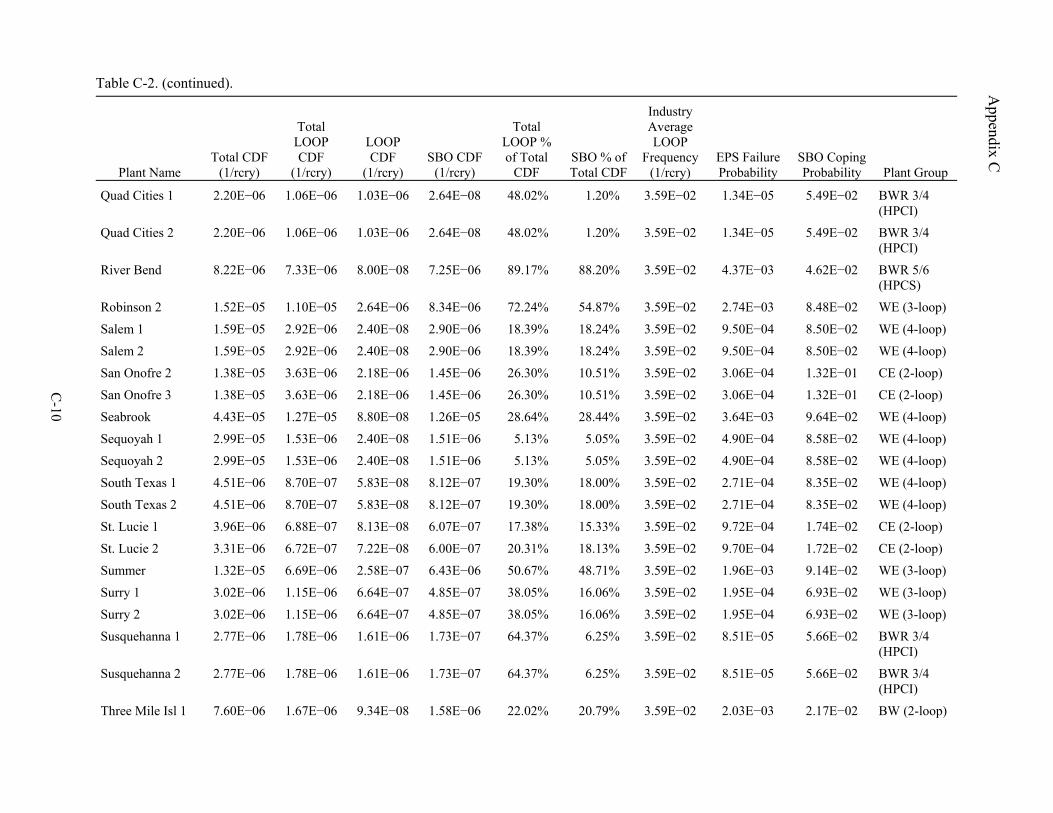
Appendix C
Table C-2. (continued).
C-10
Plant Name Total CDF
(1/rcry)
Total LOOP CDF
(1/rcry)
LOOP CDF
(1/rcry) SBO CDF
(1/rcry)
Total LOOP % of Total
CDF SBO % of Total CDF
Industry Average LOOP
Frequency(1/rcry)
EPS Failure Probability
SBO Coping Probability Plant Group
Quad Cities 1 2.20E−06 1.06E−06 1.03E−06 2.64E−08 48.02% 1.20% 3.59E−02 1.34E−05 5.49E−02 BWR 3/4 (HPCI)
Quad Cities 2 2.20E−06 1.06E−06 1.03E−06 2.64E−08 48.02% 1.20% 3.59E−02 1.34E−05 5.49E−02 BWR 3/4 (HPCI)
River Bend 8.22E−06 7.33E−06 8.00E−08 7.25E−06 89.17% 88.20% 3.59E−02 4.37E−03 4.62E−02 BWR 5/6 (HPCS)
Robinson 2 1.52E−05 1.10E−05 2.64E−06 8.34E−06 72.24% 54.87% 3.59E−02 2.74E−03 8.48E−02 WE (3-loop)
Salem 1 1.59E−05 2.92E−06 2.40E−08 2.90E−06 18.39% 18.24% 3.59E−02 9.50E−04 8.50E−02 WE (4-loop)
Salem 2 1.59E−05 2.92E−06 2.40E−08 2.90E−06 18.39% 18.24% 3.59E−02 9.50E−04 8.50E−02 WE (4-loop)
San Onofre 2 1.38E−05 3.63E−06 2.18E−06 1.45E−06 26.30% 10.51% 3.59E−02 3.06E−04 1.32E−01 CE (2-loop)
San Onofre 3 1.38E−05 3.63E−06 2.18E−06 1.45E−06 26.30% 10.51% 3.59E−02 3.06E−04 1.32E−01 CE (2-loop)
Seabrook 4.43E−05 1.27E−05 8.80E−08 1.26E−05 28.64% 28.44% 3.59E−02 3.64E−03 9.64E−02 WE (4-loop)
Sequoyah 1 2.99E−05 1.53E−06 2.40E−08 1.51E−06 5.13% 5.05% 3.59E−02 4.90E−04 8.58E−02 WE (4-loop)
Sequoyah 2 2.99E−05 1.53E−06 2.40E−08 1.51E−06 5.13% 5.05% 3.59E−02 4.90E−04 8.58E−02 WE (4-loop)
South Texas 1 4.51E−06 8.70E−07 5.83E−08 8.12E−07 19.30% 18.00% 3.59E−02 2.71E−04 8.35E−02 WE (4-loop)
South Texas 2 4.51E−06 8.70E−07 5.83E−08 8.12E−07 19.30% 18.00% 3.59E−02 2.71E−04 8.35E−02 WE (4-loop)
St. Lucie 1 3.96E−06 6.88E−07 8.13E−08 6.07E−07 17.38% 15.33% 3.59E−02 9.72E−04 1.74E−02 CE (2-loop)
St. Lucie 2 3.31E−06 6.72E−07 7.22E−08 6.00E−07 20.31% 18.13% 3.59E−02 9.70E−04 1.72E−02 CE (2-loop)
Summer 1.32E−05 6.69E−06 2.58E−07 6.43E−06 50.67% 48.71% 3.59E−02 1.96E−03 9.14E−02 WE (3-loop)
Surry 1 3.02E−06 1.15E−06 6.64E−07 4.85E−07 38.05% 16.06% 3.59E−02 1.95E−04 6.93E−02 WE (3-loop)
Surry 2 3.02E−06 1.15E−06 6.64E−07 4.85E−07 38.05% 16.06% 3.59E−02 1.95E−04 6.93E−02 WE (3-loop)
Susquehanna 1 2.77E−06 1.78E−06 1.61E−06 1.73E−07 64.37% 6.25% 3.59E−02 8.51E−05 5.66E−02 BWR 3/4 (HPCI)
Susquehanna 2 2.77E−06 1.78E−06 1.61E−06 1.73E−07 64.37% 6.25% 3.59E−02 8.51E−05 5.66E−02 BWR 3/4 (HPCI)
Three Mile Isl 1 7.60E−06 1.67E−06 9.34E−08 1.58E−06 22.02% 20.79% 3.59E−02 2.03E−03 2.17E−02 BW (2-loop)
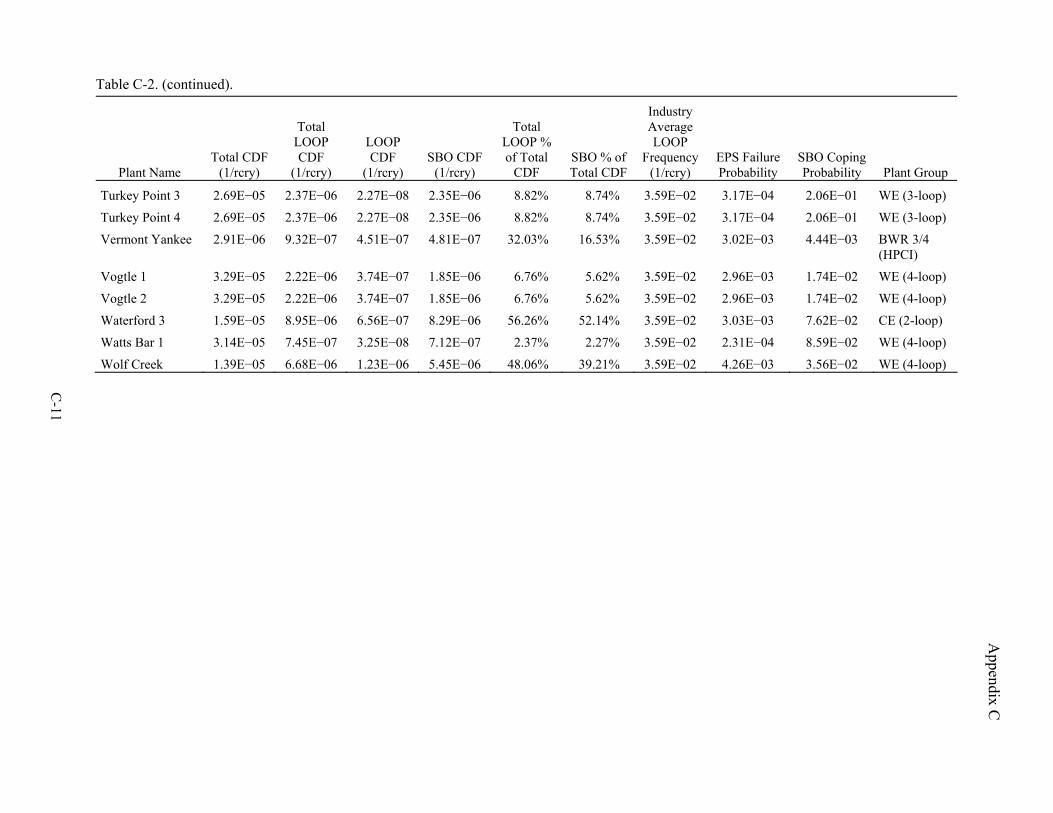
Appendix C
Table C-2. (continued).
C-11
Plant Name Total CDF
(1/rcry)
Total LOOP CDF
(1/rcry)
LOOP CDF
(1/rcry) SBO CDF
(1/rcry)
Total LOOP % of Total
CDF SBO % of Total CDF
Industry Average LOOP
Frequency(1/rcry)
EPS Failure Probability
SBO Coping Probability Plant Group
Turkey Point 3 2.69E−05 2.37E−06 2.27E−08 2.35E−06 8.82% 8.74% 3.59E−02 3.17E−04 2.06E−01 WE (3-loop)
Turkey Point 4 2.69E−05 2.37E−06 2.27E−08 2.35E−06 8.82% 8.74% 3.59E−02 3.17E−04 2.06E−01 WE (3-loop)
Vermont Yankee 2.91E−06 9.32E−07 4.51E−07 4.81E−07 32.03% 16.53% 3.59E−02 3.02E−03 4.44E−03 BWR 3/4 (HPCI)
Vogtle 1 3.29E−05 2.22E−06 3.74E−07 1.85E−06 6.76% 5.62% 3.59E−02 2.96E−03 1.74E−02 WE (4-loop)
Vogtle 2 3.29E−05 2.22E−06 3.74E−07 1.85E−06 6.76% 5.62% 3.59E−02 2.96E−03 1.74E−02 WE (4-loop)
Waterford 3 1.59E−05 8.95E−06 6.56E−07 8.29E−06 56.26% 52.14% 3.59E−02 3.03E−03 7.62E−02 CE (2-loop)
Watts Bar 1 3.14E−05 7.45E−07 3.25E−08 7.12E−07 2.37% 2.27% 3.59E−02 2.31E−04 8.59E−02 WE (4-loop)
Wolf Creek 1.39E−05 6.68E−06 1.23E−06 5.45E−06 48.06% 39.21% 3.59E−02 4.26E−03 3.56E−02 WE (4-loop)
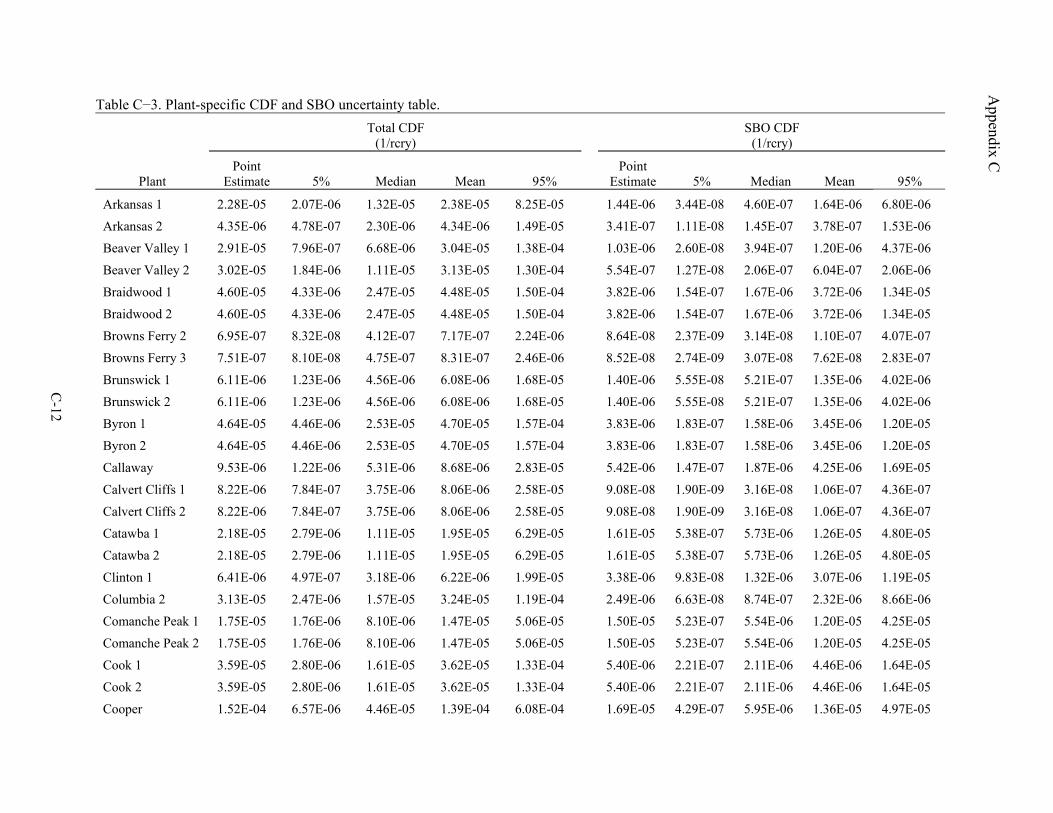
Appendix C
C-12
Table C−3. Plant-specific CDF and SBO uncertainty table. Total CDF
(1/rcry) SBO CDF
(1/rcry)
Plant Point
Estimate 5% Median Mean 95% Point
Estimate 5% Median Mean 95%
Arkansas 1 2.28E-05 2.07E-06 1.32E-05 2.38E-05 8.25E-05 1.44E-06 3.44E-08 4.60E-07 1.64E-06 6.80E-06
Arkansas 2 4.35E-06 4.78E-07 2.30E-06 4.34E-06 1.49E-05 3.41E-07 1.11E-08 1.45E-07 3.78E-07 1.53E-06
Beaver Valley 1 2.91E-05 7.96E-07 6.68E-06 3.04E-05 1.38E-04 1.03E-06 2.60E-08 3.94E-07 1.20E-06 4.37E-06
Beaver Valley 2 3.02E-05 1.84E-06 1.11E-05 3.13E-05 1.30E-04 5.54E-07 1.27E-08 2.06E-07 6.04E-07 2.06E-06
Braidwood 1 4.60E-05 4.33E-06 2.47E-05 4.48E-05 1.50E-04 3.82E-06 1.54E-07 1.67E-06 3.72E-06 1.34E-05
Braidwood 2 4.60E-05 4.33E-06 2.47E-05 4.48E-05 1.50E-04 3.82E-06 1.54E-07 1.67E-06 3.72E-06 1.34E-05
Browns Ferry 2 6.95E-07 8.32E-08 4.12E-07 7.17E-07 2.24E-06 8.64E-08 2.37E-09 3.14E-08 1.10E-07 4.07E-07
Browns Ferry 3 7.51E-07 8.10E-08 4.75E-07 8.31E-07 2.46E-06 8.52E-08 2.74E-09 3.07E-08 7.62E-08 2.83E-07
Brunswick 1 6.11E-06 1.23E-06 4.56E-06 6.08E-06 1.68E-05 1.40E-06 5.55E-08 5.21E-07 1.35E-06 4.02E-06
Brunswick 2 6.11E-06 1.23E-06 4.56E-06 6.08E-06 1.68E-05 1.40E-06 5.55E-08 5.21E-07 1.35E-06 4.02E-06
Byron 1 4.64E-05 4.46E-06 2.53E-05 4.70E-05 1.57E-04 3.83E-06 1.83E-07 1.58E-06 3.45E-06 1.20E-05
Byron 2 4.64E-05 4.46E-06 2.53E-05 4.70E-05 1.57E-04 3.83E-06 1.83E-07 1.58E-06 3.45E-06 1.20E-05
Callaway 9.53E-06 1.22E-06 5.31E-06 8.68E-06 2.83E-05 5.42E-06 1.47E-07 1.87E-06 4.25E-06 1.69E-05
Calvert Cliffs 1 8.22E-06 7.84E-07 3.75E-06 8.06E-06 2.58E-05 9.08E-08 1.90E-09 3.16E-08 1.06E-07 4.36E-07
Calvert Cliffs 2 8.22E-06 7.84E-07 3.75E-06 8.06E-06 2.58E-05 9.08E-08 1.90E-09 3.16E-08 1.06E-07 4.36E-07
Catawba 1 2.18E-05 2.79E-06 1.11E-05 1.95E-05 6.29E-05 1.61E-05 5.38E-07 5.73E-06 1.26E-05 4.80E-05
Catawba 2 2.18E-05 2.79E-06 1.11E-05 1.95E-05 6.29E-05 1.61E-05 5.38E-07 5.73E-06 1.26E-05 4.80E-05
Clinton 1 6.41E-06 4.97E-07 3.18E-06 6.22E-06 1.99E-05 3.38E-06 9.83E-08 1.32E-06 3.07E-06 1.19E-05
Columbia 2 3.13E-05 2.47E-06 1.57E-05 3.24E-05 1.19E-04 2.49E-06 6.63E-08 8.74E-07 2.32E-06 8.66E-06
Comanche Peak 1 1.75E-05 1.76E-06 8.10E-06 1.47E-05 5.06E-05 1.50E-05 5.23E-07 5.54E-06 1.20E-05 4.25E-05
Comanche Peak 2 1.75E-05 1.76E-06 8.10E-06 1.47E-05 5.06E-05 1.50E-05 5.23E-07 5.54E-06 1.20E-05 4.25E-05
Cook 1 3.59E-05 2.80E-06 1.61E-05 3.62E-05 1.33E-04 5.40E-06 2.21E-07 2.11E-06 4.46E-06 1.64E-05
Cook 2 3.59E-05 2.80E-06 1.61E-05 3.62E-05 1.33E-04 5.40E-06 2.21E-07 2.11E-06 4.46E-06 1.64E-05
Cooper 1.52E-04 6.57E-06 4.46E-05 1.39E-04 6.08E-04 1.69E-05 4.29E-07 5.95E-06 1.36E-05 4.97E-05
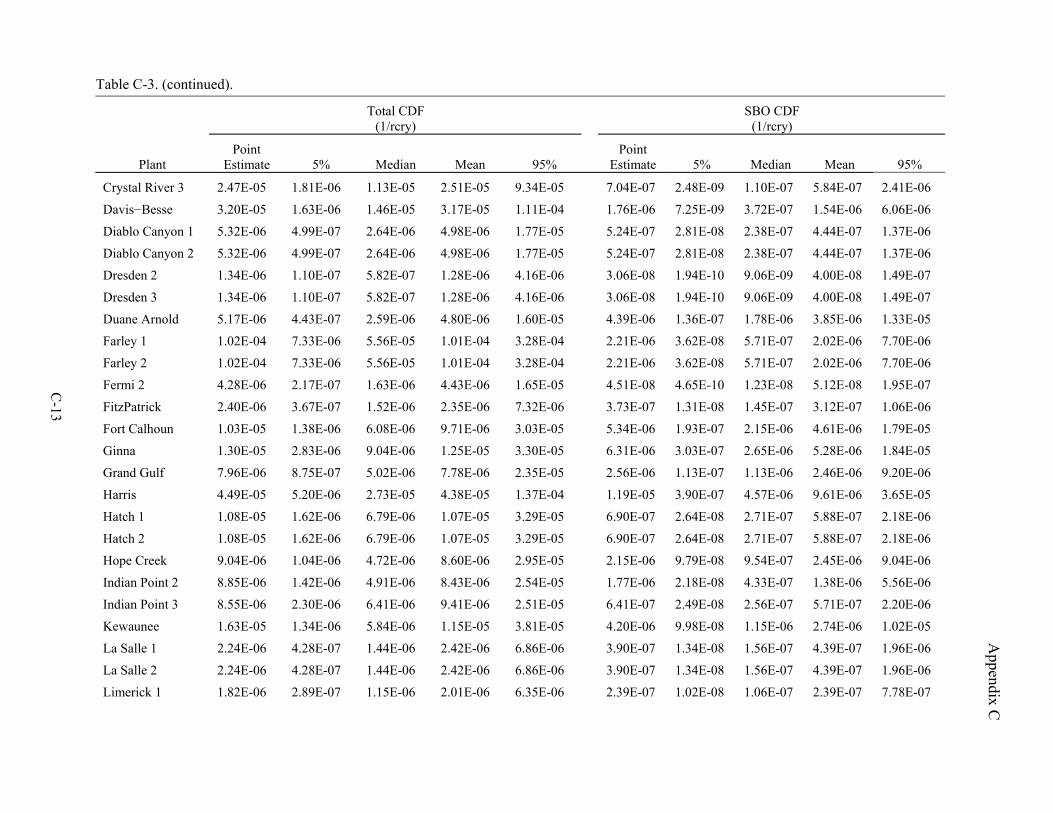
Appendix C
Table C-3. (continued).
C-13
Total CDF (1/rcry)
SBO CDF (1/rcry)
Plant Point
Estimate 5% Median Mean 95% Point
Estimate 5% Median Mean 95%
Crystal River 3 2.47E-05 1.81E-06 1.13E-05 2.51E-05 9.34E-05 7.04E-07 2.48E-09 1.10E-07 5.84E-07 2.41E-06
Davis−Besse 3.20E-05 1.63E-06 1.46E-05 3.17E-05 1.11E-04 1.76E-06 7.25E-09 3.72E-07 1.54E-06 6.06E-06
Diablo Canyon 1 5.32E-06 4.99E-07 2.64E-06 4.98E-06 1.77E-05 5.24E-07 2.81E-08 2.38E-07 4.44E-07 1.37E-06
Diablo Canyon 2 5.32E-06 4.99E-07 2.64E-06 4.98E-06 1.77E-05 5.24E-07 2.81E-08 2.38E-07 4.44E-07 1.37E-06
Dresden 2 1.34E-06 1.10E-07 5.82E-07 1.28E-06 4.16E-06 3.06E-08 1.94E-10 9.06E-09 4.00E-08 1.49E-07
Dresden 3 1.34E-06 1.10E-07 5.82E-07 1.28E-06 4.16E-06 3.06E-08 1.94E-10 9.06E-09 4.00E-08 1.49E-07
Duane Arnold 5.17E-06 4.43E-07 2.59E-06 4.80E-06 1.60E-05 4.39E-06 1.36E-07 1.78E-06 3.85E-06 1.33E-05
Farley 1 1.02E-04 7.33E-06 5.56E-05 1.01E-04 3.28E-04 2.21E-06 3.62E-08 5.71E-07 2.02E-06 7.70E-06
Farley 2 1.02E-04 7.33E-06 5.56E-05 1.01E-04 3.28E-04 2.21E-06 3.62E-08 5.71E-07 2.02E-06 7.70E-06
Fermi 2 4.28E-06 2.17E-07 1.63E-06 4.43E-06 1.65E-05 4.51E-08 4.65E-10 1.23E-08 5.12E-08 1.95E-07
FitzPatrick 2.40E-06 3.67E-07 1.52E-06 2.35E-06 7.32E-06 3.73E-07 1.31E-08 1.45E-07 3.12E-07 1.06E-06
Fort Calhoun 1.03E-05 1.38E-06 6.08E-06 9.71E-06 3.03E-05 5.34E-06 1.93E-07 2.15E-06 4.61E-06 1.79E-05
Ginna 1.30E-05 2.83E-06 9.04E-06 1.25E-05 3.30E-05 6.31E-06 3.03E-07 2.65E-06 5.28E-06 1.84E-05
Grand Gulf 7.96E-06 8.75E-07 5.02E-06 7.78E-06 2.35E-05 2.56E-06 1.13E-07 1.13E-06 2.46E-06 9.20E-06
Harris 4.49E-05 5.20E-06 2.73E-05 4.38E-05 1.37E-04 1.19E-05 3.90E-07 4.57E-06 9.61E-06 3.65E-05
Hatch 1 1.08E-05 1.62E-06 6.79E-06 1.07E-05 3.29E-05 6.90E-07 2.64E-08 2.71E-07 5.88E-07 2.18E-06
Hatch 2 1.08E-05 1.62E-06 6.79E-06 1.07E-05 3.29E-05 6.90E-07 2.64E-08 2.71E-07 5.88E-07 2.18E-06
Hope Creek 9.04E-06 1.04E-06 4.72E-06 8.60E-06 2.95E-05 2.15E-06 9.79E-08 9.54E-07 2.45E-06 9.04E-06
Indian Point 2 8.85E-06 1.42E-06 4.91E-06 8.43E-06 2.54E-05 1.77E-06 2.18E-08 4.33E-07 1.38E-06 5.56E-06
Indian Point 3 8.55E-06 2.30E-06 6.41E-06 9.41E-06 2.51E-05 6.41E-07 2.49E-08 2.56E-07 5.71E-07 2.20E-06
Kewaunee 1.63E-05 1.34E-06 5.84E-06 1.15E-05 3.81E-05 4.20E-06 9.98E-08 1.15E-06 2.74E-06 1.02E-05
La Salle 1 2.24E-06 4.28E-07 1.44E-06 2.42E-06 6.86E-06 3.90E-07 1.34E-08 1.56E-07 4.39E-07 1.96E-06
La Salle 2 2.24E-06 4.28E-07 1.44E-06 2.42E-06 6.86E-06 3.90E-07 1.34E-08 1.56E-07 4.39E-07 1.96E-06
Limerick 1 1.82E-06 2.89E-07 1.15E-06 2.01E-06 6.35E-06 2.39E-07 1.02E-08 1.06E-07 2.39E-07 7.78E-07
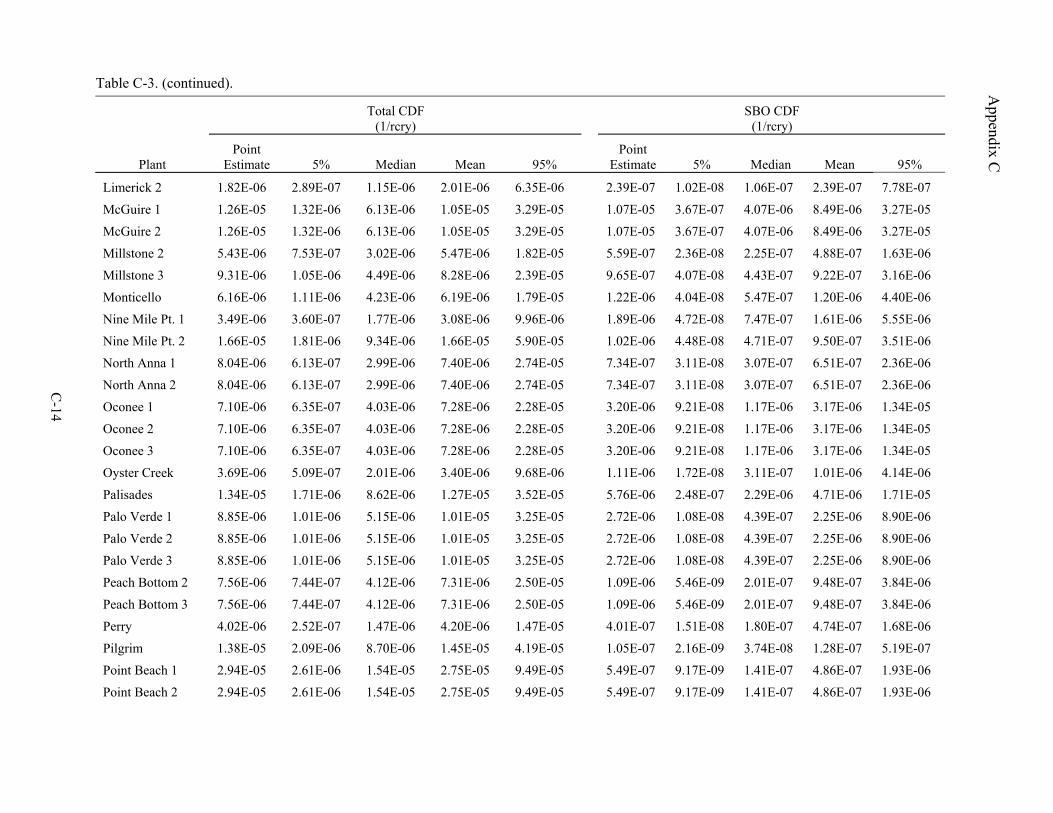
Appendix C
Table C-3. (continued).
C-14
Total CDF (1/rcry)
SBO CDF (1/rcry)
Plant Point
Estimate 5% Median Mean 95% Point
Estimate 5% Median Mean 95%
Limerick 2 1.82E-06 2.89E-07 1.15E-06 2.01E-06 6.35E-06 2.39E-07 1.02E-08 1.06E-07 2.39E-07 7.78E-07
McGuire 1 1.26E-05 1.32E-06 6.13E-06 1.05E-05 3.29E-05 1.07E-05 3.67E-07 4.07E-06 8.49E-06 3.27E-05
McGuire 2 1.26E-05 1.32E-06 6.13E-06 1.05E-05 3.29E-05 1.07E-05 3.67E-07 4.07E-06 8.49E-06 3.27E-05
Millstone 2 5.43E-06 7.53E-07 3.02E-06 5.47E-06 1.82E-05 5.59E-07 2.36E-08 2.25E-07 4.88E-07 1.63E-06
Millstone 3 9.31E-06 1.05E-06 4.49E-06 8.28E-06 2.39E-05 9.65E-07 4.07E-08 4.43E-07 9.22E-07 3.16E-06
Monticello 6.16E-06 1.11E-06 4.23E-06 6.19E-06 1.79E-05 1.22E-06 4.04E-08 5.47E-07 1.20E-06 4.40E-06
Nine Mile Pt. 1 3.49E-06 3.60E-07 1.77E-06 3.08E-06 9.96E-06 1.89E-06 4.72E-08 7.47E-07 1.61E-06 5.55E-06
Nine Mile Pt. 2 1.66E-05 1.81E-06 9.34E-06 1.66E-05 5.90E-05 1.02E-06 4.48E-08 4.71E-07 9.50E-07 3.51E-06
North Anna 1 8.04E-06 6.13E-07 2.99E-06 7.40E-06 2.74E-05 7.34E-07 3.11E-08 3.07E-07 6.51E-07 2.36E-06
North Anna 2 8.04E-06 6.13E-07 2.99E-06 7.40E-06 2.74E-05 7.34E-07 3.11E-08 3.07E-07 6.51E-07 2.36E-06
Oconee 1 7.10E-06 6.35E-07 4.03E-06 7.28E-06 2.28E-05 3.20E-06 9.21E-08 1.17E-06 3.17E-06 1.34E-05
Oconee 2 7.10E-06 6.35E-07 4.03E-06 7.28E-06 2.28E-05 3.20E-06 9.21E-08 1.17E-06 3.17E-06 1.34E-05
Oconee 3 7.10E-06 6.35E-07 4.03E-06 7.28E-06 2.28E-05 3.20E-06 9.21E-08 1.17E-06 3.17E-06 1.34E-05
Oyster Creek 3.69E-06 5.09E-07 2.01E-06 3.40E-06 9.68E-06 1.11E-06 1.72E-08 3.11E-07 1.01E-06 4.14E-06
Palisades 1.34E-05 1.71E-06 8.62E-06 1.27E-05 3.52E-05 5.76E-06 2.48E-07 2.29E-06 4.71E-06 1.71E-05
Palo Verde 1 8.85E-06 1.01E-06 5.15E-06 1.01E-05 3.25E-05 2.72E-06 1.08E-08 4.39E-07 2.25E-06 8.90E-06
Palo Verde 2 8.85E-06 1.01E-06 5.15E-06 1.01E-05 3.25E-05 2.72E-06 1.08E-08 4.39E-07 2.25E-06 8.90E-06
Palo Verde 3 8.85E-06 1.01E-06 5.15E-06 1.01E-05 3.25E-05 2.72E-06 1.08E-08 4.39E-07 2.25E-06 8.90E-06
Peach Bottom 2 7.56E-06 7.44E-07 4.12E-06 7.31E-06 2.50E-05 1.09E-06 5.46E-09 2.01E-07 9.48E-07 3.84E-06
Peach Bottom 3 7.56E-06 7.44E-07 4.12E-06 7.31E-06 2.50E-05 1.09E-06 5.46E-09 2.01E-07 9.48E-07 3.84E-06
Perry 4.02E-06 2.52E-07 1.47E-06 4.20E-06 1.47E-05 4.01E-07 1.51E-08 1.80E-07 4.74E-07 1.68E-06
Pilgrim 1.38E-05 2.09E-06 8.70E-06 1.45E-05 4.19E-05 1.05E-07 2.16E-09 3.74E-08 1.28E-07 5.19E-07
Point Beach 1 2.94E-05 2.61E-06 1.54E-05 2.75E-05 9.49E-05 5.49E-07 9.17E-09 1.41E-07 4.86E-07 1.93E-06
Point Beach 2 2.94E-05 2.61E-06 1.54E-05 2.75E-05 9.49E-05 5.49E-07 9.17E-09 1.41E-07 4.86E-07 1.93E-06
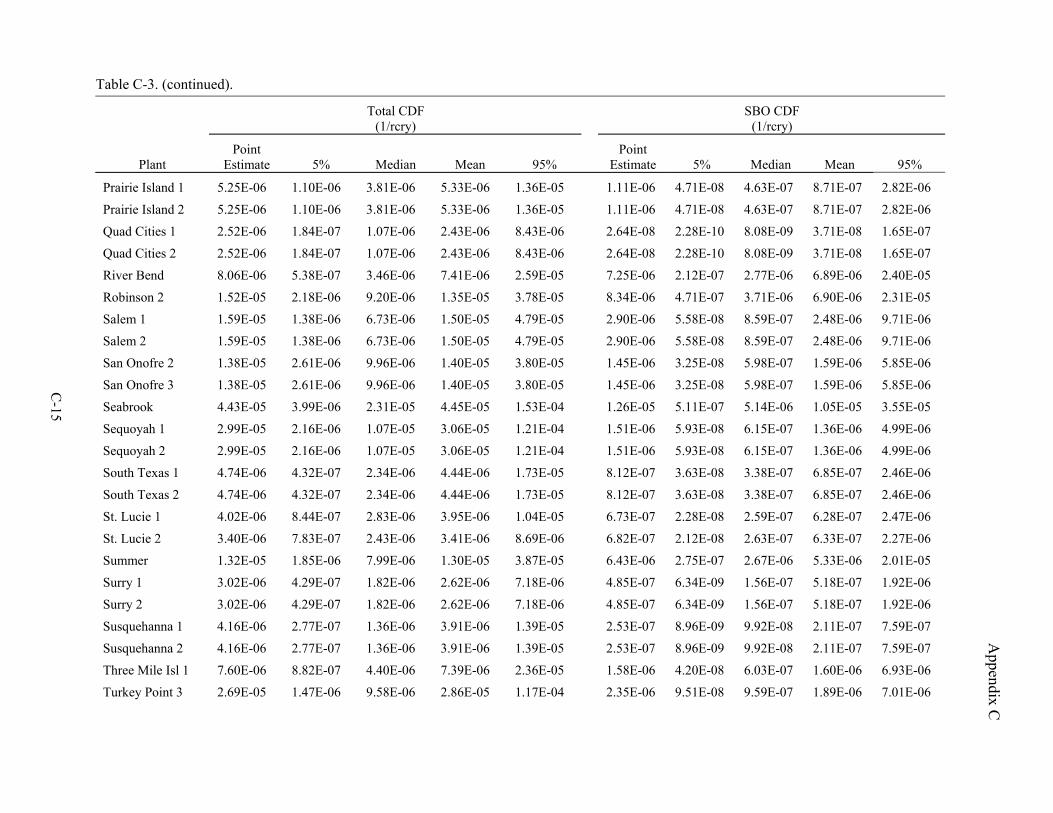
Appendix C
Table C-3. (continued).
C-15
Total CDF (1/rcry)
SBO CDF (1/rcry)
Plant Point
Estimate 5% Median Mean 95% Point
Estimate 5% Median Mean 95%
Prairie Island 1 5.25E-06 1.10E-06 3.81E-06 5.33E-06 1.36E-05 1.11E-06 4.71E-08 4.63E-07 8.71E-07 2.82E-06
Prairie Island 2 5.25E-06 1.10E-06 3.81E-06 5.33E-06 1.36E-05 1.11E-06 4.71E-08 4.63E-07 8.71E-07 2.82E-06
Quad Cities 1 2.52E-06 1.84E-07 1.07E-06 2.43E-06 8.43E-06 2.64E-08 2.28E-10 8.08E-09 3.71E-08 1.65E-07
Quad Cities 2 2.52E-06 1.84E-07 1.07E-06 2.43E-06 8.43E-06 2.64E-08 2.28E-10 8.08E-09 3.71E-08 1.65E-07
River Bend 8.06E-06 5.38E-07 3.46E-06 7.41E-06 2.59E-05 7.25E-06 2.12E-07 2.77E-06 6.89E-06 2.40E-05
Robinson 2 1.52E-05 2.18E-06 9.20E-06 1.35E-05 3.78E-05 8.34E-06 4.71E-07 3.71E-06 6.90E-06 2.31E-05
Salem 1 1.59E-05 1.38E-06 6.73E-06 1.50E-05 4.79E-05 2.90E-06 5.58E-08 8.59E-07 2.48E-06 9.71E-06
Salem 2 1.59E-05 1.38E-06 6.73E-06 1.50E-05 4.79E-05 2.90E-06 5.58E-08 8.59E-07 2.48E-06 9.71E-06
San Onofre 2 1.38E-05 2.61E-06 9.96E-06 1.40E-05 3.80E-05 1.45E-06 3.25E-08 5.98E-07 1.59E-06 5.85E-06
San Onofre 3 1.38E-05 2.61E-06 9.96E-06 1.40E-05 3.80E-05 1.45E-06 3.25E-08 5.98E-07 1.59E-06 5.85E-06
Seabrook 4.43E-05 3.99E-06 2.31E-05 4.45E-05 1.53E-04 1.26E-05 5.11E-07 5.14E-06 1.05E-05 3.55E-05
Sequoyah 1 2.99E-05 2.16E-06 1.07E-05 3.06E-05 1.21E-04 1.51E-06 5.93E-08 6.15E-07 1.36E-06 4.99E-06
Sequoyah 2 2.99E-05 2.16E-06 1.07E-05 3.06E-05 1.21E-04 1.51E-06 5.93E-08 6.15E-07 1.36E-06 4.99E-06
South Texas 1 4.74E-06 4.32E-07 2.34E-06 4.44E-06 1.73E-05 8.12E-07 3.63E-08 3.38E-07 6.85E-07 2.46E-06
South Texas 2 4.74E-06 4.32E-07 2.34E-06 4.44E-06 1.73E-05 8.12E-07 3.63E-08 3.38E-07 6.85E-07 2.46E-06
St. Lucie 1 4.02E-06 8.44E-07 2.83E-06 3.95E-06 1.04E-05 6.73E-07 2.28E-08 2.59E-07 6.28E-07 2.47E-06
St. Lucie 2 3.40E-06 7.83E-07 2.43E-06 3.41E-06 8.69E-06 6.82E-07 2.12E-08 2.63E-07 6.33E-07 2.27E-06
Summer 1.32E-05 1.85E-06 7.99E-06 1.30E-05 3.87E-05 6.43E-06 2.75E-07 2.67E-06 5.33E-06 2.01E-05
Surry 1 3.02E-06 4.29E-07 1.82E-06 2.62E-06 7.18E-06 4.85E-07 6.34E-09 1.56E-07 5.18E-07 1.92E-06
Surry 2 3.02E-06 4.29E-07 1.82E-06 2.62E-06 7.18E-06 4.85E-07 6.34E-09 1.56E-07 5.18E-07 1.92E-06
Susquehanna 1 4.16E-06 2.77E-07 1.36E-06 3.91E-06 1.39E-05 2.53E-07 8.96E-09 9.92E-08 2.11E-07 7.59E-07
Susquehanna 2 4.16E-06 2.77E-07 1.36E-06 3.91E-06 1.39E-05 2.53E-07 8.96E-09 9.92E-08 2.11E-07 7.59E-07
Three Mile Isl 1 7.60E-06 8.82E-07 4.40E-06 7.39E-06 2.36E-05 1.58E-06 4.20E-08 6.03E-07 1.60E-06 6.93E-06
Turkey Point 3 2.69E-05 1.47E-06 9.58E-06 2.86E-05 1.17E-04 2.35E-06 9.51E-08 9.59E-07 1.89E-06 7.01E-06
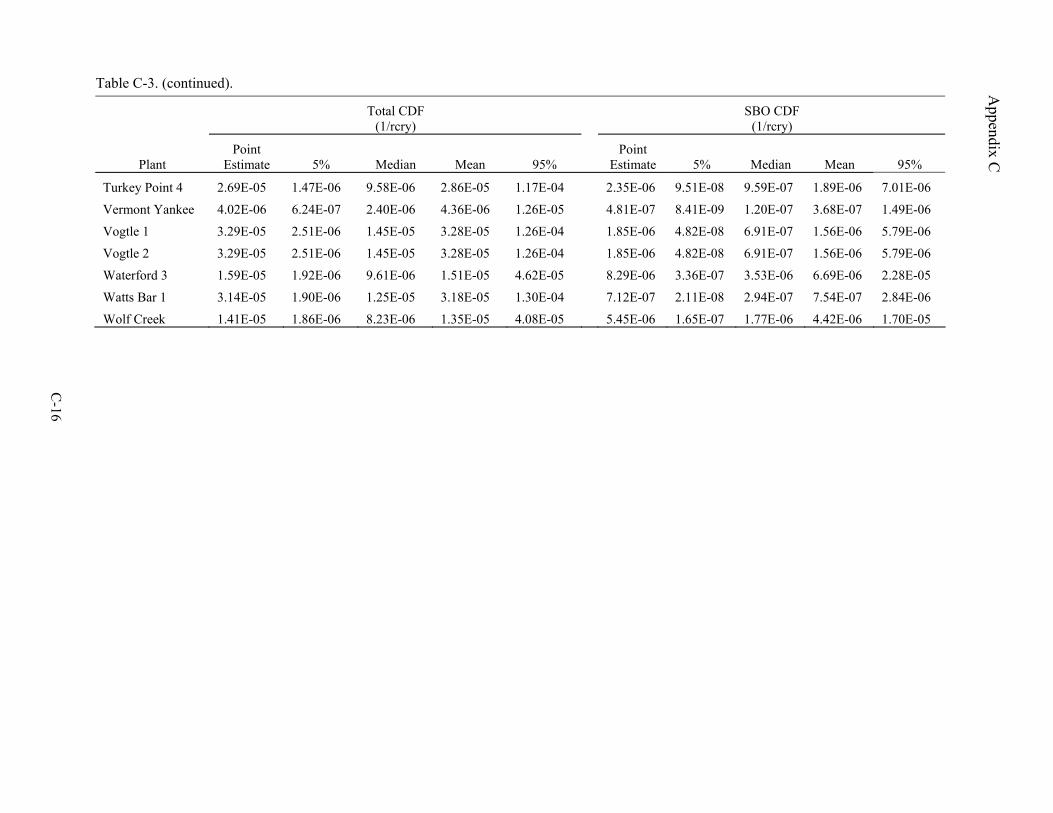
Appendix C
Table C-3. (continued).
C-16
Total CDF (1/rcry)
SBO CDF (1/rcry)
Plant Point
Estimate 5% Median Mean 95% Point
Estimate 5% Median Mean 95%
Turkey Point 4 2.69E-05 1.47E-06 9.58E-06 2.86E-05 1.17E-04 2.35E-06 9.51E-08 9.59E-07 1.89E-06 7.01E-06
Vermont Yankee 4.02E-06 6.24E-07 2.40E-06 4.36E-06 1.26E-05 4.81E-07 8.41E-09 1.20E-07 3.68E-07 1.49E-06
Vogtle 1 3.29E-05 2.51E-06 1.45E-05 3.28E-05 1.26E-04 1.85E-06 4.82E-08 6.91E-07 1.56E-06 5.79E-06
Vogtle 2 3.29E-05 2.51E-06 1.45E-05 3.28E-05 1.26E-04 1.85E-06 4.82E-08 6.91E-07 1.56E-06 5.79E-06
Waterford 3 1.59E-05 1.92E-06 9.61E-06 1.51E-05 4.62E-05 8.29E-06 3.36E-07 3.53E-06 6.69E-06 2.28E-05
Watts Bar 1 3.14E-05 1.90E-06 1.25E-05 3.18E-05 1.30E-04 7.12E-07 2.11E-08 2.94E-07 7.54E-07 2.84E-06
Wolf Creek 1.41E-05 1.86E-06 8.23E-06 1.35E-05 4.08E-05 5.45E-06 1.65E-07 1.77E-06 4.42E-06 1.70E-05
D-1
Appendix D
Baseline and Sensitivity Case Input Parameters

Appendix D
D-2
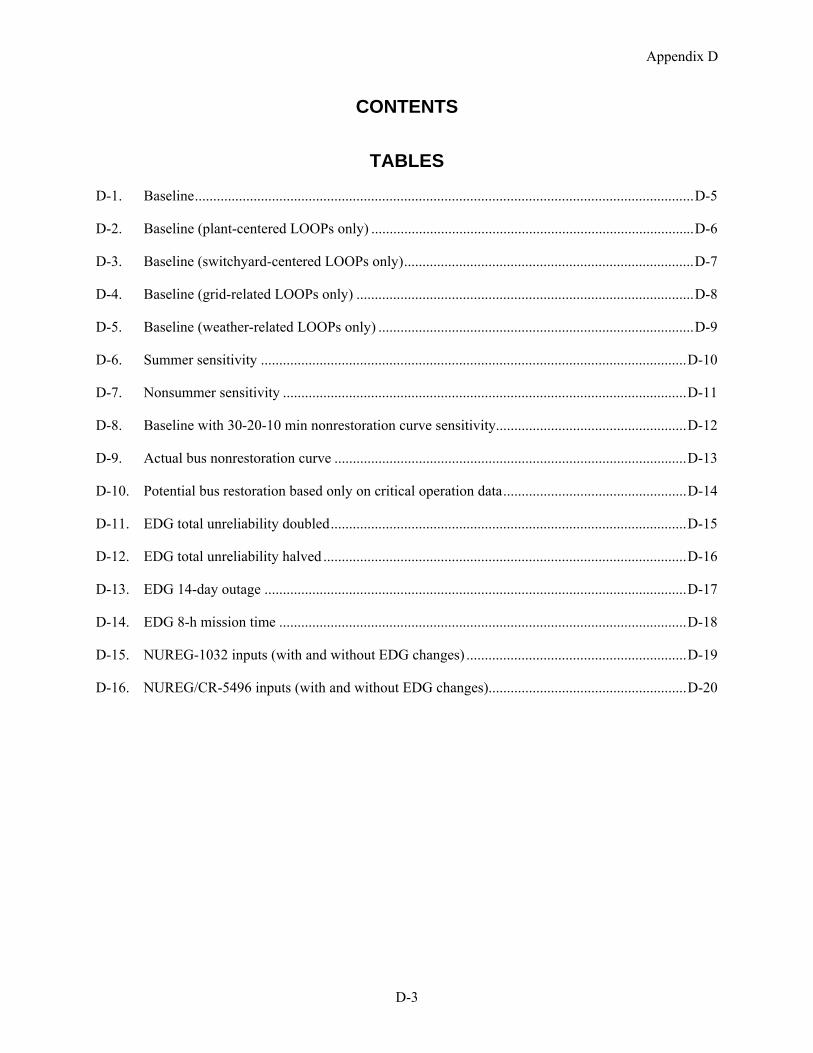
Appendix D
D-3
CONTENTS
TABLES
D-1. Baseline........................................................................................................................................D-5
D-2. Baseline (plant-centered LOOPs only) ........................................................................................D-6
D-3. Baseline (switchyard-centered LOOPs only)...............................................................................D-7
D-4. Baseline (grid-related LOOPs only) ............................................................................................D-8
D-5. Baseline (weather-related LOOPs only) ......................................................................................D-9
D-6. Summer sensitivity ....................................................................................................................D-10
D-7. Nonsummer sensitivity ..............................................................................................................D-11
D-8. Baseline with 30-20-10 min nonrestoration curve sensitivity....................................................D-12
D-9. Actual bus nonrestoration curve ................................................................................................D-13
D-10. Potential bus restoration based only on critical operation data..................................................D-14
D-11. EDG total unreliability doubled.................................................................................................D-15
D-12. EDG total unreliability halved ...................................................................................................D-16
D-13. EDG 14-day outage ...................................................................................................................D-17
D-14. EDG 8-h mission time ...............................................................................................................D-18
D-15. NUREG-1032 inputs (with and without EDG changes) ............................................................D-19
D-16. NUREG/CR-5496 inputs (with and without EDG changes)......................................................D-20

Appendix D
D-4
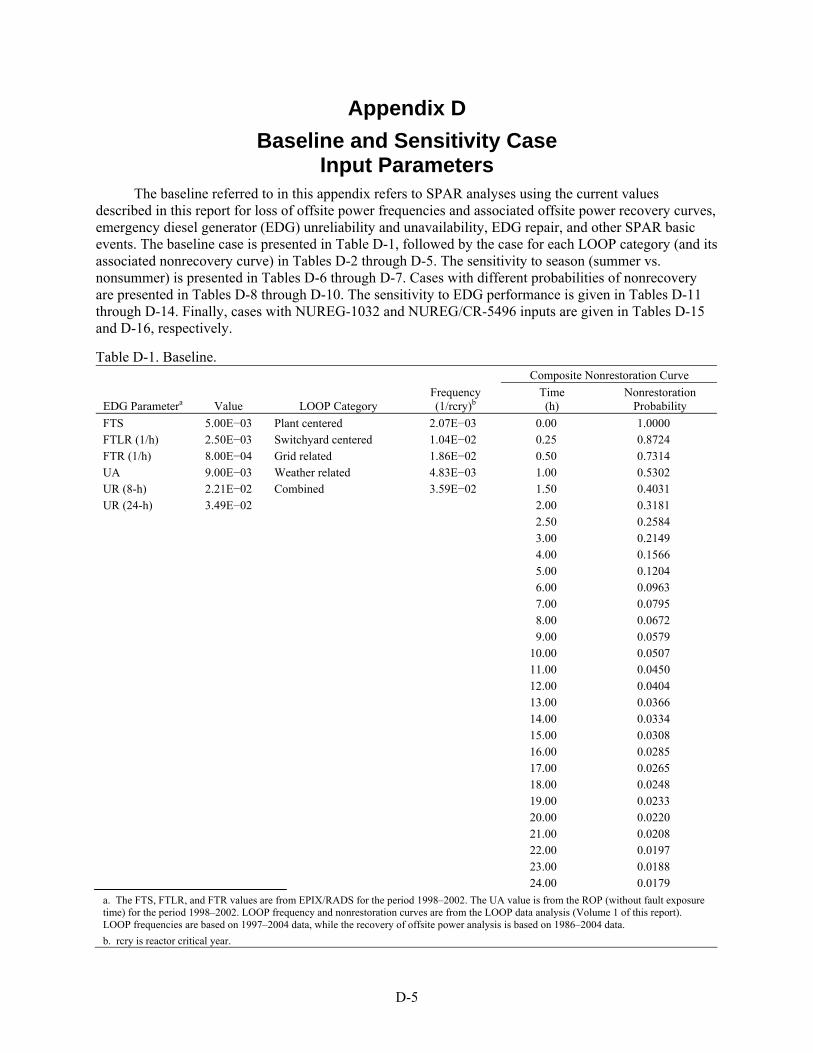
D-5
Appendix D Baseline and Sensitivity Case
Input Parameters The baseline referred to in this appendix refers to SPAR analyses using the current values
described in this report for loss of offsite power frequencies and associated offsite power recovery curves, emergency diesel generator (EDG) unreliability and unavailability, EDG repair, and other SPAR basic events. The baseline case is presented in Table D-1, followed by the case for each LOOP category (and its associated nonrecovery curve) in Tables D-2 through D-5. The sensitivity to season (summer vs. nonsummer) is presented in Tables D-6 through D-7. Cases with different probabilities of nonrecovery are presented in Tables D-8 through D-10. The sensitivity to EDG performance is given in Tables D-11 through D-14. Finally, cases with NUREG-1032 and NUREG/CR-5496 inputs are given in Tables D-15 and D-16, respectively.
Table D-1. Baseline. Composite Nonrestoration Curve
EDG Parametera Value LOOP Category Frequency (1/rcry)b
Time (h)
Nonrestoration Probability
FTS 5.00E−03 Plant centered 2.07E−03 0.00 1.0000 FTLR (1/h) 2.50E−03 Switchyard centered 1.04E−02 0.25 0.8724 FTR (1/h) 8.00E−04 Grid related 1.86E−02 0.50 0.7314 UA 9.00E−03 Weather related 4.83E−03 1.00 0.5302 UR (8-h) 2.21E−02 Combined 3.59E−02 1.50 0.4031 UR (24-h) 3.49E−02 2.00 0.3181 2.50 0.2584 3.00 0.2149 4.00 0.1566 5.00 0.1204 6.00 0.0963 7.00 0.0795 8.00 0.0672 9.00 0.0579 10.00 0.0507 11.00 0.0450 12.00 0.0404 13.00 0.0366 14.00 0.0334 15.00 0.0308 16.00 0.0285 17.00 0.0265 18.00 0.0248 19.00 0.0233 20.00 0.0220 21.00 0.0208 22.00 0.0197 23.00 0.0188 24.00 0.0179 a. The FTS, FTLR, and FTR values are from EPIX/RADS for the period 1998–2002. The UA value is from the ROP (without fault exposure time) for the period 1998–2002. LOOP frequency and nonrestoration curves are from the LOOP data analysis (Volume 1 of this report). LOOP frequencies are based on 1997–2004 data, while the recovery of offsite power analysis is based on 1986–2004 data. b. rcry is reactor critical year.
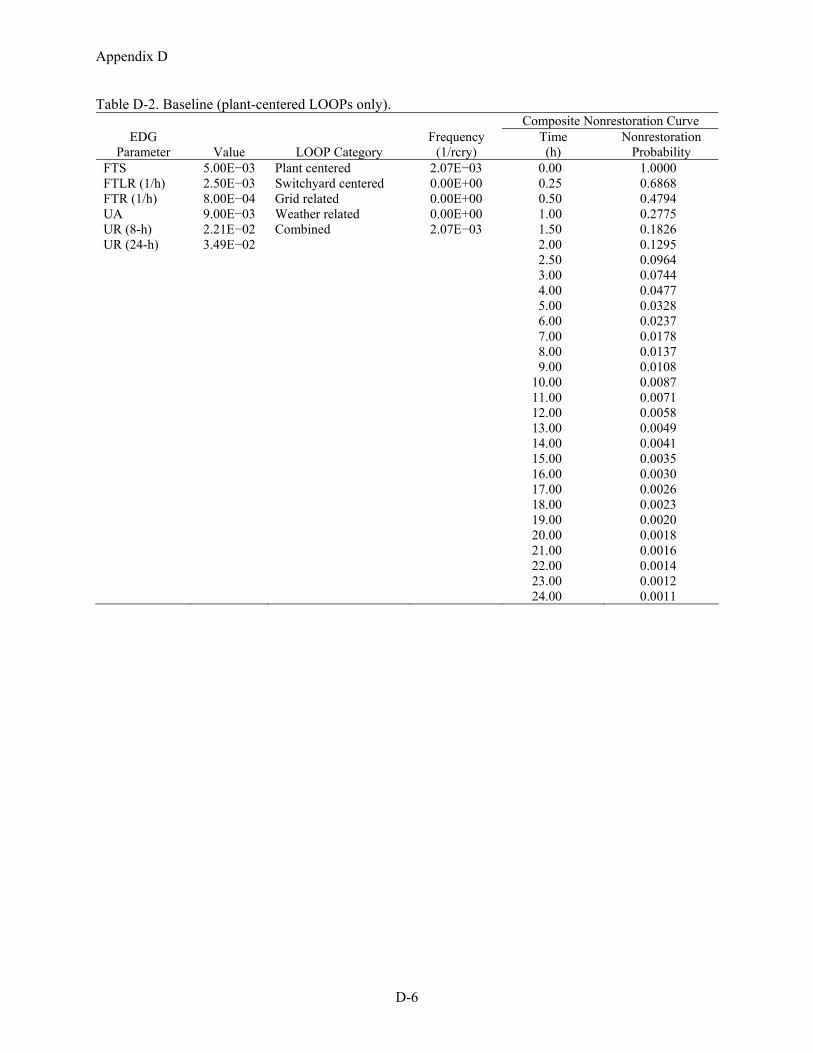
Appendix D
D-6
Table D-2. Baseline (plant-centered LOOPs only). Composite Nonrestoration Curve
EDG Parameter Value LOOP Category
Frequency (1/rcry)
Time (h)
Nonrestoration Probability
FTS 5.00E−03 Plant centered 2.07E−03 0.00 1.0000 FTLR (1/h) 2.50E−03 Switchyard centered 0.00E+00 0.25 0.6868 FTR (1/h) 8.00E−04 Grid related 0.00E+00 0.50 0.4794 UA 9.00E−03 Weather related 0.00E+00 1.00 0.2775 UR (8-h) 2.21E−02 Combined 2.07E−03 1.50 0.1826 UR (24-h) 3.49E−02 2.00 0.1295 2.50 0.0964 3.00 0.0744 4.00 0.0477 5.00 0.0328 6.00 0.0237 7.00 0.0178 8.00 0.0137 9.00 0.0108 10.00 0.0087 11.00 0.0071 12.00 0.0058 13.00 0.0049 14.00 0.0041 15.00 0.0035 16.00 0.0030 17.00 0.0026 18.00 0.0023 19.00 0.0020 20.00 0.0018 21.00 0.0016 22.00 0.0014 23.00 0.0012 24.00 0.0011
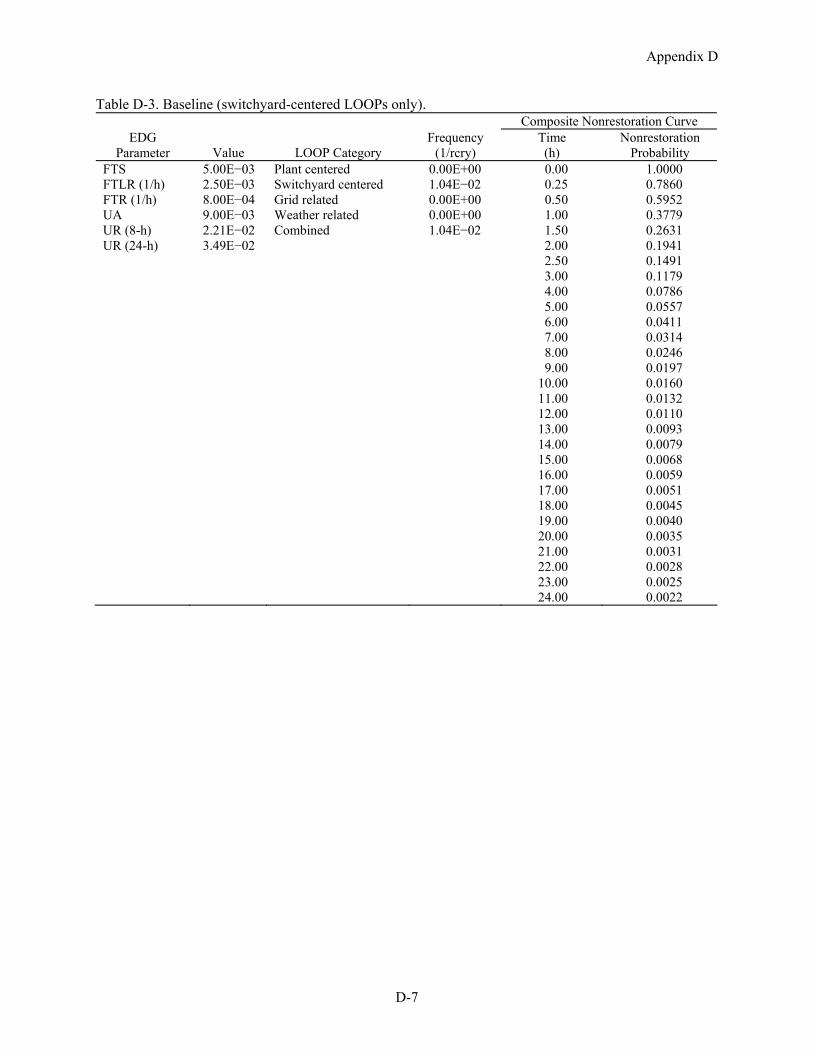
Appendix D
D-7
Table D-3. Baseline (switchyard-centered LOOPs only). Composite Nonrestoration Curve
EDG Parameter Value LOOP Category
Frequency (1/rcry)
Time (h)
Nonrestoration Probability
FTS 5.00E−03 Plant centered 0.00E+00 0.00 1.0000 FTLR (1/h) 2.50E−03 Switchyard centered 1.04E−02 0.25 0.7860 FTR (1/h) 8.00E−04 Grid related 0.00E+00 0.50 0.5952 UA 9.00E−03 Weather related 0.00E+00 1.00 0.3779 UR (8-h) 2.21E−02 Combined 1.04E−02 1.50 0.2631 UR (24-h) 3.49E−02 2.00 0.1941 2.50 0.1491 3.00 0.1179 4.00 0.0786 5.00 0.0557 6.00 0.0411 7.00 0.0314 8.00 0.0246 9.00 0.0197 10.00 0.0160 11.00 0.0132 12.00 0.0110 13.00 0.0093 14.00 0.0079 15.00 0.0068 16.00 0.0059 17.00 0.0051 18.00 0.0045 19.00 0.0040 20.00 0.0035 21.00 0.0031 22.00 0.0028 23.00 0.0025 24.00 0.0022
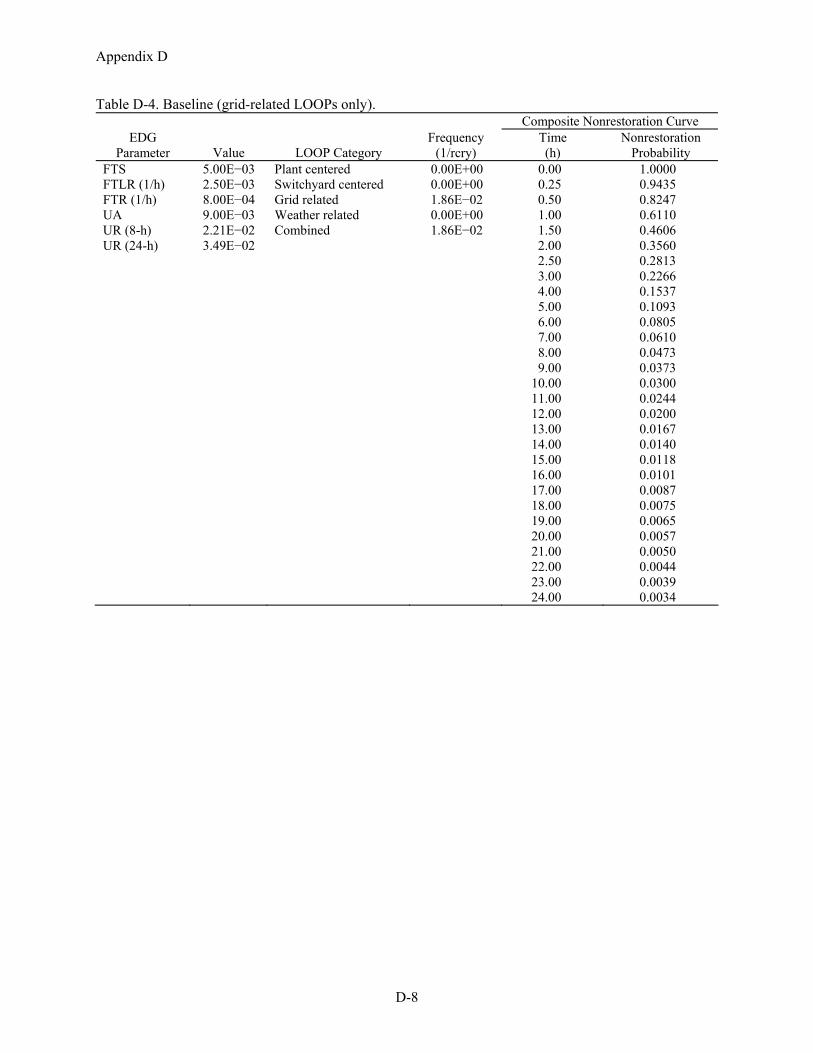
Appendix D
D-8
Table D-4. Baseline (grid-related LOOPs only). Composite Nonrestoration Curve
EDG Parameter Value LOOP Category
Frequency (1/rcry)
Time (h)
Nonrestoration Probability
FTS 5.00E−03 Plant centered 0.00E+00 0.00 1.0000 FTLR (1/h) 2.50E−03 Switchyard centered 0.00E+00 0.25 0.9435 FTR (1/h) 8.00E−04 Grid related 1.86E−02 0.50 0.8247 UA 9.00E−03 Weather related 0.00E+00 1.00 0.6110 UR (8-h) 2.21E−02 Combined 1.86E−02 1.50 0.4606 UR (24-h) 3.49E−02 2.00 0.3560 2.50 0.2813 3.00 0.2266 4.00 0.1537 5.00 0.1093 6.00 0.0805 7.00 0.0610 8.00 0.0473 9.00 0.0373 10.00 0.0300 11.00 0.0244 12.00 0.0200 13.00 0.0167 14.00 0.0140 15.00 0.0118 16.00 0.0101 17.00 0.0087 18.00 0.0075 19.00 0.0065 20.00 0.0057 21.00 0.0050 22.00 0.0044 23.00 0.0039 24.00 0.0034
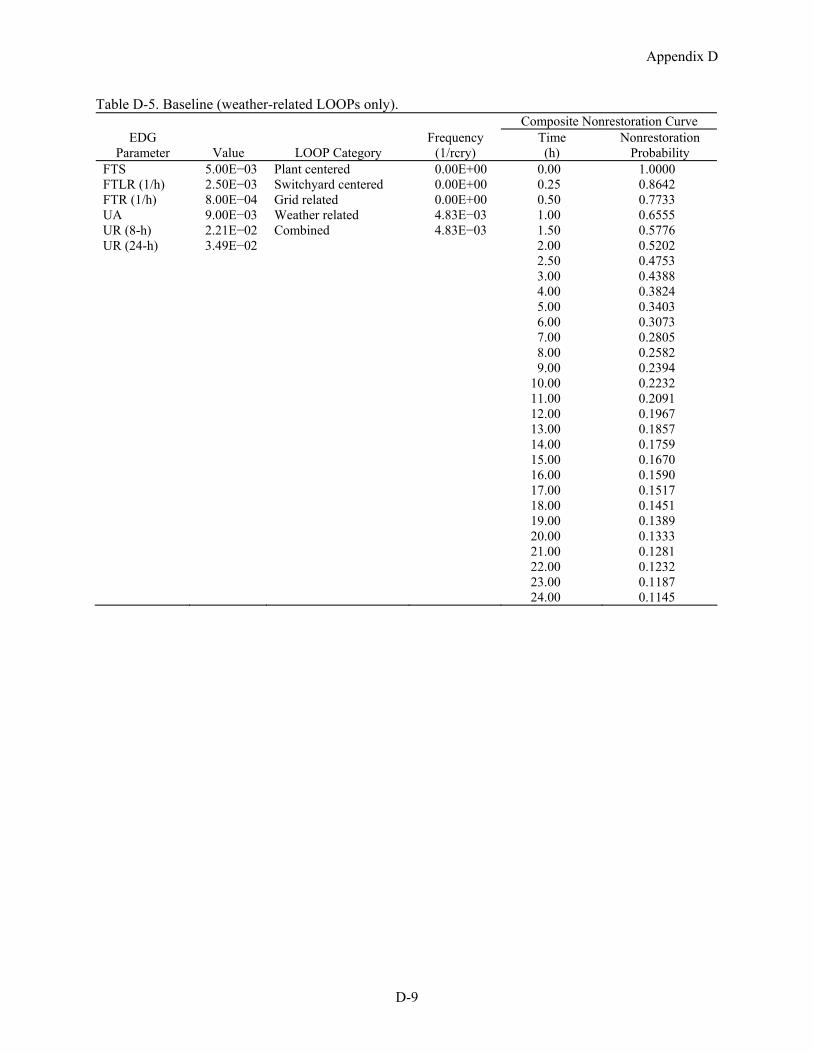
Appendix D
D-9
Table D-5. Baseline (weather-related LOOPs only). Composite Nonrestoration Curve
EDG Parameter Value LOOP Category
Frequency (1/rcry)
Time (h)
Nonrestoration Probability
FTS 5.00E−03 Plant centered 0.00E+00 0.00 1.0000 FTLR (1/h) 2.50E−03 Switchyard centered 0.00E+00 0.25 0.8642 FTR (1/h) 8.00E−04 Grid related 0.00E+00 0.50 0.7733 UA 9.00E−03 Weather related 4.83E−03 1.00 0.6555 UR (8-h) 2.21E−02 Combined 4.83E−03 1.50 0.5776 UR (24-h) 3.49E−02 2.00 0.5202 2.50 0.4753 3.00 0.4388 4.00 0.3824 5.00 0.3403 6.00 0.3073 7.00 0.2805 8.00 0.2582 9.00 0.2394 10.00 0.2232 11.00 0.2091 12.00 0.1967 13.00 0.1857 14.00 0.1759 15.00 0.1670 16.00 0.1590 17.00 0.1517 18.00 0.1451 19.00 0.1389 20.00 0.1333 21.00 0.1281 22.00 0.1232 23.00 0.1187 24.00 0.1145
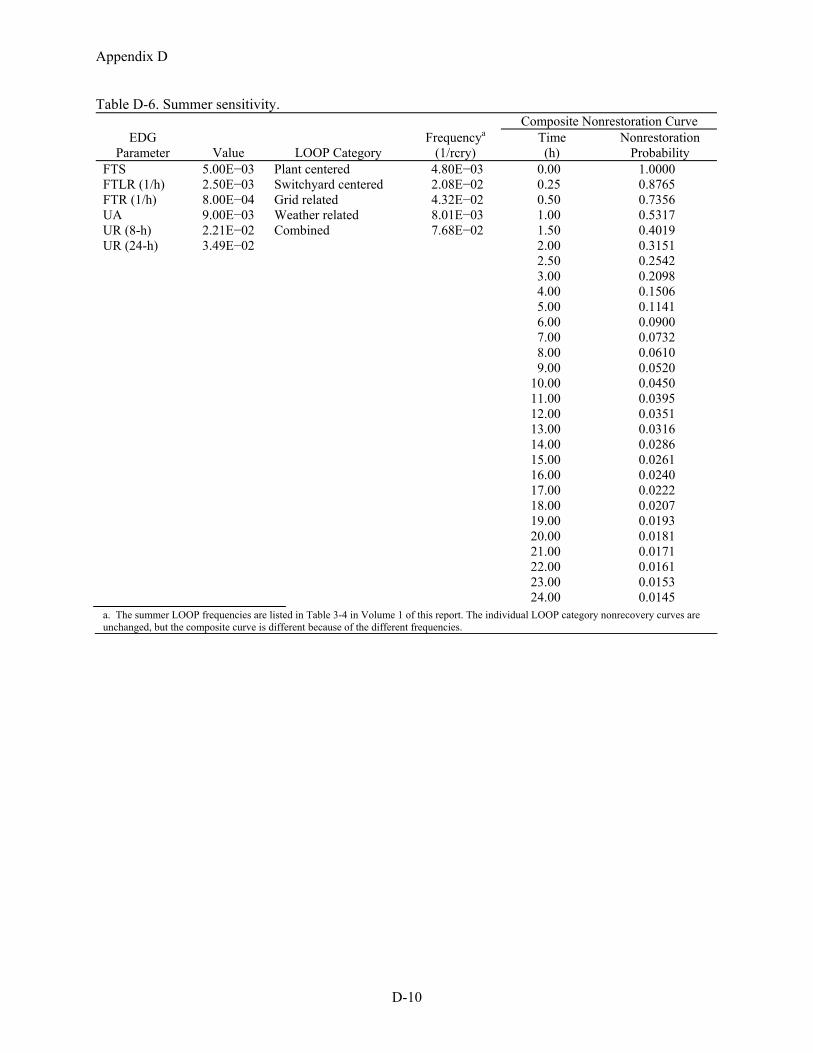
Appendix D
D-10
Table D-6. Summer sensitivity. Composite Nonrestoration Curve
EDG Parameter Value LOOP Category
Frequencya (1/rcry)
Time (h)
Nonrestoration Probability
FTS 5.00E−03 Plant centered 4.80E−03 0.00 1.0000 FTLR (1/h) 2.50E−03 Switchyard centered 2.08E−02 0.25 0.8765 FTR (1/h) 8.00E−04 Grid related 4.32E−02 0.50 0.7356 UA 9.00E−03 Weather related 8.01E−03 1.00 0.5317 UR (8-h) 2.21E−02 Combined 7.68E−02 1.50 0.4019 UR (24-h) 3.49E−02 2.00 0.3151 2.50 0.2542 3.00 0.2098 4.00 0.1506 5.00 0.1141 6.00 0.0900 7.00 0.0732 8.00 0.0610 9.00 0.0520 10.00 0.0450 11.00 0.0395 12.00 0.0351 13.00 0.0316 14.00 0.0286 15.00 0.0261 16.00 0.0240 17.00 0.0222 18.00 0.0207 19.00 0.0193 20.00 0.0181 21.00 0.0171 22.00 0.0161 23.00 0.0153 24.00 0.0145 a. The summer LOOP frequencies are listed in Table 3-4 in Volume 1 of this report. The individual LOOP category nonrecovery curves are unchanged, but the composite curve is different because of the different frequencies.
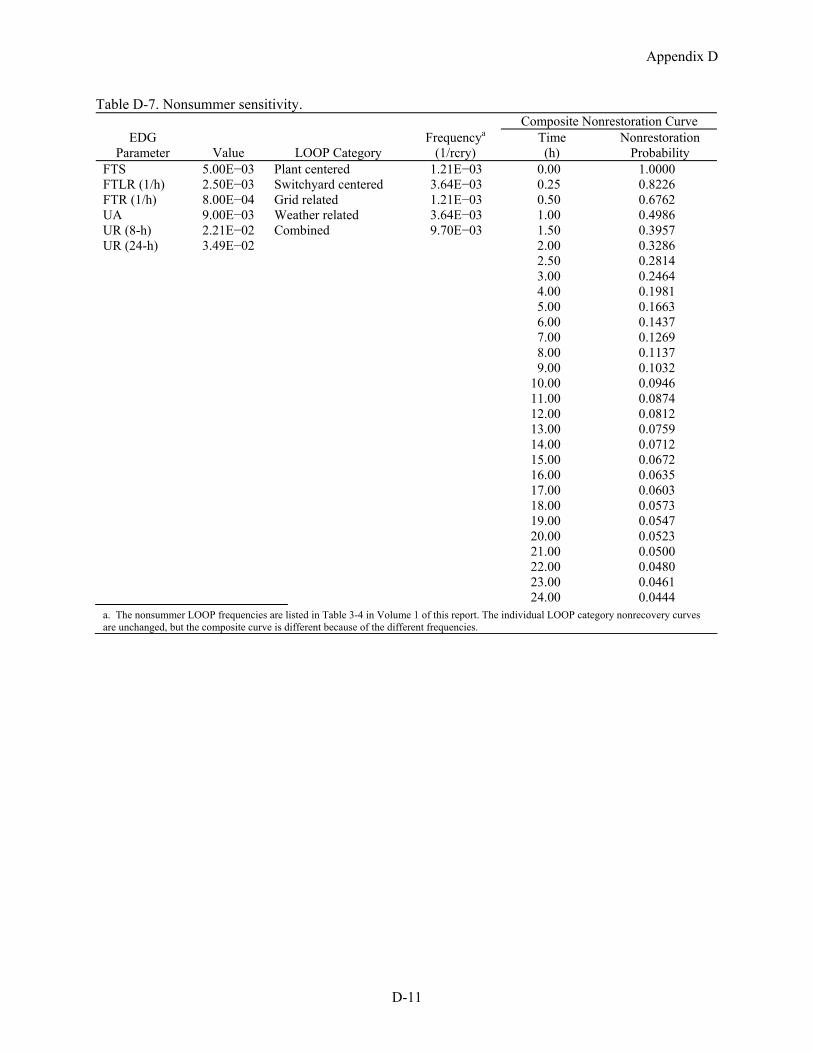
Appendix D
D-11
Table D-7. Nonsummer sensitivity. Composite Nonrestoration Curve
EDG Parameter Value LOOP Category
Frequencya (1/rcry)
Time (h)
Nonrestoration Probability
FTS 5.00E−03 Plant centered 1.21E−03 0.00 1.0000 FTLR (1/h) 2.50E−03 Switchyard centered 3.64E−03 0.25 0.8226 FTR (1/h) 8.00E−04 Grid related 1.21E−03 0.50 0.6762 UA 9.00E−03 Weather related 3.64E−03 1.00 0.4986 UR (8-h) 2.21E−02 Combined 9.70E−03 1.50 0.3957 UR (24-h) 3.49E−02 2.00 0.3286 2.50 0.2814 3.00 0.2464 4.00 0.1981 5.00 0.1663 6.00 0.1437 7.00 0.1269 8.00 0.1137 9.00 0.1032 10.00 0.0946 11.00 0.0874 12.00 0.0812 13.00 0.0759 14.00 0.0712 15.00 0.0672 16.00 0.0635 17.00 0.0603 18.00 0.0573 19.00 0.0547 20.00 0.0523 21.00 0.0500 22.00 0.0480 23.00 0.0461 24.00 0.0444 a. The nonsummer LOOP frequencies are listed in Table 3-4 in Volume 1 of this report. The individual LOOP category nonrecovery curves are unchanged, but the composite curve is different because of the different frequencies.
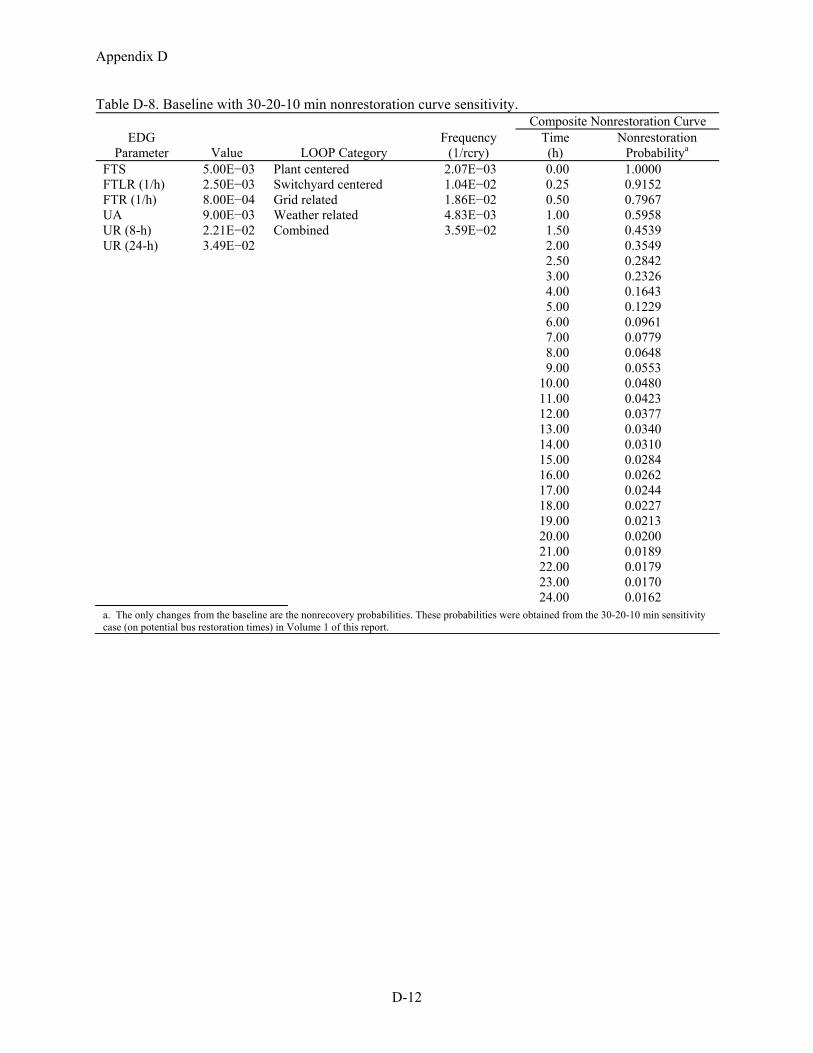
Appendix D
D-12
Table D-8. Baseline with 30-20-10 min nonrestoration curve sensitivity. Composite Nonrestoration Curve
EDG Parameter Value LOOP Category
Frequency (1/rcry)
Time (h)
Nonrestoration Probabilitya
FTS 5.00E−03 Plant centered 2.07E−03 0.00 1.0000 FTLR (1/h) 2.50E−03 Switchyard centered 1.04E−02 0.25 0.9152 FTR (1/h) 8.00E−04 Grid related 1.86E−02 0.50 0.7967 UA 9.00E−03 Weather related 4.83E−03 1.00 0.5958 UR (8-h) 2.21E−02 Combined 3.59E−02 1.50 0.4539 UR (24-h) 3.49E−02 2.00 0.3549 2.50 0.2842 3.00 0.2326 4.00 0.1643 5.00 0.1229 6.00 0.0961 7.00 0.0779 8.00 0.0648 9.00 0.0553 10.00 0.0480 11.00 0.0423 12.00 0.0377 13.00 0.0340 14.00 0.0310 15.00 0.0284 16.00 0.0262 17.00 0.0244 18.00 0.0227 19.00 0.0213 20.00 0.0200 21.00 0.0189 22.00 0.0179 23.00 0.0170 24.00 0.0162 a. The only changes from the baseline are the nonrecovery probabilities. These probabilities were obtained from the 30-20-10 min sensitivity case (on potential bus restoration times) in Volume 1 of this report.
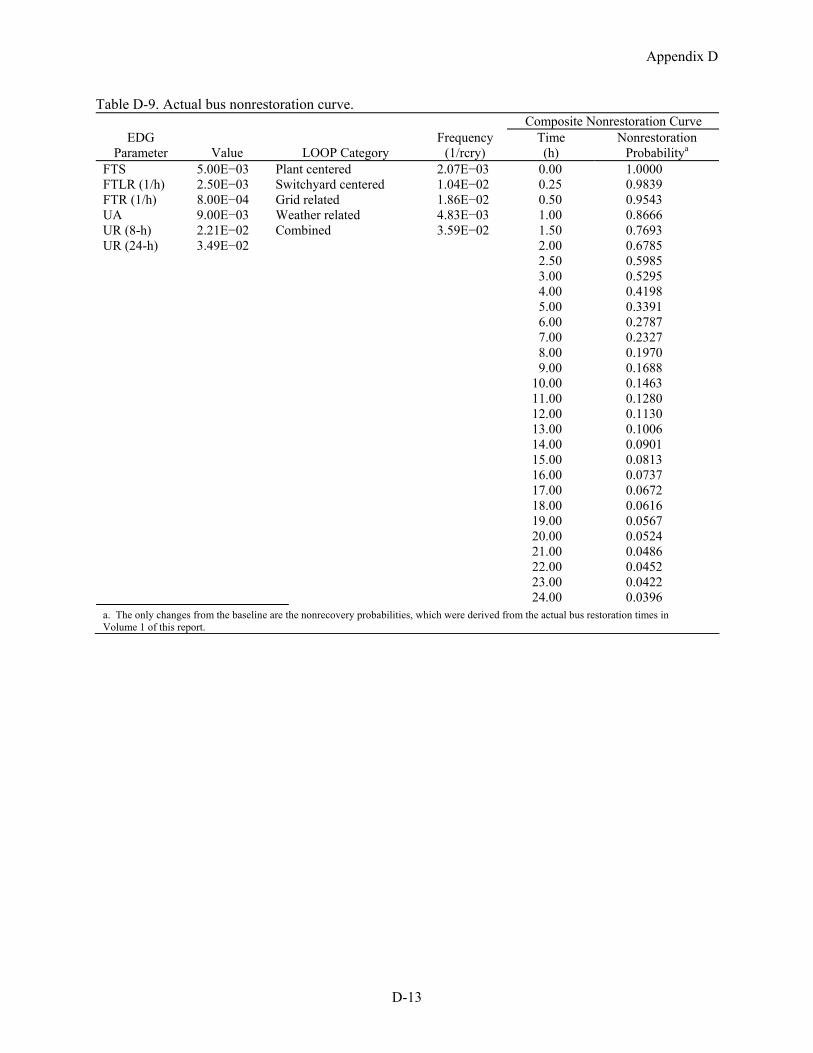
Appendix D
D-13
Table D-9. Actual bus nonrestoration curve. Composite Nonrestoration Curve
EDG Parameter Value LOOP Category
Frequency (1/rcry)
Time (h)
Nonrestoration Probabilitya
FTS 5.00E−03 Plant centered 2.07E−03 0.00 1.0000 FTLR (1/h) 2.50E−03 Switchyard centered 1.04E−02 0.25 0.9839 FTR (1/h) 8.00E−04 Grid related 1.86E−02 0.50 0.9543 UA 9.00E−03 Weather related 4.83E−03 1.00 0.8666 UR (8-h) 2.21E−02 Combined 3.59E−02 1.50 0.7693 UR (24-h) 3.49E−02 2.00 0.6785 2.50 0.5985 3.00 0.5295 4.00 0.4198 5.00 0.3391 6.00 0.2787 7.00 0.2327 8.00 0.1970 9.00 0.1688 10.00 0.1463 11.00 0.1280 12.00 0.1130 13.00 0.1006 14.00 0.0901 15.00 0.0813 16.00 0.0737 17.00 0.0672 18.00 0.0616 19.00 0.0567 20.00 0.0524 21.00 0.0486 22.00 0.0452 23.00 0.0422 24.00 0.0396 a. The only changes from the baseline are the nonrecovery probabilities, which were derived from the actual bus restoration times in Volume 1 of this report.
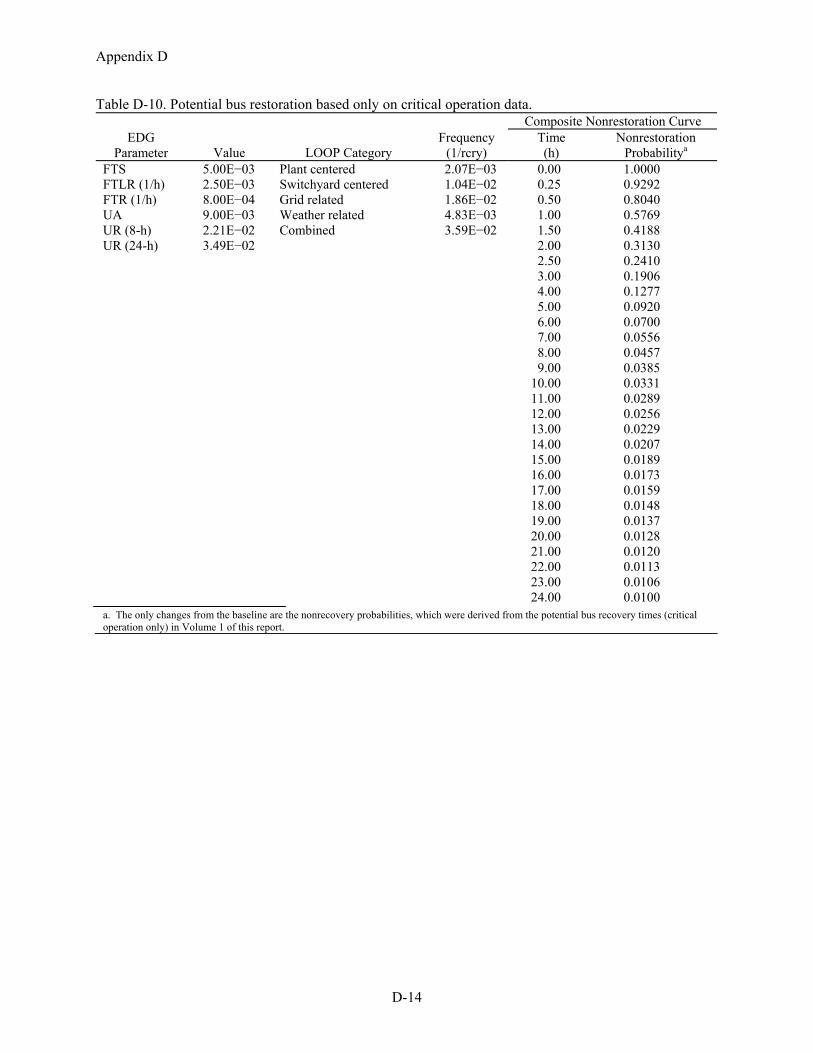
Appendix D
D-14
Table D-10. Potential bus restoration based only on critical operation data. Composite Nonrestoration Curve
EDG Parameter Value LOOP Category
Frequency (1/rcry)
Time (h)
Nonrestoration Probabilitya
FTS 5.00E−03 Plant centered 2.07E−03 0.00 1.0000 FTLR (1/h) 2.50E−03 Switchyard centered 1.04E−02 0.25 0.9292 FTR (1/h) 8.00E−04 Grid related 1.86E−02 0.50 0.8040 UA 9.00E−03 Weather related 4.83E−03 1.00 0.5769 UR (8-h) 2.21E−02 Combined 3.59E−02 1.50 0.4188 UR (24-h) 3.49E−02 2.00 0.3130 2.50 0.2410 3.00 0.1906 4.00 0.1277 5.00 0.0920 6.00 0.0700 7.00 0.0556 8.00 0.0457 9.00 0.0385 10.00 0.0331 11.00 0.0289 12.00 0.0256 13.00 0.0229 14.00 0.0207 15.00 0.0189 16.00 0.0173 17.00 0.0159 18.00 0.0148 19.00 0.0137 20.00 0.0128 21.00 0.0120 22.00 0.0113 23.00 0.0106 24.00 0.0100 a. The only changes from the baseline are the nonrecovery probabilities, which were derived from the potential bus recovery times (critical operation only) in Volume 1 of this report.
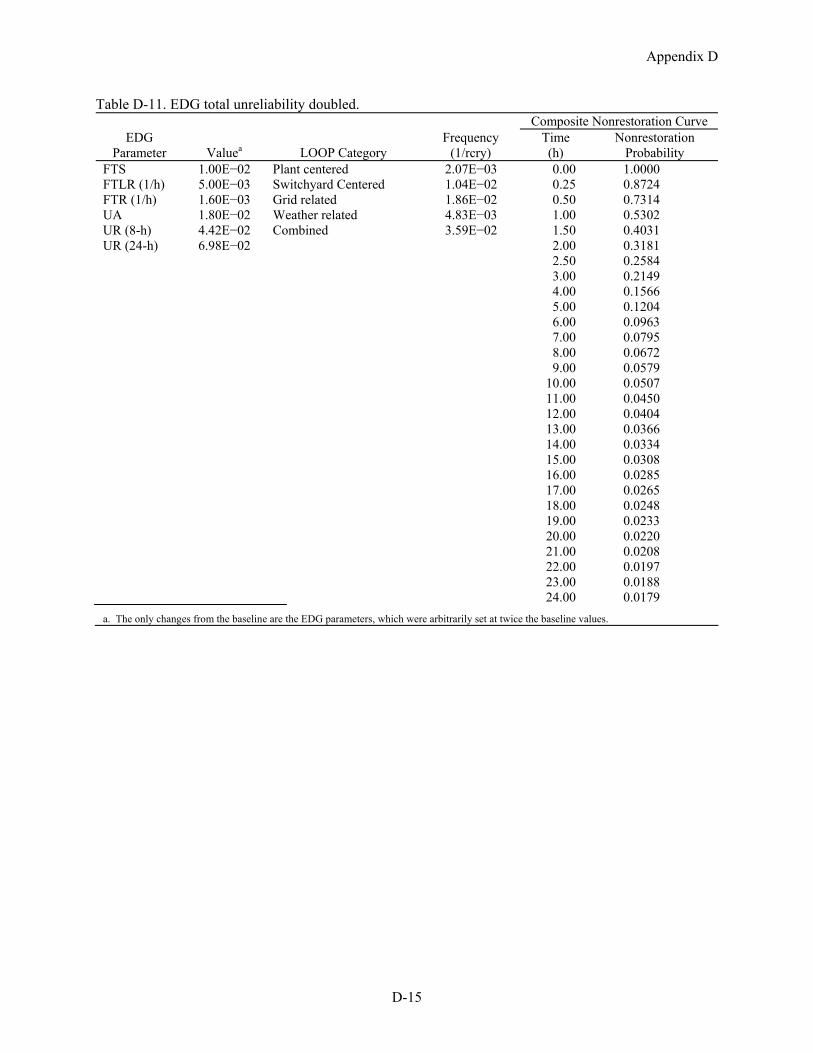
Appendix D
D-15
Table D-11. EDG total unreliability doubled. Composite Nonrestoration Curve
EDG Parameter Valuea LOOP Category
Frequency (1/rcry)
Time (h)
Nonrestoration Probability
FTS 1.00E−02 Plant centered 2.07E−03 0.00 1.0000 FTLR (1/h) 5.00E−03 Switchyard Centered 1.04E−02 0.25 0.8724 FTR (1/h) 1.60E−03 Grid related 1.86E−02 0.50 0.7314 UA 1.80E−02 Weather related 4.83E−03 1.00 0.5302 UR (8-h) 4.42E−02 Combined 3.59E−02 1.50 0.4031 UR (24-h) 6.98E−02 2.00 0.3181 2.50 0.2584 3.00 0.2149 4.00 0.1566 5.00 0.1204 6.00 0.0963 7.00 0.0795 8.00 0.0672 9.00 0.0579 10.00 0.0507 11.00 0.0450 12.00 0.0404 13.00 0.0366 14.00 0.0334 15.00 0.0308 16.00 0.0285 17.00 0.0265 18.00 0.0248 19.00 0.0233 20.00 0.0220 21.00 0.0208 22.00 0.0197 23.00 0.0188 24.00 0.0179 a. The only changes from the baseline are the EDG parameters, which were arbitrarily set at twice the baseline values.
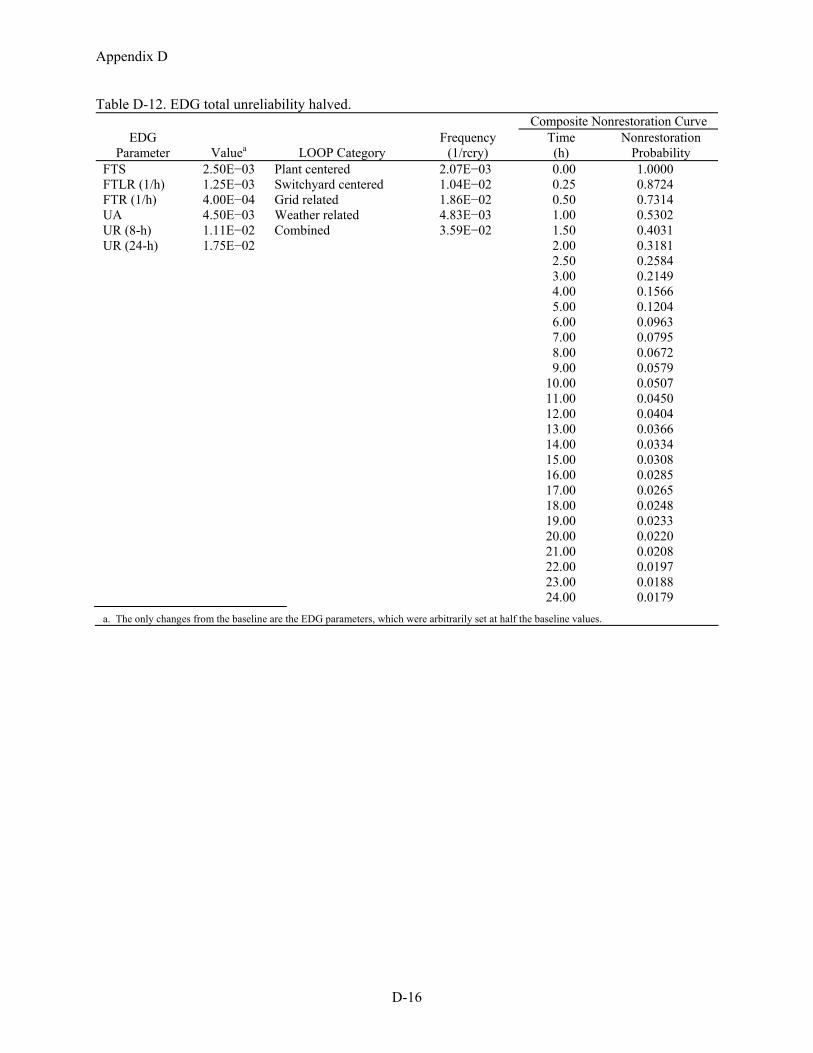
Appendix D
D-16
Table D-12. EDG total unreliability halved. Composite Nonrestoration Curve
EDG Parameter Valuea LOOP Category
Frequency (1/rcry)
Time (h)
Nonrestoration Probability
FTS 2.50E−03 Plant centered 2.07E−03 0.00 1.0000 FTLR (1/h) 1.25E−03 Switchyard centered 1.04E−02 0.25 0.8724 FTR (1/h) 4.00E−04 Grid related 1.86E−02 0.50 0.7314 UA 4.50E−03 Weather related 4.83E−03 1.00 0.5302 UR (8-h) 1.11E−02 Combined 3.59E−02 1.50 0.4031 UR (24-h) 1.75E−02 2.00 0.3181 2.50 0.2584 3.00 0.2149 4.00 0.1566 5.00 0.1204 6.00 0.0963 7.00 0.0795 8.00 0.0672 9.00 0.0579 10.00 0.0507 11.00 0.0450 12.00 0.0404 13.00 0.0366 14.00 0.0334 15.00 0.0308 16.00 0.0285 17.00 0.0265 18.00 0.0248 19.00 0.0233 20.00 0.0220 21.00 0.0208 22.00 0.0197 23.00 0.0188 24.00 0.0179 a. The only changes from the baseline are the EDG parameters, which were arbitrarily set at half the baseline values.
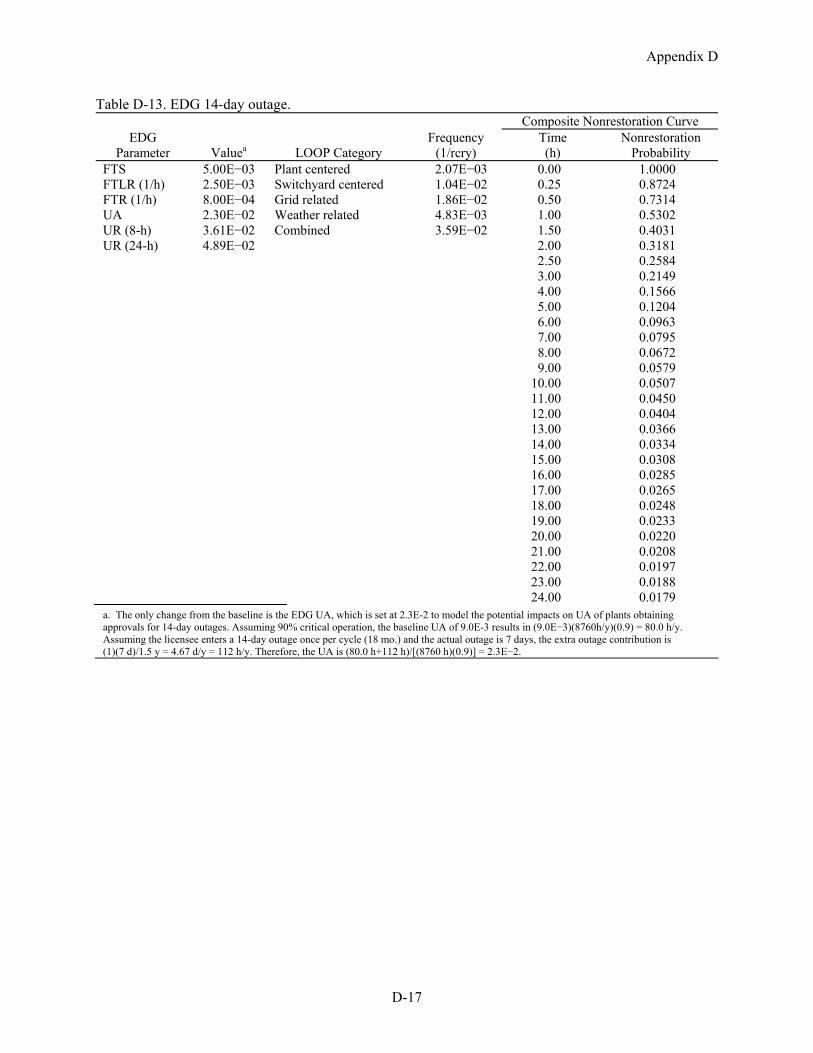
Appendix D
D-17
Table D-13. EDG 14-day outage. Composite Nonrestoration Curve
EDG Parameter Valuea LOOP Category
Frequency (1/rcry)
Time (h)
Nonrestoration Probability
FTS 5.00E−03 Plant centered 2.07E−03 0.00 1.0000 FTLR (1/h) 2.50E−03 Switchyard centered 1.04E−02 0.25 0.8724 FTR (1/h) 8.00E−04 Grid related 1.86E−02 0.50 0.7314 UA 2.30E−02 Weather related 4.83E−03 1.00 0.5302 UR (8-h) 3.61E−02 Combined 3.59E−02 1.50 0.4031 UR (24-h) 4.89E−02 2.00 0.3181 2.50 0.2584 3.00 0.2149 4.00 0.1566 5.00 0.1204 6.00 0.0963 7.00 0.0795 8.00 0.0672 9.00 0.0579 10.00 0.0507 11.00 0.0450 12.00 0.0404 13.00 0.0366 14.00 0.0334 15.00 0.0308 16.00 0.0285 17.00 0.0265 18.00 0.0248 19.00 0.0233 20.00 0.0220 21.00 0.0208 22.00 0.0197 23.00 0.0188 24.00 0.0179 a. The only change from the baseline is the EDG UA, which is set at 2.3E-2 to model the potential impacts on UA of plants obtaining approvals for 14-day outages. Assuming 90% critical operation, the baseline UA of 9.0E-3 results in (9.0E−3)(8760h/y)(0.9) = 80.0 h/y. Assuming the licensee enters a 14-day outage once per cycle (18 mo.) and the actual outage is 7 days, the extra outage contribution is (1)(7 d)/1.5 y = 4.67 d/y = 112 h/y. Therefore, the UA is (80.0 h+112 h)/[(8760 h)(0.9)] = 2.3E−2.
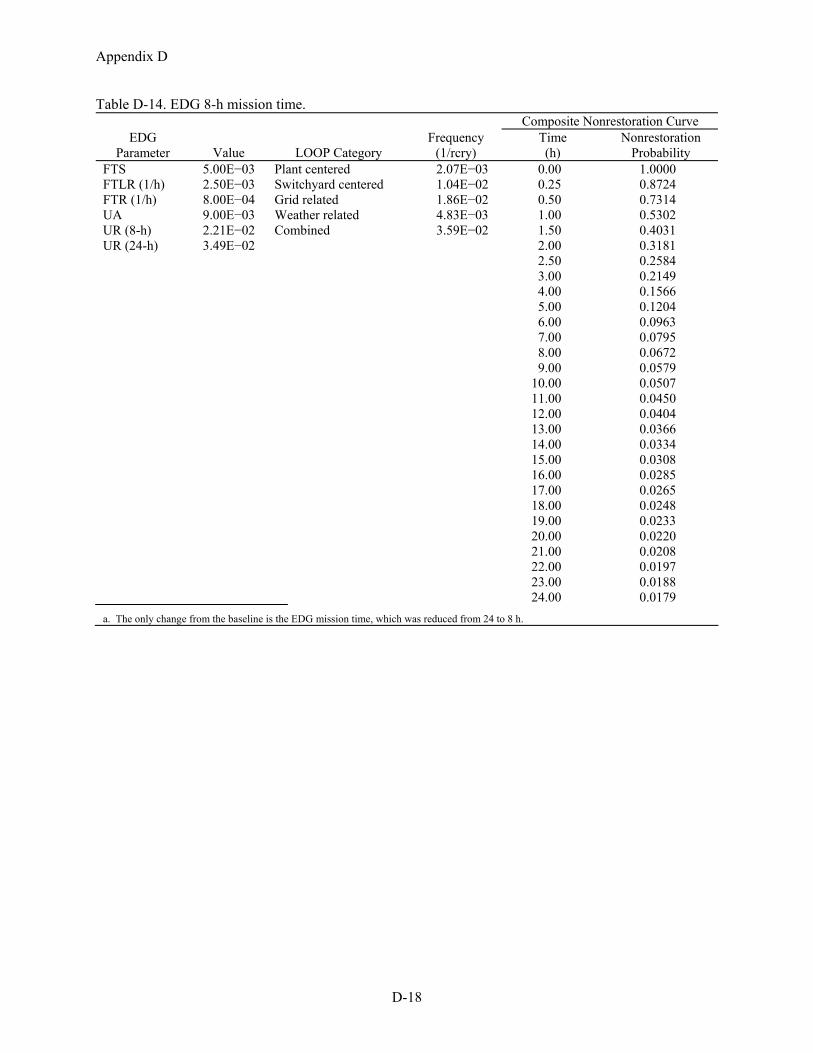
Appendix D
D-18
Table D-14. EDG 8-h mission time. Composite Nonrestoration Curve
EDG Parameter Value LOOP Category
Frequency (1/rcry)
Time (h)
Nonrestoration Probability
FTS 5.00E−03 Plant centered 2.07E−03 0.00 1.0000 FTLR (1/h) 2.50E−03 Switchyard centered 1.04E−02 0.25 0.8724 FTR (1/h) 8.00E−04 Grid related 1.86E−02 0.50 0.7314 UA 9.00E−03 Weather related 4.83E−03 1.00 0.5302 UR (8-h) 2.21E−02 Combined 3.59E−02 1.50 0.4031 UR (24-h) 3.49E−02 2.00 0.3181 2.50 0.2584 3.00 0.2149 4.00 0.1566 5.00 0.1204 6.00 0.0963 7.00 0.0795 8.00 0.0672 9.00 0.0579 10.00 0.0507 11.00 0.0450 12.00 0.0404 13.00 0.0366 14.00 0.0334 15.00 0.0308 16.00 0.0285 17.00 0.0265 18.00 0.0248 19.00 0.0233 20.00 0.0220 21.00 0.0208 22.00 0.0197 23.00 0.0188 24.00 0.0179 a. The only change from the baseline is the EDG mission time, which was reduced from 24 to 8 h.
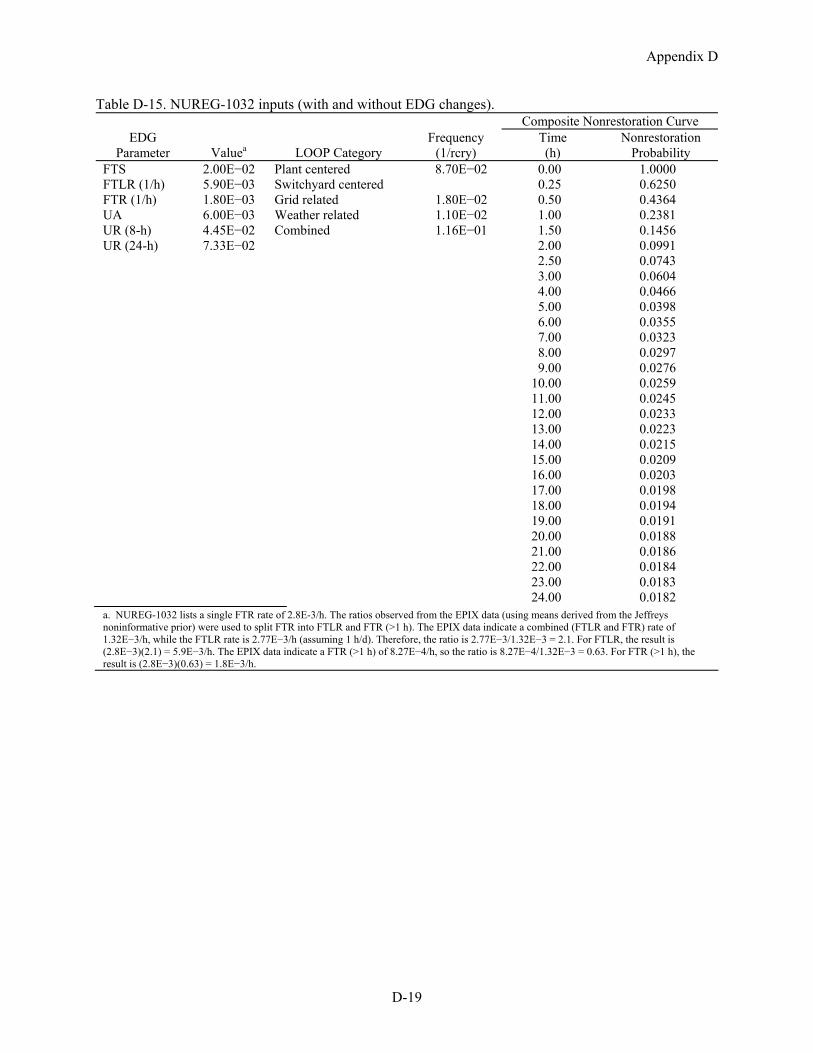
Appendix D
D-19
Table D-15. NUREG-1032 inputs (with and without EDG changes). Composite Nonrestoration Curve
EDG Parameter Valuea LOOP Category
Frequency (1/rcry)
Time (h)
Nonrestoration Probability
FTS 2.00E−02 Plant centered 8.70E−02 0.00 1.0000 FTLR (1/h) 5.90E−03 Switchyard centered 0.25 0.6250 FTR (1/h) 1.80E−03 Grid related 1.80E−02 0.50 0.4364 UA 6.00E−03 Weather related 1.10E−02 1.00 0.2381 UR (8-h) 4.45E−02 Combined 1.16E−01 1.50 0.1456 UR (24-h) 7.33E−02 2.00 0.0991 2.50 0.0743 3.00 0.0604 4.00 0.0466 5.00 0.0398 6.00 0.0355 7.00 0.0323 8.00 0.0297 9.00 0.0276 10.00 0.0259 11.00 0.0245 12.00 0.0233 13.00 0.0223 14.00 0.0215 15.00 0.0209 16.00 0.0203 17.00 0.0198 18.00 0.0194 19.00 0.0191 20.00 0.0188 21.00 0.0186 22.00 0.0184 23.00 0.0183 24.00 0.0182 a. NUREG-1032 lists a single FTR rate of 2.8E-3/h. The ratios observed from the EPIX data (using means derived from the Jeffreys noninformative prior) were used to split FTR into FTLR and FTR (>1 h). The EPIX data indicate a combined (FTLR and FTR) rate of 1.32E−3/h, while the FTLR rate is 2.77E−3/h (assuming 1 h/d). Therefore, the ratio is 2.77E−3/1.32E−3 = 2.1. For FTLR, the result is (2.8E−3)(2.1) = 5.9E−3/h. The EPIX data indicate a FTR (>1 h) of 8.27E−4/h, so the ratio is 8.27E−4/1.32E−3 = 0.63. For FTR (>1 h), the result is (2.8E−3)(0.63) = 1.8E−3/h.
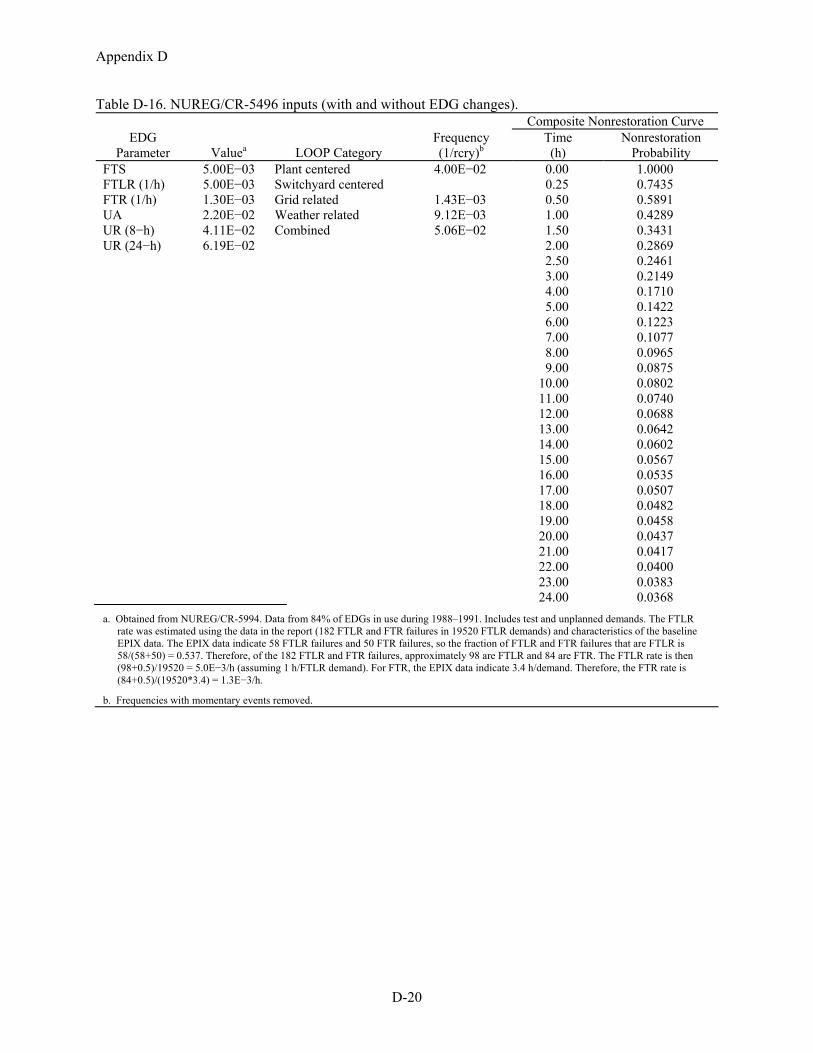
Appendix D
D-20
Table D-16. NUREG/CR-5496 inputs (with and without EDG changes). Composite Nonrestoration Curve
EDG Parameter Valuea LOOP Category
Frequency (1/rcry)b
Time (h)
Nonrestoration Probability
FTS 5.00E−03 Plant centered 4.00E−02 0.00 1.0000 FTLR (1/h) 5.00E−03 Switchyard centered 0.25 0.7435 FTR (1/h) 1.30E−03 Grid related 1.43E−03 0.50 0.5891 UA 2.20E−02 Weather related 9.12E−03 1.00 0.4289 UR (8−h) 4.11E−02 Combined 5.06E−02 1.50 0.3431 UR (24−h) 6.19E−02 2.00 0.2869 2.50 0.2461 3.00 0.2149 4.00 0.1710 5.00 0.1422 6.00 0.1223 7.00 0.1077 8.00 0.0965 9.00 0.0875 10.00 0.0802 11.00 0.0740 12.00 0.0688 13.00 0.0642 14.00 0.0602 15.00 0.0567 16.00 0.0535 17.00 0.0507 18.00 0.0482 19.00 0.0458 20.00 0.0437 21.00 0.0417 22.00 0.0400 23.00 0.0383 24.00 0.0368 a. Obtained from NUREG/CR-5994. Data from 84% of EDGs in use during 1988–1991. Includes test and unplanned demands. The FTLR
rate was estimated using the data in the report (182 FTLR and FTR failures in 19520 FTLR demands) and characteristics of the baseline EPIX data. The EPIX data indicate 58 FTLR failures and 50 FTR failures, so the fraction of FTLR and FTR failures that are FTLR is 58/(58+50) = 0.537. Therefore, of the 182 FTLR and FTR failures, approximately 98 are FTLR and 84 are FTR. The FTLR rate is then (98+0.5)/19520 = 5.0E−3/h (assuming 1 h/FTLR demand). For FTR, the EPIX data indicate 3.4 h/demand. Therefore, the FTR rate is (84+0.5)/(19520*3.4) = 1.3E−3/h.
b. Frequencies with momentary events removed.
Appendix E
E−1
Appendix E
Plant-Specific Station Blackout Results Using Plant-Specific Loss of Offsite
Power Frequencies

Appendix E
E−2
Appendix E
E−3
CONTENTS
TABLES
E−1. Summary of plant-specific LOOP, SBO, and Total CDF results .................................................. E−5
E−2. Plant-specific LOOP category frequencies.................................................................................... E−5
E−3. Plant-specific LOOP, SBO, and Total CDF results....................................................................... E−9
E−4. Plant-specific CDF and SBO uncertainties ................................................................................. E−13

Appendix E
E−4
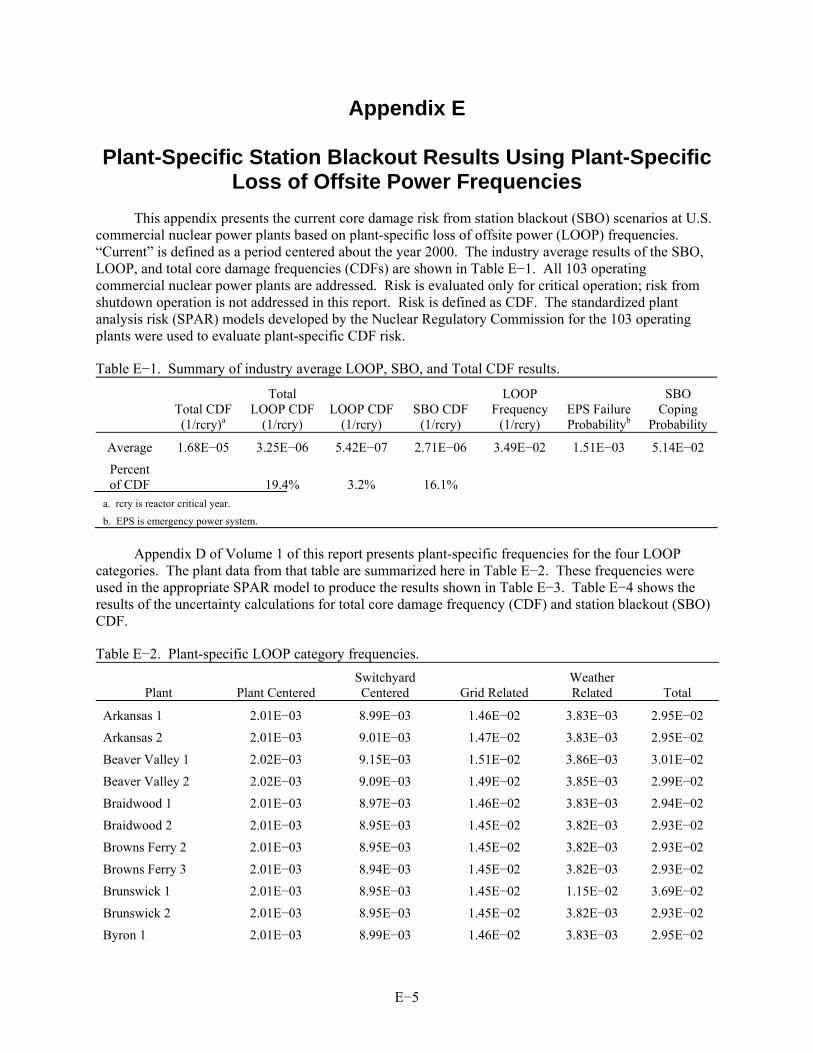
E−5
Appendix E
Plant-Specific Station Blackout Results Using Plant-Specific Loss of Offsite Power Frequencies
This appendix presents the current core damage risk from station blackout (SBO) scenarios at U.S. commercial nuclear power plants based on plant-specific loss of offsite power (LOOP) frequencies. “Current” is defined as a period centered about the year 2000. The industry average results of the SBO, LOOP, and total core damage frequencies (CDFs) are shown in Table E−1. All 103 operating commercial nuclear power plants are addressed. Risk is evaluated only for critical operation; risk from shutdown operation is not addressed in this report. Risk is defined as CDF. The standardized plant analysis risk (SPAR) models developed by the Nuclear Regulatory Commission for the 103 operating plants were used to evaluate plant-specific CDF risk.
Table E−1. Summary of industry average LOOP, SBO, and Total CDF results.
Total CDF (1/rcry)a
Total LOOP CDF
(1/rcry) LOOP CDF
(1/rcry) SBO CDF
(1/rcry)
LOOP Frequency
(1/rcry) EPS Failure Probabilityb
SBO Coping
Probability
Average 1.68E−05 3.25E−06 5.42E−07 2.71E−06 3.49E−02 1.51E−03 5.14E−02
Percent of CDF 19.4% 3.2% 16.1%
a. rcry is reactor critical year.
b. EPS is emergency power system.
Appendix D of Volume 1 of this report presents plant-specific frequencies for the four LOOP categories. The plant data from that table are summarized here in Table E−2. These frequencies were used in the appropriate SPAR model to produce the results shown in Table E−3. Table E−4 shows the results of the uncertainty calculations for total core damage frequency (CDF) and station blackout (SBO) CDF.
Table E−2. Plant-specific LOOP category frequencies.
Plant Plant Centered Switchyard Centered Grid Related
Weather Related Total
Arkansas 1 2.01E−03 8.99E−03 1.46E−02 3.83E−03 2.95E−02
Arkansas 2 2.01E−03 9.01E−03 1.47E−02 3.83E−03 2.95E−02
Beaver Valley 1 2.02E−03 9.15E−03 1.51E−02 3.86E−03 3.01E−02
Beaver Valley 2 2.02E−03 9.09E−03 1.49E−02 3.85E−03 2.99E−02
Braidwood 1 2.01E−03 8.97E−03 1.46E−02 3.83E−03 2.94E−02
Braidwood 2 2.01E−03 8.95E−03 1.45E−02 3.82E−03 2.93E−02
Browns Ferry 2 2.01E−03 8.95E−03 1.45E−02 3.82E−03 2.93E−02
Browns Ferry 3 2.01E−03 8.94E−03 1.45E−02 3.82E−03 2.93E−02
Brunswick 1 2.01E−03 8.95E−03 1.45E−02 1.15E−02 3.69E−02
Brunswick 2 2.01E−03 8.95E−03 1.45E−02 3.82E−03 2.93E−02
Byron 1 2.01E−03 8.99E−03 1.46E−02 3.83E−03 2.95E−02
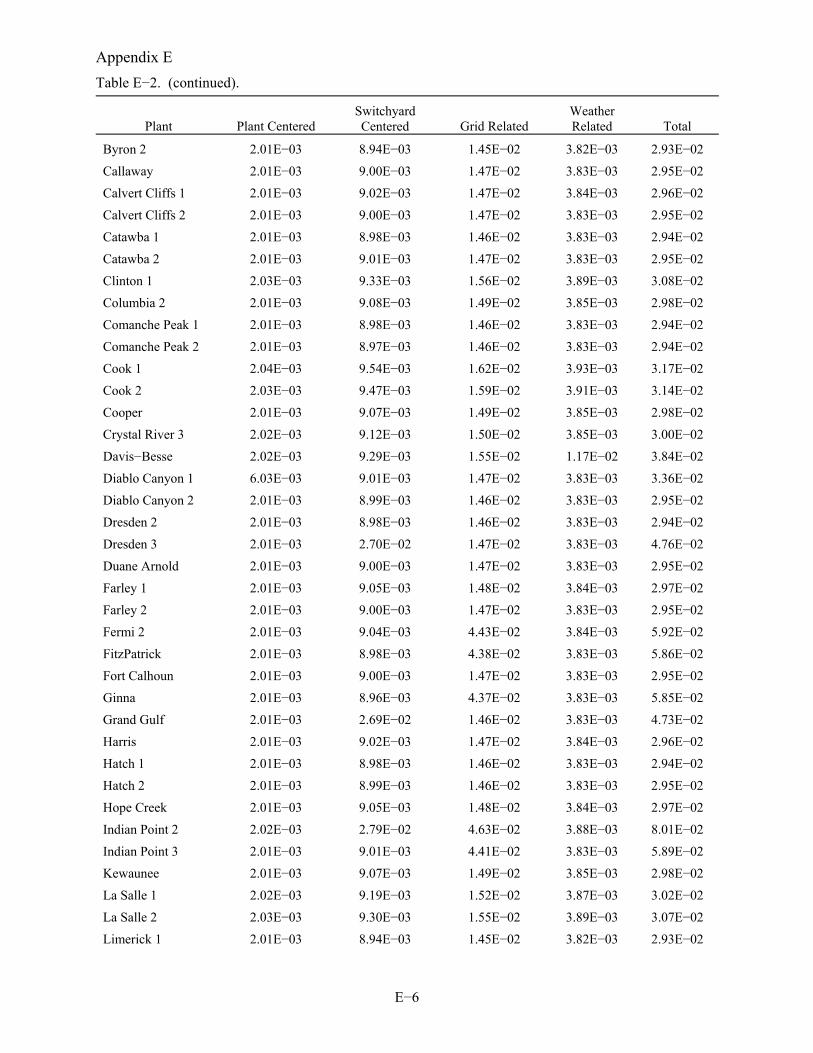
Appendix E Table E−2. (continued).
E−6
Plant Plant Centered Switchyard Centered Grid Related
Weather Related Total
Byron 2 2.01E−03 8.94E−03 1.45E−02 3.82E−03 2.93E−02
Callaway 2.01E−03 9.00E−03 1.47E−02 3.83E−03 2.95E−02
Calvert Cliffs 1 2.01E−03 9.02E−03 1.47E−02 3.84E−03 2.96E−02
Calvert Cliffs 2 2.01E−03 9.00E−03 1.47E−02 3.83E−03 2.95E−02
Catawba 1 2.01E−03 8.98E−03 1.46E−02 3.83E−03 2.94E−02
Catawba 2 2.01E−03 9.01E−03 1.47E−02 3.83E−03 2.95E−02
Clinton 1 2.03E−03 9.33E−03 1.56E−02 3.89E−03 3.08E−02
Columbia 2 2.01E−03 9.08E−03 1.49E−02 3.85E−03 2.98E−02
Comanche Peak 1 2.01E−03 8.98E−03 1.46E−02 3.83E−03 2.94E−02
Comanche Peak 2 2.01E−03 8.97E−03 1.46E−02 3.83E−03 2.94E−02
Cook 1 2.04E−03 9.54E−03 1.62E−02 3.93E−03 3.17E−02
Cook 2 2.03E−03 9.47E−03 1.59E−02 3.91E−03 3.14E−02
Cooper 2.01E−03 9.07E−03 1.49E−02 3.85E−03 2.98E−02
Crystal River 3 2.02E−03 9.12E−03 1.50E−02 3.85E−03 3.00E−02
Davis−Besse 2.02E−03 9.29E−03 1.55E−02 1.17E−02 3.84E−02
Diablo Canyon 1 6.03E−03 9.01E−03 1.47E−02 3.83E−03 3.36E−02
Diablo Canyon 2 2.01E−03 8.99E−03 1.46E−02 3.83E−03 2.95E−02
Dresden 2 2.01E−03 8.98E−03 1.46E−02 3.83E−03 2.94E−02
Dresden 3 2.01E−03 2.70E−02 1.47E−02 3.83E−03 4.76E−02
Duane Arnold 2.01E−03 9.00E−03 1.47E−02 3.83E−03 2.95E−02
Farley 1 2.01E−03 9.05E−03 1.48E−02 3.84E−03 2.97E−02
Farley 2 2.01E−03 9.00E−03 1.47E−02 3.83E−03 2.95E−02
Fermi 2 2.01E−03 9.04E−03 4.43E−02 3.84E−03 5.92E−02
FitzPatrick 2.01E−03 8.98E−03 4.38E−02 3.83E−03 5.86E−02
Fort Calhoun 2.01E−03 9.00E−03 1.47E−02 3.83E−03 2.95E−02
Ginna 2.01E−03 8.96E−03 4.37E−02 3.83E−03 5.85E−02
Grand Gulf 2.01E−03 2.69E−02 1.46E−02 3.83E−03 4.73E−02
Harris 2.01E−03 9.02E−03 1.47E−02 3.84E−03 2.96E−02
Hatch 1 2.01E−03 8.98E−03 1.46E−02 3.83E−03 2.94E−02
Hatch 2 2.01E−03 8.99E−03 1.46E−02 3.83E−03 2.95E−02
Hope Creek 2.01E−03 9.05E−03 1.48E−02 3.84E−03 2.97E−02
Indian Point 2 2.02E−03 2.79E−02 4.63E−02 3.88E−03 8.01E−02
Indian Point 3 2.01E−03 9.01E−03 4.41E−02 3.83E−03 5.89E−02
Kewaunee 2.01E−03 9.07E−03 1.49E−02 3.85E−03 2.98E−02
La Salle 1 2.02E−03 9.19E−03 1.52E−02 3.87E−03 3.02E−02
La Salle 2 2.03E−03 9.30E−03 1.55E−02 3.89E−03 3.07E−02
Limerick 1 2.01E−03 8.94E−03 1.45E−02 3.82E−03 2.93E−02
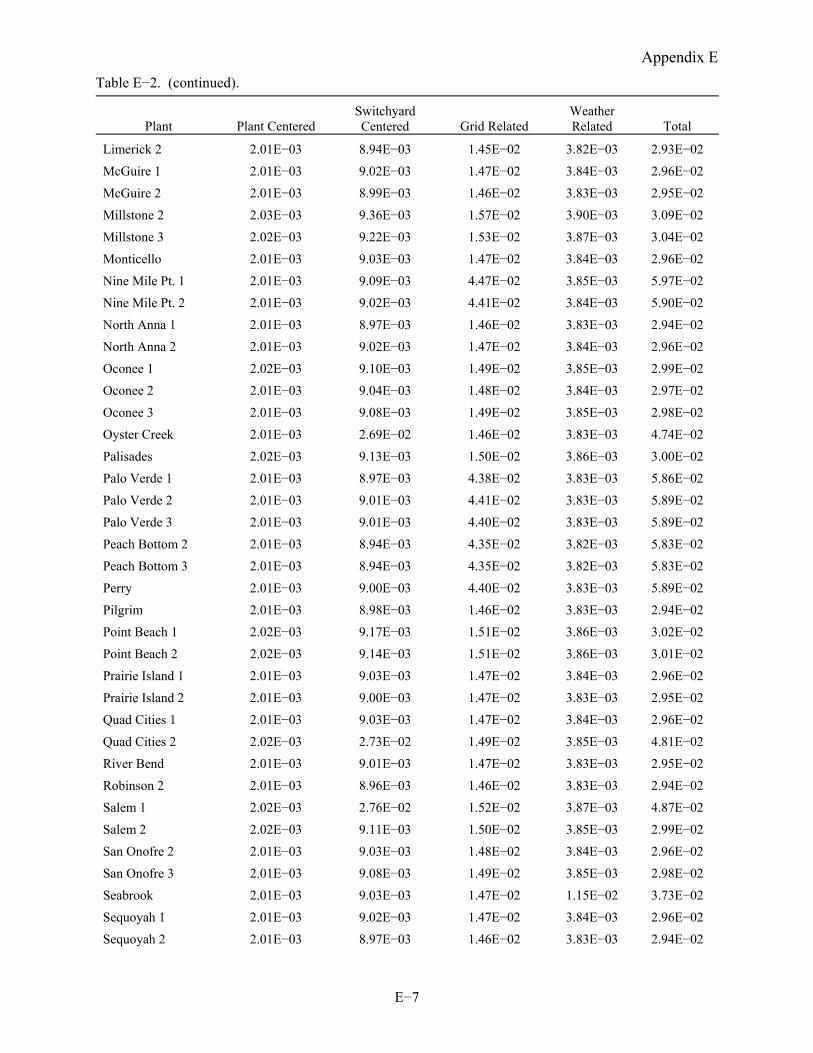
Appendix E Table E−2. (continued).
E−7
Plant Plant Centered Switchyard Centered Grid Related
Weather Related Total
Limerick 2 2.01E−03 8.94E−03 1.45E−02 3.82E−03 2.93E−02
McGuire 1 2.01E−03 9.02E−03 1.47E−02 3.84E−03 2.96E−02
McGuire 2 2.01E−03 8.99E−03 1.46E−02 3.83E−03 2.95E−02
Millstone 2 2.03E−03 9.36E−03 1.57E−02 3.90E−03 3.09E−02
Millstone 3 2.02E−03 9.22E−03 1.53E−02 3.87E−03 3.04E−02
Monticello 2.01E−03 9.03E−03 1.47E−02 3.84E−03 2.96E−02
Nine Mile Pt. 1 2.01E−03 9.09E−03 4.47E−02 3.85E−03 5.97E−02
Nine Mile Pt. 2 2.01E−03 9.02E−03 4.41E−02 3.84E−03 5.90E−02
North Anna 1 2.01E−03 8.97E−03 1.46E−02 3.83E−03 2.94E−02
North Anna 2 2.01E−03 9.02E−03 1.47E−02 3.84E−03 2.96E−02
Oconee 1 2.02E−03 9.10E−03 1.49E−02 3.85E−03 2.99E−02
Oconee 2 2.01E−03 9.04E−03 1.48E−02 3.84E−03 2.97E−02
Oconee 3 2.01E−03 9.08E−03 1.49E−02 3.85E−03 2.98E−02
Oyster Creek 2.01E−03 2.69E−02 1.46E−02 3.83E−03 4.74E−02
Palisades 2.02E−03 9.13E−03 1.50E−02 3.86E−03 3.00E−02
Palo Verde 1 2.01E−03 8.97E−03 4.38E−02 3.83E−03 5.86E−02
Palo Verde 2 2.01E−03 9.01E−03 4.41E−02 3.83E−03 5.89E−02
Palo Verde 3 2.01E−03 9.01E−03 4.40E−02 3.83E−03 5.89E−02
Peach Bottom 2 2.01E−03 8.94E−03 4.35E−02 3.82E−03 5.83E−02
Peach Bottom 3 2.01E−03 8.94E−03 4.35E−02 3.82E−03 5.83E−02
Perry 2.01E−03 9.00E−03 4.40E−02 3.83E−03 5.89E−02
Pilgrim 2.01E−03 8.98E−03 1.46E−02 3.83E−03 2.94E−02
Point Beach 1 2.02E−03 9.17E−03 1.51E−02 3.86E−03 3.02E−02
Point Beach 2 2.02E−03 9.14E−03 1.51E−02 3.86E−03 3.01E−02
Prairie Island 1 2.01E−03 9.03E−03 1.47E−02 3.84E−03 2.96E−02
Prairie Island 2 2.01E−03 9.00E−03 1.47E−02 3.83E−03 2.95E−02
Quad Cities 1 2.01E−03 9.03E−03 1.47E−02 3.84E−03 2.96E−02
Quad Cities 2 2.02E−03 2.73E−02 1.49E−02 3.85E−03 4.81E−02
River Bend 2.01E−03 9.01E−03 1.47E−02 3.83E−03 2.95E−02
Robinson 2 2.01E−03 8.96E−03 1.46E−02 3.83E−03 2.94E−02
Salem 1 2.02E−03 2.76E−02 1.52E−02 3.87E−03 4.87E−02
Salem 2 2.02E−03 9.11E−03 1.50E−02 3.85E−03 2.99E−02
San Onofre 2 2.01E−03 9.03E−03 1.48E−02 3.84E−03 2.96E−02
San Onofre 3 2.01E−03 9.08E−03 1.49E−02 3.85E−03 2.98E−02
Seabrook 2.01E−03 9.03E−03 1.47E−02 1.15E−02 3.73E−02
Sequoyah 1 2.01E−03 9.02E−03 1.47E−02 3.84E−03 2.96E−02
Sequoyah 2 2.01E−03 8.97E−03 1.46E−02 3.83E−03 2.94E−02
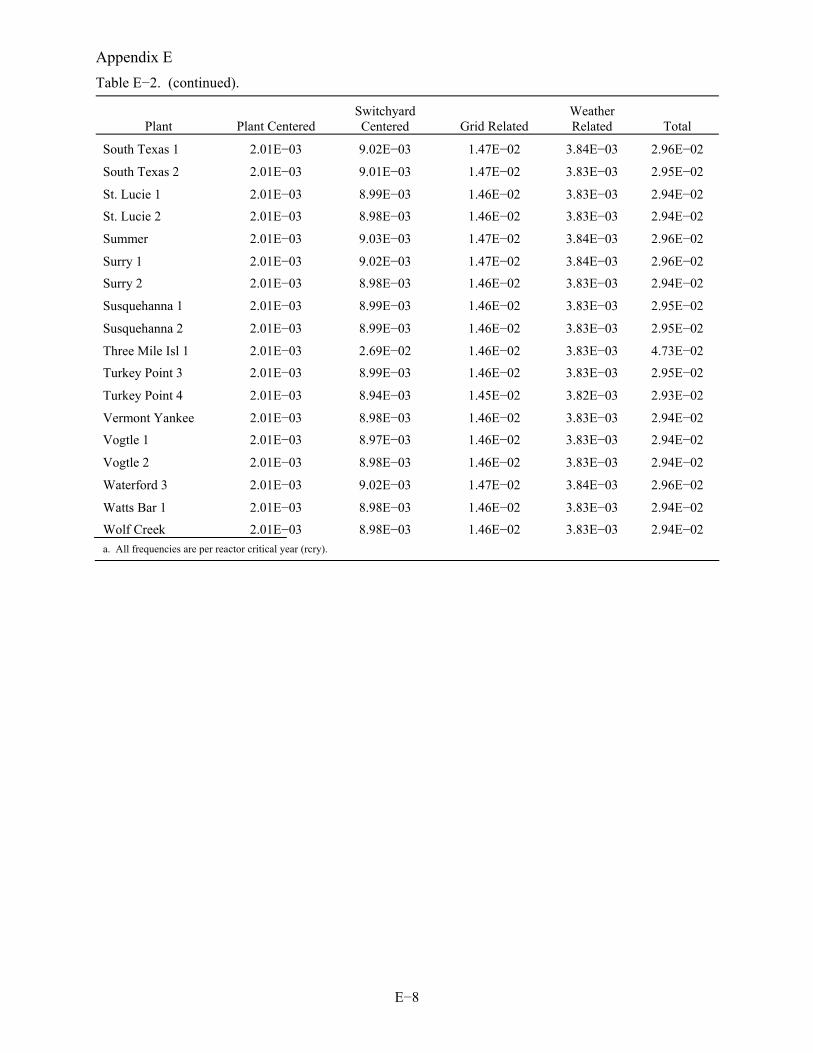
Appendix E Table E−2. (continued).
E−8
Plant Plant Centered Switchyard Centered Grid Related
Weather Related Total
South Texas 1 2.01E−03 9.02E−03 1.47E−02 3.84E−03 2.96E−02
South Texas 2 2.01E−03 9.01E−03 1.47E−02 3.83E−03 2.95E−02
St. Lucie 1 2.01E−03 8.99E−03 1.46E−02 3.83E−03 2.94E−02
St. Lucie 2 2.01E−03 8.98E−03 1.46E−02 3.83E−03 2.94E−02
Summer 2.01E−03 9.03E−03 1.47E−02 3.84E−03 2.96E−02
Surry 1 2.01E−03 9.02E−03 1.47E−02 3.84E−03 2.96E−02
Surry 2 2.01E−03 8.98E−03 1.46E−02 3.83E−03 2.94E−02
Susquehanna 1 2.01E−03 8.99E−03 1.46E−02 3.83E−03 2.95E−02
Susquehanna 2 2.01E−03 8.99E−03 1.46E−02 3.83E−03 2.95E−02
Three Mile Isl 1 2.01E−03 2.69E−02 1.46E−02 3.83E−03 4.73E−02
Turkey Point 3 2.01E−03 8.99E−03 1.46E−02 3.83E−03 2.95E−02
Turkey Point 4 2.01E−03 8.94E−03 1.45E−02 3.82E−03 2.93E−02
Vermont Yankee 2.01E−03 8.98E−03 1.46E−02 3.83E−03 2.94E−02
Vogtle 1 2.01E−03 8.97E−03 1.46E−02 3.83E−03 2.94E−02
Vogtle 2 2.01E−03 8.98E−03 1.46E−02 3.83E−03 2.94E−02
Waterford 3 2.01E−03 9.02E−03 1.47E−02 3.84E−03 2.96E−02
Watts Bar 1 2.01E−03 8.98E−03 1.46E−02 3.83E−03 2.94E−02
Wolf Creek 2.01E−03 8.98E−03 1.46E−02 3.83E−03 2.94E−02 a. All frequencies are per reactor critical year (rcry).
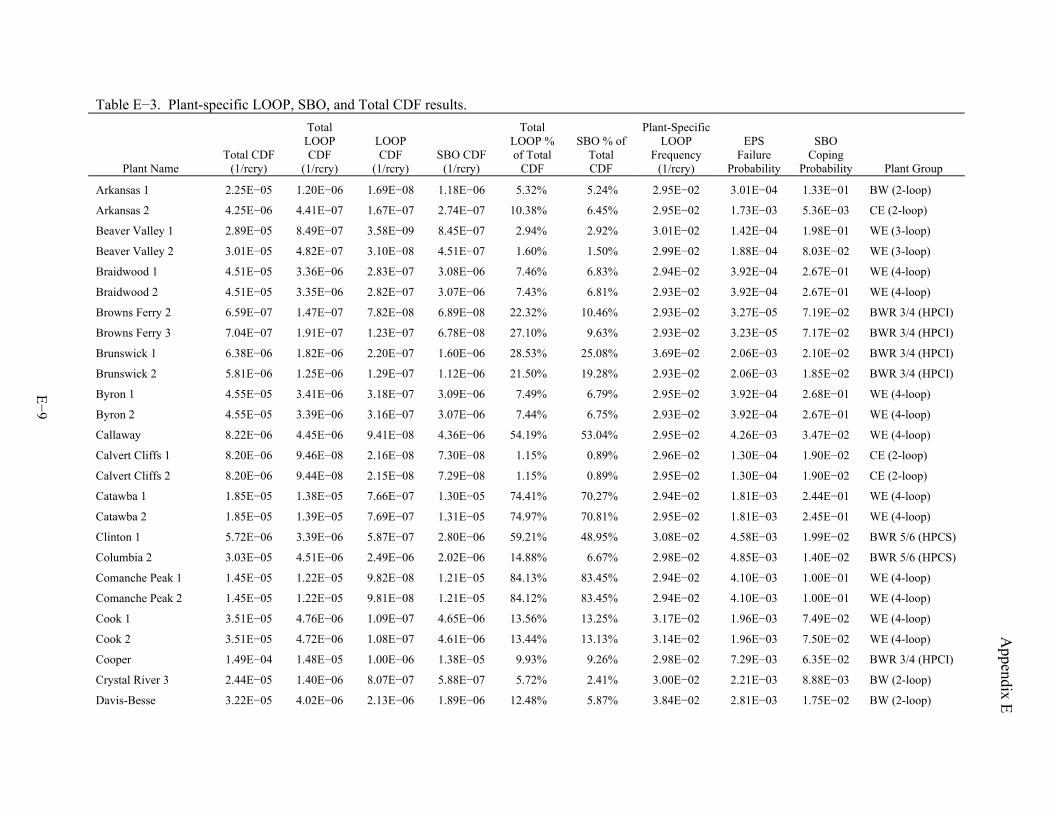
Appendix E
E−9
Table E−3. Plant-specific LOOP, SBO, and Total CDF results.
Plant Name Total CDF
(1/rcry)
Total LOOP CDF
(1/rcry)
LOOP CDF
(1/rcry) SBO CDF
(1/rcry)
Total LOOP % of Total
CDF
SBO % of Total CDF
Plant-Specific LOOP
Frequency (1/rcry)
EPS Failure
Probability
SBO Coping
Probability Plant Group
Arkansas 1 2.25E−05 1.20E−06 1.69E−08 1.18E−06 5.32% 5.24% 2.95E−02 3.01E−04 1.33E−01 BW (2-loop)
Arkansas 2 4.25E−06 4.41E−07 1.67E−07 2.74E−07 10.38% 6.45% 2.95E−02 1.73E−03 5.36E−03 CE (2-loop)
Beaver Valley 1 2.89E−05 8.49E−07 3.58E−09 8.45E−07 2.94% 2.92% 3.01E−02 1.42E−04 1.98E−01 WE (3-loop)
Beaver Valley 2 3.01E−05 4.82E−07 3.10E−08 4.51E−07 1.60% 1.50% 2.99E−02 1.88E−04 8.03E−02 WE (3-loop)
Braidwood 1 4.51E−05 3.36E−06 2.83E−07 3.08E−06 7.46% 6.83% 2.94E−02 3.92E−04 2.67E−01 WE (4-loop)
Braidwood 2 4.51E−05 3.35E−06 2.82E−07 3.07E−06 7.43% 6.81% 2.93E−02 3.92E−04 2.67E−01 WE (4-loop)
Browns Ferry 2 6.59E−07 1.47E−07 7.82E−08 6.89E−08 22.32% 10.46% 2.93E−02 3.27E−05 7.19E−02 BWR 3/4 (HPCI)
Browns Ferry 3 7.04E−07 1.91E−07 1.23E−07 6.78E−08 27.10% 9.63% 2.93E−02 3.23E−05 7.17E−02 BWR 3/4 (HPCI)
Brunswick 1 6.38E−06 1.82E−06 2.20E−07 1.60E−06 28.53% 25.08% 3.69E−02 2.06E−03 2.10E−02 BWR 3/4 (HPCI)
Brunswick 2 5.81E−06 1.25E−06 1.29E−07 1.12E−06 21.50% 19.28% 2.93E−02 2.06E−03 1.85E−02 BWR 3/4 (HPCI)
Byron 1 4.55E−05 3.41E−06 3.18E−07 3.09E−06 7.49% 6.79% 2.95E−02 3.92E−04 2.68E−01 WE (4-loop)
Byron 2 4.55E−05 3.39E−06 3.16E−07 3.07E−06 7.44% 6.75% 2.93E−02 3.92E−04 2.67E−01 WE (4-loop)
Callaway 8.22E−06 4.45E−06 9.41E−08 4.36E−06 54.19% 53.04% 2.95E−02 4.26E−03 3.47E−02 WE (4-loop)
Calvert Cliffs 1 8.20E−06 9.46E−08 2.16E−08 7.30E−08 1.15% 0.89% 2.96E−02 1.30E−04 1.90E−02 CE (2-loop)
Calvert Cliffs 2 8.20E−06 9.44E−08 2.15E−08 7.29E−08 1.15% 0.89% 2.95E−02 1.30E−04 1.90E−02 CE (2-loop)
Catawba 1 1.85E−05 1.38E−05 7.66E−07 1.30E−05 74.41% 70.27% 2.94E−02 1.81E−03 2.44E−01 WE (4-loop)
Catawba 2 1.85E−05 1.39E−05 7.69E−07 1.31E−05 74.97% 70.81% 2.95E−02 1.81E−03 2.45E−01 WE (4-loop)
Clinton 1 5.72E−06 3.39E−06 5.87E−07 2.80E−06 59.21% 48.95% 3.08E−02 4.58E−03 1.99E−02 BWR 5/6 (HPCS)
Columbia 2 3.03E−05 4.51E−06 2.49E−06 2.02E−06 14.88% 6.67% 2.98E−02 4.85E−03 1.40E−02 BWR 5/6 (HPCS)
Comanche Peak 1 1.45E−05 1.22E−05 9.82E−08 1.21E−05 84.13% 83.45% 2.94E−02 4.10E−03 1.00E−01 WE (4-loop)
Comanche Peak 2 1.45E−05 1.22E−05 9.81E−08 1.21E−05 84.12% 83.45% 2.94E−02 4.10E−03 1.00E−01 WE (4-loop)
Cook 1 3.51E−05 4.76E−06 1.09E−07 4.65E−06 13.56% 13.25% 3.17E−02 1.96E−03 7.49E−02 WE (4-loop)
Cook 2 3.51E−05 4.72E−06 1.08E−07 4.61E−06 13.44% 13.13% 3.14E−02 1.96E−03 7.50E−02 WE (4-loop)
Cooper 1.49E−04 1.48E−05 1.00E−06 1.38E−05 9.93% 9.26% 2.98E−02 7.29E−03 6.35E−02 BWR 3/4 (HPCI)
Crystal River 3 2.44E−05 1.40E−06 8.07E−07 5.88E−07 5.72% 2.41% 3.00E−02 2.21E−03 8.88E−03 BW (2-loop)
Davis-Besse 3.22E−05 4.02E−06 2.13E−06 1.89E−06 12.48% 5.87% 3.84E−02 2.81E−03 1.75E−02 BW (2-loop)
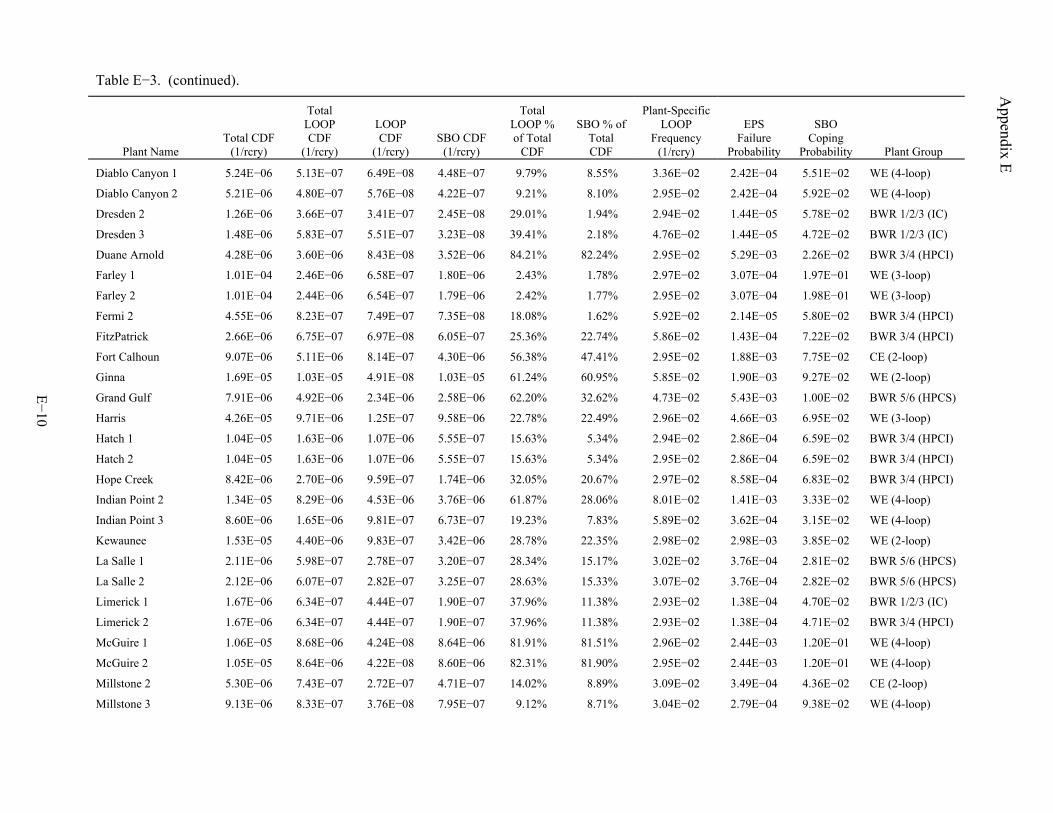
Appendix E
Table E−3. (continued).
E−10
Plant Name Total CDF
(1/rcry)
Total LOOP CDF
(1/rcry)
LOOP CDF
(1/rcry) SBO CDF
(1/rcry)
Total LOOP % of Total
CDF
SBO % of Total CDF
Plant-Specific LOOP
Frequency (1/rcry)
EPS Failure
Probability
SBO Coping
Probability Plant Group
Diablo Canyon 1 5.24E−06 5.13E−07 6.49E−08 4.48E−07 9.79% 8.55% 3.36E−02 2.42E−04 5.51E−02 WE (4-loop)
Diablo Canyon 2 5.21E−06 4.80E−07 5.76E−08 4.22E−07 9.21% 8.10% 2.95E−02 2.42E−04 5.92E−02 WE (4-loop)
Dresden 2 1.26E−06 3.66E−07 3.41E−07 2.45E−08 29.01% 1.94% 2.94E−02 1.44E−05 5.78E−02 BWR 1/2/3 (IC)
Dresden 3 1.48E−06 5.83E−07 5.51E−07 3.23E−08 39.41% 2.18% 4.76E−02 1.44E−05 4.72E−02 BWR 1/2/3 (IC)
Duane Arnold 4.28E−06 3.60E−06 8.43E−08 3.52E−06 84.21% 82.24% 2.95E−02 5.29E−03 2.26E−02 BWR 3/4 (HPCI)
Farley 1 1.01E−04 2.46E−06 6.58E−07 1.80E−06 2.43% 1.78% 2.97E−02 3.07E−04 1.97E−01 WE (3-loop)
Farley 2 1.01E−04 2.44E−06 6.54E−07 1.79E−06 2.42% 1.77% 2.95E−02 3.07E−04 1.98E−01 WE (3-loop)
Fermi 2 4.55E−06 8.23E−07 7.49E−07 7.35E−08 18.08% 1.62% 5.92E−02 2.14E−05 5.80E−02 BWR 3/4 (HPCI)
FitzPatrick 2.66E−06 6.75E−07 6.97E−08 6.05E−07 25.36% 22.74% 5.86E−02 1.43E−04 7.22E−02 BWR 3/4 (HPCI)
Fort Calhoun 9.07E−06 5.11E−06 8.14E−07 4.30E−06 56.38% 47.41% 2.95E−02 1.88E−03 7.75E−02 CE (2-loop)
Ginna 1.69E−05 1.03E−05 4.91E−08 1.03E−05 61.24% 60.95% 5.85E−02 1.90E−03 9.27E−02 WE (2-loop)
Grand Gulf 7.91E−06 4.92E−06 2.34E−06 2.58E−06 62.20% 32.62% 4.73E−02 5.43E−03 1.00E−02 BWR 5/6 (HPCS)
Harris 4.26E−05 9.71E−06 1.25E−07 9.58E−06 22.78% 22.49% 2.96E−02 4.66E−03 6.95E−02 WE (3-loop)
Hatch 1 1.04E−05 1.63E−06 1.07E−06 5.55E−07 15.63% 5.34% 2.94E−02 2.86E−04 6.59E−02 BWR 3/4 (HPCI)
Hatch 2 1.04E−05 1.63E−06 1.07E−06 5.55E−07 15.63% 5.34% 2.95E−02 2.86E−04 6.59E−02 BWR 3/4 (HPCI)
Hope Creek 8.42E−06 2.70E−06 9.59E−07 1.74E−06 32.05% 20.67% 2.97E−02 8.58E−04 6.83E−02 BWR 3/4 (HPCI)
Indian Point 2 1.34E−05 8.29E−06 4.53E−06 3.76E−06 61.87% 28.06% 8.01E−02 1.41E−03 3.33E−02 WE (4-loop)
Indian Point 3 8.60E−06 1.65E−06 9.81E−07 6.73E−07 19.23% 7.83% 5.89E−02 3.62E−04 3.15E−02 WE (4-loop)
Kewaunee 1.53E−05 4.40E−06 9.83E−07 3.42E−06 28.78% 22.35% 2.98E−02 2.98E−03 3.85E−02 WE (2-loop)
La Salle 1 2.11E−06 5.98E−07 2.78E−07 3.20E−07 28.34% 15.17% 3.02E−02 3.76E−04 2.81E−02 BWR 5/6 (HPCS)
La Salle 2 2.12E−06 6.07E−07 2.82E−07 3.25E−07 28.63% 15.33% 3.07E−02 3.76E−04 2.82E−02 BWR 5/6 (HPCS)
Limerick 1 1.67E−06 6.34E−07 4.44E−07 1.90E−07 37.96% 11.38% 2.93E−02 1.38E−04 4.70E−02 BWR 1/2/3 (IC)
Limerick 2 1.67E−06 6.34E−07 4.44E−07 1.90E−07 37.96% 11.38% 2.93E−02 1.38E−04 4.71E−02 BWR 3/4 (HPCI)
McGuire 1 1.06E−05 8.68E−06 4.24E−08 8.64E−06 81.91% 81.51% 2.96E−02 2.44E−03 1.20E−01 WE (4-loop)
McGuire 2 1.05E−05 8.64E−06 4.22E−08 8.60E−06 82.31% 81.90% 2.95E−02 2.44E−03 1.20E−01 WE (4-loop)
Millstone 2 5.30E−06 7.43E−07 2.72E−07 4.71E−07 14.02% 8.89% 3.09E−02 3.49E−04 4.36E−02 CE (2-loop)
Millstone 3 9.13E−06 8.33E−07 3.76E−08 7.95E−07 9.12% 8.71% 3.04E−02 2.79E−04 9.38E−02 WE (4-loop)
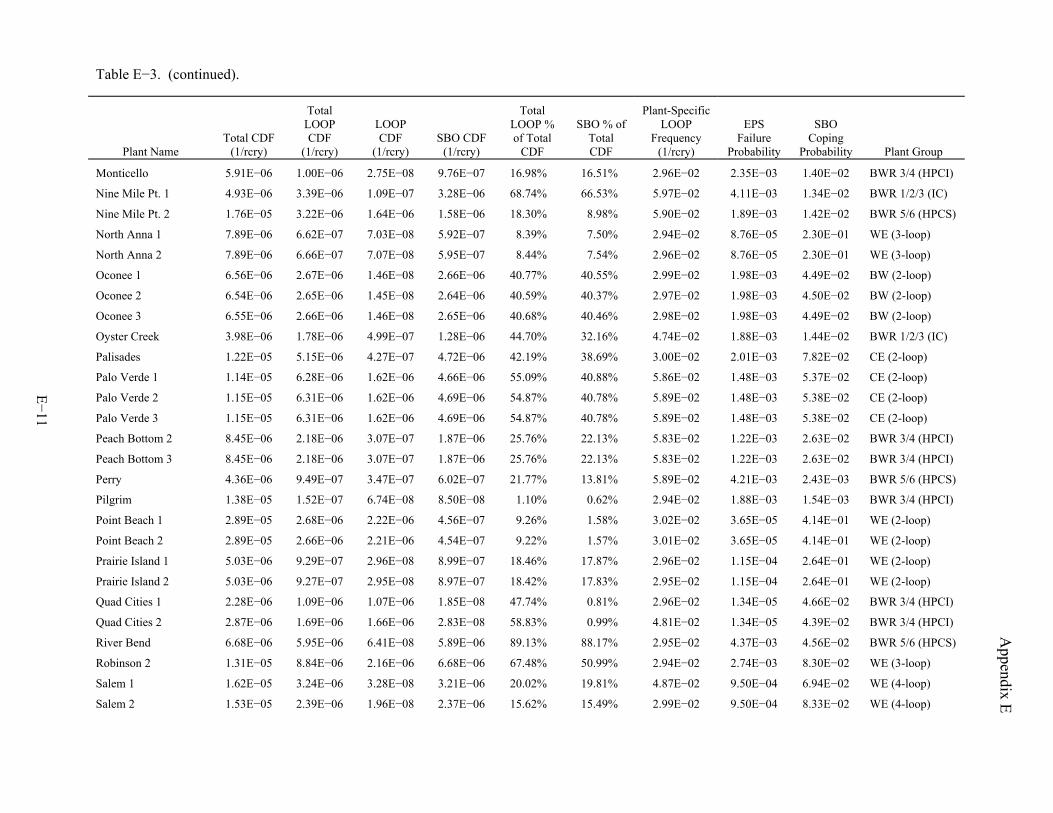
Appendix E
Table E−3. (continued).
E−11
Plant Name Total CDF
(1/rcry)
Total LOOP CDF
(1/rcry)
LOOP CDF
(1/rcry) SBO CDF
(1/rcry)
Total LOOP % of Total
CDF
SBO % of Total CDF
Plant-Specific LOOP
Frequency (1/rcry)
EPS Failure
Probability
SBO Coping
Probability Plant Group
Monticello 5.91E−06 1.00E−06 2.75E−08 9.76E−07 16.98% 16.51% 2.96E−02 2.35E−03 1.40E−02 BWR 3/4 (HPCI)
Nine Mile Pt. 1 4.93E−06 3.39E−06 1.09E−07 3.28E−06 68.74% 66.53% 5.97E−02 4.11E−03 1.34E−02 BWR 1/2/3 (IC)
Nine Mile Pt. 2 1.76E−05 3.22E−06 1.64E−06 1.58E−06 18.30% 8.98% 5.90E−02 1.89E−03 1.42E−02 BWR 5/6 (HPCS)
North Anna 1 7.89E−06 6.62E−07 7.03E−08 5.92E−07 8.39% 7.50% 2.94E−02 8.76E−05 2.30E−01 WE (3-loop)
North Anna 2 7.89E−06 6.66E−07 7.07E−08 5.95E−07 8.44% 7.54% 2.96E−02 8.76E−05 2.30E−01 WE (3-loop)
Oconee 1 6.56E−06 2.67E−06 1.46E−08 2.66E−06 40.77% 40.55% 2.99E−02 1.98E−03 4.49E−02 BW (2-loop)
Oconee 2 6.54E−06 2.65E−06 1.45E−08 2.64E−06 40.59% 40.37% 2.97E−02 1.98E−03 4.50E−02 BW (2-loop)
Oconee 3 6.55E−06 2.66E−06 1.46E−08 2.65E−06 40.68% 40.46% 2.98E−02 1.98E−03 4.49E−02 BW (2-loop)
Oyster Creek 3.98E−06 1.78E−06 4.99E−07 1.28E−06 44.70% 32.16% 4.74E−02 1.88E−03 1.44E−02 BWR 1/2/3 (IC)
Palisades 1.22E−05 5.15E−06 4.27E−07 4.72E−06 42.19% 38.69% 3.00E−02 2.01E−03 7.82E−02 CE (2-loop)
Palo Verde 1 1.14E−05 6.28E−06 1.62E−06 4.66E−06 55.09% 40.88% 5.86E−02 1.48E−03 5.37E−02 CE (2-loop)
Palo Verde 2 1.15E−05 6.31E−06 1.62E−06 4.69E−06 54.87% 40.78% 5.89E−02 1.48E−03 5.38E−02 CE (2-loop)
Palo Verde 3 1.15E−05 6.31E−06 1.62E−06 4.69E−06 54.87% 40.78% 5.89E−02 1.48E−03 5.38E−02 CE (2-loop)
Peach Bottom 2 8.45E−06 2.18E−06 3.07E−07 1.87E−06 25.76% 22.13% 5.83E−02 1.22E−03 2.63E−02 BWR 3/4 (HPCI)
Peach Bottom 3 8.45E−06 2.18E−06 3.07E−07 1.87E−06 25.76% 22.13% 5.83E−02 1.22E−03 2.63E−02 BWR 3/4 (HPCI)
Perry 4.36E−06 9.49E−07 3.47E−07 6.02E−07 21.77% 13.81% 5.89E−02 4.21E−03 2.43E−03 BWR 5/6 (HPCS)
Pilgrim 1.38E−05 1.52E−07 6.74E−08 8.50E−08 1.10% 0.62% 2.94E−02 1.88E−03 1.54E−03 BWR 3/4 (HPCI)
Point Beach 1 2.89E−05 2.68E−06 2.22E−06 4.56E−07 9.26% 1.58% 3.02E−02 3.65E−05 4.14E−01 WE (2-loop)
Point Beach 2 2.89E−05 2.66E−06 2.21E−06 4.54E−07 9.22% 1.57% 3.01E−02 3.65E−05 4.14E−01 WE (2-loop)
Prairie Island 1 5.03E−06 9.29E−07 2.96E−08 8.99E−07 18.46% 17.87% 2.96E−02 1.15E−04 2.64E−01 WE (2-loop)
Prairie Island 2 5.03E−06 9.27E−07 2.95E−08 8.97E−07 18.42% 17.83% 2.95E−02 1.15E−04 2.64E−01 WE (2-loop)
Quad Cities 1 2.28E−06 1.09E−06 1.07E−06 1.85E−08 47.74% 0.81% 2.96E−02 1.34E−05 4.66E−02 BWR 3/4 (HPCI)
Quad Cities 2 2.87E−06 1.69E−06 1.66E−06 2.83E−08 58.83% 0.99% 4.81E−02 1.34E−05 4.39E−02 BWR 3/4 (HPCI)
River Bend 6.68E−06 5.95E−06 6.41E−08 5.89E−06 89.13% 88.17% 2.95E−02 4.37E−03 4.56E−02 BWR 5/6 (HPCS)
Robinson 2 1.31E−05 8.84E−06 2.16E−06 6.68E−06 67.48% 50.99% 2.94E−02 2.74E−03 8.30E−02 WE (3-loop)
Salem 1 1.62E−05 3.24E−06 3.28E−08 3.21E−06 20.02% 19.81% 4.87E−02 9.50E−04 6.94E−02 WE (4-loop)
Salem 2 1.53E−05 2.39E−06 1.96E−08 2.37E−06 15.62% 15.49% 2.99E−02 9.50E−04 8.33E−02 WE (4-loop)
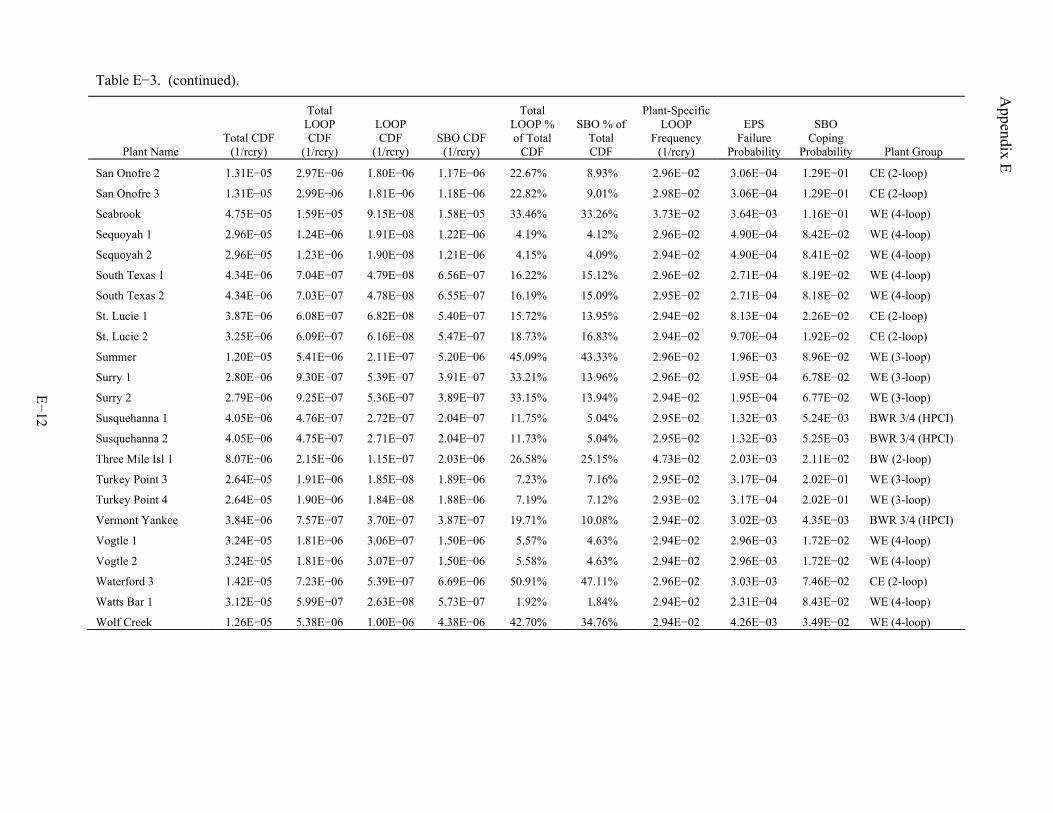
Appendix E
Table E−3. (continued).
E−12
Plant Name Total CDF
(1/rcry)
Total LOOP CDF
(1/rcry)
LOOP CDF
(1/rcry) SBO CDF
(1/rcry)
Total LOOP % of Total
CDF
SBO % of Total CDF
Plant-Specific LOOP
Frequency (1/rcry)
EPS Failure
Probability
SBO Coping
Probability Plant Group
San Onofre 2 1.31E−05 2.97E−06 1.80E−06 1.17E−06 22.67% 8.93% 2.96E−02 3.06E−04 1.29E−01 CE (2-loop)
San Onofre 3 1.31E−05 2.99E−06 1.81E−06 1.18E−06 22.82% 9.01% 2.98E−02 3.06E−04 1.29E−01 CE (2-loop)
Seabrook 4.75E−05 1.59E−05 9.15E−08 1.58E−05 33.46% 33.26% 3.73E−02 3.64E−03 1.16E−01 WE (4-loop)
Sequoyah 1 2.96E−05 1.24E−06 1.91E−08 1.22E−06 4.19% 4.12% 2.96E−02 4.90E−04 8.42E−02 WE (4-loop)
Sequoyah 2 2.96E−05 1.23E−06 1.90E−08 1.21E−06 4.15% 4.09% 2.94E−02 4.90E−04 8.41E−02 WE (4-loop)
South Texas 1 4.34E−06 7.04E−07 4.79E−08 6.56E−07 16.22% 15.12% 2.96E−02 2.71E−04 8.19E−02 WE (4-loop)
South Texas 2 4.34E−06 7.03E−07 4.78E−08 6.55E−07 16.19% 15.09% 2.95E−02 2.71E−04 8.18E−02 WE (4-loop)
St. Lucie 1 3.87E−06 6.08E−07 6.82E−08 5.40E−07 15.72% 13.95% 2.94E−02 8.13E−04 2.26E−02 CE (2-loop)
St. Lucie 2 3.25E−06 6.09E−07 6.16E−08 5.47E−07 18.73% 16.83% 2.94E−02 9.70E−04 1.92E−02 CE (2-loop)
Summer 1.20E−05 5.41E−06 2.11E−07 5.20E−06 45.09% 43.33% 2.96E−02 1.96E−03 8.96E−02 WE (3-loop)
Surry 1 2.80E−06 9.30E−07 5.39E−07 3.91E−07 33.21% 13.96% 2.96E−02 1.95E−04 6.78E−02 WE (3-loop)
Surry 2 2.79E−06 9.25E−07 5.36E−07 3.89E−07 33.15% 13.94% 2.94E−02 1.95E−04 6.77E−02 WE (3-loop)
Susquehanna 1 4.05E−06 4.76E−07 2.72E−07 2.04E−07 11.75% 5.04% 2.95E−02 1.32E−03 5.24E−03 BWR 3/4 (HPCI)
Susquehanna 2 4.05E−06 4.75E−07 2.71E−07 2.04E−07 11.73% 5.04% 2.95E−02 1.32E−03 5.25E−03 BWR 3/4 (HPCI)
Three Mile Isl 1 8.07E−06 2.15E−06 1.15E−07 2.03E−06 26.58% 25.15% 4.73E−02 2.03E−03 2.11E−02 BW (2-loop)
Turkey Point 3 2.64E−05 1.91E−06 1.85E−08 1.89E−06 7.23% 7.16% 2.95E−02 3.17E−04 2.02E−01 WE (3-loop)
Turkey Point 4 2.64E−05 1.90E−06 1.84E−08 1.88E−06 7.19% 7.12% 2.93E−02 3.17E−04 2.02E−01 WE (3-loop)
Vermont Yankee 3.84E−06 7.57E−07 3.70E−07 3.87E−07 19.71% 10.08% 2.94E−02 3.02E−03 4.35E−03 BWR 3/4 (HPCI)
Vogtle 1 3.24E−05 1.81E−06 3.06E−07 1.50E−06 5.57% 4.63% 2.94E−02 2.96E−03 1.72E−02 WE (4-loop)
Vogtle 2 3.24E−05 1.81E−06 3.07E−07 1.50E−06 5.58% 4.63% 2.94E−02 2.96E−03 1.72E−02 WE (4-loop)
Waterford 3 1.42E−05 7.23E−06 5.39E−07 6.69E−06 50.91% 47.11% 2.96E−02 3.03E−03 7.46E−02 CE (2-loop)
Watts Bar 1 3.12E−05 5.99E−07 2.63E−08 5.73E−07 1.92% 1.84% 2.94E−02 2.31E−04 8.43E−02 WE (4-loop)
Wolf Creek 1.26E−05 5.38E−06 1.00E−06 4.38E−06 42.70% 34.76% 2.94E−02 4.26E−03 3.49E−02 WE (4-loop)
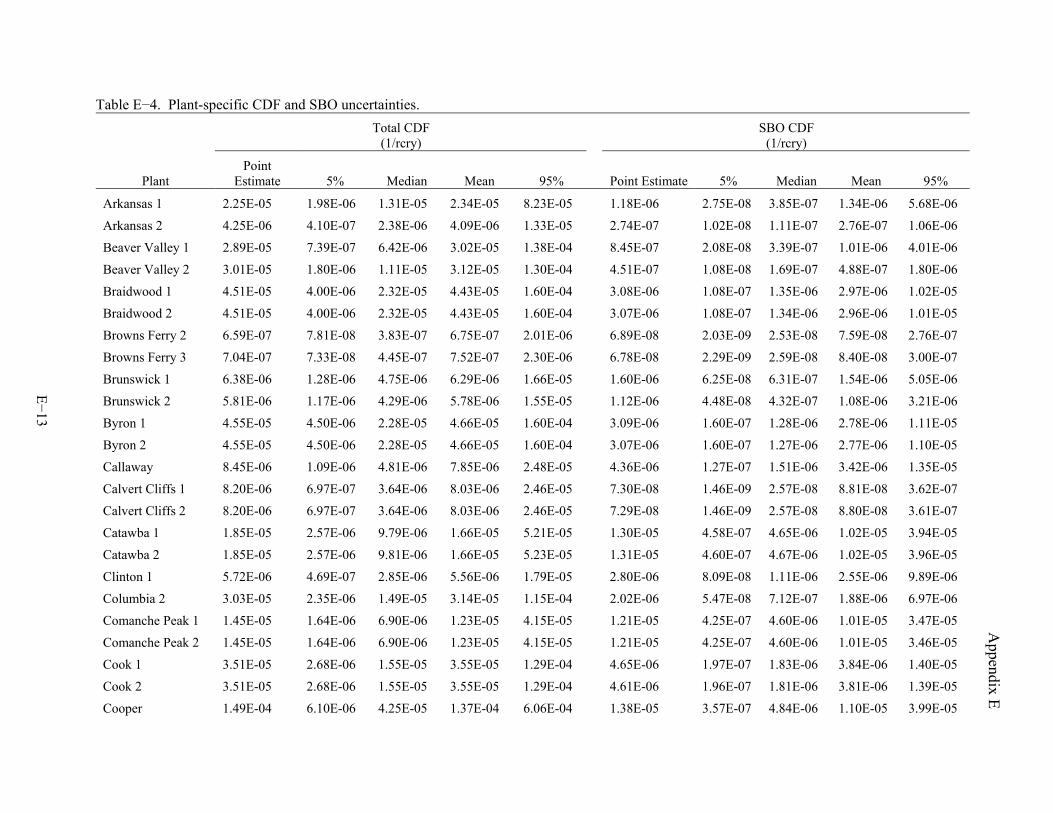
Appendix E
E−13
Table E−4. Plant-specific CDF and SBO uncertainties. Total CDF
(1/rcry) SBO CDF
(1/rcry)
Plant Point
Estimate 5% Median Mean 95% Point Estimate 5% Median Mean 95%
Arkansas 1 2.25E-05 1.98E-06 1.31E-05 2.34E-05 8.23E-05 1.18E-06 2.75E-08 3.85E-07 1.34E-06 5.68E-06
Arkansas 2 4.25E-06 4.10E-07 2.38E-06 4.09E-06 1.33E-05 2.74E-07 1.02E-08 1.11E-07 2.76E-07 1.06E-06
Beaver Valley 1 2.89E-05 7.39E-07 6.42E-06 3.02E-05 1.38E-04 8.45E-07 2.08E-08 3.39E-07 1.01E-06 4.01E-06
Beaver Valley 2 3.01E-05 1.80E-06 1.11E-05 3.12E-05 1.30E-04 4.51E-07 1.08E-08 1.69E-07 4.88E-07 1.80E-06
Braidwood 1 4.51E-05 4.00E-06 2.32E-05 4.43E-05 1.60E-04 3.08E-06 1.08E-07 1.35E-06 2.97E-06 1.02E-05
Braidwood 2 4.51E-05 4.00E-06 2.32E-05 4.43E-05 1.60E-04 3.07E-06 1.08E-07 1.34E-06 2.96E-06 1.01E-05
Browns Ferry 2 6.59E-07 7.81E-08 3.83E-07 6.75E-07 2.01E-06 6.89E-08 2.03E-09 2.53E-08 7.59E-08 2.76E-07
Browns Ferry 3 7.04E-07 7.33E-08 4.45E-07 7.52E-07 2.30E-06 6.78E-08 2.29E-09 2.59E-08 8.40E-08 3.00E-07
Brunswick 1 6.38E-06 1.28E-06 4.75E-06 6.29E-06 1.66E-05 1.60E-06 6.25E-08 6.31E-07 1.54E-06 5.05E-06
Brunswick 2 5.81E-06 1.17E-06 4.29E-06 5.78E-06 1.55E-05 1.12E-06 4.48E-08 4.32E-07 1.08E-06 3.21E-06
Byron 1 4.55E-05 4.50E-06 2.28E-05 4.66E-05 1.60E-04 3.09E-06 1.60E-07 1.28E-06 2.78E-06 1.11E-05
Byron 2 4.55E-05 4.50E-06 2.28E-05 4.66E-05 1.60E-04 3.07E-06 1.60E-07 1.27E-06 2.77E-06 1.10E-05
Callaway 8.45E-06 1.09E-06 4.81E-06 7.85E-06 2.48E-05 4.36E-06 1.27E-07 1.51E-06 3.42E-06 1.35E-05
Calvert Cliffs 1 8.20E-06 6.97E-07 3.64E-06 8.03E-06 2.46E-05 7.30E-08 1.46E-09 2.57E-08 8.81E-08 3.62E-07
Calvert Cliffs 2 8.20E-06 6.97E-07 3.64E-06 8.03E-06 2.46E-05 7.29E-08 1.46E-09 2.57E-08 8.80E-08 3.61E-07
Catawba 1 1.85E-05 2.57E-06 9.79E-06 1.66E-05 5.21E-05 1.30E-05 4.58E-07 4.65E-06 1.02E-05 3.94E-05
Catawba 2 1.85E-05 2.57E-06 9.81E-06 1.66E-05 5.23E-05 1.31E-05 4.60E-07 4.67E-06 1.02E-05 3.96E-05
Clinton 1 5.72E-06 4.69E-07 2.85E-06 5.56E-06 1.79E-05 2.80E-06 8.09E-08 1.11E-06 2.55E-06 9.89E-06
Columbia 2 3.03E-05 2.35E-06 1.49E-05 3.14E-05 1.15E-04 2.02E-06 5.47E-08 7.12E-07 1.88E-06 6.97E-06
Comanche Peak 1 1.45E-05 1.64E-06 6.90E-06 1.23E-05 4.15E-05 1.21E-05 4.25E-07 4.60E-06 1.01E-05 3.47E-05
Comanche Peak 2 1.45E-05 1.64E-06 6.90E-06 1.23E-05 4.15E-05 1.21E-05 4.25E-07 4.60E-06 1.01E-05 3.46E-05
Cook 1 3.51E-05 2.68E-06 1.55E-05 3.55E-05 1.29E-04 4.65E-06 1.97E-07 1.83E-06 3.84E-06 1.40E-05
Cook 2 3.51E-05 2.68E-06 1.55E-05 3.55E-05 1.29E-04 4.61E-06 1.96E-07 1.81E-06 3.81E-06 1.39E-05
Cooper 1.49E-04 6.10E-06 4.25E-05 1.37E-04 6.06E-04 1.38E-05 3.57E-07 4.84E-06 1.10E-05 3.99E-05
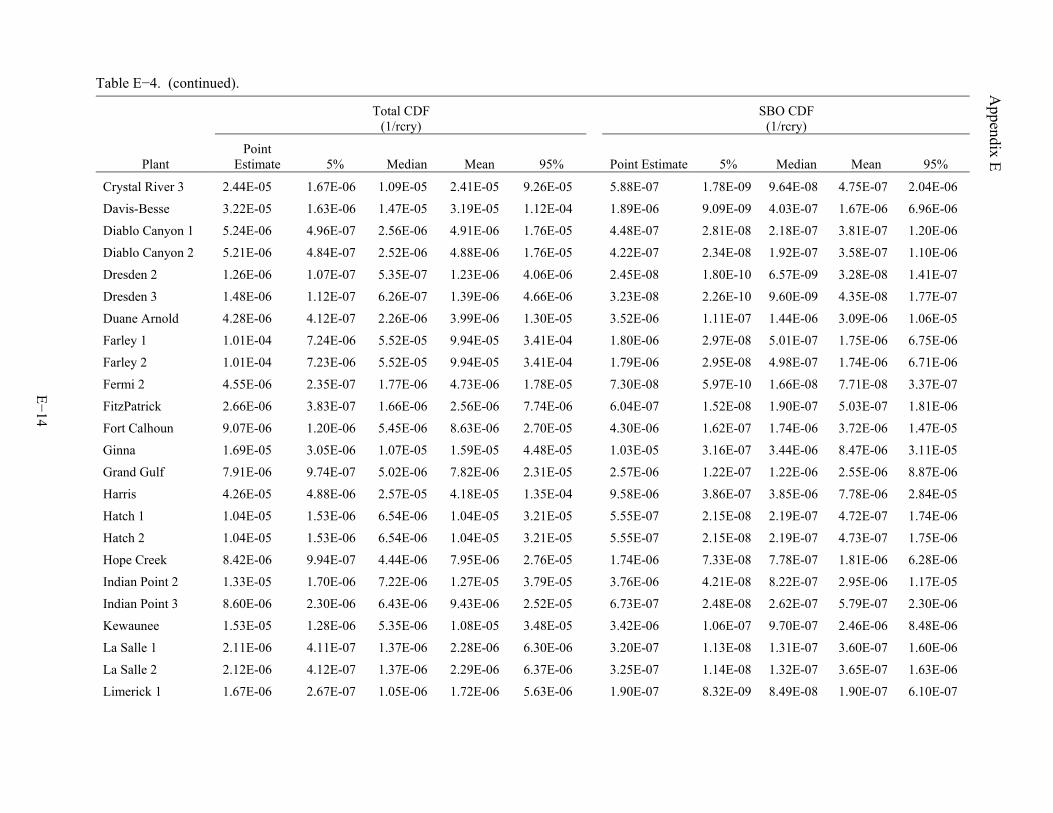
Appendix E
Table E−4. (continued).
E−14
Total CDF (1/rcry)
SBO CDF (1/rcry)
Plant Point
Estimate 5% Median Mean 95% Point Estimate 5% Median Mean 95%
Crystal River 3 2.44E-05 1.67E-06 1.09E-05 2.41E-05 9.26E-05 5.88E-07 1.78E-09 9.64E-08 4.75E-07 2.04E-06
Davis-Besse 3.22E-05 1.63E-06 1.47E-05 3.19E-05 1.12E-04 1.89E-06 9.09E-09 4.03E-07 1.67E-06 6.96E-06
Diablo Canyon 1 5.24E-06 4.96E-07 2.56E-06 4.91E-06 1.76E-05 4.48E-07 2.81E-08 2.18E-07 3.81E-07 1.20E-06
Diablo Canyon 2 5.21E-06 4.84E-07 2.52E-06 4.88E-06 1.76E-05 4.22E-07 2.34E-08 1.92E-07 3.58E-07 1.10E-06
Dresden 2 1.26E-06 1.07E-07 5.35E-07 1.23E-06 4.06E-06 2.45E-08 1.80E-10 6.57E-09 3.28E-08 1.41E-07
Dresden 3 1.48E-06 1.12E-07 6.26E-07 1.39E-06 4.66E-06 3.23E-08 2.26E-10 9.60E-09 4.35E-08 1.77E-07
Duane Arnold 4.28E-06 4.12E-07 2.26E-06 3.99E-06 1.30E-05 3.52E-06 1.11E-07 1.44E-06 3.09E-06 1.06E-05
Farley 1 1.01E-04 7.24E-06 5.52E-05 9.94E-05 3.41E-04 1.80E-06 2.97E-08 5.01E-07 1.75E-06 6.75E-06
Farley 2 1.01E-04 7.23E-06 5.52E-05 9.94E-05 3.41E-04 1.79E-06 2.95E-08 4.98E-07 1.74E-06 6.71E-06
Fermi 2 4.55E-06 2.35E-07 1.77E-06 4.73E-06 1.78E-05 7.30E-08 5.97E-10 1.66E-08 7.71E-08 3.37E-07
FitzPatrick 2.66E-06 3.83E-07 1.66E-06 2.56E-06 7.74E-06 6.04E-07 1.52E-08 1.90E-07 5.03E-07 1.81E-06
Fort Calhoun 9.07E-06 1.20E-06 5.45E-06 8.63E-06 2.70E-05 4.30E-06 1.62E-07 1.74E-06 3.72E-06 1.47E-05
Ginna 1.69E-05 3.05E-06 1.07E-05 1.59E-05 4.48E-05 1.03E-05 3.16E-07 3.44E-06 8.47E-06 3.11E-05
Grand Gulf 7.91E-06 9.74E-07 5.02E-06 7.82E-06 2.31E-05 2.57E-06 1.22E-07 1.22E-06 2.55E-06 8.87E-06
Harris 4.26E-05 4.88E-06 2.57E-05 4.18E-05 1.35E-04 9.58E-06 3.86E-07 3.85E-06 7.78E-06 2.84E-05
Hatch 1 1.04E-05 1.53E-06 6.54E-06 1.04E-05 3.21E-05 5.55E-07 2.15E-08 2.19E-07 4.72E-07 1.74E-06
Hatch 2 1.04E-05 1.53E-06 6.54E-06 1.04E-05 3.21E-05 5.55E-07 2.15E-08 2.19E-07 4.73E-07 1.75E-06
Hope Creek 8.42E-06 9.94E-07 4.44E-06 7.95E-06 2.76E-05 1.74E-06 7.33E-08 7.78E-07 1.81E-06 6.28E-06
Indian Point 2 1.33E-05 1.70E-06 7.22E-06 1.27E-05 3.79E-05 3.76E-06 4.21E-08 8.22E-07 2.95E-06 1.17E-05
Indian Point 3 8.60E-06 2.30E-06 6.43E-06 9.43E-06 2.52E-05 6.73E-07 2.48E-08 2.62E-07 5.79E-07 2.30E-06
Kewaunee 1.53E-05 1.28E-06 5.35E-06 1.08E-05 3.48E-05 3.42E-06 1.06E-07 9.70E-07 2.46E-06 8.48E-06
La Salle 1 2.11E-06 4.11E-07 1.37E-06 2.28E-06 6.30E-06 3.20E-07 1.13E-08 1.31E-07 3.60E-07 1.60E-06
La Salle 2 2.12E-06 4.12E-07 1.37E-06 2.29E-06 6.37E-06 3.25E-07 1.14E-08 1.32E-07 3.65E-07 1.63E-06
Limerick 1 1.67E-06 2.67E-07 1.05E-06 1.72E-06 5.63E-06 1.90E-07 8.32E-09 8.49E-08 1.90E-07 6.10E-07
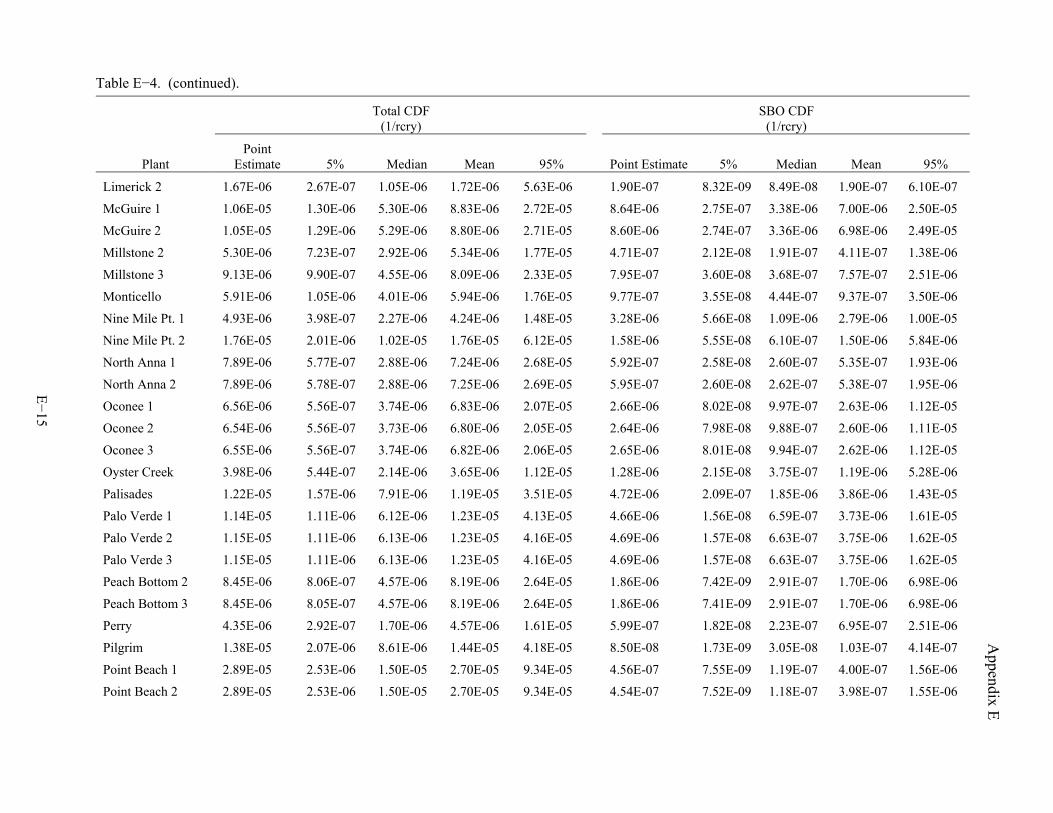
Appendix E
Table E−4. (continued).
E−15
Total CDF (1/rcry)
SBO CDF (1/rcry)
Plant Point
Estimate 5% Median Mean 95% Point Estimate 5% Median Mean 95%
Limerick 2 1.67E-06 2.67E-07 1.05E-06 1.72E-06 5.63E-06 1.90E-07 8.32E-09 8.49E-08 1.90E-07 6.10E-07
McGuire 1 1.06E-05 1.30E-06 5.30E-06 8.83E-06 2.72E-05 8.64E-06 2.75E-07 3.38E-06 7.00E-06 2.50E-05
McGuire 2 1.05E-05 1.29E-06 5.29E-06 8.80E-06 2.71E-05 8.60E-06 2.74E-07 3.36E-06 6.98E-06 2.49E-05
Millstone 2 5.30E-06 7.23E-07 2.92E-06 5.34E-06 1.77E-05 4.71E-07 2.12E-08 1.91E-07 4.11E-07 1.38E-06
Millstone 3 9.13E-06 9.90E-07 4.55E-06 8.09E-06 2.33E-05 7.95E-07 3.60E-08 3.68E-07 7.57E-07 2.51E-06
Monticello 5.91E-06 1.05E-06 4.01E-06 5.94E-06 1.76E-05 9.77E-07 3.55E-08 4.44E-07 9.37E-07 3.50E-06
Nine Mile Pt. 1 4.93E-06 3.98E-07 2.27E-06 4.24E-06 1.48E-05 3.28E-06 5.66E-08 1.09E-06 2.79E-06 1.00E-05
Nine Mile Pt. 2 1.76E-05 2.01E-06 1.02E-05 1.76E-05 6.12E-05 1.58E-06 5.55E-08 6.10E-07 1.50E-06 5.84E-06
North Anna 1 7.89E-06 5.77E-07 2.88E-06 7.24E-06 2.68E-05 5.92E-07 2.58E-08 2.60E-07 5.35E-07 1.93E-06
North Anna 2 7.89E-06 5.78E-07 2.88E-06 7.25E-06 2.69E-05 5.95E-07 2.60E-08 2.62E-07 5.38E-07 1.95E-06
Oconee 1 6.56E-06 5.56E-07 3.74E-06 6.83E-06 2.07E-05 2.66E-06 8.02E-08 9.97E-07 2.63E-06 1.12E-05
Oconee 2 6.54E-06 5.56E-07 3.73E-06 6.80E-06 2.05E-05 2.64E-06 7.98E-08 9.88E-07 2.60E-06 1.11E-05
Oconee 3 6.55E-06 5.56E-07 3.74E-06 6.82E-06 2.06E-05 2.65E-06 8.01E-08 9.94E-07 2.62E-06 1.12E-05
Oyster Creek 3.98E-06 5.44E-07 2.14E-06 3.65E-06 1.12E-05 1.28E-06 2.15E-08 3.75E-07 1.19E-06 5.28E-06
Palisades 1.22E-05 1.57E-06 7.91E-06 1.19E-05 3.51E-05 4.72E-06 2.09E-07 1.85E-06 3.86E-06 1.43E-05
Palo Verde 1 1.14E-05 1.11E-06 6.12E-06 1.23E-05 4.13E-05 4.66E-06 1.56E-08 6.59E-07 3.73E-06 1.61E-05
Palo Verde 2 1.15E-05 1.11E-06 6.13E-06 1.23E-05 4.16E-05 4.69E-06 1.57E-08 6.63E-07 3.75E-06 1.62E-05
Palo Verde 3 1.15E-05 1.11E-06 6.13E-06 1.23E-05 4.16E-05 4.69E-06 1.57E-08 6.63E-07 3.75E-06 1.62E-05
Peach Bottom 2 8.45E-06 8.06E-07 4.57E-06 8.19E-06 2.64E-05 1.86E-06 7.42E-09 2.91E-07 1.70E-06 6.98E-06
Peach Bottom 3 8.45E-06 8.05E-07 4.57E-06 8.19E-06 2.64E-05 1.86E-06 7.41E-09 2.91E-07 1.70E-06 6.98E-06
Perry 4.35E-06 2.92E-07 1.70E-06 4.57E-06 1.61E-05 5.99E-07 1.82E-08 2.23E-07 6.95E-07 2.51E-06
Pilgrim 1.38E-05 2.07E-06 8.61E-06 1.44E-05 4.18E-05 8.50E-08 1.73E-09 3.05E-08 1.03E-07 4.14E-07
Point Beach 1 2.89E-05 2.53E-06 1.50E-05 2.70E-05 9.34E-05 4.56E-07 7.55E-09 1.19E-07 4.00E-07 1.56E-06
Point Beach 2 2.89E-05 2.53E-06 1.50E-05 2.70E-05 9.34E-05 4.54E-07 7.52E-09 1.18E-07 3.98E-07 1.55E-06
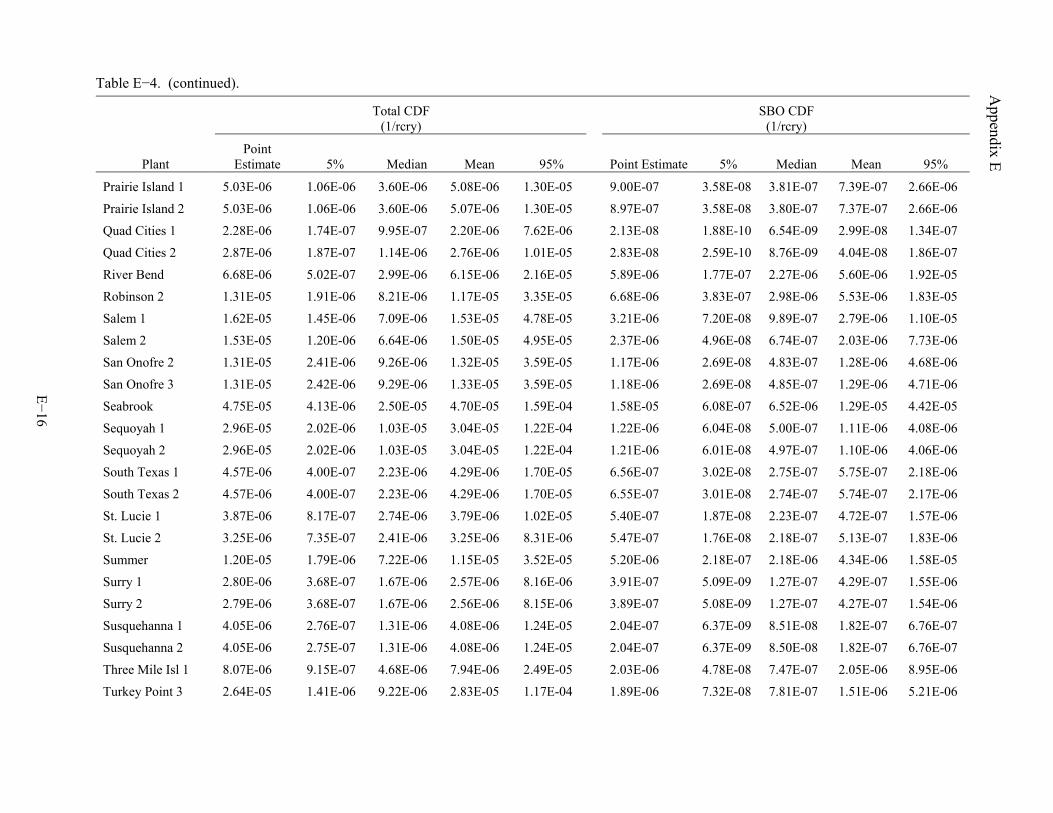
Appendix E
Table E−4. (continued).
E−16
Total CDF (1/rcry)
SBO CDF (1/rcry)
Plant Point
Estimate 5% Median Mean 95% Point Estimate 5% Median Mean 95%
Prairie Island 1 5.03E-06 1.06E-06 3.60E-06 5.08E-06 1.30E-05 9.00E-07 3.58E-08 3.81E-07 7.39E-07 2.66E-06
Prairie Island 2 5.03E-06 1.06E-06 3.60E-06 5.07E-06 1.30E-05 8.97E-07 3.58E-08 3.80E-07 7.37E-07 2.66E-06
Quad Cities 1 2.28E-06 1.74E-07 9.95E-07 2.20E-06 7.62E-06 2.13E-08 1.88E-10 6.54E-09 2.99E-08 1.34E-07
Quad Cities 2 2.87E-06 1.87E-07 1.14E-06 2.76E-06 1.01E-05 2.83E-08 2.59E-10 8.76E-09 4.04E-08 1.86E-07
River Bend 6.68E-06 5.02E-07 2.99E-06 6.15E-06 2.16E-05 5.89E-06 1.77E-07 2.27E-06 5.60E-06 1.92E-05
Robinson 2 1.31E-05 1.91E-06 8.21E-06 1.17E-05 3.35E-05 6.68E-06 3.83E-07 2.98E-06 5.53E-06 1.83E-05
Salem 1 1.62E-05 1.45E-06 7.09E-06 1.53E-05 4.78E-05 3.21E-06 7.20E-08 9.89E-07 2.79E-06 1.10E-05
Salem 2 1.53E-05 1.20E-06 6.64E-06 1.50E-05 4.95E-05 2.37E-06 4.96E-08 6.74E-07 2.03E-06 7.73E-06
San Onofre 2 1.31E-05 2.41E-06 9.26E-06 1.32E-05 3.59E-05 1.17E-06 2.69E-08 4.83E-07 1.28E-06 4.68E-06
San Onofre 3 1.31E-05 2.42E-06 9.29E-06 1.33E-05 3.59E-05 1.18E-06 2.69E-08 4.85E-07 1.29E-06 4.71E-06
Seabrook 4.75E-05 4.13E-06 2.50E-05 4.70E-05 1.59E-04 1.58E-05 6.08E-07 6.52E-06 1.29E-05 4.42E-05
Sequoyah 1 2.96E-05 2.02E-06 1.03E-05 3.04E-05 1.22E-04 1.22E-06 6.04E-08 5.00E-07 1.11E-06 4.08E-06
Sequoyah 2 2.96E-05 2.02E-06 1.03E-05 3.04E-05 1.22E-04 1.21E-06 6.01E-08 4.97E-07 1.10E-06 4.06E-06
South Texas 1 4.57E-06 4.00E-07 2.23E-06 4.29E-06 1.70E-05 6.56E-07 3.02E-08 2.75E-07 5.75E-07 2.18E-06
South Texas 2 4.57E-06 4.00E-07 2.23E-06 4.29E-06 1.70E-05 6.55E-07 3.01E-08 2.74E-07 5.74E-07 2.17E-06
St. Lucie 1 3.87E-06 8.17E-07 2.74E-06 3.79E-06 1.02E-05 5.40E-07 1.87E-08 2.23E-07 4.72E-07 1.57E-06
St. Lucie 2 3.25E-06 7.35E-07 2.41E-06 3.25E-06 8.31E-06 5.47E-07 1.76E-08 2.18E-07 5.13E-07 1.83E-06
Summer 1.20E-05 1.79E-06 7.22E-06 1.15E-05 3.52E-05 5.20E-06 2.18E-07 2.18E-06 4.34E-06 1.58E-05
Surry 1 2.80E-06 3.68E-07 1.67E-06 2.57E-06 8.16E-06 3.91E-07 5.09E-09 1.27E-07 4.29E-07 1.55E-06
Surry 2 2.79E-06 3.68E-07 1.67E-06 2.56E-06 8.15E-06 3.89E-07 5.08E-09 1.27E-07 4.27E-07 1.54E-06
Susquehanna 1 4.05E-06 2.76E-07 1.31E-06 4.08E-06 1.24E-05 2.04E-07 6.37E-09 8.51E-08 1.82E-07 6.76E-07
Susquehanna 2 4.05E-06 2.75E-07 1.31E-06 4.08E-06 1.24E-05 2.04E-07 6.37E-09 8.50E-08 1.82E-07 6.76E-07
Three Mile Isl 1 8.07E-06 9.15E-07 4.68E-06 7.94E-06 2.49E-05 2.03E-06 4.78E-08 7.47E-07 2.05E-06 8.95E-06
Turkey Point 3 2.64E-05 1.41E-06 9.22E-06 2.83E-05 1.17E-04 1.89E-06 7.32E-08 7.81E-07 1.51E-06 5.21E-06
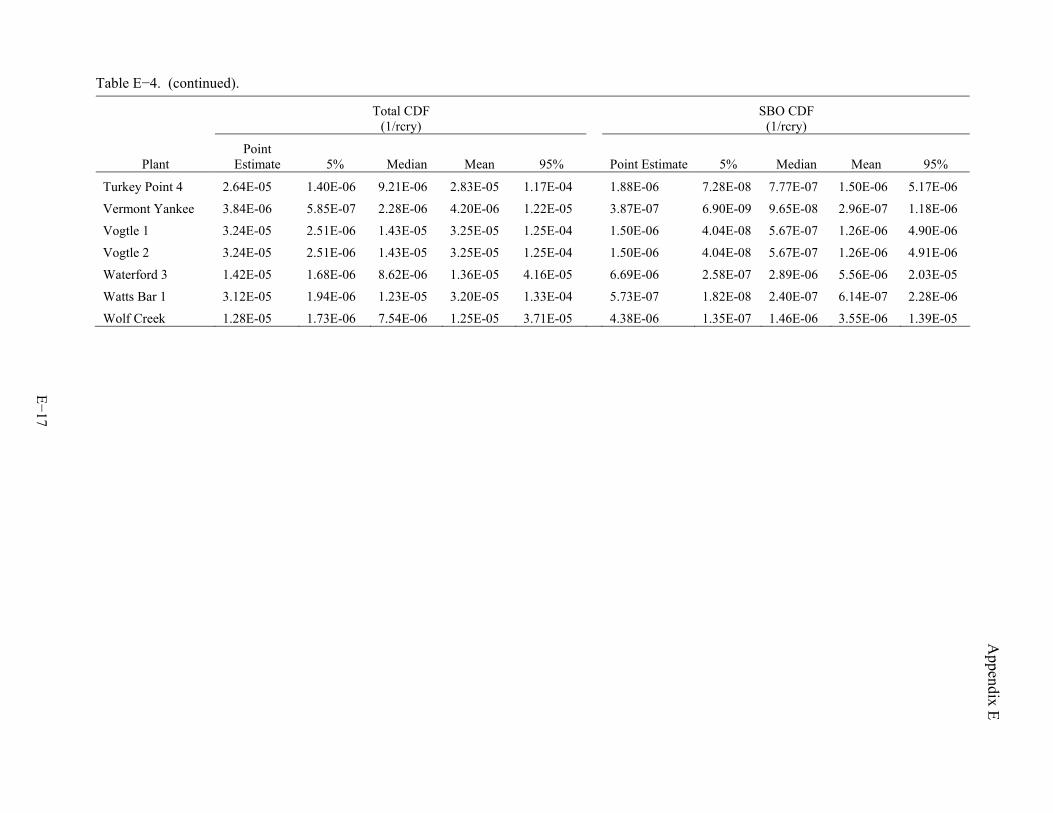
Appendix E
Table E−4. (continued).
E−17
Total CDF (1/rcry)
SBO CDF (1/rcry)
Plant Point
Estimate 5% Median Mean 95% Point Estimate 5% Median Mean 95%
Turkey Point 4 2.64E-05 1.40E-06 9.21E-06 2.83E-05 1.17E-04 1.88E-06 7.28E-08 7.77E-07 1.50E-06 5.17E-06
Vermont Yankee 3.84E-06 5.85E-07 2.28E-06 4.20E-06 1.22E-05 3.87E-07 6.90E-09 9.65E-08 2.96E-07 1.18E-06
Vogtle 1 3.24E-05 2.51E-06 1.43E-05 3.25E-05 1.25E-04 1.50E-06 4.04E-08 5.67E-07 1.26E-06 4.90E-06
Vogtle 2 3.24E-05 2.51E-06 1.43E-05 3.25E-05 1.25E-04 1.50E-06 4.04E-08 5.67E-07 1.26E-06 4.91E-06
Waterford 3 1.42E-05 1.68E-06 8.62E-06 1.36E-05 4.16E-05 6.69E-06 2.58E-07 2.89E-06 5.56E-06 2.03E-05
Watts Bar 1 3.12E-05 1.94E-06 1.23E-05 3.20E-05 1.33E-04 5.73E-07 1.82E-08 2.40E-07 6.14E-07 2.28E-06
Wolf Creek 1.28E-05 1.73E-06 7.54E-06 1.25E-05 3.71E-05 4.38E-06 1.35E-07 1.46E-06 3.55E-06 1.39E-05

Appendix E
E−18
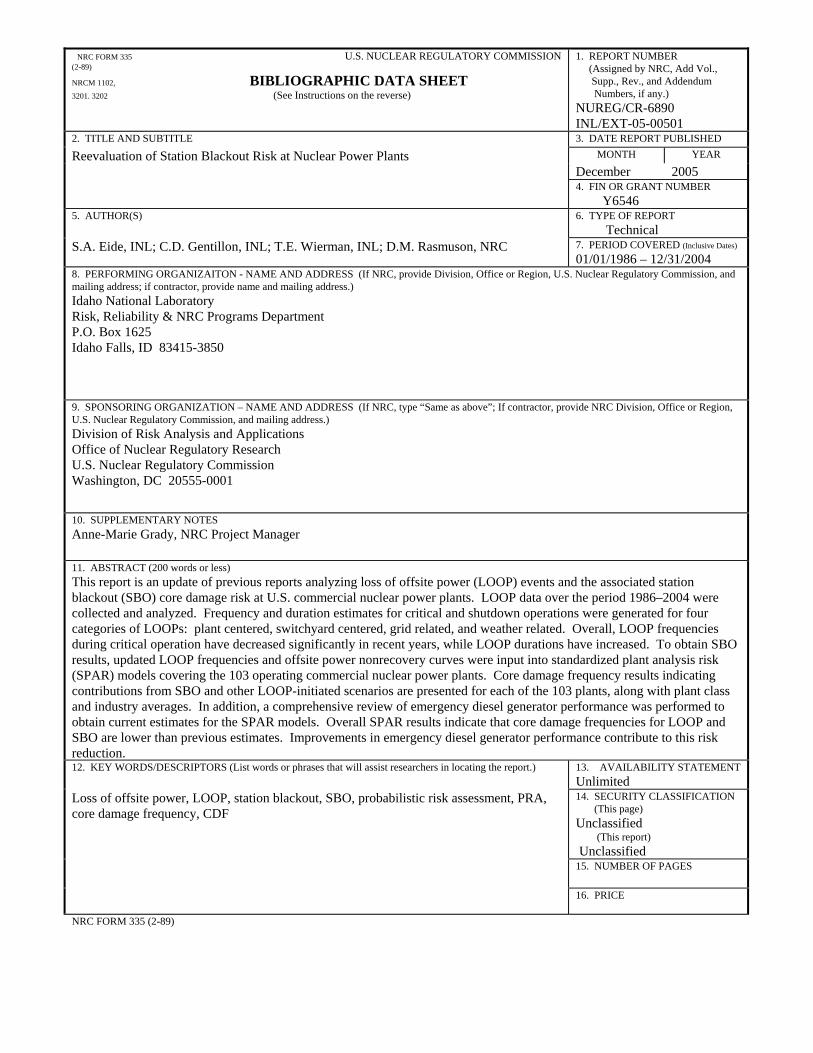
NRC FORM 335 U.S. NUCLEAR REGULATORY COMMISSION (2-89) NRCM 1102, BIBLIOGRAPHIC DATA SHEET 3201. 3202 (See Instructions on the reverse)
1. REPORT NUMBER (Assigned by NRC, Add Vol., Supp., Rev., and Addendum Numbers, if any.) NUREG/CR-6890 INL/EXT-05-00501
2. TITLE AND SUBTITLE 3. DATE REPORT PUBLISHED Reevaluation of Station Blackout Risk at Nuclear Power Plants MONTH YEAR
December 2005 4. FIN OR GRANT NUMBER
Y6546 5. AUTHOR(S) 6. TYPE OF REPORT
Technical S.A. Eide, INL; C.D. Gentillon, INL; T.E. Wierman, INL; D.M. Rasmuson, NRC 7. PERIOD COVERED (Inclusive Dates)
01/01/1986 – 12/31/2004 8. PERFORMING ORGANIZAITON - NAME AND ADDRESS (If NRC, provide Division, Office or Region, U.S. Nuclear Regulatory Commission, and mailing address; if contractor, provide name and mailing address.) Idaho National Laboratory Risk, Reliability & NRC Programs Department P.O. Box 1625 Idaho Falls, ID 83415-3850
9. SPONSORING ORGANIZATION – NAME AND ADDRESS (If NRC, type “Same as above”; If contractor, provide NRC Division, Office or Region, U.S. Nuclear Regulatory Commission, and mailing address.) Division of Risk Analysis and Applications Office of Nuclear Regulatory Research U.S. Nuclear Regulatory Commission Washington, DC 20555-0001
10. SUPPLEMENTARY NOTES Anne-Marie Grady, NRC Project Manager
11. ABSTRACT (200 words or less) This report is an update of previous reports analyzing loss of offsite power (LOOP) events and the associated station blackout (SBO) core damage risk at U.S. commercial nuclear power plants. LOOP data over the period 1986–2004 were collected and analyzed. Frequency and duration estimates for critical and shutdown operations were generated for four categories of LOOPs: plant centered, switchyard centered, grid related, and weather related. Overall, LOOP frequencies during critical operation have decreased significantly in recent years, while LOOP durations have increased. To obtain SBO results, updated LOOP frequencies and offsite power nonrecovery curves were input into standardized plant analysis risk (SPAR) models covering the 103 operating commercial nuclear power plants. Core damage frequency results indicating contributions from SBO and other LOOP-initiated scenarios are presented for each of the 103 plants, along with plant class and industry averages. In addition, a comprehensive review of emergency diesel generator performance was performed to obtain current estimates for the SPAR models. Overall SPAR results indicate that core damage frequencies for LOOP and SBO are lower than previous estimates. Improvements in emergency diesel generator performance contribute to this risk reduction. 12. KEY WORDS/DESCRIPTORS (List words or phrases that will assist researchers in locating the report.) 13. AVAILABILITY STATEMENT
Unlimited Loss of offsite power, LOOP, station blackout, SBO, probabilistic risk assessment, PRA, core damage frequency, CDF
14. SECURITY CLASSIFICATION (This page) Unclassified (This report) Unclassified
15. NUMBER OF PAGES
16. PRICE
NRC FORM 335 (2-89)