Embed Size (px)
Citation preview

REF: IOC/BGR/ENV/REP/MoEF&CC/2017-18/01 Date: 20.12.2017
To The Chief Conservator of Forests Regional Office, North East Region Ministry of Environment & Forests & Climate Change Law-U-SIB, Lumbatngen, Near M.T.C. Workshop,
Shillong – 793021 Subject: Half Yearly Report for the period of (1st April 2017 to 30th September 2017) for
“Refinery Expansion, De-bottlenecking of Reformer and LPG facility”
Dear Sir,
With reference to above, we are enclosing the Six Monthly Report for the period of 1st April 2017 to
30th September 2017 for your kind perusal.
The reports are being sent as per EIA Rules’2006 for the “Environmental Clearances” issued by
MoEF&CC to Bongaigaon Refinery, (BGR) for “Refinery Expansion, De-bottlenecking of Reformer and
LPG facility” Project.
Thanking you, Yours faithfully,
(A.Basumatary) DGM (HSE)
Copy to:
1. Member Secretary, Pollution Control Board, Assam Bamunimaidam, Guwahati - 781 021
2. Zonal Officer, Central Pollution Control Board
Eastern Zonal Office, ‘TUM-SIR’, Lower Motinagar, Near Fire Brigade H.Q., Shillong – 793014

Half Yearly Report for “Refinery Expansion Project”
(1st April 2017 to 30thSeptember 2017)
Environmental Clearance for Refinery Expansion, De-bottlenecking of Reformer and LPG facility
Vide MoEF&CC’s letter No. J.11011/24/90-IA-II dated 03/06/1991
Plant Commissioning dates:
1. Crude Distillation Unit – II: 09.05.1995
2. Delayed Coker Unit – II : 06.03.1996
Submitted by:
Indian Oil Corporation Limited
Bongaigaon Refinery
P.O: Dhaligaon. District: Chirang. Assam

INDEX
Sl. No
Conditions Status
1. The EC letter MoEF’s letter No. J.11011/24/90-IA-II Dt. 03/06/1991
Photocopy Enclosed
2. General & specific conditions Compliance status of Refinery Expansion Project
Annexure- A
3. Six monthly Stack Monitoring/ Air Quality Data Furnished in Appendix-A1
4.
Six monthly effluent discharged Quantity, Quality Furnished in Appendix-A2
5. Tree Plantation Data Furnished in Appendix-A3
6.
Additional Information Furnished in Appendix-A4
7. Fugitive Emission Data Furnished in Appendix-A5
8. Annual return of hazardous waste Furnished in Appendix-A6(a)
9. Authorization from PCBA under Hazardous Waste ( Management , Handling and Transboundary Movement Rules 2008)
Furnished in Appendix-A6(b)
10. Details of Waste water treatment and disposal system Furnished in Appendix-A7
11. Quarterly Noise Survey Report. Furnished in Appendix-A8
12. Status of Rainwater Harvesting Furnished in Appendix-A9
13. Screen Shot of IOCL Website upload of report Furnished in Appendix-A10
14. Organogram of hse Department Furnished in Appendix-A11
15. Gazette Notification of BGR Quality Control laboratory (QC Lab) approval under Environment (Protection) Act 1986.
Furnished in Appendix-A12
16. Employees Occupational Heath Check up Status Furnished in Appendix-A13
17 Flare system. Furnished in Appendix-A14

1.0
Photo Copy of EC letter: MoEF’s letter No. J.11011/24/90-IA-II Dt. 03/06/1991


2.0 ANNEXURE – A
Sr. No
General Conditions Compliance Status
1
The project authority must strictly adhere to the stipulations made by Assam State Pollution Control Board and State Government and the comprehensive EIA will be submitted within 18 months.
1. All stipulations by Pollution Control Board of Assam are strictly followed.
2. Copy of comprehensive EIA prepared for the Refinery Expansion was submitted to MOEF, New Delhi and also to MOEF Shillong vide our letter ENV/MIN/94/05 dated 15/06/94.
2
Any expansion of the plant, either with the existing product mix or new products can be taken up only with the prior approval of this Ministry.
1. Proposal for expansion of Refinery-2 is submitted to MOEF&CC for Environment Clearance. All expansion activities are dealt as per provision of the EP Act and other applicable acts.
3
The gases emission from the various process units should conform to the standard prescribed by the concern authorities, from time to time. At no time the emission level should go beyond the stipulated standards.
1. The process units are designed to meet the prescribed standards.
2. Units would be put out of operation in the
event of mal functioning of pollution control practice at BGR.
Pl. Refer appendix A1.
4
Adequate number of (a minimum of 5) of Air quality monitoring stations should be set up in the down wind direction as well as where maximum ground level concentration is anticipated. Also, stack emission should be monitored by setting of automatic stack monitoring unit.
1. Six Ambient Air Quality Monitoring Stations are operating around the complex at BGR including one continuous analyzer set up for compilation of Ambient Air Quality data.
2. All these stations are selected based on modeling exercise representing short-term maximum ground level concentration.
3. All major stacks in BGR are monitored with continuous analyzers installed for SO2, NOx. PM & CO Analysis in all stacks as per CPCB guidelines and connected to CPCB & SPCB servers
5
There should be no change in the stack design without the approval of State Pollution Control Board. Alternative Pollution Control system and design (steam injection system in the stack) should be provided to take care the excess emission due to failure in any system of the plant.
1. No changes are made to the stack design. 2. Steam injection facility is provided in burners
of the furnaces.
6
The ambient Air Quality Data for winter season (November 1990 to January 1991) should be presented by June 1991.
These data were submitted as desired during 1991.
7
The project authority should recycle the waste to the maximum extent. Recycle plan should be submitted within one year. This should include use of recycled water for green belt development plan.
BGR has installed Tertiary Treatment Plant to facilitate reuse of treated effluent inside the complex as Cooling Water & Firewater Make up, unit housekeeping and watering in plantation areas inside. Only nominal quantity of effluent is being discharged through Eco park to outside the complex.

Sr. No General Conditions Compliance Status
8
Adequate number of effluent quality monitoring stations must be set in consultation with State Pollution Control Board and the effluents monitored and should be statistically analysed and the report sent to this Ministry once in six month and State Pollution Control Board every three months.
1. Three joint sampling points for effluent are fixed in and around BGR by Pollution Control Board, Assam (PCBA) to monitor the discharge effluent quality. Joint sampling by Pollution Control Board, Assam is conducted once a month. The samples are tested at PCBA Laboratory.
2. Beside samples are tested at BGR Laboratory as per consent condition and also on a daily basis to track effluent quality.
3. All samples conform to the prescribed Revised Effluent Standards 2008 (Please Refer Appendix-A2).
9
The project authority should prepare a well-designed scheme for solid waste disposal generated during various process operations or in the treatment plant. The plan for disposal should be submitted to the ministry within six months.
1. All solid waste generated during various process operations or in the treatment plant are handled and disposed off as per laid down procedures in ISO-14001 in environmentally friendly manner.
2. All hazardous wastes are handled and disposed off as per provisions of the Hazardous Waste (Management, Handling & Trans boundary Movement) Rules, 2008 and as per directions of statutory agencies.
3. As a measure of Haz. Waste Management, M/s Balmer Lawrie & Co. Limited was awarded the contract of mechanized treatment of tank bottom sludge. Melting pit facility is available for recovering oil from oily sludge.
4.A confined bio-remediation plant of 100 m3 capacity was set up in collaboration with IOCL R&D in July 2017 for treatment of oily sludge.
5. All statutory returns are sent to PCBA as per the provision of rule.
10
A detailed risk analysis of LPG storage facility should be carried out and a report be submitted to the ministry within six months.
Risk Analysis for LPG Storage was prepared and submitted to MOEF in 1992. Environment Clearance from MOEF & CC obtained for mounded bullet as per M.B. Lal committee Report. The project is under progress
11
A detailed risk analysis based on maximum credible accident analysis should be done once the process design and layout frozen. Based on this a disaster management plan has to be prepared and after approval of the nodal agency, should be submitted to this ministry within 6 months.
Detailed risk analysis was prepared and the report was submitted to MoEF. a) On site emergency plan exists and mock drills are
conducted time to time to verify effectiveness of the plan as per OISD guidelines.
b) Off site emergency plan approved by District authorities exists. Mock drills are conducted time to time to verify effectiveness of the plan in co-ordination with district authorities.
Sr. No General Conditions Compliance Status
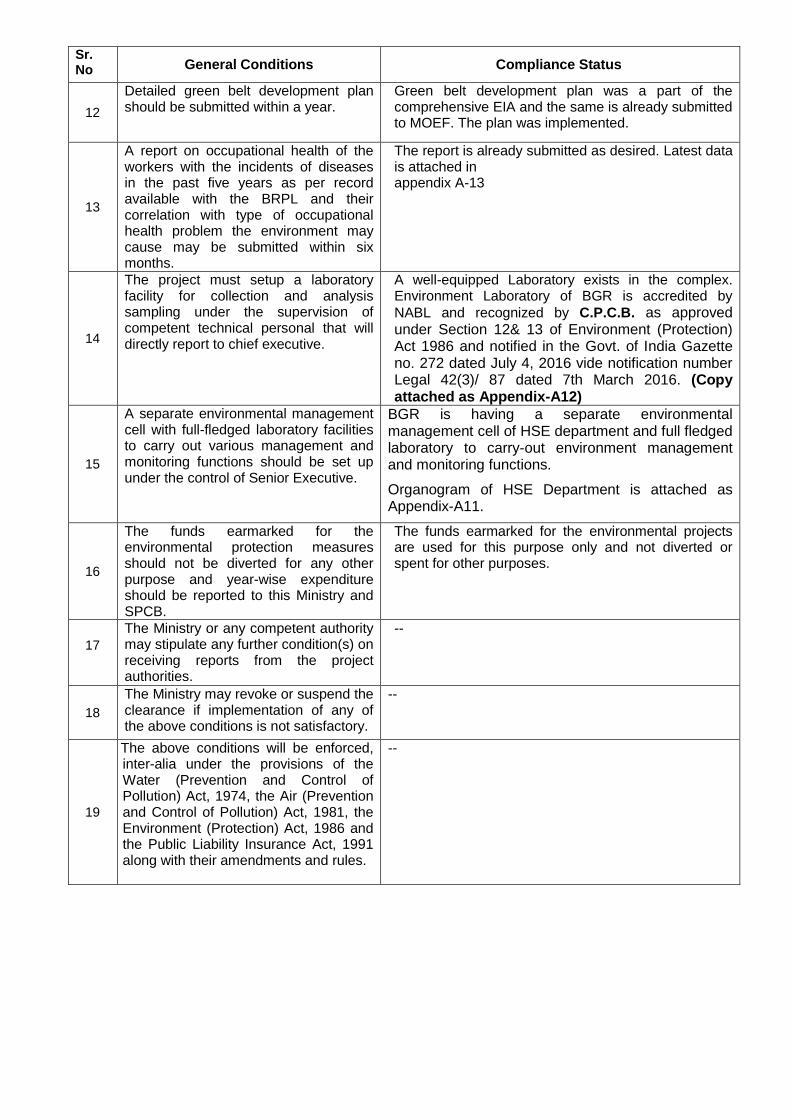
12
Detailed green belt development plan should be submitted within a year.
Green belt development plan was a part of the comprehensive EIA and the same is already submitted to MOEF. The plan was implemented.
13
A report on occupational health of the workers with the incidents of diseases in the past five years as per record available with the BRPL and their correlation with type of occupational health problem the environment may cause may be submitted within six months.
The report is already submitted as desired. Latest data is attached in appendix A-13
14
The project must setup a laboratory facility for collection and analysis sampling under the supervision of competent technical personal that will directly report to chief executive.
A well-equipped Laboratory exists in the complex. Environment Laboratory of BGR is accredited by
NABL and recognized by C.P.C.B. as approved under Section 12& 13 of Environment (Protection) Act 1986 and notified in the Govt. of India Gazette no. 272 dated July 4, 2016 vide notification number Legal 42(3)/ 87 dated 7th March 2016. (Copy attached as Appendix-A12)
15
A separate environmental management cell with full-fledged laboratory facilities to carry out various management and monitoring functions should be set up under the control of Senior Executive.
BGR is having a separate environmental management cell of HSE department and full fledged laboratory to carry-out environment management and monitoring functions.
Organogram of HSE Department is attached as Appendix-A11.
16
The funds earmarked for the environmental protection measures should not be diverted for any other purpose and year-wise expenditure should be reported to this Ministry and SPCB.
The funds earmarked for the environmental projects are used for this purpose only and not diverted or spent for other purposes.
17
The Ministry or any competent authority may stipulate any further condition(s) on receiving reports from the project authorities.
--
18
The Ministry may revoke or suspend the clearance if implementation of any of the above conditions is not satisfactory.
--
19
The above conditions will be enforced, inter-alia under the provisions of the Water (Prevention and Control of Pollution) Act, 1974, the Air (Prevention and Control of Pollution) Act, 1981, the Environment (Protection) Act, 1986 and the Public Liability Insurance Act, 1991 along with their amendments and rules.
--

3.0 APPENDIX –A1
STACK MONITORING DATA: (1st April 2017 to 30th September 2017)
A. SO2 Emission (mg/Nm3):
Stacks Emission Std. Observed value
Min Avg. Max
CDU-I
Fo
r F
.O. =
170
0
Fo
r F
.G. =
50
19 277 450
CDU-II 20 309 448
DCU-I 14.89 132.3 448.4
DCU-II 21.18 346.5 449.5
CPP 13.65 272.7 449.9
Reformer 4.83 12.41 101
HO-1 4.62 13.28 79.53
Isomerisation 2.28 12.43 75.67
DHDT 3.32 22.16 152.1
HGU 0.5 5.034 249.7
SRU 53.91 359.8 554
GTG 23.84 55.96 228.1
B. B. NOX Emission (mg/Nm3):
Stacks
Emission Std. Observed value
Min Avg. Max
CDU-I
Fo
r F
.O. =
450
Fo
r F
.G. =
350
10 53 273 CDU-II 14 108 447 DCU-I 10.44 54.69 180.1 DCU-II 7.25 33.46 89.57
CPP 5.22 178.5 437.4
Reformer 12.59 73.8 106.2
HO-1 13.25 76.25 168.8
Isomerisation 12.79 63.45 71.94
DHDT 7 31.99 426.3
HGU 8.9 31.86 414.3 SRU No Analyser
GTG 15.85 41.77 254.3
C. PM Emission (mg/Nm3)
Stacks
Emission Std. Observed value
Min Avg. Max CDU-I
Fo
r F
.O. =
100
Fo
r F
.G. =
10
0.2 7.0 32
CDU-II 0.7 4.3 35
DCU-I 0.02 4.6 32
DCU-II 0.8 2.8 35
CPP 0.01 15.5 72
Reformer 0.2 1.3 14.2
HO-1/2 0.3 8.4 31
Isomerisation 0.01 3.1 56
DHDT 0.1 2.7 42.0
HGU 0.1 1.6 46.3
SRU 0.03 23.3 82.7
GTG 0.02 5.7 47.2

STACK MONITORING DATA: (1st April 2017 to 30thSeptember 2017)
D. CO Emission (mg/Nm3)
Stacks
Emission Std.
Observed value
Min Avg. Max
CDU-I
Fo
r F
.O. =
200
Fo
r F
.G. =
150
1.3 18.4 93
CDU-II 0.3 23.3 90
DCU-I 1.3 18.3 89
DCU-II 0.1 19.7 92
CPP 0.1 28.1 89
Reformer 0.7 20.1 41.4
HO-1/2 2.5 20 78
ISOMERISATION 1.2 19.9 71
DHDT 0.3 31.6 90.5
HGU 0.6 12.8 77.0
SRU 0.02 6.8 72.7
GTG 3.5 4.6 6.0
E. Ni + V Emission (mg/Nm3):
Stacks
Emission Std.
Observed value
Min Avg. Max
CDU-I
Fo
r F
.O. =
5
BDL BDL BDL
CDU-II BDL BDL BDL
DCU-I BDL BDL BDL
DCU-II BDL BDL BDL
CPP BDL BDL BDL
Reformer BDL BDL BDL
HO-1/2 BDL BDL BDL
ISOMERISATION BDL BDL BDL
DHDT BDL BDL BDL
HGU BDL BDL BDL
SRU BDL BDL BDL
GTG BDL BDL BDL

AMBIENT AIR QUALITY AROUND BGR COMPLEX (Average of monthly sample Schedule – VII)
(1st April 2017 to 30th September 2017)
Station Continuous Monitoring
Station
Near Tube Well
No.14
Near LPG Bottling
plant
Rural Health Centre
Bartala Rail Gate
Near TW No.7 in
Township
1 SO2 (Std. 50/80 μg/m3)
Min 1.6 4.5 4.5 4.5 4.5 BDL
Average 15.2 4.5 4.6 4.62 5.4 BDL
Max 59.9 4.5 4.8 4.8 6.5 BDL
No. of observation Continuous 52 52 52 52 52
2 NO2 (Std. 40/80 μg/m3)
Min 9.0 9.2 9.2 9.2 10.2 9.5
Average 9.1 14.5 14.0 14.0 14.3 15.3
Max 11.5 18.0 18.0 18.0 18.0 17.0
No. of observation Continuous 52 52 52 52 52
3 PM-10 (Std. 60/100 μg/m3)
Min 29.2 10.0 8.0 12.0 12.0 10.0
Average 29.7 39.6 40.8 43.1 45.1 39.2
Max 33.7 58.0 58.0 60.0 62.0 58.0
No. of observation Continuous 52 52 52 52 52
4 PM-2.5 (Std. 40/60 μg/m3)
Min 1.7 6.0 6.0 6.0 6.0 6.0
Average 6.0 17.0 18.2 19.3 20.1 17.2
Max 21.5 25.0 24.0 28.0 28.0 24.0
No. of observation Continuous 52 52 52 52 52
5 Ammonia (Std. 100/400 μg/m3)
Min 4.1 7.2 6.5 6.2 7.5 6.2
Average 4.5 7.6 7.3 7.7 8.2 6.7
Max 6.4 8.0 8.5 9.2 9.8 7.5
No. of observation Continuous 52 52 52 52 52
6 Pb (Std. 0.5/1.0 μg/m3)
Min BDL BDL BDL BDL BDL
Average BDL BDL BDL BDL BDL
Max BDL BDL BDL BDL BDL
No. of observation 52 52 52 52 52
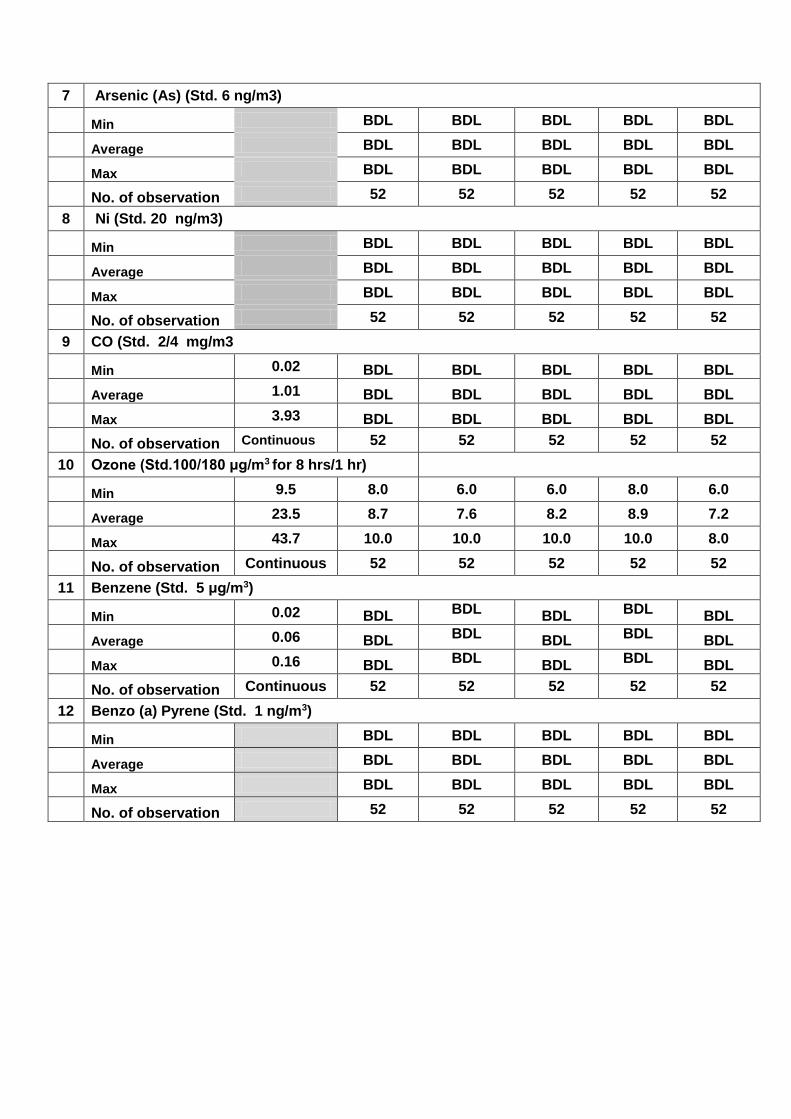
7 Arsenic (As) (Std. 6 ng/m3)
Min BDL BDL BDL BDL BDL
Average BDL BDL BDL BDL BDL
Max BDL BDL BDL BDL BDL
No. of observation 52 52 52 52 52
8 Ni (Std. 20 ng/m3)
Min BDL BDL BDL BDL BDL
Average BDL BDL BDL BDL BDL
Max BDL BDL BDL BDL BDL
No. of observation 52 52 52 52 52
9 CO (Std. 2/4 mg/m3
Min 0.02 BDL BDL BDL BDL BDL
Average 1.01 BDL BDL BDL BDL BDL
Max 3.93 BDL BDL BDL BDL BDL
No. of observation Continuous 52 52 52 52 52
10 Ozone (Std.100/180 μg/m3 for 8 hrs/1 hr)
Min 9.5 8.0 6.0 6.0 8.0 6.0
Average 23.5 8.7 7.6 8.2 8.9 7.2
Max 43.7 10.0 10.0 10.0 10.0 8.0
No. of observation Continuous 52 52 52 52 52
11 Benzene (Std. 5 μg/m3)
Min 0.02 BDL BDL BDL BDL
BDL
Average 0.06 BDL BDL BDL BDL
BDL
Max 0.16 BDL BDL BDL BDL
BDL
No. of observation Continuous 52 52 52 52 52
12 Benzo (a) Pyrene (Std. 1 ng/m3)
Min BDL BDL BDL BDL BDL
Average BDL BDL BDL BDL BDL
Max BDL BDL BDL BDL BDL
No. of observation 52 52 52 52 52

Average of Six Stations
Parameter SO2 NO2 PM-10
PM- 2.5
NH3
Pb
As
Ni
Benzo (a)
Pyrene CO
C6H6
O3
Unit μg/m3 ng/m3 mg/m3 μg/m3
NAAQ Std. 2009
50/ 80
40/ 80
60/ 100
40/ 60
100/ 400
0.5/ 1.0
Max 6
Max 20
Max 1
2/4 Max
5 100/ 180
Min 1.6 9.0 8.0 1.7 4.1 BDL BDL BDL BDL 0.02 0.02 6.00
Average 6.9 13.5 39.6 16.3 7.0 BDL BDL BDL BDL 1.01 0.06 10.68
Max 59.9 18.0 62.0 28.0 9.8 BDL BDL BDL BDL 3.93 0.16 43.70

4.0 APPENDIX-A2
Effluent Discharged (Figure in M3/Hr):( 1st April 2017 to 30thSeptember 2017)
A Industrial Effluent M3/Hr 180.4
B Domestic Effluent from BGR Township M3/Hr 50.8
C Total Effluent Treated (A + B) M3/Hr 231.2
D Treated Effluent Reused M3/Hr 226.8
E Effluent Discharged M3/Hr 4.3
F M 3 of Effluent discharged for 1000 tons of Crude processed 16.13
1. Treated Effluent Quality
(1st April 2017 to 30thSeptember 2017)
Sl. No
Parameter Std,2008 Min Avg. Max
1 pH value 6.0 - 8.5 6.5 7.2 8.5
2 Oil and Grease, mg/l 5.0 1.0 1.3 2.0
3 Bio-Chemical Oxygen Demand (3 Day at 27oC), mg/l
15.0 3.2 7.3 14.8
4 Chemical Oxygen Demand (COD), mg/l 125.0 40.0 65.2 100.0
5 Suspended solids, mg/l 20.0 3.0 6.0 15.0
6 Phenolic compounds (as C6H5OH), mg/l 0.35 0.01 0.04 0.08
7 Sulphide (as S), mg/l 0.50 0.11 0.21 0.40
8 CN mg/l 0.20 BDL BDL BDL
9 Ammonia as N, mg/l 15.0 0.70 1.18 1.80
10 TKN, mg/l 40.0 1.10 3.35 6.20
11 P, mg/l 3.0 0.22 0.60 0.80
12 Cr (Hexavalent), mg/l 0.10 - BDL -
13 Cr (Total), mg/l 2.0 - BDL -
14 Pb, mg/l 0.10 - BDL -
15 Hg, mg/l 0.01 - BDL -
16 Zn, mg/l 5.0 - 0.20 -
17 Ni, mg/l 1.0 - BDL -
18 Cu, mg/l 1.0 - 0.10 -
19 V, mg/l 0.20 - BDL -
20 Benzene, mg/l 0.10 - BDL -
21 Benzo (a) pyrene, mg/l 0.20 - BDL -

EFFLUENT QUALITY
2. Final Outlet (From the Complex) Effluent Quality
(1st April 2017 to 30th September 2017)
Sl. No.
Parameter Std 2008 Min Avg. Max
1 pH value 6.0 - 8.5 6.5 7.3 8.5
2 Oil and Grease, mg/l 5.0 1.0 1.6 2.4
3 Bio-Chemical Oxygen Demand (3 Days at 27o C), mg/l
15.0 3.6 7.5 14.2
4 Chemical Oxygen Demand (COD), mg/l 125.0 40.0 66.7 101.0
5 Suspended Solids, mg/l 20.0 3.0 5.2 12.0
6 Phenolic compounds (as C6H5OH), mg/l 0.35 0.01 0.06 0.25
7 Sulphide (as S), mg/l 0.50 0.06 0.27 0.48
8 CN, mg/l 0.20 BDL BDL BDL
9 Ammonia as N , mg/l 15.0 0.00 1.38 2.60
10 TKN, mg/l 40.0 0.00 3.80 7.90
11 P, mg/l 3.0 0.00 0.39 0.80
12 Cr (Hexavalent), mg/l 0.10 - BDL -
13 Cr (Total), mg/l 2.0 - BDL -
14 Pb, mg/l 0.10 - BDL -
15 Hg, mg/l 0.01 - BDL -
16 Zn, mg/l 5.0 - BDL -
17 Ni, mg/l 1.0 - BDL -
18 Cu, mg/l 1.0 BDL -
19 V, mg/l 0.20 - BDL -
20 Benzene, mg/l 0.10 - BDL -
21 Benzo (a) pyrene, mg/l 0.20 - BDL -

5.0 APPENDIX - A3
Tree Plantation (1st April 2017 to 30th September 2017)
The entire area inside BGR covered with greenery through massive plantation activities. Through massive plantation work and by giving protection to natural forest growth in side BGR premises, the entire area has become green. The entire plant area where processing plant facilities do not exist has a green cover. This helps in reduction of noise and air pollution level in one hand while on the other hand provides protection to ecological features of the area. The refinery has an excellent quality environment around its complex. Natural greenery can be seen all around the complex and in all seasons of the year.
Tree Census was done by Divisional Forest Office, Chirang. As per census, 84545 numbers of plants which include trees including shrubs, ocular estimated 33000 numbers bamboos in 1150 no. bamboo culms and also trees planted by BGR during 2003 to 2012.
During, 1st April 2017 to 30st September 2017 BGR has planted 29400 nos. of trees.
NEW GREEN BELT IN OLD DEBRIS YEARD TOWNSHIP PLANTATION
TOWNSHIP PLANTATION BIRHANGAON STATE DISPENSARY PLANTATION

APPENDIX – A 4
Additional Information (1st April 2017 to 30th September 2017)
Effluent reused during the period was around 98.13 % of the total effluent treated which includes plant effluent as well as BGR Township sewer.
Under the Leak Detection and Repair programme (LDAR), BGR is conducting quarterly Fugitive Emission Survey. During the period from 1st April 2017 to 30th September 2017, 23519 potential leaky points checked and 163 Leaky points detected and rectified. By following LDAR programme in true spirit, the company could not only avoid potential loss of 100.96 MTA (approx.) of light Hydrocarbon to the atmosphere through fugitive sources but also able to keep healthy work environment in the plants.
To ensure work area quality and health of equipments, quarterly noise survey was conducted covering all the operating plants, control rooms and ambient surrounding the BGR. During 1st April 2017 to 30th
September 2017, Noise Survey for two quarters of 2016 -17 has been completed and no abnormality was reported.
As a measure of Hazardous Waste Management, M/s Balmer Lawrie & Co. Limited was awarded the contract of mechanized treatment of tank bottom sludge. Melting pit facility is available for recovering oil from oily sludge.
One old slurry thickener from Petrochemical section was converted to confined space bio-remediation reactor to treat oily sludge with help from IOCL-R&D. The process of bio-remediation started from July 2017 and at present per batch approximately 35 m3 of oily sludge is being processed.
Bio-remediation facility of BGR
Further two more Rain Water Harvesting (Ground Water Recharging) schemes in BGR Township have been implemented during 2016-17.
6.0
APPENDIX –A5
Quarterly Fugitive emission Data (1st April 2017 to 30th September 2017)
FUG EMISSION DATA 1ST QTR 17-18.docx
FUG EMISSION DATA 2ND QTR 17-18.docx

8.0
APPENDIX-A6 (a)
Haz Waste Return FORM-4 (2016-17).docx

9.0
Annexure –A6 (b)
Authorization from PCBA for Hazardous Waste (Management, Handling and Transboundary Movement Rules 2008)
Consent under HW Rules 2008.pdf

10.0
APPENDIX-A7
Detail of Waste water treatment and disposal system.

11.0
ANNEXURE-A8
Quarterly Noise Survey Data
HSE (ENVIRONMENT) DEPARTMENT
NOISE SURVEY DATA 1ST QTR 17-18.docx
NOISE SURVEY DATA 2ND QTR 17-18 - Copy.docx

12.0
ANNEXURE-A9
Rain Water Harvesting Data
Status of Rainwater Harvesting
Sl. No
Location Rooftop
Area In M2
Volume of Rainwater harvesting
potential (CUM)
Year of implementation
Implemented
1 Rainwater Harvesting at Manjeera Guest House 677 1733 2008-09
2 Rainwater Harvesting at Deoshri Guest House 581 1487 2008-09
3 Mandir Complex 833 2132 2011-13
4 MANAS GUEST HOUSE 639 1636 2011-13
5 BRPL VIDYALAYA 1361 3484 2011-13
6 DPS BLOCK-I 704 1802 2011-13
7 DPS BLOCK-II 1810 4634 2011-13
8 Artificial Recharge thru’ TW # 3 Roof Top water from Canteen, Cycle/Scooter Shades, CISF bldg. etc.
3134 8023 2011-13
9 Rainwater Harvesting from roof top area of Champa Club
1080 3100 2013-14
10 Rainwater Harvesting from roof top area of Refinery Club Cum Community Centre
2833 8132 2013-14
11 Rain Water Harvesting at CISF ADM Building 825 2368 2014-15
12 Rain Water Harvesting at BGREU Office 275 789 2014-15
13 CISF Barrack 1050 3013 2015-16
14 BGR Community Hall 650 1865 2015-16
15 Gallery of Football Stadium (BGR Township) 988 2529
2016-17
16 Gallery of Volleyball Stadium (BGR Township)
Total 17440 46727

13.0 ANNEXURE-A10
Screen Shot of IOCL Website upload of report
Link: https://iocl.com/Talktous/SNotices.aspx

14.0
APPENDIX-A11
HSE Organogram of IOCL-BGR

15.0
ANNEXURE-A12
Gazette Notification of BGR Quality Control laboratory (QC Lab) approval under Environment (Protection) Act 1986.

16.0
Appendix-A13
Employees Occupational Heath Check up Status
0
200
400
600
800
1000
1200
1400
1600
2012-13 2013-14 2014-15 2015-16 2016-17 2017-18 1sthalf
Employees Occupational Health Check up Statuds
Total no. ofemployeescalled
Total no. ofemployeesattended
PercentageCompliance

17.0 Appendix-A14
Flare system.