Embed Size (px)
Citation preview

8122019 Referral Rates Direct Indirect Costs 121713
httpslidepdfcomreaderfullreferral-rates-direct-indirect-costs-121713 114
athenahealth IncPublished October 2012
ReferralViewSM
A First Look at National Referral Patterns from
Primary Care Practices
8122019 Referral Rates Direct Indirect Costs 121713
httpslidepdfcomreaderfullreferral-rates-direct-indirect-costs-121713 214
8122019 Referral Rates Direct Indirect Costs 121713
httpslidepdfcomreaderfullreferral-rates-direct-indirect-costs-121713 314
8122019 Referral Rates Direct Indirect Costs 121713
httpslidepdfcomreaderfullreferral-rates-direct-indirect-costs-121713 414
ReferralViewSM A First Look at National Referral Patterns from Primary Care Practices
wwwathenahealthcomwwwhalleyconsultingcom4
Te providers included in this study had over 25 million patient visit s mea sured as evaluation and management (EampM)encounters Tey made more than 200000 consult reerrals andalmost 350000 diagnostic reerrals during the study period
Te dataset contained one year o data July 2011 through June 2012 All providers in this study used athenaCollectorregathenahealthrsquos cloud-based billing and practice managementsystem and the athenaClinicalsreg EHR We limited the datato those providers who were lsquoestablishedrsquo in their utilizationo these integrated services that is they had been using thesystem or at least six months prior to the start o the studyIn addition providers with reerral rates in the top and bottomtenth o the dataset were considered outliers and thus excludedrom the analysis
For each reerring specialty we calculated a reerral rate or1) specialty consult referral
s that is reerrals to specialty physicians and 2) diagnostic referrals or reerrals or testingand diagnostic services o calculate a providerrsquos reerral rate wedivided the total number o reerrals that a provider sent outthrough the athenaClinicals system by the total number o
patient EampM visits
o understand what drives a providerrsquos reerral habits we testedcorrelations between the PCP reerral rate and several key practiceactors including
bull Reerral Rate Collections wRVUbull Reerral Rate Median Patient Agebull Reerral Rate Coding Indexbull Reerral Rate Physician Productivity (wRVUs and visits)
Please see the appendix or ull definitions o terms
Pediatricians and amily practitioners both routinely madereerrals to pediatric-specific subspecialties such as pediatriccardiology and pediatric oncology In localities where specific
pediatric subspecialties are avai lable we would iner that thereerral preerence would be to the pediatric subspecialtyhowever reerring providers do not all have access to the ullcomplement o pediatric subspecialties Tereore to normalizethe data and capture the directional intent o the reerral the
pediatric subspecialty was paired with the corresponding adult
subspecialty in our tabulations Tis can yield a ldquoservice linerdquo perspective when considering the reerral rates to cardiacspecialties or example and captures the impact o the pediatricsubspecialty reerrals to that service line
Key FindingsOverall the primary care specialties included in this analysismdashamily practice internal medicine obstetrics and gynecologyand pediatricsmdashreerred at a rate o 8 or specialty consultsTere was a wide range however o reerral rates amongspecialties as seen in Figure 2
FIGURE 2 REFERRAL RATES FOR PRIMARY CARE PROVIDERS
Type ofPractice
ConsultReferralRate
DiagnosticReferralRate
TotalReferralRate
Family Practice 11 14 25
Internal Medicine 11 18 29
OBGYN 20 29 31
Pediatrics 35 22 57
Referral rate is defined as the referrals made as a percentage of total EampM visits
Family practice and internal medicine providers reerred at a rateo 25 and 29 respectively Tis underscores the large volumeo reerrals that these primary care practices must managePediatrics handled ewer reerrals most o which were or consultsand not diagnostic ser vices OBGYN reerred the most ordiagnostic services such as ultrasound and mammogram and hadthe lowest reerral rate or consults
8122019 Referral Rates Direct Indirect Costs 121713
httpslidepdfcomreaderfullreferral-rates-direct-indirect-costs-121713 514
ReferralViewSM A First Look at National Referral Patterns from Primary Care Practices
wwwathenahealthcomwwwhalleyconsultingcom 5
FIGURE 3 CONSULT AND DIAGNOSTIC
REFERRAL RATES BY SPECIALTY
Overall the top reerred-to specialties includedbull Gastroenterologybull Orthopedic Surgery bull Physical Terapy bull Dermatology bull EN
X-rays ultrasounds and mammograms were the most requentlyreerred-out diagnostic services among the primary care specialties
Regional TrendsTere were variations in the reerral rates by region Across the
primary care specialties o amily practice internal medicineand pediatrics reerral rates were highest in the West andNortheast OBGYN a specialty with both primary care andsubspecialty characteristics had little regional difference inreerral rates Figure 4 shows the regional differences in consultreerral rates among the PCP practices we studied
FIGURE 4 REGIONAL DIFFERENCES IN CONSULT
REFERRAL RATES
RegionFamilyPractice
InternalMedicine
Pediatrics OBGYN
Midwest 95 11 25 20
South 10 10 27 29
West 13 14 30 18
Northeast 11 14 38 17
We hypothesize that a uture segmentation o OBGYN practicesinto primary care (ie those practices that are predominantlyobstetrics) and specialty care (ie those practices that are
predominantly gynecology) wou ld show a similar reerr al pattern to those seen with the other pri mar y care practices with lower reerral s in the Midwest and Sout h
FIGURE 5 OVERALL CONSULT REFERRAL RATES BY REGION
NORTHEAST MIDWEST
WEST
SOUTH
103 81
62
98
Consult Referrals
Gastroenterology
Physical Therapy
Dermatology
Ortho SurgeryGeneral
OBGYN Maternalamp Fetal Med
torhinolaryngology
Surgery General
Cardiology
Ophthalmology
Urology
Neurology
Podiatry General
130
116
55
75
00
41
42
46
42
30
35
55
0 100
F Faammiillyy PPrraaccttiiccee
162
84
67
67
00
46
48
60
55
36
39
39
0 100
IInntteerrnnaall MMeeddiicciinnee
37
36
93
86
00
126
33
41
67
35
46
15
0 100
PPeeddiiaattrriicc MMeeddiicciinnee
162
41
24
03
231
03
63
22
03
47
15
01
0 x x x x
x x x x
100
OOBBGGY YNN
Diagnostic Referrals
X-Ray
Ultrasound
Mammogram
ECG
BoneDexa
MRI
CT
Audio
Echo
StressCardiac
0 100
F Faammiillyy PPrraaccttiiccee
0 100
IInntteerrnnaall MMeeddiicciinnee
0 100
PPeeddiiaattrriicc MMeeddiicciinnee
0 100
OOBBGGY YNN
586
118
01
48
00
31
27
100
15
00
06
449
349
06
54
05
05
00
00
00
241
123
162
163
79
50
57
04
23
18
329
135
190
71
46
67
56
04
20
13
x x x x
x x x x
8122019 Referral Rates Direct Indirect Costs 121713
httpslidepdfcomreaderfullreferral-rates-direct-indirect-costs-121713 614
ReferralViewSM A First Look at National Referral Patterns from Primary Care Practices
wwwathenahealthcomwwwhalleyconsultingcom6
We hypothesize that the regional variations observed across thespecialties o amily practice internal medicine and pediatricscan be explained by the ollowing actors
1 PREDOMINANCE OF RURAL AREAS IN THE MIDWEST
AND SOUTH Te Midwest and the South have the highest percentage o r ural residents3 We speculate that lowerreerral rates in rural areas are due primarily to the decreasedavailability o specialists (ie ewer reerral options) Tereorerural providers may practice a wider scope o medicine out onecessity Te coding levels (coding index) o providers in thosemore rural regions support this perception
2 PENETRATION OF HMOS IN THE WEST AND NORTHEAST
Research rom Kaiser shows that HMOs which typical lyrequire a direct reerral rom the primary care provider oraccess to specialty physicians have a more significant presence
in the West and Northeast
4
where reerral rates are higherIt should be noted that not all HMOs consider OBGYNto be a primary care specialty
3 HIGHER MEDIAN PATIENT AGE IN THE WEST Reerralrates in the West were the highest or both amily practiceand internal medicine As shown in Figure 6 the median ageo patients in the West was highest as well It is possible thatolder patients were driving increased reerral rates
FIGURE 6 MEDIAN PATIENT AGE FOR FAMILY PRACTICE
AND INTERNAL MEDICINE
Region FP Median Age IM Median Age
Midwest 49 62
South 49 63
West 53 65
Northeast 51 55
Detailed Findings Family PracticeSPECIALTY CONSULT REFERRALS
Family practitioners have an 11 reerral rate or specialtyconsults Gastroenterology physical therapy and orthopedicsurgery were the top reerred-to specialties
FIGURE 7 TOP REFERRED-TO SPECIALTIES BY FAMILY
PRACTITIONERS
Referred-to Specialty Per-Visit Referral Rate
Gastroenterology 16
Physical Therapist 14
Orthopedic Surgery General 09
Podiatry General 07
Dermatology 07
Cardiology 06
EndocrinologyMetabolism 05
Surgery General 05
Ophthalmology 05
Otorhinolaryngology 05
DieticianNutritionist 04
Neurology 04
Urology 04
Psychiatry General 03
Optometrist 03
8122019 Referral Rates Direct Indirect Costs 121713
httpslidepdfcomreaderfullreferral-rates-direct-indirect-costs-121713 714
ReferralViewSM A First Look at National Referral Patterns from Primary Care Practices
wwwathenahealthcomwwwhalleyconsultingcom 7
CONSULT REFERRALS ndash DATA CORRELATIONS
o understand what drives a providerrsquos reerral habits we testedcorrelations between the amily practitionerrsquos reerral rate andseveral key practice actors First we examined whether or not a
providerrsquos productivity or workload impacted his or her reerral
rate In other words does a provider with a high patient load reerout at a greater rate simply because he or she does not have thetime to treat the patient For amily practitioners no significantcorrelation was ound between productivity levels and reerral rates
A slight negative correlation was observed between the providerrsquosreerral rate and hisher collections per work RVU Collectionsare generally lower in practices serving a lower socioeconomic
patient base so it would seem that lower income patients arereerred out at a higher rate than more affluent patients We alsocompared the median age o the providerrsquos patient base to thereerral rate but ound no significant correlation
FAMILY PRACTICE DIAGNOSTIC REFERRALS
Family practitioners reerred out to diagnostic services at a rateo 14 X-rays mammograms and ultrasounds were the mostcommon o these reerrals Chest x-rays were by ar the mostcommon x-rays ordered by amily practitioners
FIGURE 8 TOP DIAGNOSTIC REFERRALS BY FAMILY
PRACTITIONERS
Modality Referral Rate Visit
X-ray 45
Mammogram 26
Ultrasound 19
ECG 1
MRI 09
Detailed Findings Internal MedicineSPECIALTY CONSULT REFERRALS
Te reerral rate or internal medicine physicians in this study was 11 As with ami ly practice gastroenterology physicaltherapy and orthopedic surgery were the top reerred-to specialtiesHowever or internists ga stroenterology represents a larger
percentage o total consult reerrals at 16 compared to amily practice reerrals to gastroenterology at 13
FIGURE 9 TOP REFERRED-TO SPECIALTIES BY INTERNAL
MEDICINE PROVIDERS
Referred-to Specialty Per-Visit Referral Rate
Gastroenterology 11
Physical Therapist 06
Orthopedic Surgery General 04
Dermatology 04
Cardiology 04
Ophthalmology 04
Surgery General 03
Otorhinolaryngology 03
Podiatry General 03
Neurology 03
Urology 02
OBGYN Gynecology (Only) 02
Anesthesiology Pain Management 02
EndocrinologyMetabolism 01
8122019 Referral Rates Direct Indirect Costs 121713
httpslidepdfcomreaderfullreferral-rates-direct-indirect-costs-121713 814
ReferralViewSM A First Look at National Referral Patterns from Primary Care Practices
wwwathenahealthcomwwwhalleyconsultingcom8
CONSULT REFERRALS ndash DATA CORRELATIONS
In the case o internal medicine there was not a significantcorrelation between provider productivity level and reerralrates or between collections and the reerral rate Tere washowever a statistica lly signi icant negative correlation
between the median age o the internal medicine providerrsquos patient base and the reerral rate Tis correlation reveals thathigher reerral rates are associated with a younger patient
population an apparent contradiction to the previoussupposition about older patients driving higher reerral ratesTat overall relationship is driven by the substantially highernumber o amily practice providers within the sample set(our to one relative to internal medicine) Further a nalysiso the age group data or the internal medicine patient basereveals that there is a ldquosweet spotrdquo in the 45-65 age range orinternal medicine patients where the reerral rates are highestBeyond that age range the reerral rates decline We speculate
that this may be because older patients already have relation-ships established with certain specialists due to prior or chronicallyoccurring conditions Younger patients may be encounteringthese medical issues or the first time and consequently wouldbe in need o that initial reerral
INTERNAL MEDICINE DIAGNOSTIC REFERRALS
Diagnostic reerrals occurred at a rate o 18 o all internalmedicine visits approximately 4 higher than the reerralrate o amily practitioners As with amily practice x-ray wasthe most commonly reerred modality However as a percento total reerrals the utilization o x-rays was almost hal thato their amily practice peers Dexa scans were the fifh mostutilized diagnostic and reflect the older patient base seen bythis primary care specialty
FIGURE 10 TOP DIAGNOSTIC REFERRALS BY INTERNAL
MEDICINE
Modality Per-Visit Referral Rate
X-ray 43
ECG 29
Mammogram 29
Ultrasound 22
BoneDexa 12
Detailed Findings PediatricsSPECIALTY CONSULT REFERRALS
Pediatricians had a 35 reerral rate one o the lower per-visitconsult reerral rates Te most requent reerred-to specialtiesby pediatricians included EN dermatology and orthopedicsurgery
FIGURE 11 TOP REFERRED-TO SPECIALTIES BY PEDIATRICIANS
Referred-to Specialty Per-Visit Referral Rate
Otorhinolaryngology 03
Dermatology 022
Orthopedic Surgery General 02
Ophthalmology 016
AllergyImmunology 013
Neurology 011
Cardiology 01
Audiologist 009
Gastroenterology 009
Speech Therapist 008
Physical Therapist 008
Urology 008
Surgery General 008
Psychiatry General 007
Pediatrics General 006
Tere was considerable variation in the reerral patterns o pediatricians regarding decisions to reer to the adult subspe-cialty versus reerring to the corresponding pediatric subspecialty(eg cardiology vs pediatric cardiology) As previously discussed
we suspect that the specialty selection is driven by the availabilityo the pediatric subspecialty in the market In general pediatric
patients were most ofen reerred specifically to the pediatricsubspecialist when the reerral was in the area o ophthalmologycardiology gastroenterology urology general surgery and
psychiatry Interestingly when the issue was related to ENdermatology and neurology the reerral was more ofen madeto the adult subspecialty
8122019 Referral Rates Direct Indirect Costs 121713
httpslidepdfcomreaderfullreferral-rates-direct-indirect-costs-121713 914
ReferralViewSM A First Look at National Referral Patterns from Primary Care Practices
wwwathenahealthcomwwwhalleyconsultingcom 9
FIGURE 12 PEDIATRIC VS ADULT SPECIALTY REFERRALS BY
PEDIATRICIANS
Referred-toSpecialty
of ReferralsDirected toPediatricSubspecialty
of ReferralsDirectedto AdultSubspecialty
Otorhinolaryngology 19 81
Dermatology 30 70
Orthopedic SurgeryGeneral 40 60
Ophthalmology 76 24
AllergyImmunology NA NA
Neurology 27 73
Cardiology 76 25
Audiologist NA NA
Gastroenterology 79 21
Speech Therapist NA NA
Physical Therapist NA NA
Urology 75 25
Surgery General 87 13
Psychiatry General 70 30
Pediatrics General 11 99
CONSULT REFERRALS ndash DATA CORRELATIONS
Pediatrician reerral rates were significantly correlated with the pediatriciansrsquo collections per work RVU Te negative correlationindicated that the lower the providerrsquos collections per work RVUthe higher the reerral rate Te negative correlation or the specialtyo pediatrics was stronger than the correlation ound in amily
practice or the same two variables In pediatrics low collections
are typical in practices with high Medicaid patient populationsand Medicaid patients may be more likely to wait to access careuntil their symptoms are more serious5 We speculate that as aresult the chances that a consult reerral will be required increasedor patients in this socioeconomic group No other significantcorrelations were ound with the pediatric reerral data
PEDIATRIC DIAGNOSTIC REFERRALS
O the primary care specialties pediatricians were the least requentutilizers o diagnostic services with a reerral rate o only 22Te majority o diagnostic reerrals were or x-rays and the mostrequently ordered x-rays were or the chest oot and abdomen
en percent o all diagnostic reerrals were or audiology-relateddiagnostics such as audiometry and tympanograms
FIGURE 13 TOP DIAGNOSTIC REFERRALS BY PEDIATRICIANS
Modality Per-Visit Referral Rate
X-ray 13
Ultrasound 03
Audio 02
ECG 01
MRI 01
8122019 Referral Rates Direct Indirect Costs 121713
httpslidepdfcomreaderfullreferral-rates-direct-indirect-costs-121713 1014
ReferralViewSM A First Look at National Referral Patterns from Primary Care Practices
wwwathenahealthcomwwwhalleyconsultingcom10
Detailed FindingsObstetrics amp Gynecology SPECIALTY CONSULT REFERRALS
Obstetrics and Gynecology physicians reerred out at a rate o3 notably lower than the other specialties OBGYNs reerredin the highest proportions to the obstetrical subspecialty omaternal and etal medicine Reerrals to general surgeons werealso notably high and were presumably made or surgerytreatment afer an irregular mammogram or pap smear
FIGURE 14 TOP REFERRED-TO SPECIALTIES BY OBGYNS
Referred-to Specialty Per-Visit Referral Rate
OBGYN Maternal amp Fetal Med 047
Gastroenterology 033
Surgery General 013
OBGYN Urogynecology 010
Urology 010
Physical Therapist 008
Surgery Breast 005
Dermatology 005
OBGYN Gynecological Oncology 005
ObstetricsGynecology General 005
Cardiology 004
EndocrinologyMetabolism 004
OBGYN Reproductive Endocrinology 004
Neurology 003
OBGYN Gynecology (Only) 003
CONSULT REFERRALS - DATA CORRELATIONS
Several statistically significant correlations were noted duringthe analysis o the OBGYN reerral and productivity data Wesaw a negative correlation between an OBGYNrsquos reerral rateand the median age o hisher patient base Tat is the youngerthe patient base the higher the reerral rate Given that themost requently reerred-to specialty was maternal and etalmedicine it stands to reason that younger patients (those ochildbearing age) might incur a higher reerral rate
We also saw a negative correlation between collections per workRVU and the reerral rate with the OBGYN dataset suggestingthat the providers serving lower income patients tended to see
patients with more acute issues that required a consult reerral
Productivity was also negatively correlated with the providerrsquosreerral rate Tat is the higher the providerrsquos productivity(both in terms o work RVUs and visits) the less l ikely he orshe was to reer out Tis may suggest that the more productive
physician practiced a wider scope o his or her specialty decreasingthe need to reer out
OBSTETRICS amp GYNECOLOGY DIAGNOSTIC REFERRALS
O the primary care specialties evaluated OBGYNs werethe highest utilizers o diagnostic services with a reerral rate o28 As expected or the patient population ser ved the va stmajority o reerrals were or ultrasounds and mammograms
FIGURE 15 TOP DIAGNOSTIC REFERRALS BY OBGYNS
Modality Per-Visit Referral Rate
Ultrasound 13
Mammogram 10
BoneDexa 16
Sonogram 02
X-ray 02
Using Referral Data to PredictPatient Volume and Revenue983121uantiying the downstream value o a specialistrsquos business
particularly a surgeonrsquos has been evaluated in previously published studies6 By incorporating the more elusive componento the equationmdashthe volume o patients that PCPs drive to thosespecialistsmdashplanners and other administrators can provide acomprehensive orecast o the direct and indirect impact o aPCP on downstream activity
Te data in this report combined with data rom a typicalbilling and clinical management system can be used to measurethe effect o a primary care provider on specialistsrsquo patient volumeand revenue o illustrate we have provided an example usingamily practice reerrals to an orthopedic surgeon
According to data presented in this paper a typical family practice provider generates referrals at a rate of 11 referrals per100 visits According to athenahealth data a typical family
practice has about 4100 patient visits annually Terefore a
8122019 Referral Rates Direct Indirect Costs 121713
httpslidepdfcomreaderfullreferral-rates-direct-indirect-costs-121713 1114
ReferralViewSM A First Look at National Referral Patterns from Primary Care Practices
wwwathenahealthcomwwwhalleyconsultingcom 11
typical family practice provider will generate about 451 referralsannually Using data presented in this paper we see that family
practice providers referred to orthopedic surgeons at a rate of09 Terefore we can calculate that about 37 of the 451 referrals
will be directed to orthopedic surgery
Te orthopedic practice can use its medical billing and clinicalmanagement system to calculate the yield of those referrals bylooking at the historical utilization of services by a new patientin their practice For example on average 37 referrals into the
practice might translate into
bull 74 patient visits (both new and ollow up)bull 59 in-office diagnosticsbull 21 office proceduresbull 99 outpatient proceduressurgeriesbull 33 inpatient proceduressurgeriesbull
12 reerrals out or diagnosticsbull 7 reerrals to other specialists (ie physical therapy)
While specialists obtain patients through channels other thanthrough PCP referrals this extrapolation provides service linemanagers with a methodology for forecasting three importantmetrics 1) diagnostic demand 2) OR (facility) demand and 3)specialty physician demand By determining the typical serviceline utilization (ie cases diagnostics) of a new patient we canattach market-specific per-case or per-diagnostic contributionmargins to forecast the downstream effect of the new patientreferral Monitoring the demand for physicians who support
various service lines ensures that market demand is in alignment
with the supply of those physicians and becomes a criticalcomponent of medical staff development planning
The Value of UnderstandingPatient Referral Flow Te data presented here provide a ramework or assessingthe volume and value o reerrals to various specialties rom
primary care providers It reinorces the value o primary care providers in the medical services demand chain at a time whenthere is a nationwide shortage o primary care providers In
addition findings point to the importance o having a robustreerral management system in place or medical practices andhealthcare systems
Primary care reerral rates are a undamental metric in developinghospitalsrsquo medical staff specialties A hospitalrsquos ldquoMedical StaffComplementrdquo is the mix o physician specialties and otherhealthcare proessionals required to meet patient demand andto remain technologically and operationally viable Te data
presented here can significantly inorm this planning process
Using data in this report a healthcare system can answerquestions such as
bull How much downstream business should we expect roman employed primary care physician
bull What kind o diagnostic service utilization should weexpect rom an OBGYN
bull How many patient reerrals are lsquoleakingrsquo out o ourintegrated delivery model
bull How many primary care providers are necessary in orderto support an orthopedic surgeon
In addition the data presented here provide a gauge to indicate whether or not a specialty physicianpractice is the provider oldquochoicerdquo among reerring physicians7 Tat is it is possible todetermine whether certain specialty physicians are attracting theoptimal number o reerrals rom primary care providers A recent
study
8
identifies ldquophysician communicationrdquo and patient accesscharacteristics as the most important actors afer clinical expertisein contributing to the selection o a reerred-to physician Tereorelooking at reerral rates or given providers could indicate thatmore attention might be needed to nurture reerral relationships
Te data in ReerralView can also be used by primary care providers and advocacy organizations to develop a morecomplete understanding o the downstream value o primarycare across the national health care system A survey in the
Journal o General Internal Medicine ound that 63 of PCPs
were dissatisfied with the referral process compared with
35 for specialists9 Tis study sheds additional light on the
reasons or that dissatisaction PCPs do a significant amounto work to get a reerral out the doormdashrom organizing datato selecting the appropriate provider to handling requiredinsurance paperwork New care coordination models such asathenahealthrsquos athenaCoordinatorreg service are shifing theburden or submitting and tracking reerral data rom the
provider to the receiving acility reducing the workload or PCPs
Reerral tracking can provide key insights into overall healthcare expenditure by helping researchers monitor the type and
volume o patient reerrals as medical providers implementACOs and other quality care improvements Future research
using ReerralView can also provide a more in-depth under-standing o the reerral path rom PCPs to specialties to helptrack and predict reerrals and understand care utilization withan eye toward reducing overall costs
he value o physician reerrals is tangible a nd determinableFor hospitals health systems and providers alike ReerralViewenables new insights into reerral patterns that can inorm planningand establish the transparency needed to create an equitable andsustainable market or health inormation exchange
8122019 Referral Rates Direct Indirect Costs 121713
httpslidepdfcomreaderfullreferral-rates-direct-indirect-costs-121713 1214
ReferralViewSM A First Look at National Referral Patterns from Primary Care Practices
wwwathenahealthcomwwwhalleyconsultingcom12
Appendix Data DefinitionsEampM Visit Te count o visits tabulated rom the billedin-patient and out-patient Evaluation and Management CPcodes that the provider generated during the study period
Reerral A documented request that the patient see a certainspecialty or seek a specific type o diagnostic test
Reerral Rate Reerrals made as a percentage o totalEampM visits
Coding index a measure o visit acuity calculated as workRVUs divided by EampM visits
Note Full reerral data wil l be included in the appendix o asubsequent version o this whitepaperndashavailable or downloadat athenahealthcom
End Notes1 How Many Other Doctors Do Primary Care Doctors Need toCoordinate Patient Care With Ann Intern Med 17 February2009150(4)I-44 Available at httpannalsorgarticleaspxarticleid=744335
2 Michael L Barnett MD Zirui Song BA Bruce E LandonMD MBA rends in Physician Reerrals in the United States1999-2009 Arch Intern Med 2012172(2)163-170 Availableat httparchintejamanetworkcomarticleaspxarticleid=1108675
3 Modernizing Rural Health Care Coverage 983121uality andInnovation United Healthcare Group July 2011 3 Availableat HYPERLINK ldquohttpwwwunitedhealthgroupcomhrmuhn_workingpaper6pdrdquowwwunitedhealthgroupcomhrm
uhn_workingpaper6pd4 Kaiser Family Foundation State Health Facts State HMOPenetration Rate ndash July 2011 Available at httpwwwstatehealthactsorgcomparemaptablejspcat=7ampind=349
5 Sommers AS Boukus E R Carrier E Dispelling MythsAbout Emergency Department Use Majority o MedicaidVisits Are or Urgent or More Serious Symptoms Center orStudying Health System Change No 23 July 2012 Availableat httpwwwhschangeorgCONEN13021302pd
6 Merritt Hawkins 2010 Physician InpatientOutpatient
Revenue Survey Available at httpwwwmerritthawkinscom pd2010_revenuesurveypd
7 Halley Marc D ldquoTe Economics o Physician IntegrationrdquoHealthcare Executive SeptemberOctober 2012 76-79
8 Barnett et al Reasons or Choice o Reerral PhysicianAmong Primary Care and Specialist Physicians Society oGeneral Internal Medicine 2011 Available at httpchristakismedharvardedupdpublicationsarticles131pd
9 Communication Breakdown in the Outpatient ReerralProcess J Gen Intern Med 2000 September 15(9) 626ndash631
Available at httpwwwncbinlmnihgovpmcarticlesPMC1495590
8122019 Referral Rates Direct Indirect Costs 121713
httpslidepdfcomreaderfullreferral-rates-direct-indirect-costs-121713 1314
8122019 Referral Rates Direct Indirect Costs 121713
httpslidepdfcomreaderfullreferral-rates-direct-indirect-costs-121713 1414
athenahealth Inc | 311 Arsenal Street | Watertown MA 02472 | 8668175738
copy 2012 athenahealth Inc All rights reserved
About athenahealth At athenahealth we offer the leading
cloud-based practice management EHR and care coordination services
that help medical groups get more money and more control of patient
care To learn how our services can help your organization contact us
at 8668175738 or athenahealthcom
About Halley Consulting Group The Halley Consulting Group
is a physician practice management and consulting rm specializing in
the strategic development and performance turnaround of both hospital-
owned medical practice networks and large independent medical ofces
Contact us at 8667065373 or halleyconsultingcom

8122019 Referral Rates Direct Indirect Costs 121713
httpslidepdfcomreaderfullreferral-rates-direct-indirect-costs-121713 714
ReferralViewSM A First Look at National Referral Patterns from Primary Care Practices
wwwathenahealthcomwwwhalleyconsultingcom 7
CONSULT REFERRALS ndash DATA CORRELATIONS
o understand what drives a providerrsquos reerral habits we testedcorrelations between the amily practitionerrsquos reerral rate andseveral key practice actors First we examined whether or not a
providerrsquos productivity or workload impacted his or her reerral
rate In other words does a provider with a high patient load reerout at a greater rate simply because he or she does not have thetime to treat the patient For amily practitioners no significantcorrelation was ound between productivity levels and reerral rates
A slight negative correlation was observed between the providerrsquosreerral rate and hisher collections per work RVU Collectionsare generally lower in practices serving a lower socioeconomic
patient base so it would seem that lower income patients arereerred out at a higher rate than more affluent patients We alsocompared the median age o the providerrsquos patient base to thereerral rate but ound no significant correlation
FAMILY PRACTICE DIAGNOSTIC REFERRALS
Family practitioners reerred out to diagnostic services at a rateo 14 X-rays mammograms and ultrasounds were the mostcommon o these reerrals Chest x-rays were by ar the mostcommon x-rays ordered by amily practitioners
FIGURE 8 TOP DIAGNOSTIC REFERRALS BY FAMILY
PRACTITIONERS
Modality Referral Rate Visit
X-ray 45
Mammogram 26
Ultrasound 19
ECG 1
MRI 09
Detailed Findings Internal MedicineSPECIALTY CONSULT REFERRALS
Te reerral rate or internal medicine physicians in this study was 11 As with ami ly practice gastroenterology physicaltherapy and orthopedic surgery were the top reerred-to specialtiesHowever or internists ga stroenterology represents a larger
percentage o total consult reerrals at 16 compared to amily practice reerrals to gastroenterology at 13
FIGURE 9 TOP REFERRED-TO SPECIALTIES BY INTERNAL
MEDICINE PROVIDERS
Referred-to Specialty Per-Visit Referral Rate
Gastroenterology 11
Physical Therapist 06
Orthopedic Surgery General 04
Dermatology 04
Cardiology 04
Ophthalmology 04
Surgery General 03
Otorhinolaryngology 03
Podiatry General 03
Neurology 03
Urology 02
OBGYN Gynecology (Only) 02
Anesthesiology Pain Management 02
EndocrinologyMetabolism 01
8122019 Referral Rates Direct Indirect Costs 121713
httpslidepdfcomreaderfullreferral-rates-direct-indirect-costs-121713 814
ReferralViewSM A First Look at National Referral Patterns from Primary Care Practices
wwwathenahealthcomwwwhalleyconsultingcom8
CONSULT REFERRALS ndash DATA CORRELATIONS
In the case o internal medicine there was not a significantcorrelation between provider productivity level and reerralrates or between collections and the reerral rate Tere washowever a statistica lly signi icant negative correlation
between the median age o the internal medicine providerrsquos patient base and the reerral rate Tis correlation reveals thathigher reerral rates are associated with a younger patient
population an apparent contradiction to the previoussupposition about older patients driving higher reerral ratesTat overall relationship is driven by the substantially highernumber o amily practice providers within the sample set(our to one relative to internal medicine) Further a nalysiso the age group data or the internal medicine patient basereveals that there is a ldquosweet spotrdquo in the 45-65 age range orinternal medicine patients where the reerral rates are highestBeyond that age range the reerral rates decline We speculate
that this may be because older patients already have relation-ships established with certain specialists due to prior or chronicallyoccurring conditions Younger patients may be encounteringthese medical issues or the first time and consequently wouldbe in need o that initial reerral
INTERNAL MEDICINE DIAGNOSTIC REFERRALS
Diagnostic reerrals occurred at a rate o 18 o all internalmedicine visits approximately 4 higher than the reerralrate o amily practitioners As with amily practice x-ray wasthe most commonly reerred modality However as a percento total reerrals the utilization o x-rays was almost hal thato their amily practice peers Dexa scans were the fifh mostutilized diagnostic and reflect the older patient base seen bythis primary care specialty
FIGURE 10 TOP DIAGNOSTIC REFERRALS BY INTERNAL
MEDICINE
Modality Per-Visit Referral Rate
X-ray 43
ECG 29
Mammogram 29
Ultrasound 22
BoneDexa 12
Detailed Findings PediatricsSPECIALTY CONSULT REFERRALS
Pediatricians had a 35 reerral rate one o the lower per-visitconsult reerral rates Te most requent reerred-to specialtiesby pediatricians included EN dermatology and orthopedicsurgery
FIGURE 11 TOP REFERRED-TO SPECIALTIES BY PEDIATRICIANS
Referred-to Specialty Per-Visit Referral Rate
Otorhinolaryngology 03
Dermatology 022
Orthopedic Surgery General 02
Ophthalmology 016
AllergyImmunology 013
Neurology 011
Cardiology 01
Audiologist 009
Gastroenterology 009
Speech Therapist 008
Physical Therapist 008
Urology 008
Surgery General 008
Psychiatry General 007
Pediatrics General 006
Tere was considerable variation in the reerral patterns o pediatricians regarding decisions to reer to the adult subspe-cialty versus reerring to the corresponding pediatric subspecialty(eg cardiology vs pediatric cardiology) As previously discussed
we suspect that the specialty selection is driven by the availabilityo the pediatric subspecialty in the market In general pediatric
patients were most ofen reerred specifically to the pediatricsubspecialist when the reerral was in the area o ophthalmologycardiology gastroenterology urology general surgery and
psychiatry Interestingly when the issue was related to ENdermatology and neurology the reerral was more ofen madeto the adult subspecialty
8122019 Referral Rates Direct Indirect Costs 121713
httpslidepdfcomreaderfullreferral-rates-direct-indirect-costs-121713 914
ReferralViewSM A First Look at National Referral Patterns from Primary Care Practices
wwwathenahealthcomwwwhalleyconsultingcom 9
FIGURE 12 PEDIATRIC VS ADULT SPECIALTY REFERRALS BY
PEDIATRICIANS
Referred-toSpecialty
of ReferralsDirected toPediatricSubspecialty
of ReferralsDirectedto AdultSubspecialty
Otorhinolaryngology 19 81
Dermatology 30 70
Orthopedic SurgeryGeneral 40 60
Ophthalmology 76 24
AllergyImmunology NA NA
Neurology 27 73
Cardiology 76 25
Audiologist NA NA
Gastroenterology 79 21
Speech Therapist NA NA
Physical Therapist NA NA
Urology 75 25
Surgery General 87 13
Psychiatry General 70 30
Pediatrics General 11 99
CONSULT REFERRALS ndash DATA CORRELATIONS
Pediatrician reerral rates were significantly correlated with the pediatriciansrsquo collections per work RVU Te negative correlationindicated that the lower the providerrsquos collections per work RVUthe higher the reerral rate Te negative correlation or the specialtyo pediatrics was stronger than the correlation ound in amily
practice or the same two variables In pediatrics low collections
are typical in practices with high Medicaid patient populationsand Medicaid patients may be more likely to wait to access careuntil their symptoms are more serious5 We speculate that as aresult the chances that a consult reerral will be required increasedor patients in this socioeconomic group No other significantcorrelations were ound with the pediatric reerral data
PEDIATRIC DIAGNOSTIC REFERRALS
O the primary care specialties pediatricians were the least requentutilizers o diagnostic services with a reerral rate o only 22Te majority o diagnostic reerrals were or x-rays and the mostrequently ordered x-rays were or the chest oot and abdomen
en percent o all diagnostic reerrals were or audiology-relateddiagnostics such as audiometry and tympanograms
FIGURE 13 TOP DIAGNOSTIC REFERRALS BY PEDIATRICIANS
Modality Per-Visit Referral Rate
X-ray 13
Ultrasound 03
Audio 02
ECG 01
MRI 01
8122019 Referral Rates Direct Indirect Costs 121713
httpslidepdfcomreaderfullreferral-rates-direct-indirect-costs-121713 1014
ReferralViewSM A First Look at National Referral Patterns from Primary Care Practices
wwwathenahealthcomwwwhalleyconsultingcom10
Detailed FindingsObstetrics amp Gynecology SPECIALTY CONSULT REFERRALS
Obstetrics and Gynecology physicians reerred out at a rate o3 notably lower than the other specialties OBGYNs reerredin the highest proportions to the obstetrical subspecialty omaternal and etal medicine Reerrals to general surgeons werealso notably high and were presumably made or surgerytreatment afer an irregular mammogram or pap smear
FIGURE 14 TOP REFERRED-TO SPECIALTIES BY OBGYNS
Referred-to Specialty Per-Visit Referral Rate
OBGYN Maternal amp Fetal Med 047
Gastroenterology 033
Surgery General 013
OBGYN Urogynecology 010
Urology 010
Physical Therapist 008
Surgery Breast 005
Dermatology 005
OBGYN Gynecological Oncology 005
ObstetricsGynecology General 005
Cardiology 004
EndocrinologyMetabolism 004
OBGYN Reproductive Endocrinology 004
Neurology 003
OBGYN Gynecology (Only) 003
CONSULT REFERRALS - DATA CORRELATIONS
Several statistically significant correlations were noted duringthe analysis o the OBGYN reerral and productivity data Wesaw a negative correlation between an OBGYNrsquos reerral rateand the median age o hisher patient base Tat is the youngerthe patient base the higher the reerral rate Given that themost requently reerred-to specialty was maternal and etalmedicine it stands to reason that younger patients (those ochildbearing age) might incur a higher reerral rate
We also saw a negative correlation between collections per workRVU and the reerral rate with the OBGYN dataset suggestingthat the providers serving lower income patients tended to see
patients with more acute issues that required a consult reerral
Productivity was also negatively correlated with the providerrsquosreerral rate Tat is the higher the providerrsquos productivity(both in terms o work RVUs and visits) the less l ikely he orshe was to reer out Tis may suggest that the more productive
physician practiced a wider scope o his or her specialty decreasingthe need to reer out
OBSTETRICS amp GYNECOLOGY DIAGNOSTIC REFERRALS
O the primary care specialties evaluated OBGYNs werethe highest utilizers o diagnostic services with a reerral rate o28 As expected or the patient population ser ved the va stmajority o reerrals were or ultrasounds and mammograms
FIGURE 15 TOP DIAGNOSTIC REFERRALS BY OBGYNS
Modality Per-Visit Referral Rate
Ultrasound 13
Mammogram 10
BoneDexa 16
Sonogram 02
X-ray 02
Using Referral Data to PredictPatient Volume and Revenue983121uantiying the downstream value o a specialistrsquos business
particularly a surgeonrsquos has been evaluated in previously published studies6 By incorporating the more elusive componento the equationmdashthe volume o patients that PCPs drive to thosespecialistsmdashplanners and other administrators can provide acomprehensive orecast o the direct and indirect impact o aPCP on downstream activity
Te data in this report combined with data rom a typicalbilling and clinical management system can be used to measurethe effect o a primary care provider on specialistsrsquo patient volumeand revenue o illustrate we have provided an example usingamily practice reerrals to an orthopedic surgeon
According to data presented in this paper a typical family practice provider generates referrals at a rate of 11 referrals per100 visits According to athenahealth data a typical family
practice has about 4100 patient visits annually Terefore a
8122019 Referral Rates Direct Indirect Costs 121713
httpslidepdfcomreaderfullreferral-rates-direct-indirect-costs-121713 1114
ReferralViewSM A First Look at National Referral Patterns from Primary Care Practices
wwwathenahealthcomwwwhalleyconsultingcom 11
typical family practice provider will generate about 451 referralsannually Using data presented in this paper we see that family
practice providers referred to orthopedic surgeons at a rate of09 Terefore we can calculate that about 37 of the 451 referrals
will be directed to orthopedic surgery
Te orthopedic practice can use its medical billing and clinicalmanagement system to calculate the yield of those referrals bylooking at the historical utilization of services by a new patientin their practice For example on average 37 referrals into the
practice might translate into
bull 74 patient visits (both new and ollow up)bull 59 in-office diagnosticsbull 21 office proceduresbull 99 outpatient proceduressurgeriesbull 33 inpatient proceduressurgeriesbull
12 reerrals out or diagnosticsbull 7 reerrals to other specialists (ie physical therapy)
While specialists obtain patients through channels other thanthrough PCP referrals this extrapolation provides service linemanagers with a methodology for forecasting three importantmetrics 1) diagnostic demand 2) OR (facility) demand and 3)specialty physician demand By determining the typical serviceline utilization (ie cases diagnostics) of a new patient we canattach market-specific per-case or per-diagnostic contributionmargins to forecast the downstream effect of the new patientreferral Monitoring the demand for physicians who support
various service lines ensures that market demand is in alignment
with the supply of those physicians and becomes a criticalcomponent of medical staff development planning
The Value of UnderstandingPatient Referral Flow Te data presented here provide a ramework or assessingthe volume and value o reerrals to various specialties rom
primary care providers It reinorces the value o primary care providers in the medical services demand chain at a time whenthere is a nationwide shortage o primary care providers In
addition findings point to the importance o having a robustreerral management system in place or medical practices andhealthcare systems
Primary care reerral rates are a undamental metric in developinghospitalsrsquo medical staff specialties A hospitalrsquos ldquoMedical StaffComplementrdquo is the mix o physician specialties and otherhealthcare proessionals required to meet patient demand andto remain technologically and operationally viable Te data
presented here can significantly inorm this planning process
Using data in this report a healthcare system can answerquestions such as
bull How much downstream business should we expect roman employed primary care physician
bull What kind o diagnostic service utilization should weexpect rom an OBGYN
bull How many patient reerrals are lsquoleakingrsquo out o ourintegrated delivery model
bull How many primary care providers are necessary in orderto support an orthopedic surgeon
In addition the data presented here provide a gauge to indicate whether or not a specialty physicianpractice is the provider oldquochoicerdquo among reerring physicians7 Tat is it is possible todetermine whether certain specialty physicians are attracting theoptimal number o reerrals rom primary care providers A recent
study
8
identifies ldquophysician communicationrdquo and patient accesscharacteristics as the most important actors afer clinical expertisein contributing to the selection o a reerred-to physician Tereorelooking at reerral rates or given providers could indicate thatmore attention might be needed to nurture reerral relationships
Te data in ReerralView can also be used by primary care providers and advocacy organizations to develop a morecomplete understanding o the downstream value o primarycare across the national health care system A survey in the
Journal o General Internal Medicine ound that 63 of PCPs
were dissatisfied with the referral process compared with
35 for specialists9 Tis study sheds additional light on the
reasons or that dissatisaction PCPs do a significant amounto work to get a reerral out the doormdashrom organizing datato selecting the appropriate provider to handling requiredinsurance paperwork New care coordination models such asathenahealthrsquos athenaCoordinatorreg service are shifing theburden or submitting and tracking reerral data rom the
provider to the receiving acility reducing the workload or PCPs
Reerral tracking can provide key insights into overall healthcare expenditure by helping researchers monitor the type and
volume o patient reerrals as medical providers implementACOs and other quality care improvements Future research
using ReerralView can also provide a more in-depth under-standing o the reerral path rom PCPs to specialties to helptrack and predict reerrals and understand care utilization withan eye toward reducing overall costs
he value o physician reerrals is tangible a nd determinableFor hospitals health systems and providers alike ReerralViewenables new insights into reerral patterns that can inorm planningand establish the transparency needed to create an equitable andsustainable market or health inormation exchange
8122019 Referral Rates Direct Indirect Costs 121713
httpslidepdfcomreaderfullreferral-rates-direct-indirect-costs-121713 1214
ReferralViewSM A First Look at National Referral Patterns from Primary Care Practices
wwwathenahealthcomwwwhalleyconsultingcom12
Appendix Data DefinitionsEampM Visit Te count o visits tabulated rom the billedin-patient and out-patient Evaluation and Management CPcodes that the provider generated during the study period
Reerral A documented request that the patient see a certainspecialty or seek a specific type o diagnostic test
Reerral Rate Reerrals made as a percentage o totalEampM visits
Coding index a measure o visit acuity calculated as workRVUs divided by EampM visits
Note Full reerral data wil l be included in the appendix o asubsequent version o this whitepaperndashavailable or downloadat athenahealthcom
End Notes1 How Many Other Doctors Do Primary Care Doctors Need toCoordinate Patient Care With Ann Intern Med 17 February2009150(4)I-44 Available at httpannalsorgarticleaspxarticleid=744335
2 Michael L Barnett MD Zirui Song BA Bruce E LandonMD MBA rends in Physician Reerrals in the United States1999-2009 Arch Intern Med 2012172(2)163-170 Availableat httparchintejamanetworkcomarticleaspxarticleid=1108675
3 Modernizing Rural Health Care Coverage 983121uality andInnovation United Healthcare Group July 2011 3 Availableat HYPERLINK ldquohttpwwwunitedhealthgroupcomhrmuhn_workingpaper6pdrdquowwwunitedhealthgroupcomhrm
uhn_workingpaper6pd4 Kaiser Family Foundation State Health Facts State HMOPenetration Rate ndash July 2011 Available at httpwwwstatehealthactsorgcomparemaptablejspcat=7ampind=349
5 Sommers AS Boukus E R Carrier E Dispelling MythsAbout Emergency Department Use Majority o MedicaidVisits Are or Urgent or More Serious Symptoms Center orStudying Health System Change No 23 July 2012 Availableat httpwwwhschangeorgCONEN13021302pd
6 Merritt Hawkins 2010 Physician InpatientOutpatient
Revenue Survey Available at httpwwwmerritthawkinscom pd2010_revenuesurveypd
7 Halley Marc D ldquoTe Economics o Physician IntegrationrdquoHealthcare Executive SeptemberOctober 2012 76-79
8 Barnett et al Reasons or Choice o Reerral PhysicianAmong Primary Care and Specialist Physicians Society oGeneral Internal Medicine 2011 Available at httpchristakismedharvardedupdpublicationsarticles131pd
9 Communication Breakdown in the Outpatient ReerralProcess J Gen Intern Med 2000 September 15(9) 626ndash631
Available at httpwwwncbinlmnihgovpmcarticlesPMC1495590
8122019 Referral Rates Direct Indirect Costs 121713
httpslidepdfcomreaderfullreferral-rates-direct-indirect-costs-121713 1314
8122019 Referral Rates Direct Indirect Costs 121713
httpslidepdfcomreaderfullreferral-rates-direct-indirect-costs-121713 1414
athenahealth Inc | 311 Arsenal Street | Watertown MA 02472 | 8668175738
copy 2012 athenahealth Inc All rights reserved
About athenahealth At athenahealth we offer the leading
cloud-based practice management EHR and care coordination services
that help medical groups get more money and more control of patient
care To learn how our services can help your organization contact us
at 8668175738 or athenahealthcom
About Halley Consulting Group The Halley Consulting Group
is a physician practice management and consulting rm specializing in
the strategic development and performance turnaround of both hospital-
owned medical practice networks and large independent medical ofces
Contact us at 8667065373 or halleyconsultingcom
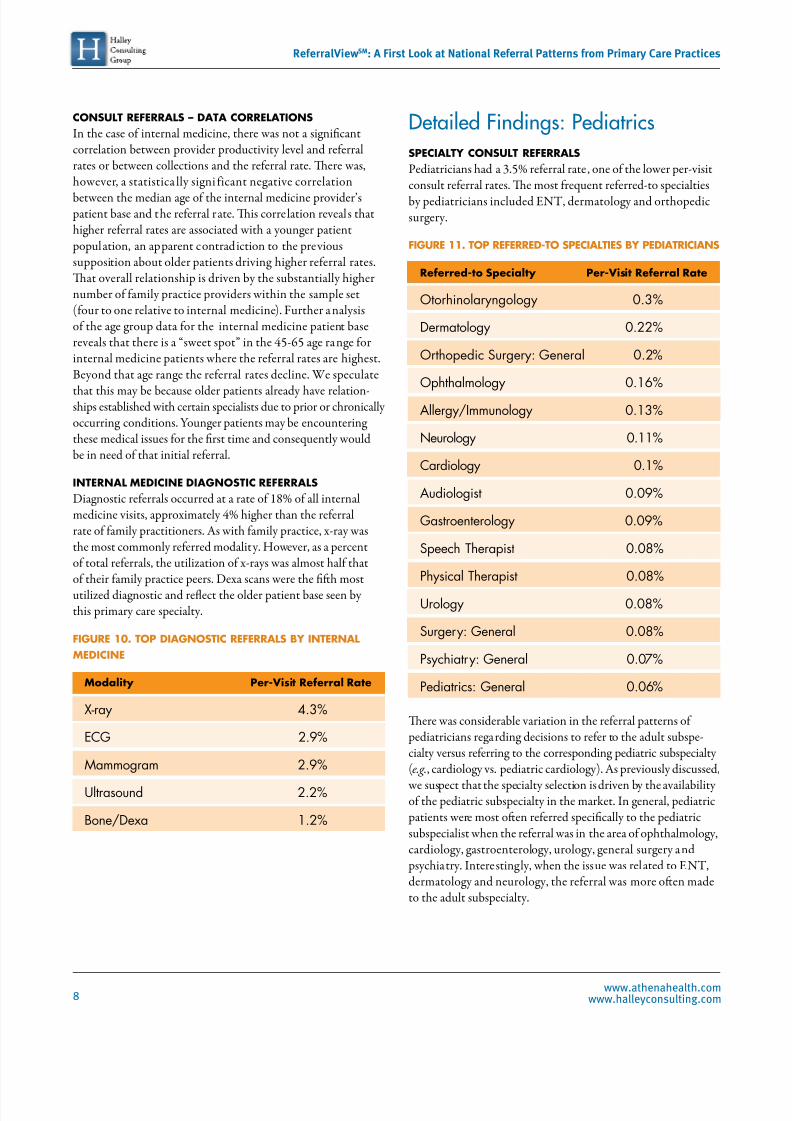
8122019 Referral Rates Direct Indirect Costs 121713
httpslidepdfcomreaderfullreferral-rates-direct-indirect-costs-121713 1414
athenahealth Inc | 311 Arsenal Street | Watertown MA 02472 | 8668175738
copy 2012 athenahealth Inc All rights reserved
About athenahealth At athenahealth we offer the leading
cloud-based practice management EHR and care coordination services
that help medical groups get more money and more control of patient
care To learn how our services can help your organization contact us
at 8668175738 or athenahealthcom
About Halley Consulting Group The Halley Consulting Group
is a physician practice management and consulting rm specializing in
the strategic development and performance turnaround of both hospital-
owned medical practice networks and large independent medical ofces
Contact us at 8667065373 or halleyconsultingcom