Embed Size (px)
Citation preview
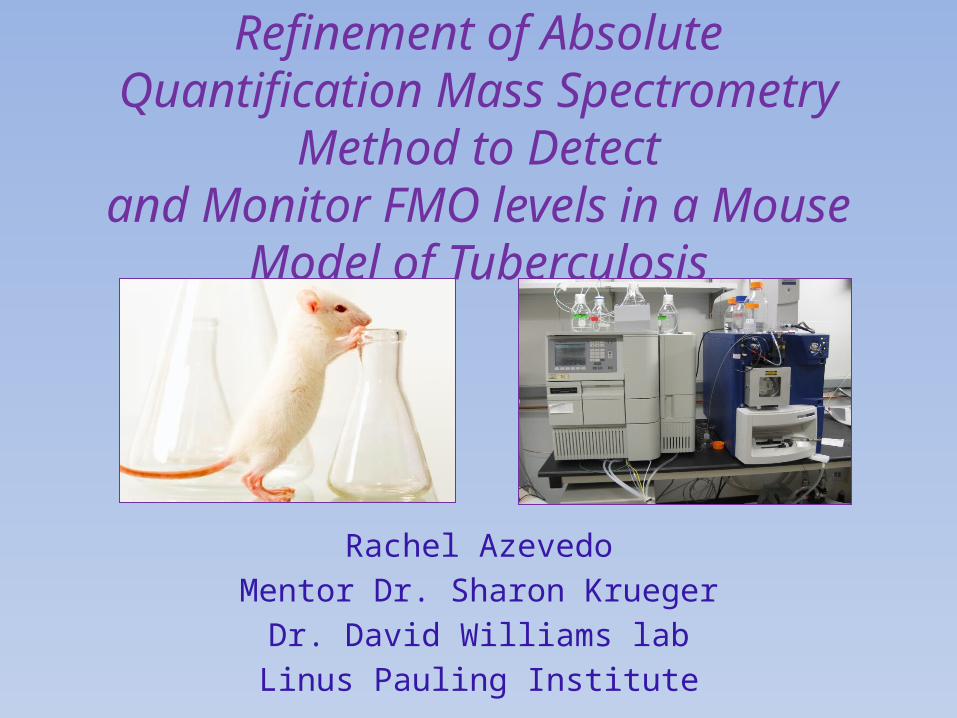
Refinement of Absolute Quantification Mass Spectrometry Method to Detectand Monitor FMO levels in a Mouse
Model of Tuberculosis
Rachel AzevedoMentor Dr. Sharon Krueger
Dr. David Williams labLinus Pauling Institute

Tuberculosis
• Mycobacterium tuberculosis primarily infects the lungs.
• Symptoms include: coughing up blood, weight loss, chills and loss of appetite.
• 1/3 of the world’s population is infected with TB.• TB is second only to HIV/AIDS as the greatest killer
worldwide.
"Tuberculosis." WHO. N.p., Mar. 2012. Web. 10 July 2012. <http://www.who.int/mediacentre/factsheets/fs104/en/>.
Ethionamide
• Drug resistance can occur during treatment.
• Ethionamide (ETA) is a second line drug used for the treatment of TB.
• It is generally used in combination with 5 other drugs.
Flavin containing monooxygenase
• ETA and other second line drugs are metabolized by flavin containing monooxygenases (FMOs).
• FMOs catalyze oxygenation of a wide variety of xenobiotic compounds.
• There are 5 FMO protein products in mammalian systems.
FMOs cont.
• The major mammalian pulmonary FMO is FMO 2.
• Most humans do not express FMO 2.1, instead they express an inactive FMO 2.2.
Hypothesis
The expression of catalytically active FMO2.1 enzyme reduces the efficacy of ETA in inhibiting and killing M.tuberculosis which enhances oxidative/nitrative stresses and pulmonary toxicity in the host.
Global Implications
• The highest incidence of individuals with an active FMO 2.1 live in Sub-Saharan Africa.
• The highest rates of TB and resistance to TB drugs also coincides with Sub-Saharan Africa.
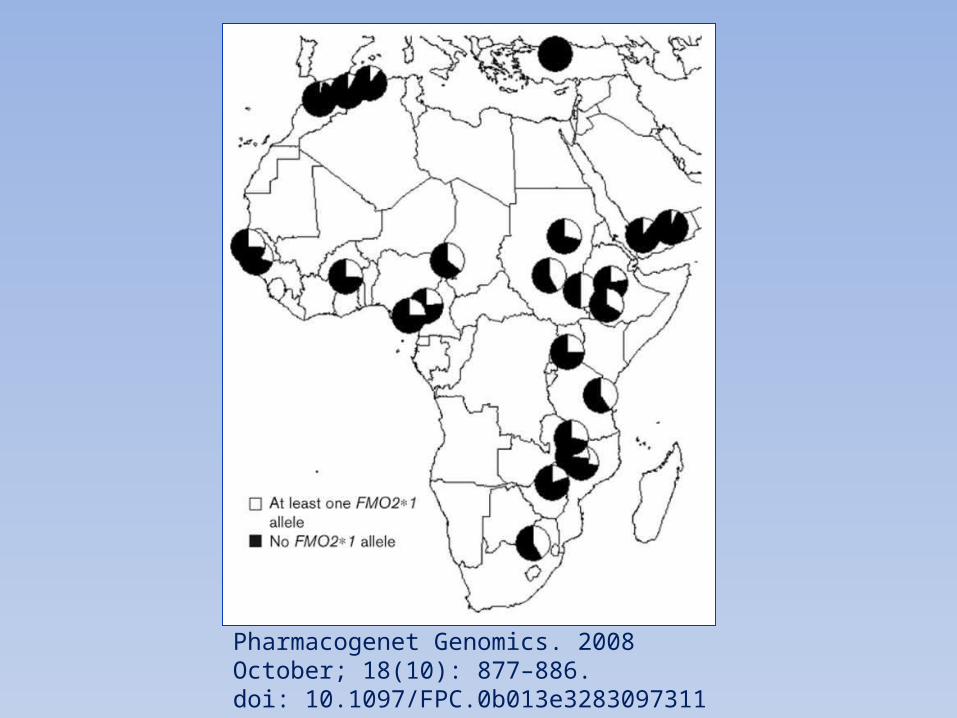
Pharmacogenet Genomics. 2008 October; 18(10): 877–886. doi: 10.1097/FPC.0b013e3283097311
Consequences of 2.1 Expression
• FMO 2.1 expression could metabolize ETA to sulfenic acid so that less drug reaches its target.
• The sulfenic acid is capable of redox-cycling with glutathione producing oxidative/nitrative stress and toxicity.

Methodology
• In order to study the effects of FMO 2.1 and 2.2 there needs to be a method to discriminate between the different FMOs.
• FMOs 1-3 have overlapping substrate specificities and antibody cross-reactivity.
• Preliminary studies have been done using Absolute Quantification Mass Spectrometry (AQUA MS).

Overview of AQUA MSTissue Sample
Homogenize
SDS Page
AddLabeled Peptides
Excise band
Run LC MS/MS
1.
2.
3.
4.
5.
6.
Problems With Initial Technique
• The AQUA MS method successfully identified the mouse FMOs, but results were not quantitative for all of the FMOs.
• AQUA results for FMOs 1 and 2 were not consistent with levels determined by RT-PCR and enzyme assays.
• The methodology was time consuming and detail oriented.
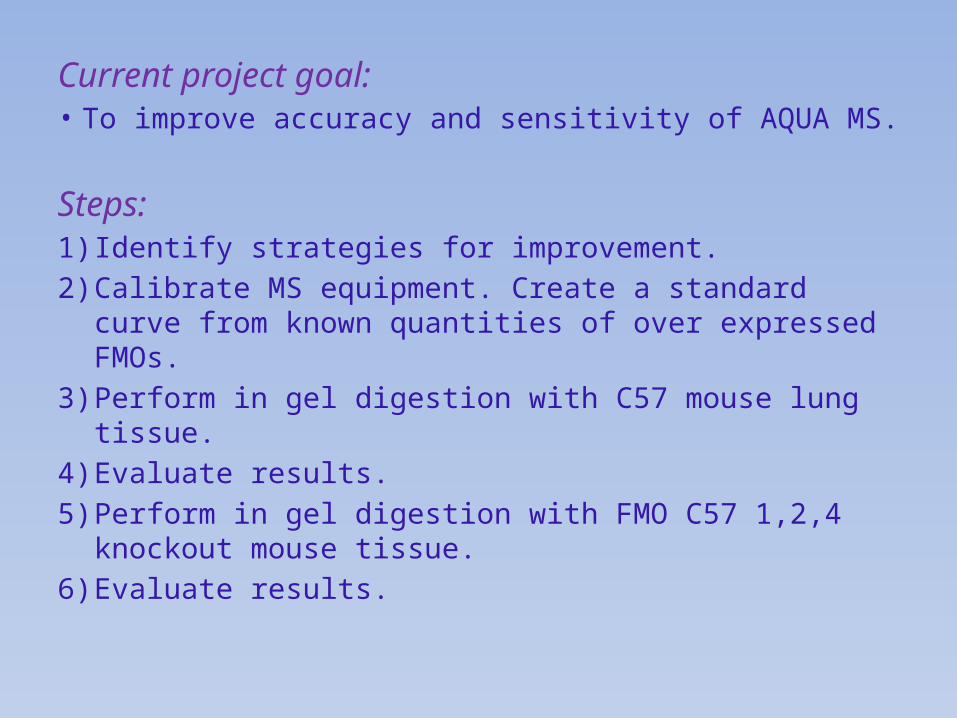
Current project goal: • To improve accuracy and sensitivity of AQUA MS.
Steps: 1) Identify strategies for improvement. 2) Calibrate MS equipment. Create a standard curve from
known quantities of over expressed FMOs.3) Perform in gel digestion with C57 mouse lung tissue.4) Evaluate results.5) Perform in gel digestion with FMO C57 1,2,4 knockout
mouse tissue.6) Evaluate results.
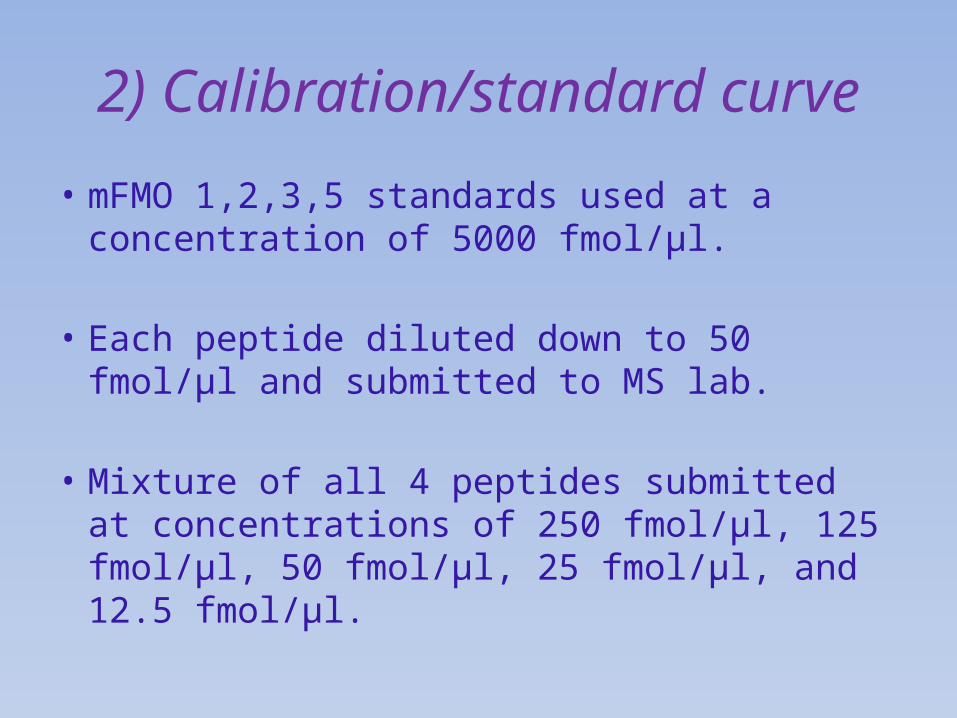
2) Calibration/standard curve
• mFMO 1,2,3,5 standards used at a concentration of 5000 fmol/µl.
• Each peptide diluted down to 50 fmol/µl and submitted to MS lab.
• Mixture of all 4 peptides submitted at concentrations of 250 fmol/µl, 125 fmol/µl, 50 fmol/µl, 25 fmol/µl, and 12.5 fmol/µl.
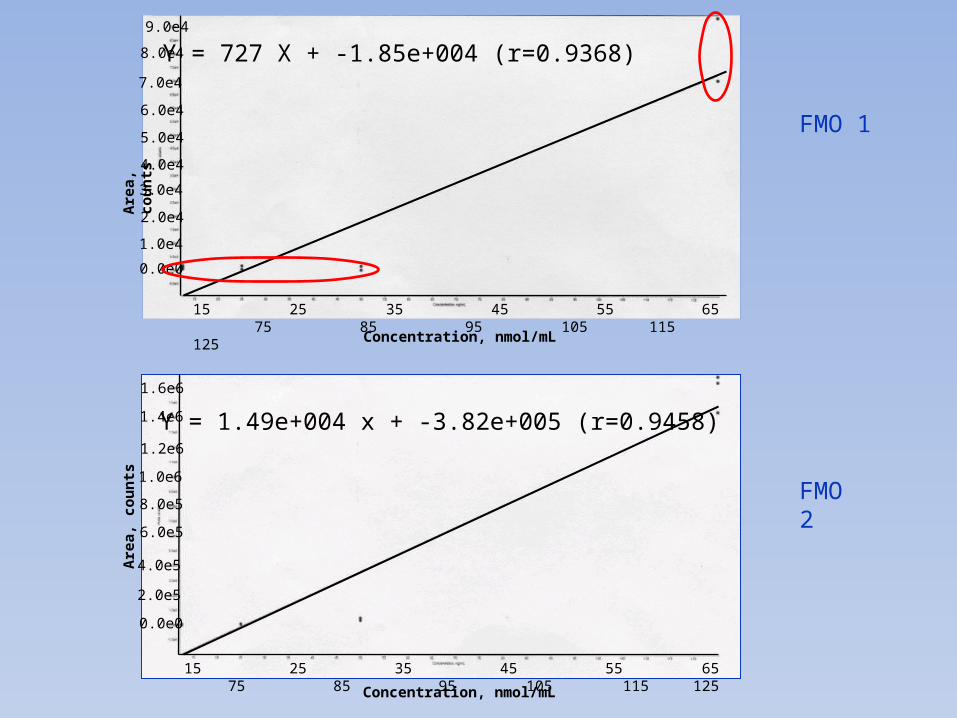
FMO 1
FMO 2
Y = 727 X + -1.85e+004 (r=0.9368)
15 25 35 45 55 65 75 85 95 105 115 125
9.0e4
8.0e4
7.0e4
6.0e4
5.0e4
4.0e4
3.0e4
2.0e4
1.0e4
0.0e0
Concentration, nmol/mL
Concentration, nmol/mL
Are
a, c
ou
nts
Are
a, c
ou
nts
15 25 35 45 55 65 75 85 95 105 115 125
1.6e6
1.4e6
1.2e6
1.0e6
8.0e5
6.0e5
4.0e5
2.0e5
0.0e0
Y = 1.49e+004 x + -3.82e+005 (r=0.9458)
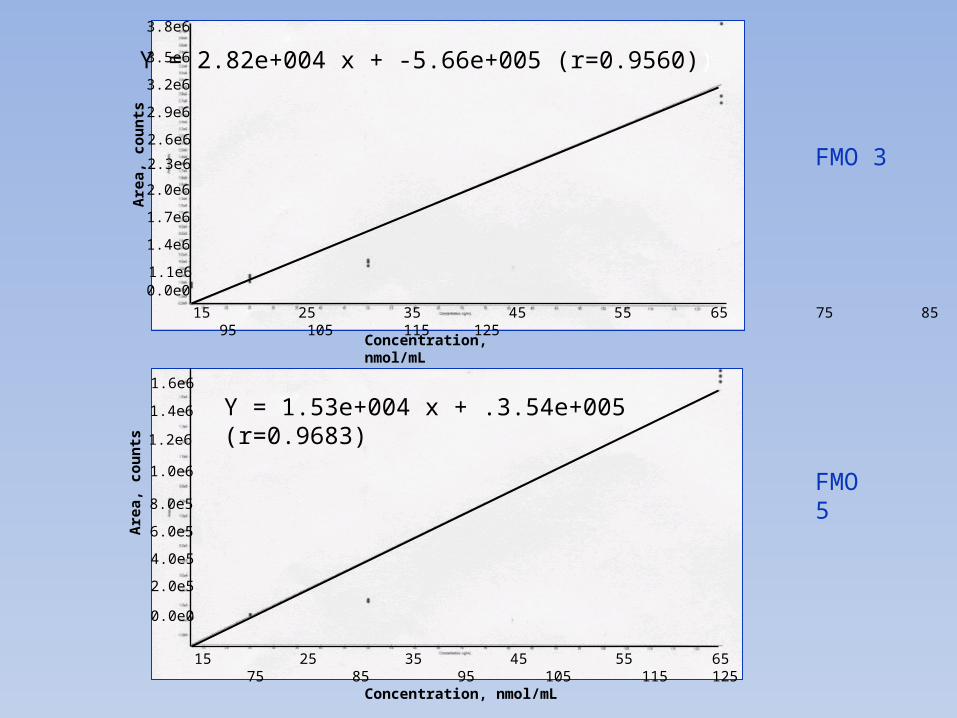
FMO 3
FMO 5
3.8e6
3.5e6
3.2e6
2.9e6
2.6e6
2.3e6
2.0e6
1.7e6
1.4e6
1.1e60.0e0
Y = 2.82e+004 x + -5.66e+005 (r=0.9560))
Are
a, c
ou
nts
Concentration, nmol/mL
15 25 35 45 55 65 75 85 95 105 115 125
15 25 35 45 55 65 75 85 95 105 115 125
1.6e6
1.4e6
1.2e6
1.0e6
8.0e5
6.0e5
4.0e5
2.0e5
0.0e0
Concentration, nmol/mL
Are
a, c
ou
nts
Y = 1.53e+004 x + .3.54e+005 (r=0.9683)
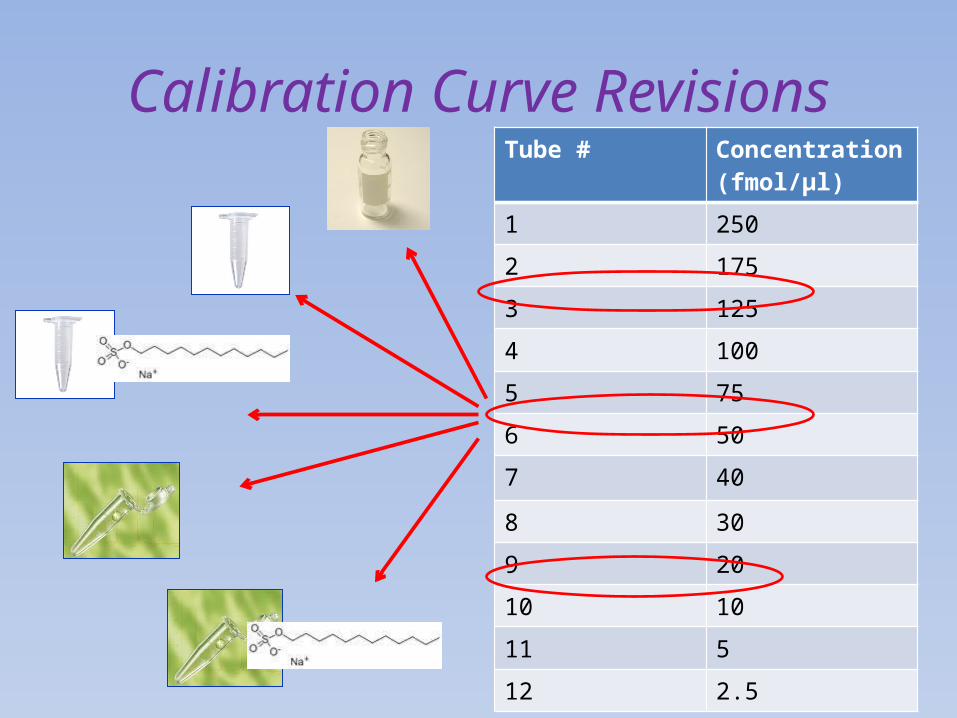
Calibration Curve RevisionsTube # Concentration
(fmol/µl)1 250
2 175
3 125
4 100
5 75
6 50
7 40
8 30
9 20
10 10
11 5
12 2.5
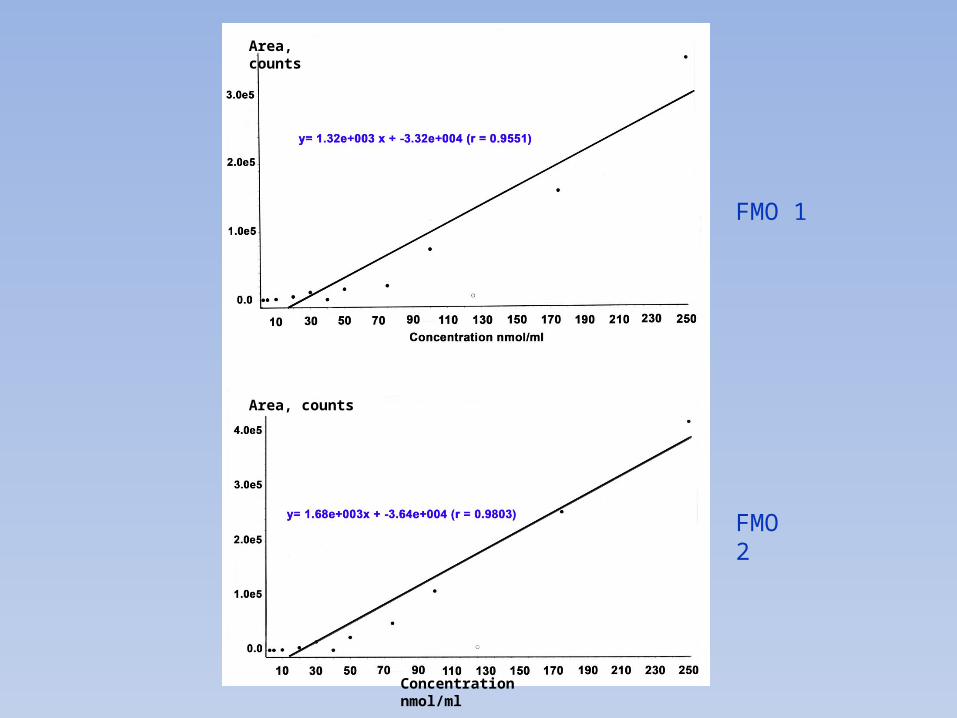
FMO 1
FMO 2
Area, counts
Concentration nmol/ml
Area, counts
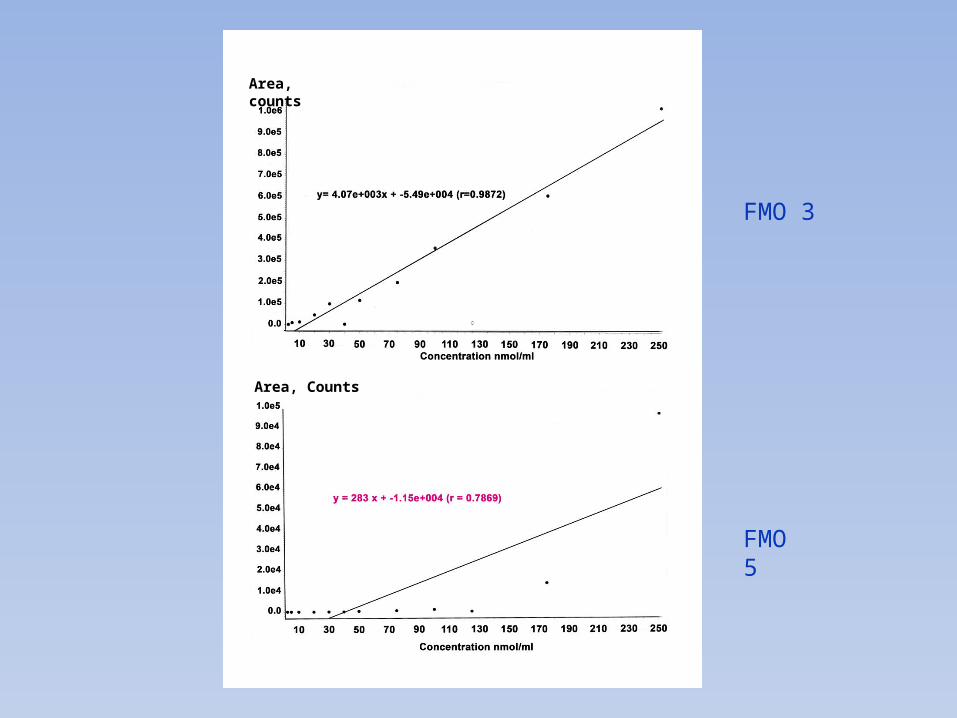
FMO 3
FMO 5
Area, counts
Area, Counts
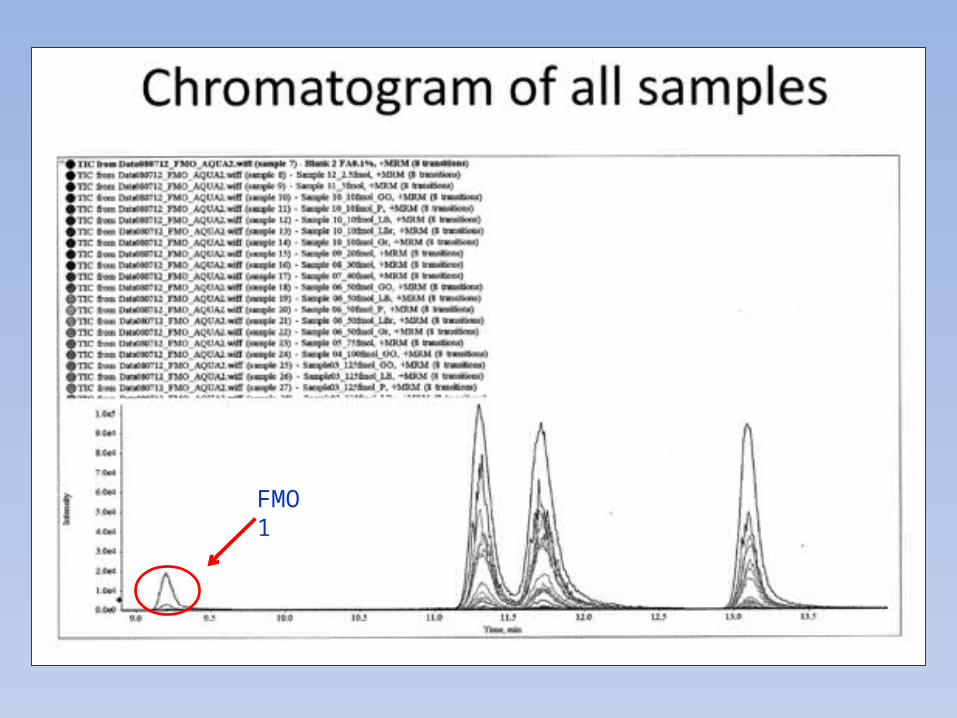
FMO 1
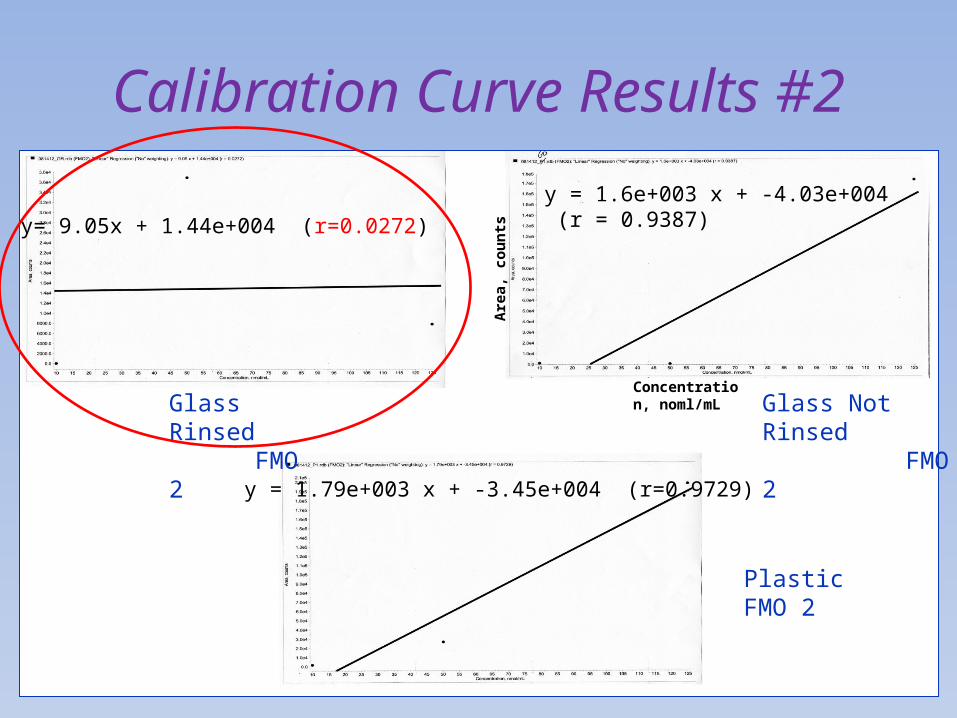
Calibration Curve Results #2
Glass Rinsed FMO 2
Glass Not Rinsed FMO 2
Plastic FMO 2
y= 9.05x + 1.44e+004 (r=0.0272)y = 1.6e+003 x + -4.03e+004 (r = 0.9387)
y = 1.79e+003 x + -3.45e+004 (r=0.9729)
Concentration, noml/mL
Are
a, c
ou
nts
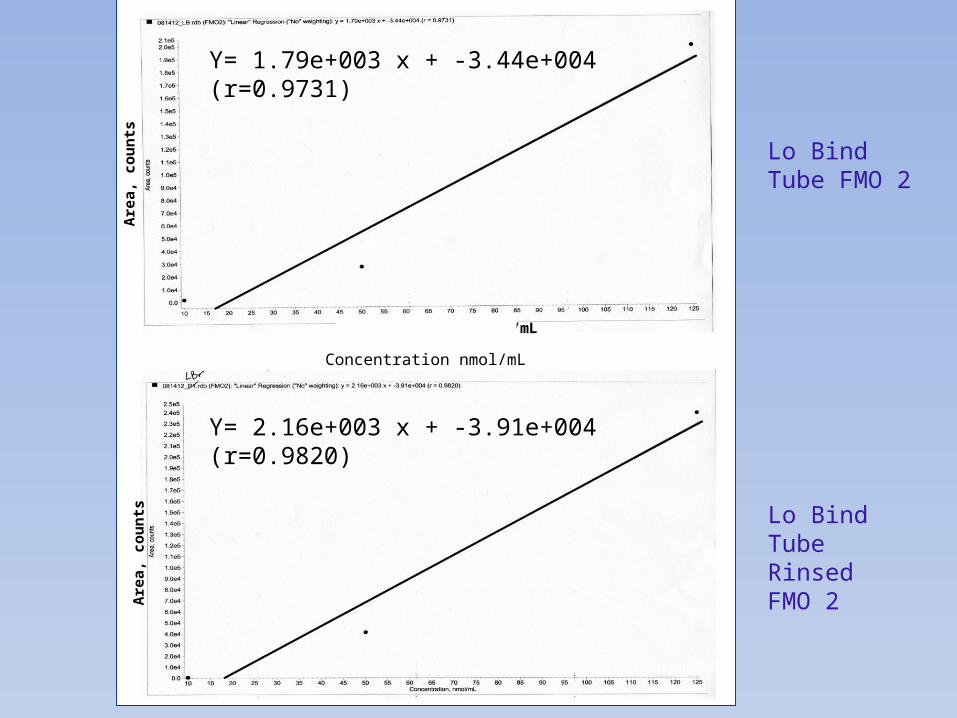
Lo Bind Tube FMO 2
Lo Bind Tube Rinsed FMO 2
Y= 1.79e+003 x + -3.44e+004 (r=0.9731)
Y= 2.16e+003 x + -3.91e+004 (r=0.9820)
Concentration, nmol/mL
Are
a, c
ou
nts
Are
a, c
ou
nts
Concentration nmol/mL
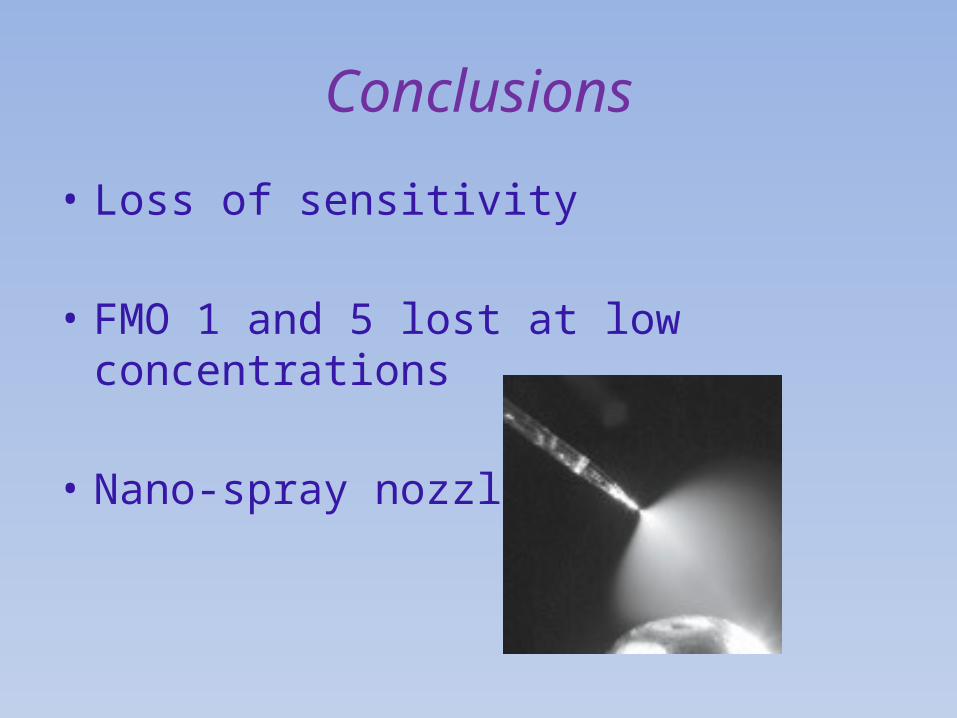
Conclusions
• Loss of sensitivity • FMO 1 and 5 lost at low concentrations
• Nano-spray nozzle

Acknowledgements• HHMI • Dr. David Williams• Dr. Sharon Krueger• Marilyn Henderson• Dr. Claudia Maier• Jeff Morré• Samanthi Wickramasekara• Dr. Joe Leykam• FMO grant: NIH/NHLBI PHS-
HL038650• LPI/EMT • EHSC
Lab Members:•Virginia Leykam•Tammie McQuistan •Dr. Pushpinder Kaur•Erin Madeen•Priti Singh•David Sampson