Embed Size (px)
Citation preview
Reflection-mode multifocal optical-resolution photoacoustic microscopy
Guo LiKonstantin I. MaslovLihong V. Wang
Downloaded From: http://biomedicaloptics.spiedigitallibrary.org/ on 03/04/2013 Terms of Use: http://spiedl.org/terms
Reflection-mode multifocaloptical-resolution photo-acoustic microscopy
Guo Li, Konstantin I. Maslov, and Lihong V. WangWashington University in St. Louis, Optical Imaging Laboratory,Department of Biomedical Engineering, One Brookings Drive, St. Louis,Missouri 63130
Abstract. Compared with single-focus optical-resolutionphotoacoustic microscopy (OR-PAM), multifocal OR-PAMutilizes both multifocal optical illumination and an ultra-sonic array transducer, significantly increasing the imagingspeed. A reflection-mode multifocal OR-PAM system basedon a microlens array that provides multiple foci as well as anultrasonic array transducer that receives the excited photo-acoustic waves from all foci simultaneously is presented.Using a customized microprism to reflect the incident laserbeam to the microlens array, the multiple optical foci arealigned confocally with the focal zone of the ultrasonicarray transducer. Experiments show the reflection-modemultifocal OR-PAM is capable of imaging microvessels invivo, and it can image a 6 × 5 × 2.5 mm3 volume at 16 μmlateral resolution in ∼2.5 min, which was limited by the sig-nal multiplexing ratio and laser pulse repetition rate. © 2013
Society of Photo-Optical Instrumentation Engineers (SPIE) [DOI: 10.1117/1.JBO
.18.3.030501]
Keywords: photoacoustic microscopy; high-frequency ultrasonic array;multiple foci; reflection mode.
Paper 12771LR received Dec. 4, 2012; revised manuscript receivedFeb. 11, 2013; accepted for publication Feb. 12, 2013; published on-line Feb. 27, 2013.
Photoacoustic microscopy (PAM) is a mode of photoacoustictomography (PAT), which offers high sensitivity to optical con-trast in biological tissues.1 Optical-resolution PAM (OR-PAM)is implemented by focusing the illumination through an objec-tive lens; thus OR-PAM can achieve optical diffraction limitedlateral resolution with maximum imaging depths up to onetransport mean-free path (∼1.2 mm in tissue).2,3 OR-PAM canprovide structural imaging, and metabolic imaging.4,5 Variouskinds of OR-PAM have also been explored to meet specificrequirements, such as high speed,6 high resolution,7,8 deepimaging depth,3 and handheld operation.9
For OR-PAM, high imaging speed is always desirablebecause it enables us to observe dynamic biological processeswhile mitigating motion artifacts. For most OR-PAM systemsbased on both a single optical focus and a single-element ultra-sonic transducer in confocal configuration, mechanical rasterscanning along two lateral directions provides limited volumet-ric imaging speeds. Although optical scanning (i.e., scanning
using galvo mirrors) can improve the speed greatly, it is usuallyused with an unfocused or a single-axis focused ultrasonictransducer, which results in a limited field of view (FOV) orcompromised signal to noise ratio (SNR). Moreover, thevolumetric imaging speed for OR-PAM with either mechanicalor optical scanning is eventually limited by the laser pulse rep-etition rate (PRR). Thus to achieve high imaging speed, laserswith high PRR (∼100 kHz, or even faster) are employed.6,9
Currently, lasers with such high PRR usually lack the wave-length tunability, which is essential for imaging of some physio-logical functions, such as the oxygen saturation of hemoglobin(sO2). Moreover, high PRR translates to high average opticalpower, which may produce excessive tissue heating. Our labpreviously reported a multifocal OR-PAM (MFOR-PAM) with∼20 times faster imaging speed (without considering the multi-plexing effect) than a single-focus OR-PAM,10 so it relieves thedemand for a high laser PRR. Besides the imaging speedimprovement, the sO2 measurement capability makes MFOR-PAM potentially promising in clinical and preclinical applica-tions. However, the original MFOR-PAM works in transmis-sion mode, only suited for imaging thin biological samples.Therefore, it is necessary to develop reflection-mode MFOR-PAM.
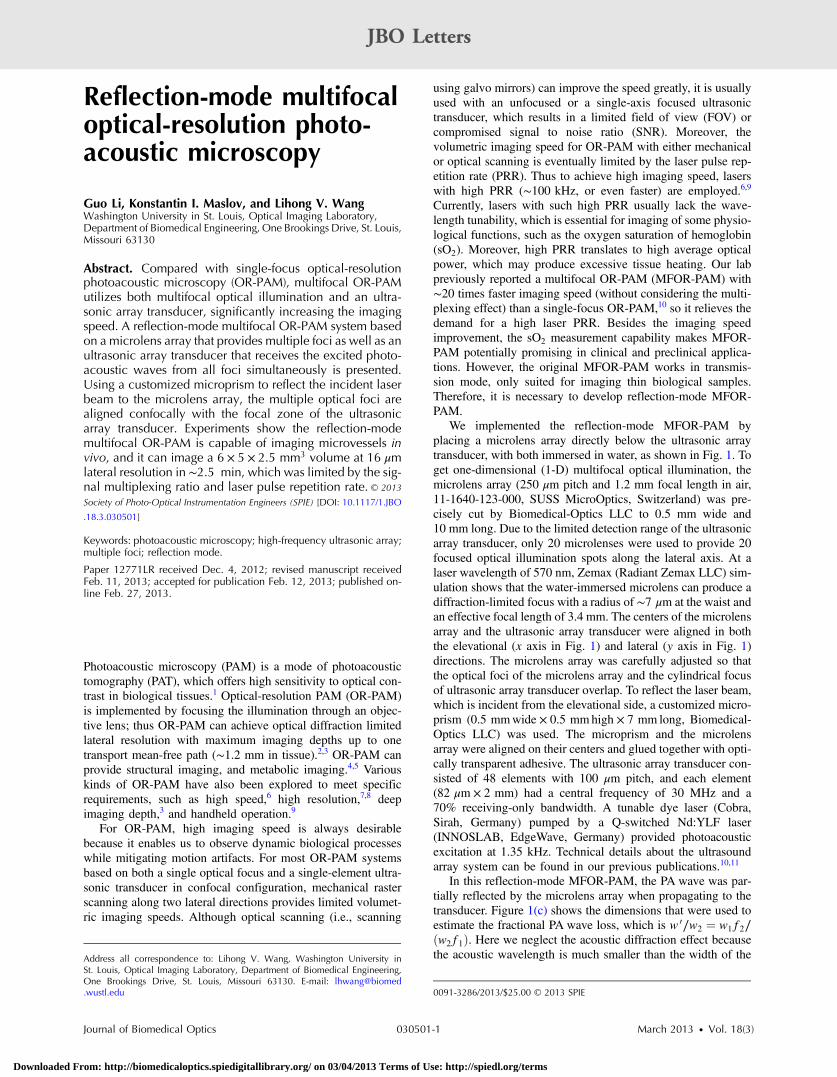
We implemented the reflection-mode MFOR-PAM byplacing a microlens array directly below the ultrasonic arraytransducer, with both immersed in water, as shown in Fig. 1. Toget one-dimensional (1-D) multifocal optical illumination, themicrolens array (250 μm pitch and 1.2 mm focal length in air,11-1640-123-000, SUSS MicroOptics, Switzerland) was pre-cisely cut by Biomedical-Optics LLC to 0.5 mm wide and10 mm long. Due to the limited detection range of the ultrasonicarray transducer, only 20 microlenses were used to provide 20focused optical illumination spots along the lateral axis. At alaser wavelength of 570 nm, Zemax (Radiant Zemax LLC) sim-ulation shows that the water-immersed microlens can produce adiffraction-limited focus with a radius of ∼7 μm at the waist andan effective focal length of 3.4 mm. The centers of the microlensarray and the ultrasonic array transducer were aligned in boththe elevational (x axis in Fig. 1) and lateral (y axis in Fig. 1)directions. The microlens array was carefully adjusted so thatthe optical foci of the microlens array and the cylindrical focusof ultrasonic array transducer overlap. To reflect the laser beam,which is incident from the elevational side, a customized micro-prism (0.5 mmwide × 0.5 mmhigh × 7 mm long, Biomedical-Optics LLC) was used. The microprism and the microlensarray were aligned on their centers and glued together with opti-cally transparent adhesive. The ultrasonic array transducer con-sisted of 48 elements with 100 μm pitch, and each element(82 μm × 2 mm) had a central frequency of 30 MHz and a70% receiving-only bandwidth. A tunable dye laser (Cobra,Sirah, Germany) pumped by a Q-switched Nd:YLF laser(INNOSLAB, EdgeWave, Germany) provided photoacousticexcitation at 1.35 kHz. Technical details about the ultrasoundarray system can be found in our previous publications.10,11
In this reflection-mode MFOR-PAM, the PA wave was par-tially reflected by the microlens array when propagating to thetransducer. Figure 1(c) shows the dimensions that were used toestimate the fractional PA wave loss, which is w 0∕w2 ¼ w1f2∕ðw2f1Þ. Here we neglect the acoustic diffraction effect becausethe acoustic wavelength is much smaller than the width of theAddress all correspondence to: Lihong V. Wang, Washington University in
St. Louis, Optical Imaging Laboratory, Department of Biomedical Engineering,One Brookings Drive, St. Louis, Missouri 63130. E-mail: [email protected] 0091-3286/2013/$25.00 © 2013 SPIE
Journal of Biomedical Optics 030501-1 March 2013 • Vol. 18(3)
JBO Letters
Downloaded From: http://biomedicaloptics.spiedigitallibrary.org/ on 03/04/2013 Terms of Use: http://spiedl.org/terms
microlens array. With f1 ¼ 3.4 mm, w1 ¼ 0.5 mm, f2 ¼8.2 mm, and w2 ¼ 2.0 mm, the fraction of acoustic energyreaching the transducer array, was 1 − w 0∕w2, equal to ∼40%.Also, this design allows us to extend the microscope’s workingdistance to the whole optical focal length, which is convenient inbiomedical imaging applications.
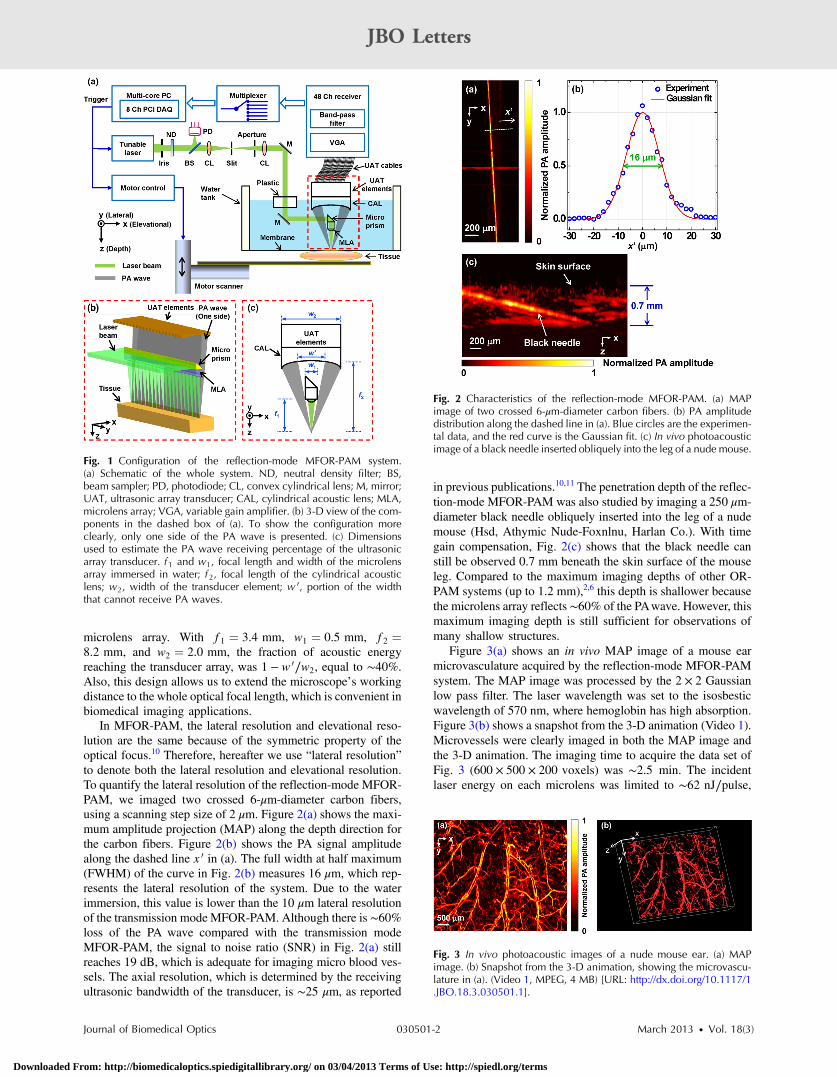
In MFOR-PAM, the lateral resolution and elevational reso-lution are the same because of the symmetric property of theoptical focus.10 Therefore, hereafter we use “lateral resolution”to denote both the lateral resolution and elevational resolution.To quantify the lateral resolution of the reflection-mode MFOR-PAM, we imaged two crossed 6-μm-diameter carbon fibers,using a scanning step size of 2 μm. Figure 2(a) shows the maxi-mum amplitude projection (MAP) along the depth direction forthe carbon fibers. Figure 2(b) shows the PA signal amplitudealong the dashed line x 0 in (a). The full width at half maximum(FWHM) of the curve in Fig. 2(b) measures 16 μm, which rep-resents the lateral resolution of the system. Due to the waterimmersion, this value is lower than the 10 μm lateral resolutionof the transmission mode MFOR-PAM. Although there is ∼60%loss of the PA wave compared with the transmission modeMFOR-PAM, the signal to noise ratio (SNR) in Fig. 2(a) stillreaches 19 dB, which is adequate for imaging micro blood ves-sels. The axial resolution, which is determined by the receivingultrasonic bandwidth of the transducer, is ∼25 μm, as reported
in previous publications.10,11 The penetration depth of the reflec-tion-mode MFOR-PAM was also studied by imaging a 250 μm-diameter black needle obliquely inserted into the leg of a nudemouse (Hsd, Athymic Nude-Foxnlnu, Harlan Co.). With timegain compensation, Fig. 2(c) shows that the black needle canstill be observed 0.7 mm beneath the skin surface of the mouseleg. Compared to the maximum imaging depths of other OR-PAM systems (up to 1.2 mm),2,6 this depth is shallower becausethe microlens array reflects ∼60% of the PAwave. However, thismaximum imaging depth is still sufficient for observations ofmany shallow structures.
Figure 3(a) shows an in vivo MAP image of a mouse earmicrovasculature acquired by the reflection-mode MFOR-PAMsystem. The MAP image was processed by the 2 × 2 Gaussianlow pass filter. The laser wavelength was set to the isosbesticwavelength of 570 nm, where hemoglobin has high absorption.Figure 3(b) shows a snapshot from the 3-D animation (Video 1).Microvessels were clearly imaged in both the MAP image andthe 3-D animation. The imaging time to acquire the data set ofFig. 3 (600 × 500 × 200 voxels) was ∼2.5 min. The incidentlaser energy on each microlens was limited to ∼62 nJ∕pulse,
Fig. 1 Configuration of the reflection-mode MFOR-PAM system.(a) Schematic of the whole system. ND, neutral density filter; BS,beam sampler; PD, photodiode; CL, convex cylindrical lens; M, mirror;UAT, ultrasonic array transducer; CAL, cylindrical acoustic lens; MLA,microlens array; VGA, variable gain amplifier. (b) 3-D view of the com-ponents in the dashed box of (a). To show the configuration moreclearly, only one side of the PA wave is presented. (c) Dimensionsused to estimate the PA wave receiving percentage of the ultrasonicarray transducer. f 1 and w1, focal length and width of the microlensarray immersed in water; f 2, focal length of the cylindrical acousticlens; w2, width of the transducer element; w 0, portion of the widththat cannot receive PA waves.
Fig. 2 Characteristics of the reflection-mode MFOR-PAM. (a) MAPimage of two crossed 6-μm-diameter carbon fibers. (b) PA amplitudedistribution along the dashed line in (a). Blue circles are the experimen-tal data, and the red curve is the Gaussian fit. (c) In vivo photoacousticimage of a black needle inserted obliquely into the leg of a nude mouse.
Fig. 3 In vivo photoacoustic images of a nude mouse ear. (a) MAPimage. (b) Snapshot from the 3-D animation, showing the microvascu-lature in (a). (Video 1, MPEG, 4 MB) [URL: http://dx.doi.org/10.1117/1.JBO.18.3.030501.1].
Journal of Biomedical Optics 030501-2 March 2013 • Vol. 18(3)
JBO Letters
Downloaded From: http://biomedicaloptics.spiedigitallibrary.org/ on 03/04/2013 Terms of Use: http://spiedl.org/terms
and the laser fluence on the ear surface was estimated to be16 mJ∕cm2, lower than the ANSI limit 20 mJ∕cm2.
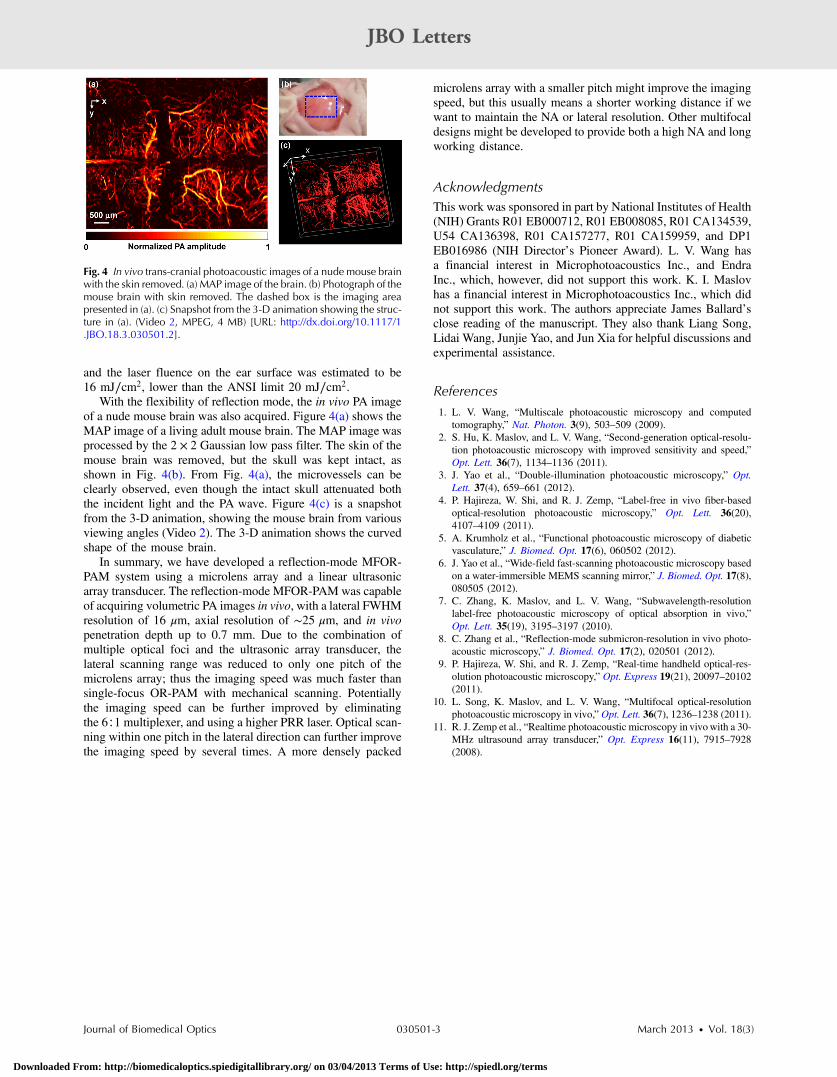
With the flexibility of reflection mode, the in vivo PA imageof a nude mouse brain was also acquired. Figure 4(a) shows theMAP image of a living adult mouse brain. The MAP image wasprocessed by the 2 × 2 Gaussian low pass filter. The skin of themouse brain was removed, but the skull was kept intact, asshown in Fig. 4(b). From Fig. 4(a), the microvessels can beclearly observed, even though the intact skull attenuated boththe incident light and the PA wave. Figure 4(c) is a snapshotfrom the 3-D animation, showing the mouse brain from variousviewing angles (Video 2). The 3-D animation shows the curvedshape of the mouse brain.
In summary, we have developed a reflection-mode MFOR-PAM system using a microlens array and a linear ultrasonicarray transducer. The reflection-mode MFOR-PAM was capableof acquiring volumetric PA images in vivo, with a lateral FWHMresolution of 16 μm, axial resolution of ∼25 μm, and in vivopenetration depth up to 0.7 mm. Due to the combination ofmultiple optical foci and the ultrasonic array transducer, thelateral scanning range was reduced to only one pitch of themicrolens array; thus the imaging speed was much faster thansingle-focus OR-PAM with mechanical scanning. Potentiallythe imaging speed can be further improved by eliminatingthe 6∶1multiplexer, and using a higher PRR laser. Optical scan-ning within one pitch in the lateral direction can further improvethe imaging speed by several times. A more densely packed
microlens array with a smaller pitch might improve the imagingspeed, but this usually means a shorter working distance if wewant to maintain the NA or lateral resolution. Other multifocaldesigns might be developed to provide both a high NA and longworking distance.
AcknowledgmentsThis work was sponsored in part by National Institutes of Health(NIH) Grants R01 EB000712, R01 EB008085, R01 CA134539,U54 CA136398, R01 CA157277, R01 CA159959, and DP1EB016986 (NIH Director’s Pioneer Award). L. V. Wang hasa financial interest in Microphotoacoustics Inc., and EndraInc., which, however, did not support this work. K. I. Maslovhas a financial interest in Microphotoacoustics Inc., which didnot support this work. The authors appreciate James Ballard’sclose reading of the manuscript. They also thank Liang Song,Lidai Wang, Junjie Yao, and Jun Xia for helpful discussions andexperimental assistance.
References1. L. V. Wang, “Multiscale photoacoustic microscopy and computed
tomography,” Nat. Photon. 3(9), 503–509 (2009).2. S. Hu, K. Maslov, and L. V. Wang, “Second-generation optical-resolu-
tion photoacoustic microscopy with improved sensitivity and speed,”Opt. Lett. 36(7), 1134–1136 (2011).
3. J. Yao et al., “Double-illumination photoacoustic microscopy,” Opt.Lett. 37(4), 659–661 (2012).
4. P. Hajireza, W. Shi, and R. J. Zemp, “Label-free in vivo fiber-basedoptical-resolution photoacoustic microscopy,” Opt. Lett. 36(20),4107–4109 (2011).
5. A. Krumholz et al., “Functional photoacoustic microscopy of diabeticvasculature,” J. Biomed. Opt. 17(6), 060502 (2012).
6. J. Yao et al., “Wide-field fast-scanning photoacoustic microscopy basedon a water-immersible MEMS scanning mirror,” J. Biomed. Opt. 17(8),080505 (2012).
7. C. Zhang, K. Maslov, and L. V. Wang, “Subwavelength-resolutionlabel-free photoacoustic microscopy of optical absorption in vivo,”Opt. Lett. 35(19), 3195–3197 (2010).
8. C. Zhang et al., “Reflection-mode submicron-resolution in vivo photo-acoustic microscopy,” J. Biomed. Opt. 17(2), 020501 (2012).
9. P. Hajireza, W. Shi, and R. J. Zemp, “Real-time handheld optical-res-olution photoacoustic microscopy,” Opt. Express 19(21), 20097–20102(2011).
10. L. Song, K. Maslov, and L. V. Wang, “Multifocal optical-resolutionphotoacoustic microscopy in vivo,” Opt. Lett. 36(7), 1236–1238 (2011).
11. R. J. Zemp et al., “Realtime photoacoustic microscopy in vivowith a 30-MHz ultrasound array transducer,” Opt. Express 16(11), 7915–7928(2008).
Fig. 4 In vivo trans-cranial photoacoustic images of a nude mouse brainwith the skin removed. (a) MAP image of the brain. (b) Photograph of themouse brain with skin removed. The dashed box is the imaging areapresented in (a). (c) Snapshot from the 3-D animation showing the struc-ture in (a). (Video 2, MPEG, 4 MB) [URL: http://dx.doi.org/10.1117/1.JBO.18.3.030501.2].
Journal of Biomedical Optics 030501-3 March 2013 • Vol. 18(3)
JBO Letters
Downloaded From: http://biomedicaloptics.spiedigitallibrary.org/ on 03/04/2013 Terms of Use: http://spiedl.org/terms