Embed Size (px)
Citation preview
Reforming Public Pensions in the U.S. and the U.K.
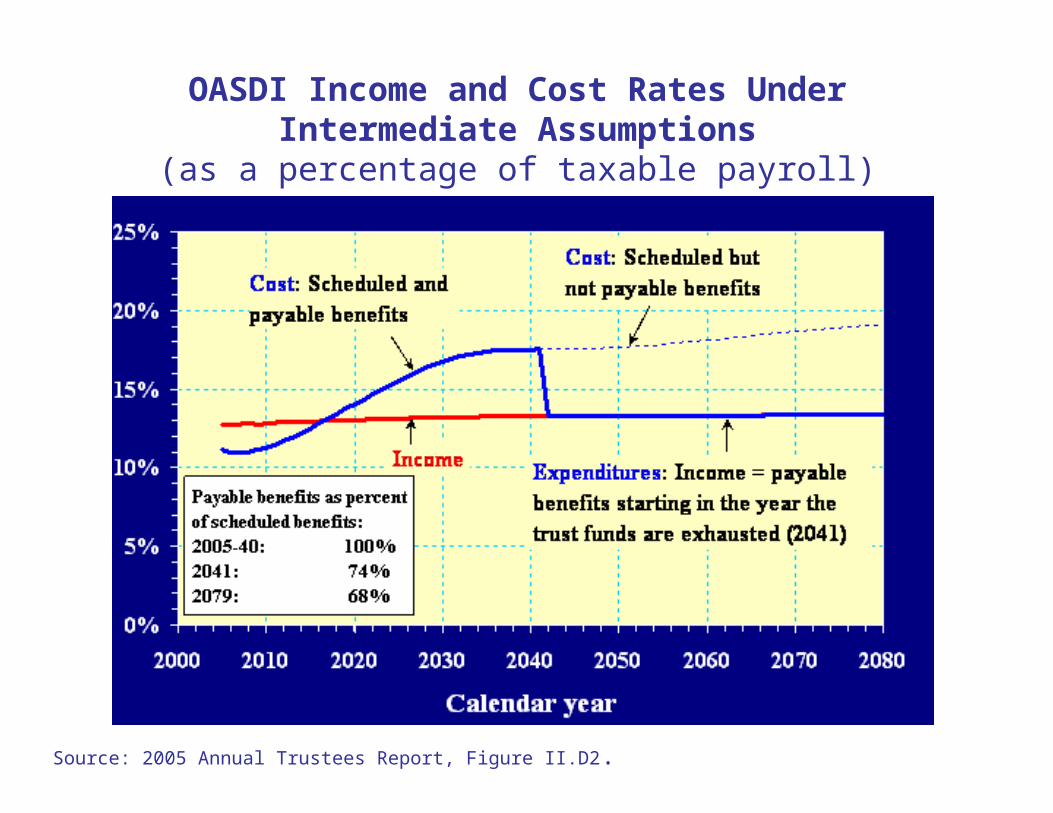
OASDI Income and Cost Rates Under Intermediate Assumptions
(as a percentage of taxable payroll)
Source: 2005 Annual Trustees Report, Figure II.D2.
Old Age, Survivors and Disability Insurance (OASDI)
Payroll tax rate ….12.4%, up to cap of $90,000 (indexed to
average earnings)
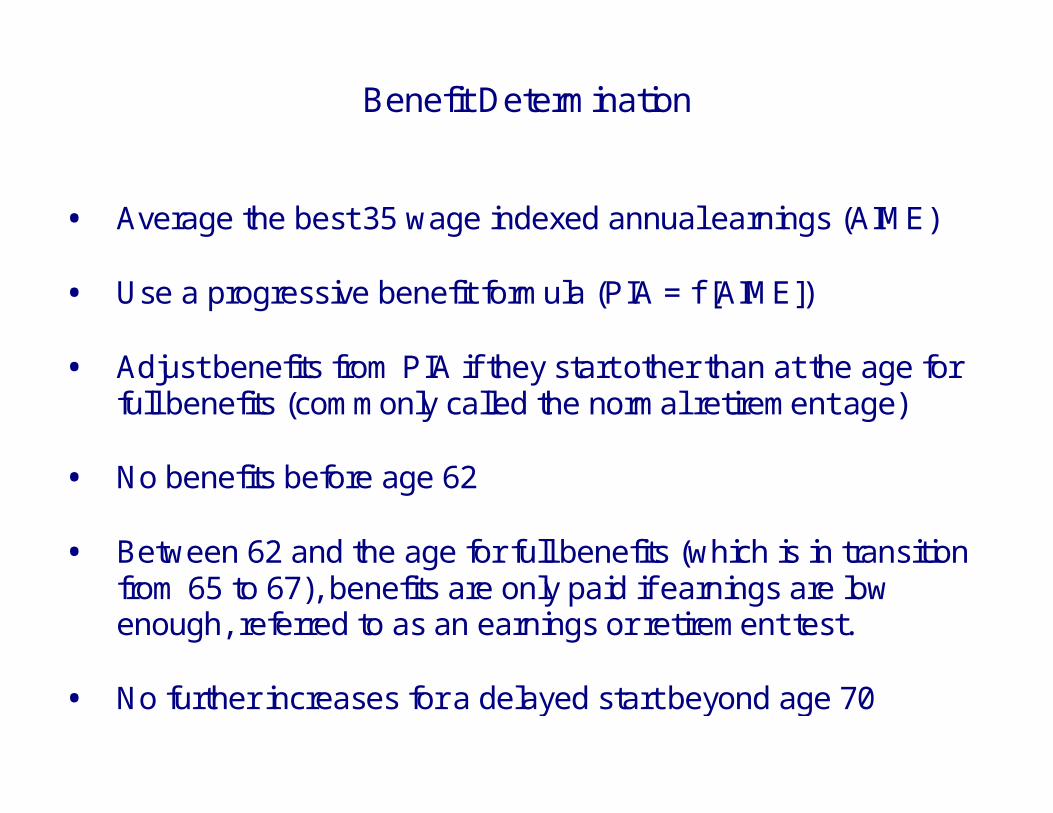
Benefit Determination
• Average the best 35 wage indexed annual earnings (AIME) • Use a progressive benefit formula (PIA = f [AIME]) • Adjust benefits from PIA if they start other than at the age for full benefits (commonly called the normal retirement age) • No benefits before age 62 • Between 62 and the age for full benefits (which is in transition from 65 to 67), benefits are only paid if earnings are low enough, referred to as an earnings or retirement test. • No further increases for a delayed start beyond age 70
0
20
40
60
80
100
120
140
62 63 64 65 66 67 68 68 70
AGE
PE
RC
EN
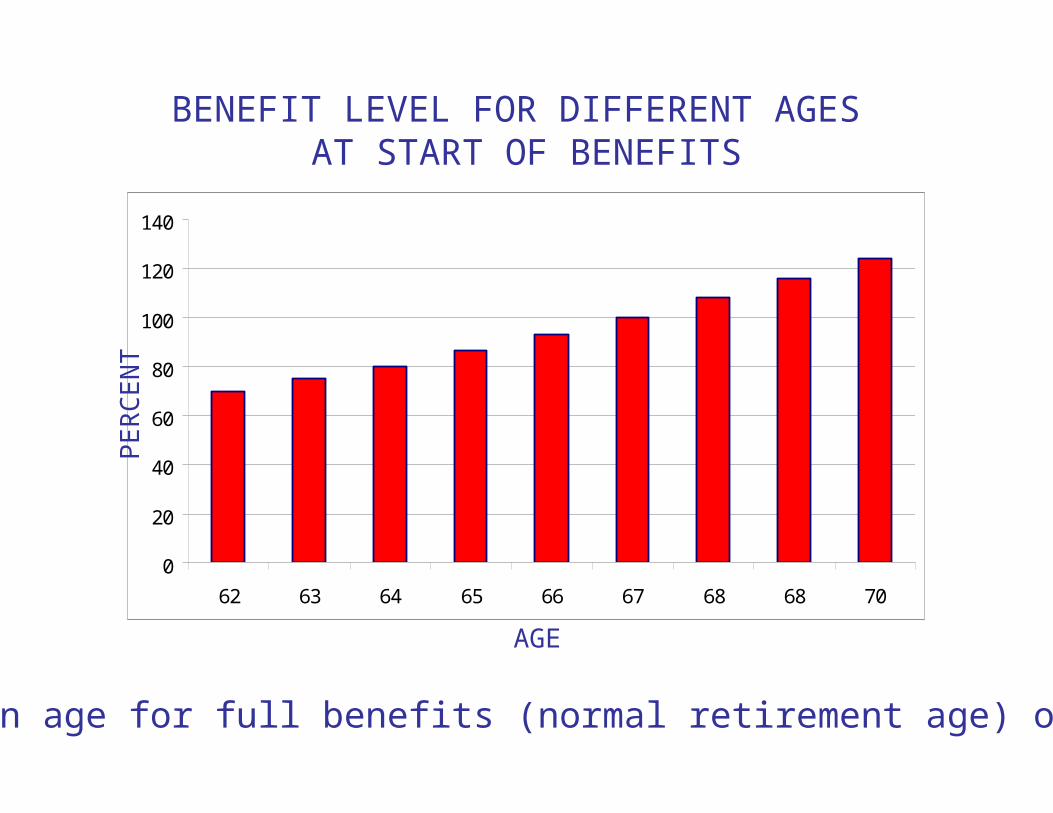
TBENEFIT LEVEL FOR DIFFERENT AGES
AT START OF BENEFITS
For an age for full benefits (normal retirement age) of 67.
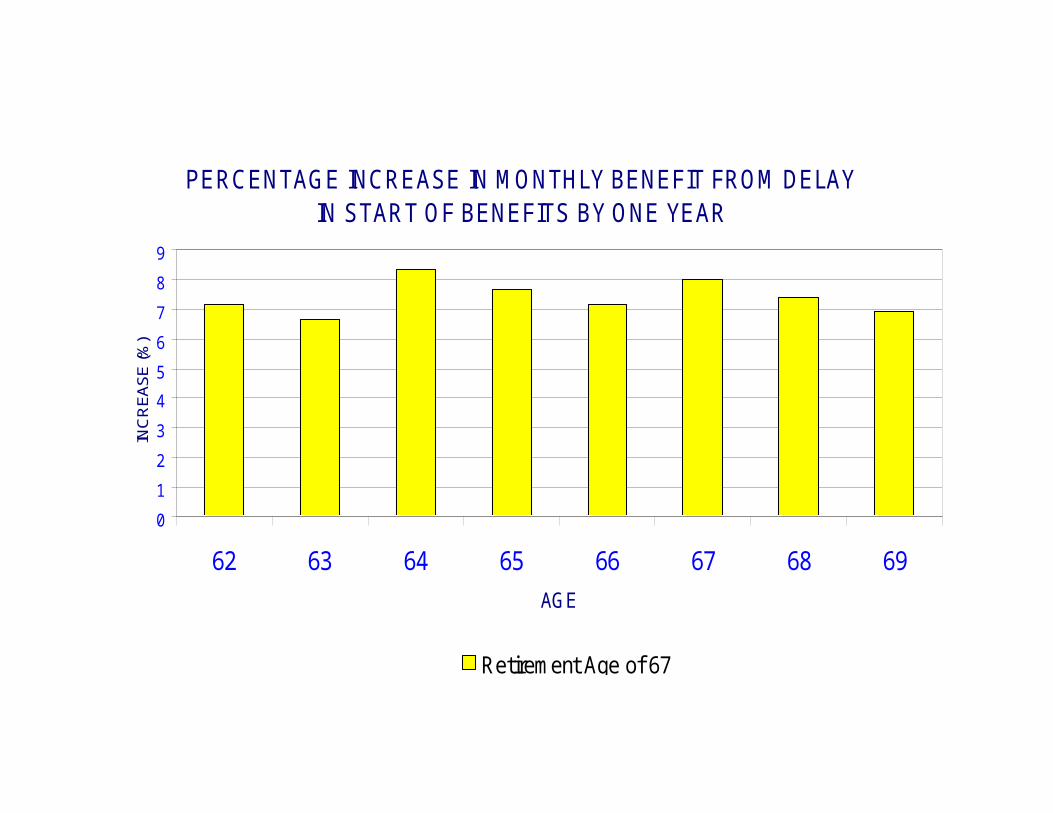
PERCENTAGE INCREASE IN MONTHLY BENEFIT FROM DELAY IN START OF BENEFITS BY ONE YEAR
0
1
2
3
4
5
6
7
8
9
62 63 64 65 66 67 68 69
AGE
INC
RE
AS
E (%
)
Retirement Age of 67
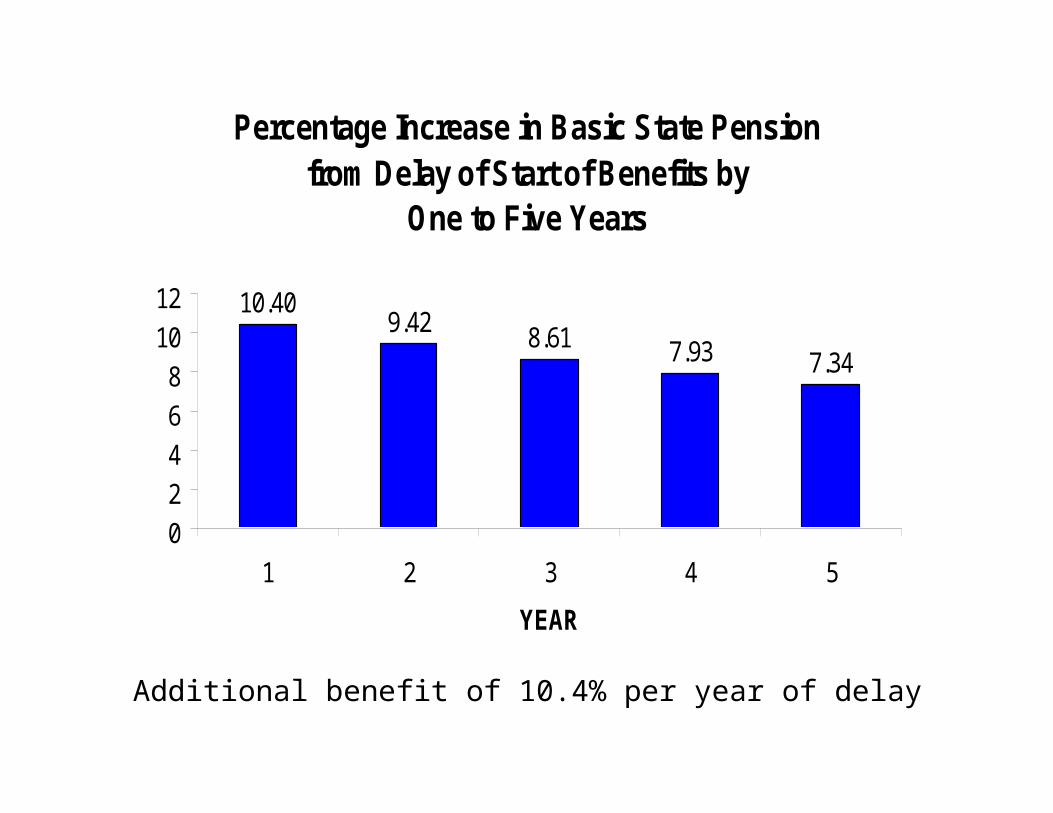
Additional benefit of 10.4% per year of delay
Percentage Increase in Basic State Pension from Delay of Start of Benefits by
One to Five Years
9.42 8.61 7.93 7.34
10.40
0
2
4
6
8
10
12
1 2 3 4 5
YEAR
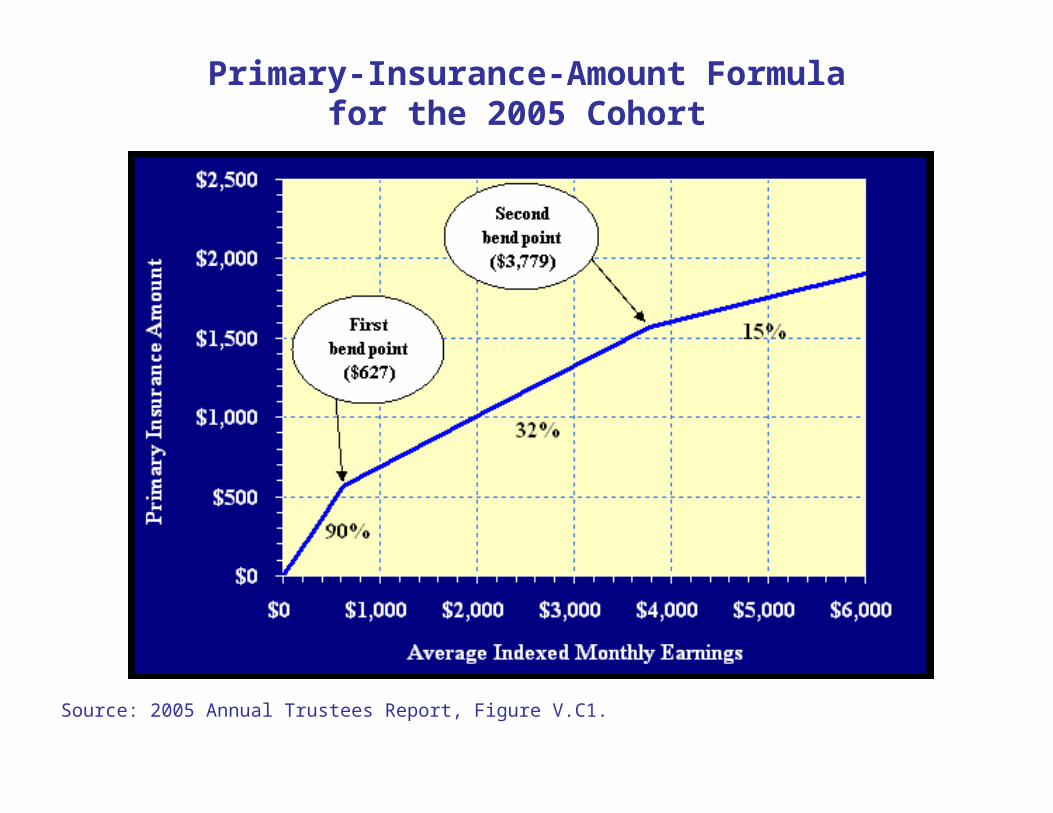
Primary-Insurance-Amount Formulafor the 2005 Cohort
Source: 2005 Annual Trustees Report, Figure V.C1.
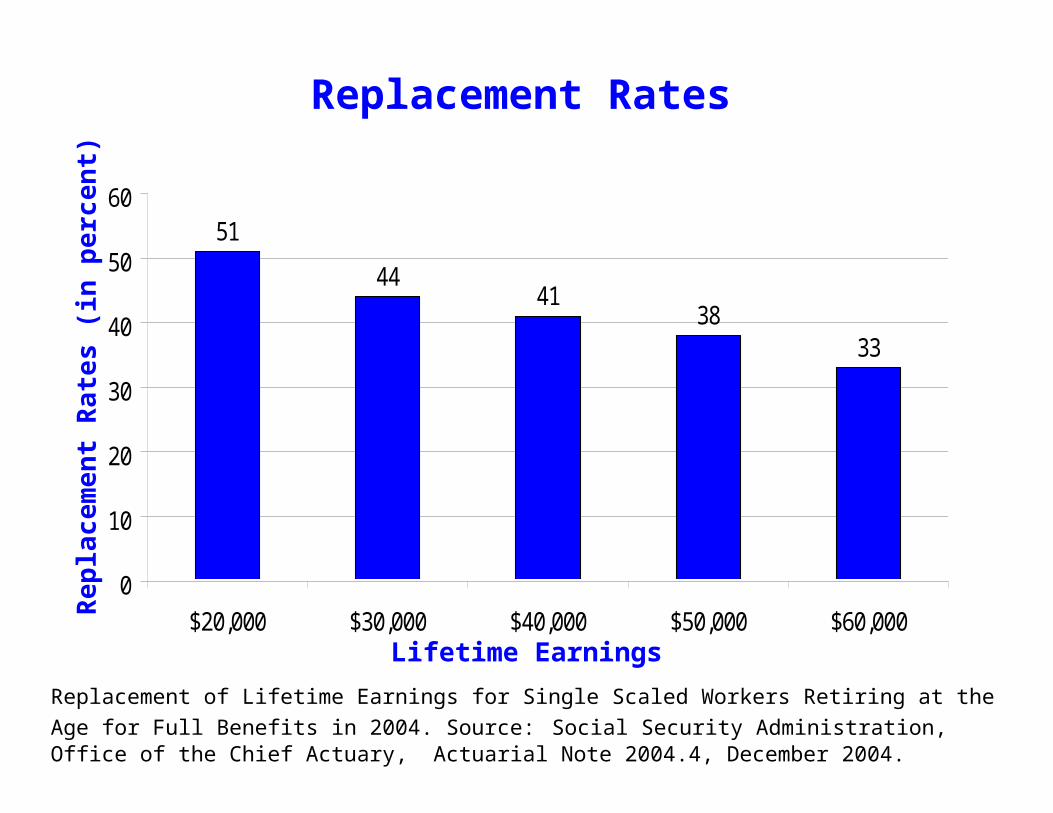
51
4441
3833
0
10
20
30
40
50
60
$20,000 $30,000 $40,000 $50,000 $60,000
Replacement RatesR
ep
lac
em
en
t R
ate
s (
in p
erce
nt)
Lifetime Earnings
Replacement of Lifetime Earnings for Single Scaled Workers Retiring at the Age for Full Benefits in
2004. Source: Social Security Administration, Office of the Chief Actuary, Actuarial Note 2004.4, December 2004.
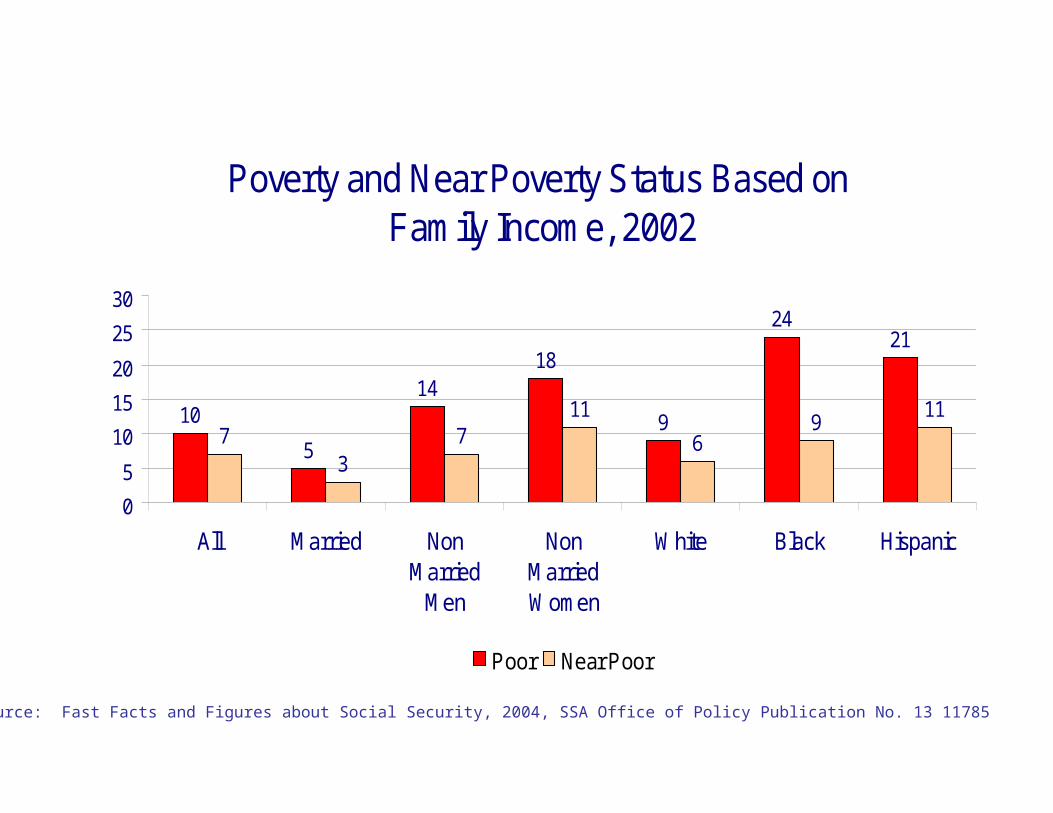
Poverty and Near Poverty Status Based on Family Income, 2002
10
5
1418
9
2421
73
711
69
11
0
5
10
15
20
25
30
All Married NonMarried
Men
NonMarriedWomen
White Black Hispanic
Poor Near Poor
Source: Fast Facts and Figures about Social Security, 2004, SSA Office of Policy Publication No. 13 11785
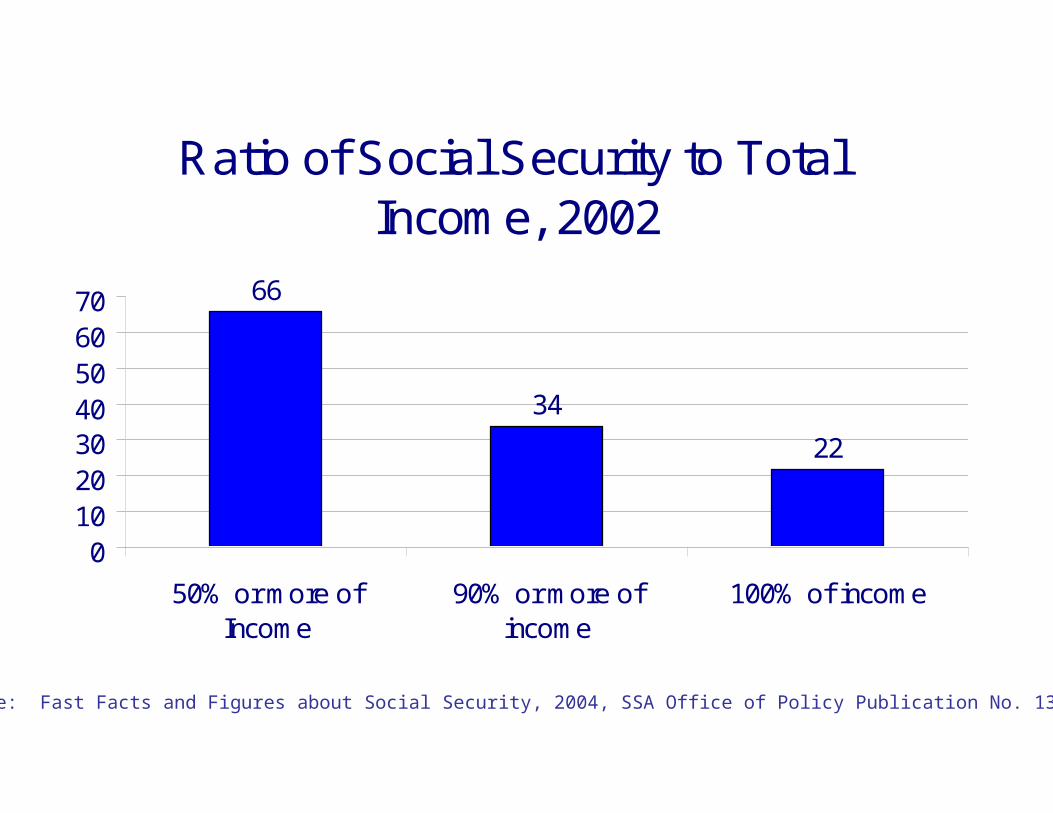
Ratio of Social Security to Total Income, 2002
66
34
22
010203040506070
50% or more ofIncome
90% or more ofincome
100% of income
Source: Fast Facts and Figures about Social Security, 2004, SSA Office of Policy Publication No. 13 11785

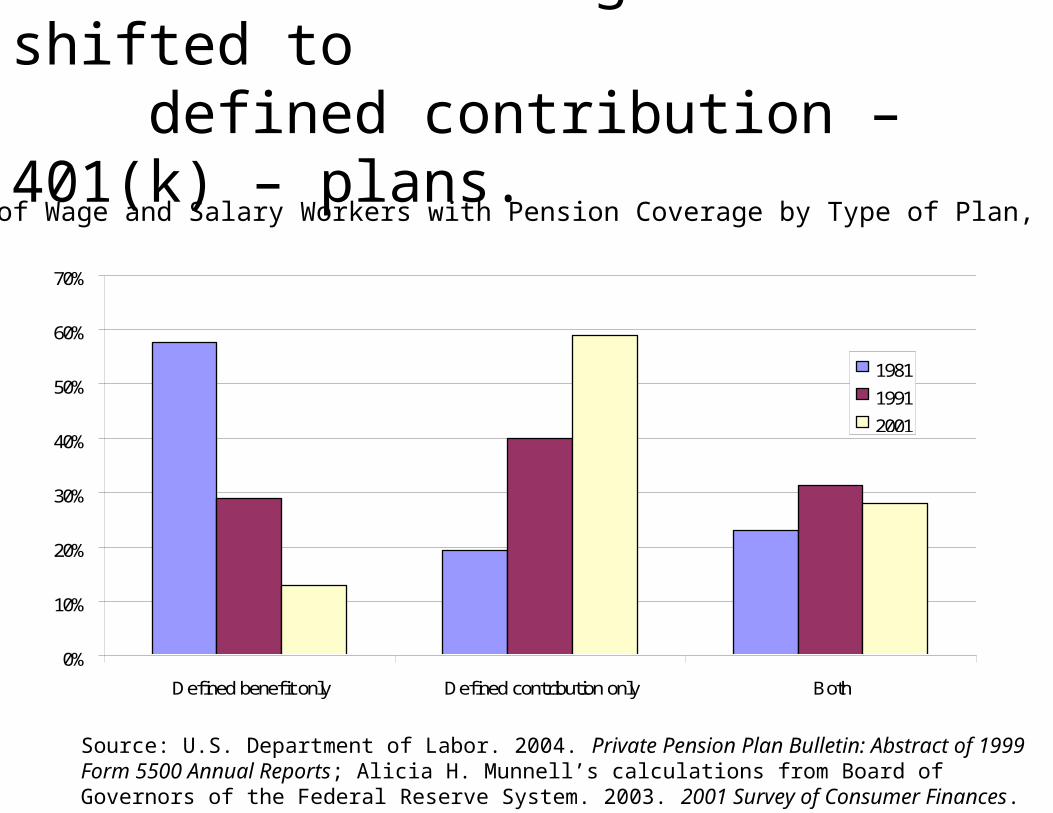
Pension coverage has shifted to defined contribution – 401(k) – plans.
Percent of Wage and Salary Workers with Pension Coverage by Type of Plan, 1981-2001
Source: U.S. Department of Labor. 2004. Private Pension Plan Bulletin: Abstract of 1999 Form 5500 Annual Reports; Alicia H. Munnell’s calculations from Board of Governors of the Federal Reserve System. 2003. 2001 Survey of Consumer Finances.
0%
10%
20%
30%
40%
50%
60%
70%
Defined benefit only Defined contribution only Both
1981
1991
2001
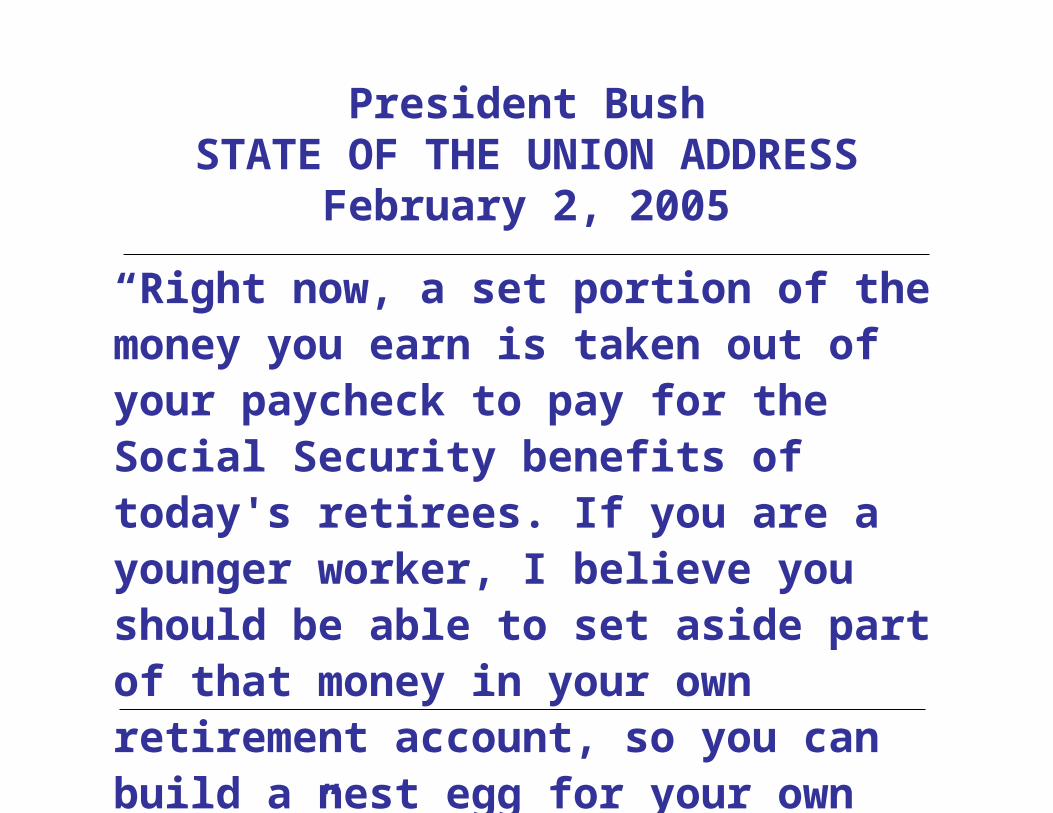
President BushSTATE OF THE UNION ADDRESS
February 2, 2005
“Right now, a set portion of the money you earn is taken out of your paycheck to pay for the Social Security benefits of today's retirees. If you are a younger worker, I believe you should be able to set aside part of that money in your own retirement account, so you can build a nest egg for your own future.”
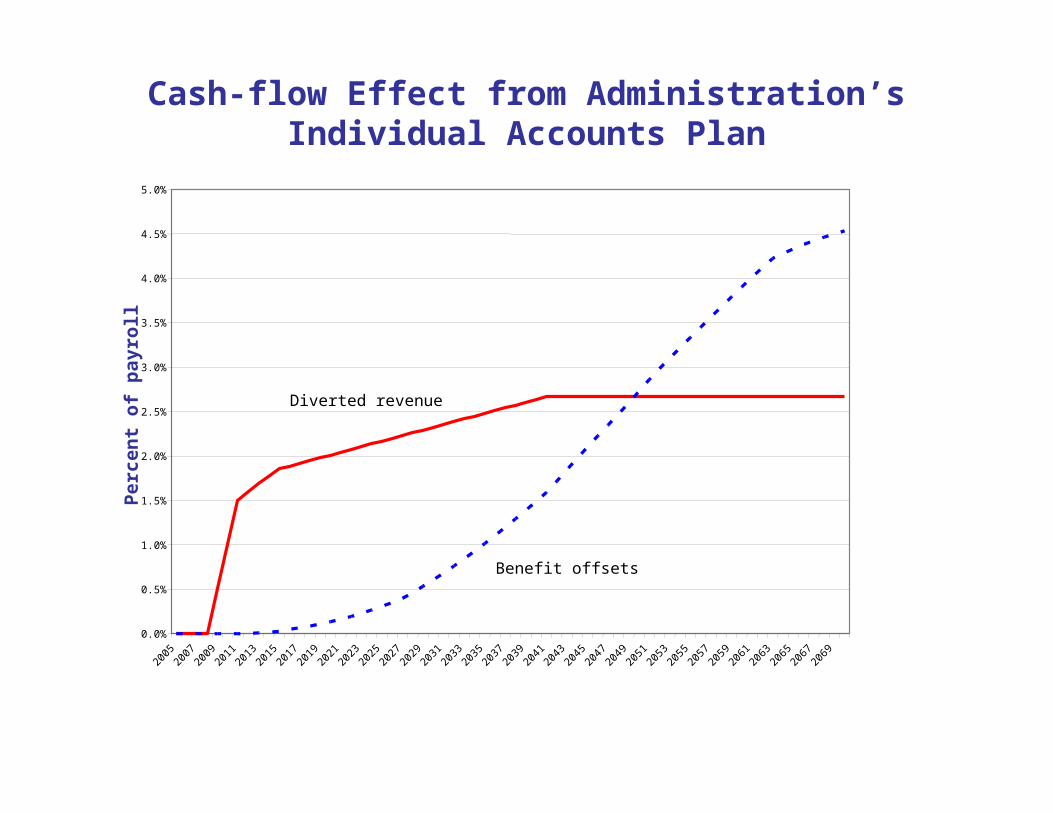
0.0%
0.5%
1.0%
1.5%
2.0%
2.5%
3.0%
3.5%
4.0%
4.5%
5.0%
2005
2007
2009
2011
2013
2015
2017
2019
2021
2023
2025
2027
2029
2031
2033
2035
2037
2039
2041
2043
2045
2047
2049
2051
2053
2055
2057
2059
2061
2063
2065
2067
2069
Per
cen
t o
f p
ayro
ll
Diverted revenue
Benefit offsets
Cash-flow Effect from Administration’sIndividual Accounts Plan
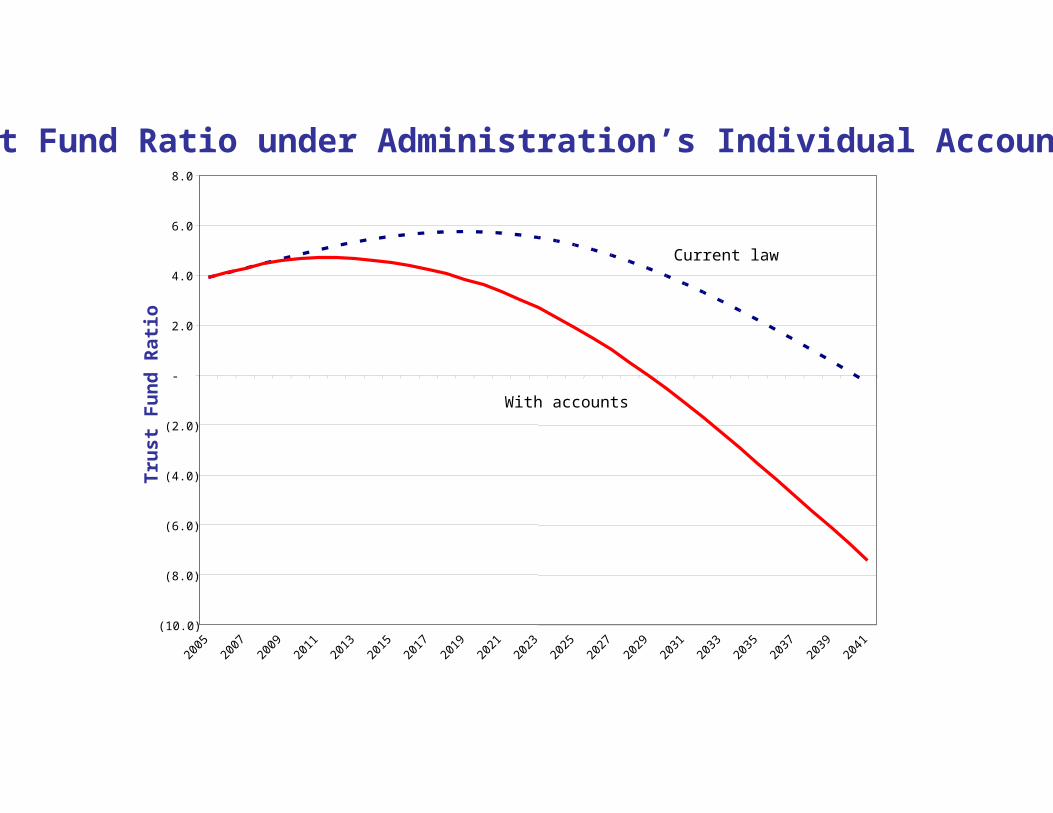
Trust Fund Ratio under Administration’s Individual Account Plan
(10.0)
(8.0)
(6.0)
(4.0)
(2.0)
-
2.0
4.0
6.0
8.0
2005
2007
2009
2011
2013
2015
2017
2019
2021
2023
2025
2027
2029
2031
2033
2035
2037
2039
2041
Tru
st F
un
d R
ati
o
Current law
With accounts
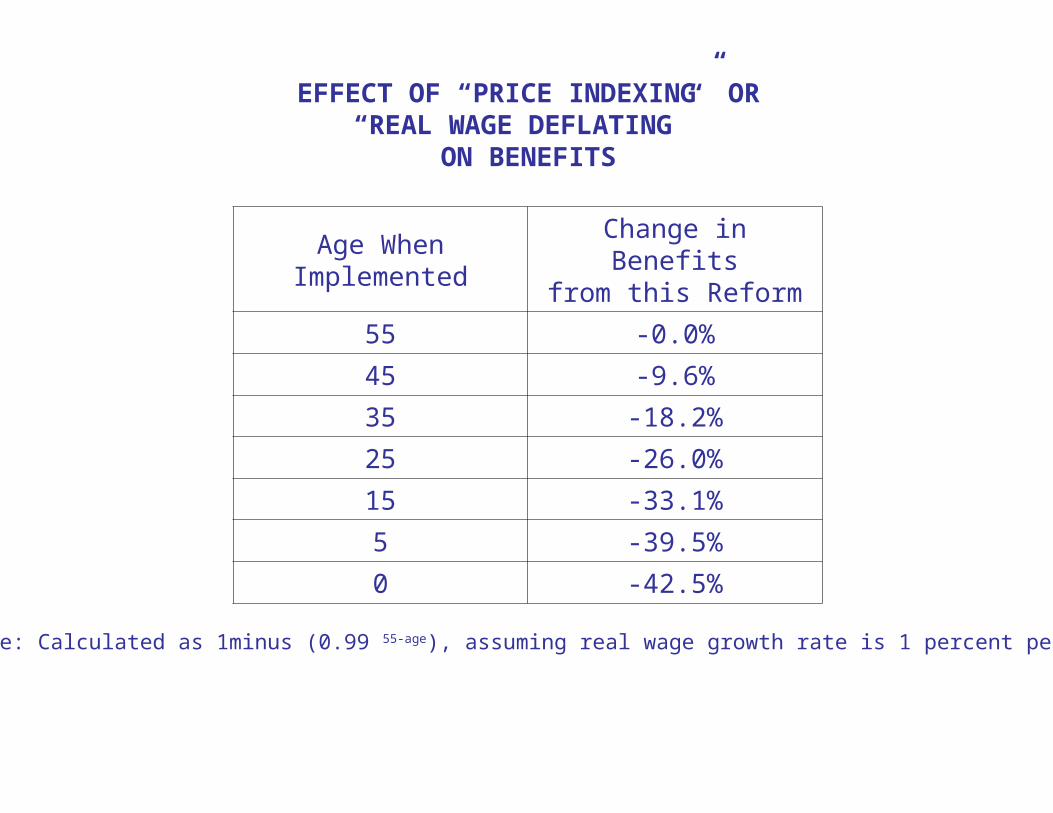
EFFECT OF “PRICE INDEXING” OR“REAL WAGE DEFLATING”
ON BENEFITS
Age WhenImplemented
Change in Benefitsfrom this Reform
55 -0.0%
45 -9.6%
35 -18.2%
25 -26.0%
15 -33.1%
5 -39.5%
0 -42.5%
Note: Calculated as 1minus (0.99 55-age), assuming real wage growth rate is 1 percent per year.
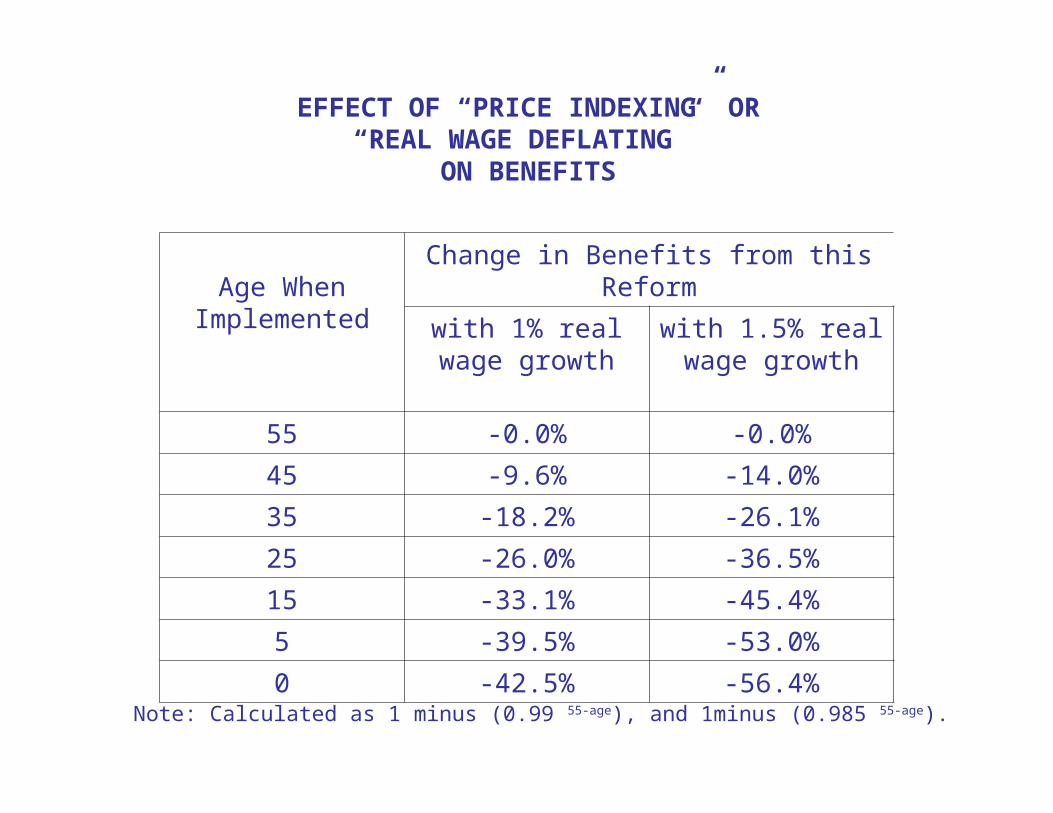
EFFECT OF “PRICE INDEXING” OR“REAL WAGE DEFLATING”
ON BENEFITS
Age WhenImplemented
Change in Benefits from this Reform
with 1% real wage growth
with 1.5% real wage growth
55 -0.0% -0.0%
45 -9.6% -14.0%
35 -18.2% -26.1%
25 -26.0% -36.5%
15 -33.1% -45.4%
5 -39.5% -53.0%
0 -42.5% -56.4%
Note: Calculated as 1 minus (0.99 55-age), and 1minus (0.985 55-age).
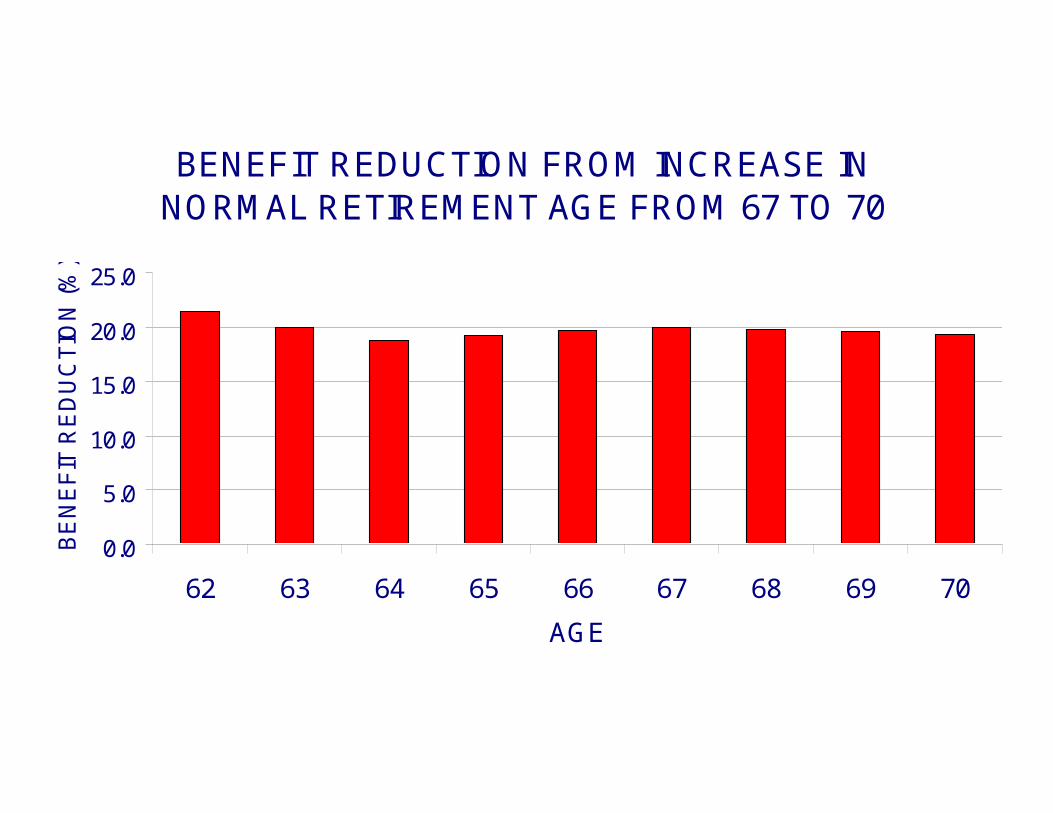
BENEFIT REDUCTION FROM INCREASE INNORMAL RETIREMENT AGE FROM 67 TO 70
0.0
5.0
10.0
15.0
20.0
25.0
62 63 64 65 66 67 68 69 70
AGE
BE
NE
FIT
RE
DU
CT
ION
(%
)
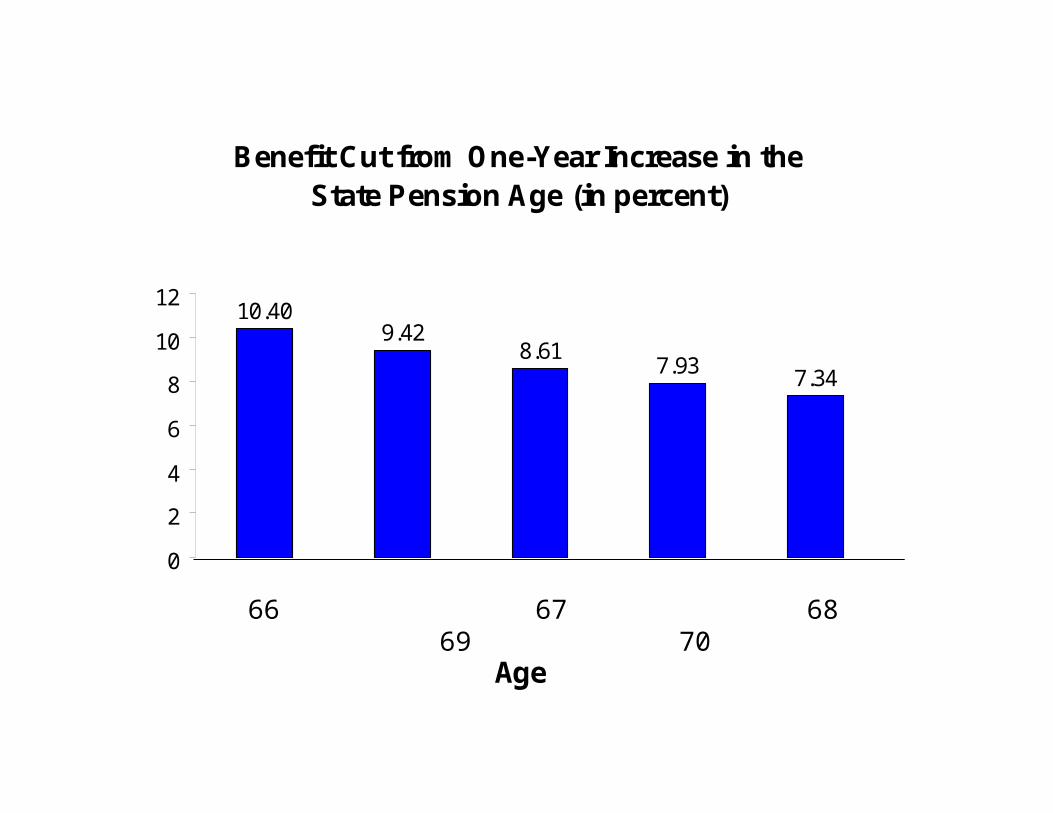
66 67 68 69 70
Age
Benefit Cut from One-Year Increase in the State Pension Age (in percent)
9.428.61
7.93 7.34
10.40
0
2
4
6
8
10
12


Percent of 75-year shortfall met
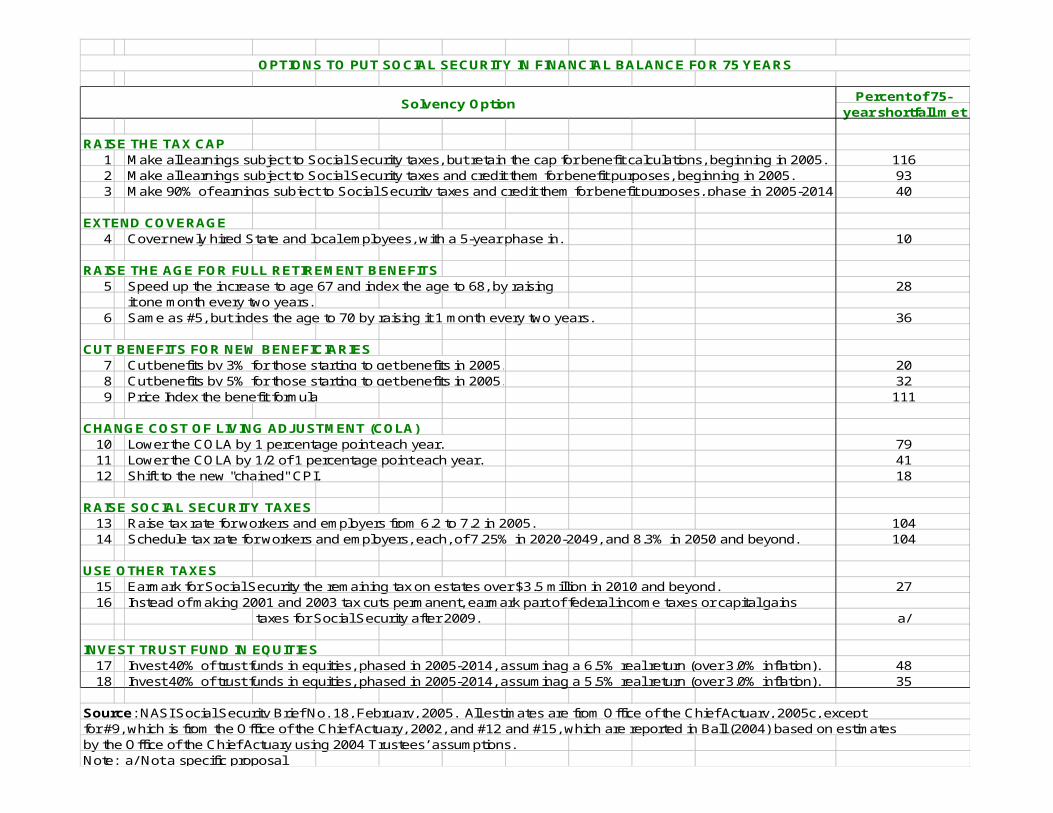
RAISE THE TAX CAP1 Make all earnings subject to Social Security taxes, but retain the cap for benefit calculations, beginning in 2005. 1162 Make all earnings subject to Social Security taxes and credit them for benefit purposes, beginning in 2005. 933 Make 90% of earnings subject to Social Security taxes and credit them for benefit purposes, phase in 2005-2014. 40
EXTEND COVERAGE4 Cover newly hired State and local employees, with a 5-year phase in. 10
RAISE THE AGE FOR FULL RETIREMENT BENEFITS5 Speed up the increase to age 67 and index the age to 68, by raising 28
it one month every two years.6 Same as #5, but indes the age to 70 by raising it 1 month every two years. 36
CUT BENEFITS FOR NEW BENEFICIARIES7 Cut benefits by 3% for those starting to get benefits in 2005. 208 Cut benefits by 5% for those starting to get benefits in 2005. 329 Price Index the benefit formula 111
CHANGE COST OF LIVING ADJUSTMENT (COLA)10 Lower the COLA by 1 percentage point each year. 7911 Lower the COLA by 1/2 of 1 percentage point each year. 4112 Shift to the new "chained" CPI. 18
RAISE SOCIAL SECURITY TAXES13 Raise tax rate for workers and employers from 6.2 to 7.2 in 2005. 10414 Schedule tax rate for workers and employers, each, of 7.25% in 2020-2049, and 8.3% in 2050 and beyond. 104
USE OTHER TAXES15 Earmark for Social Security the remaining tax on estates over $3.5 million in 2010 and beyond. 2716 Instead of making 2001 and 2003 tax cuts permanent, earmark part of federal income taxes or capital gains
taxes for Social Security after 2009. a/
INVEST TRUST FUND IN EQUITIES17 Invest 40% of trust funds in equities, phased in 2005-2014, assuminag a 6.5% real return (over 3.0% inflation). 4818 Invest 40% of trust funds in equities, phased in 2005-2014, assuminag a 5.5% real return (over 3.0% inflation). 35
Source: NASI Social Security Brief No. 18, February, 2005. All estimates are from Office of the Chief Actuary, 2005c, exceptfor #9, which is from the Office of the Chief Actuary, 2002, and #12 and #15, which are reported in Ball (2004) based on estimatesby the Office of the Chief Actuary using 2004 Trustees’ assumptions. Note: a/ Not a specific proposal
Solvency Option
OPTIONS TO PUT SOCIAL SECURITY IN FINANCIAL BALANCE FOR 75 YEARS
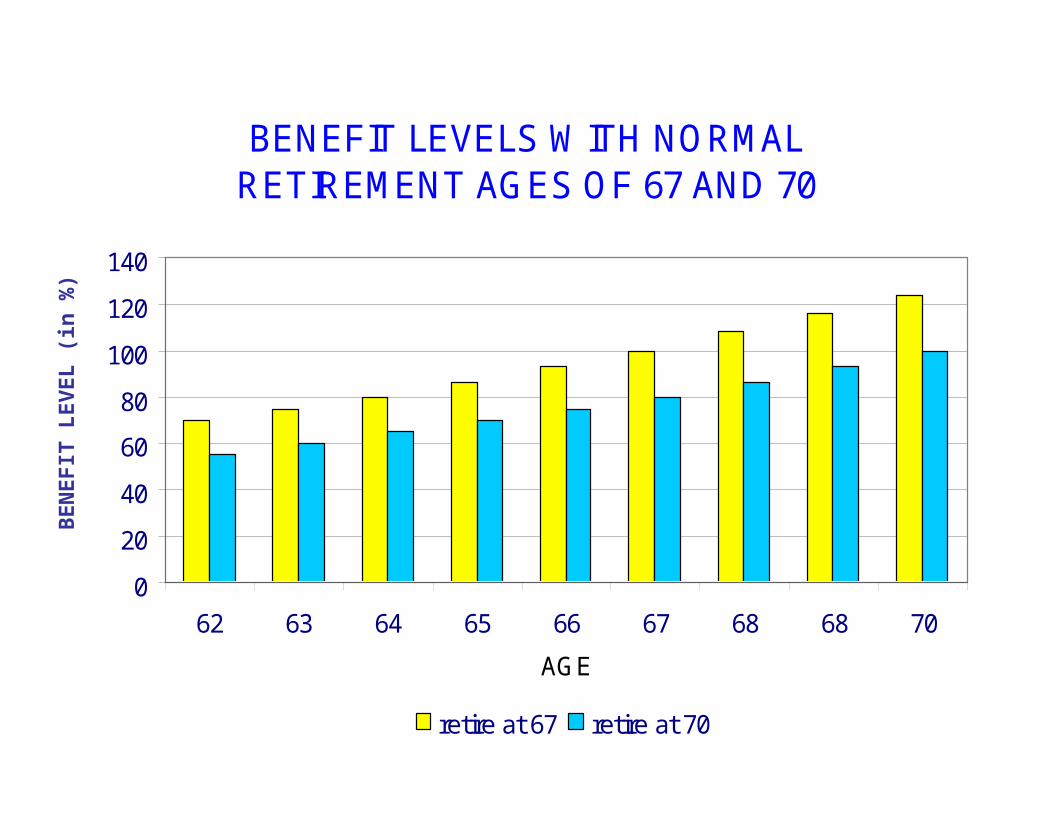
BENEFIT LEVELS WITH NORMAL RETIREMENT AGES OF 67 AND 70
0
20
40
60
80
100
120
140
62 63 64 65 66 67 68 68 70
AGE
retire at 67 retire at 70
BE
NE
FIT
LE
VE
L (
in %
)
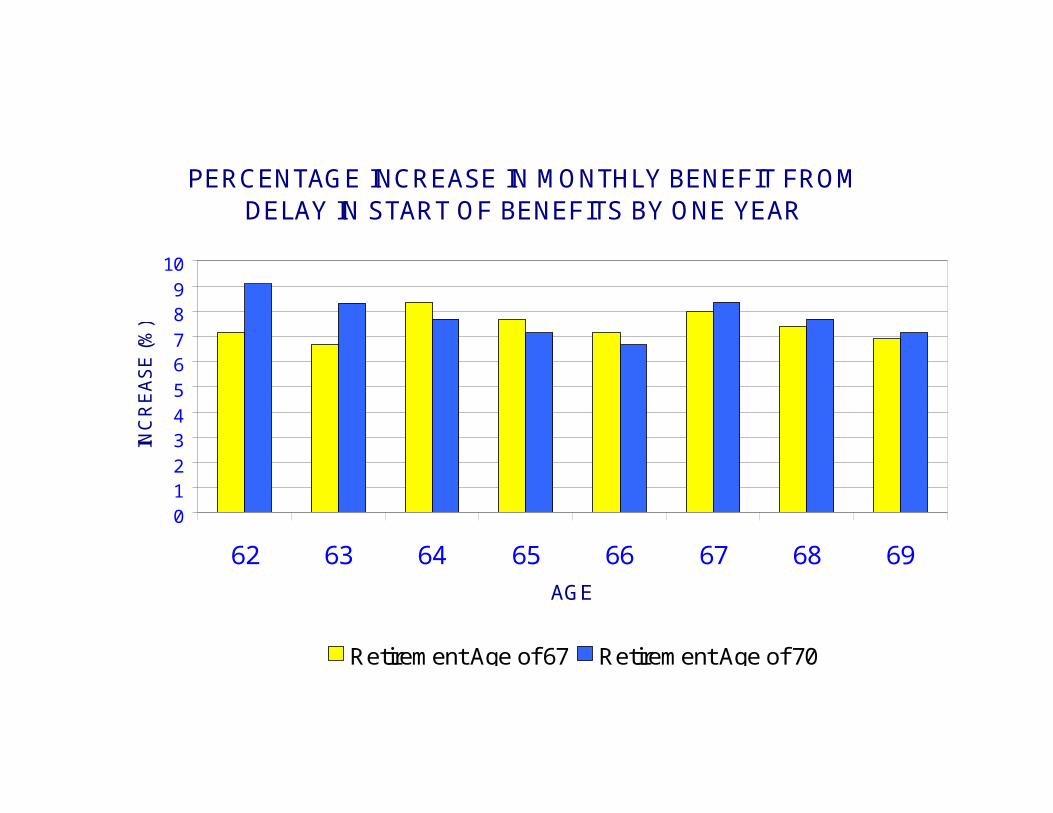
PERCENTAGE INCREASE IN MONTHLY BENEFIT FROM DELAY IN START OF BENEFITS BY ONE YEAR
0123456789
10
62 63 64 65 66 67 68 69
AGE
INC
RE
AS
E (
%)
Retirement Age of 67 Retirement Age of 70
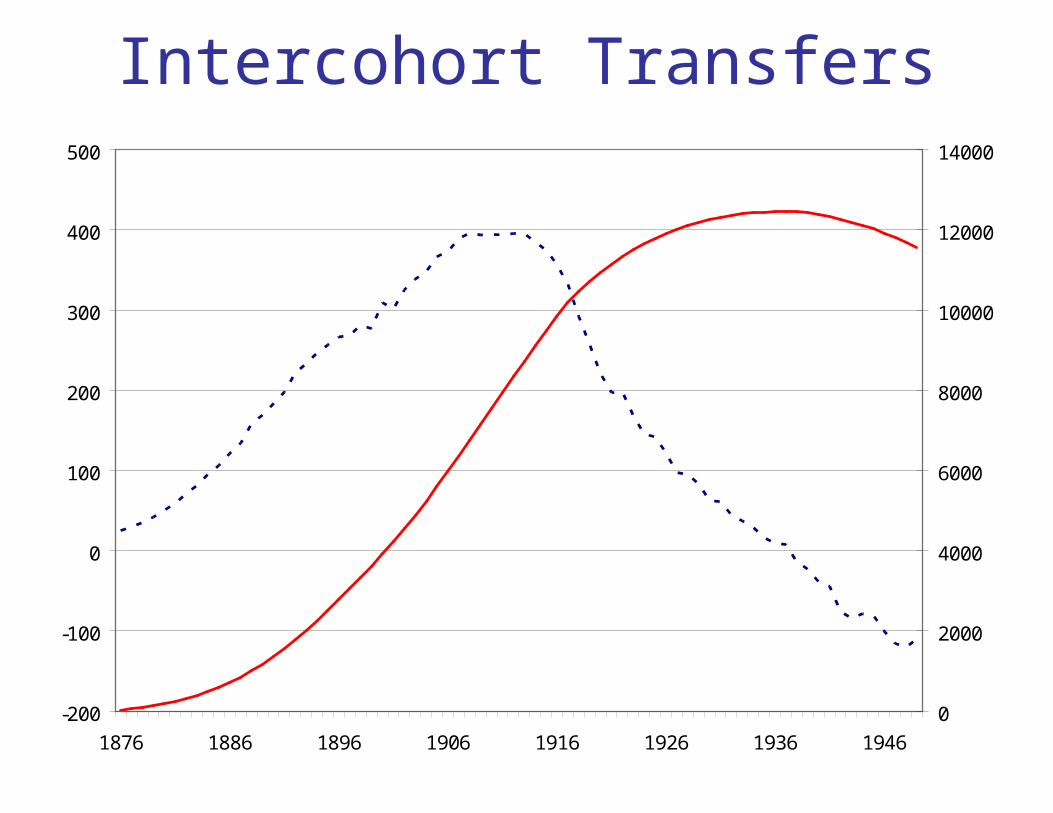
Intercohort Transfers
-200
-100
0
100
200
300
400
500
1876 1886 1896 1906 1916 1926 1936 1946
0
2000
4000
6000
8000
10000
12000
14000Annual Amount: PV $2002, billions Cumulative: PV $2002, billions
Net transfers to cohort born in
each year
Cumulative Sum: net transfers to all cohorts
born in and prior to each year
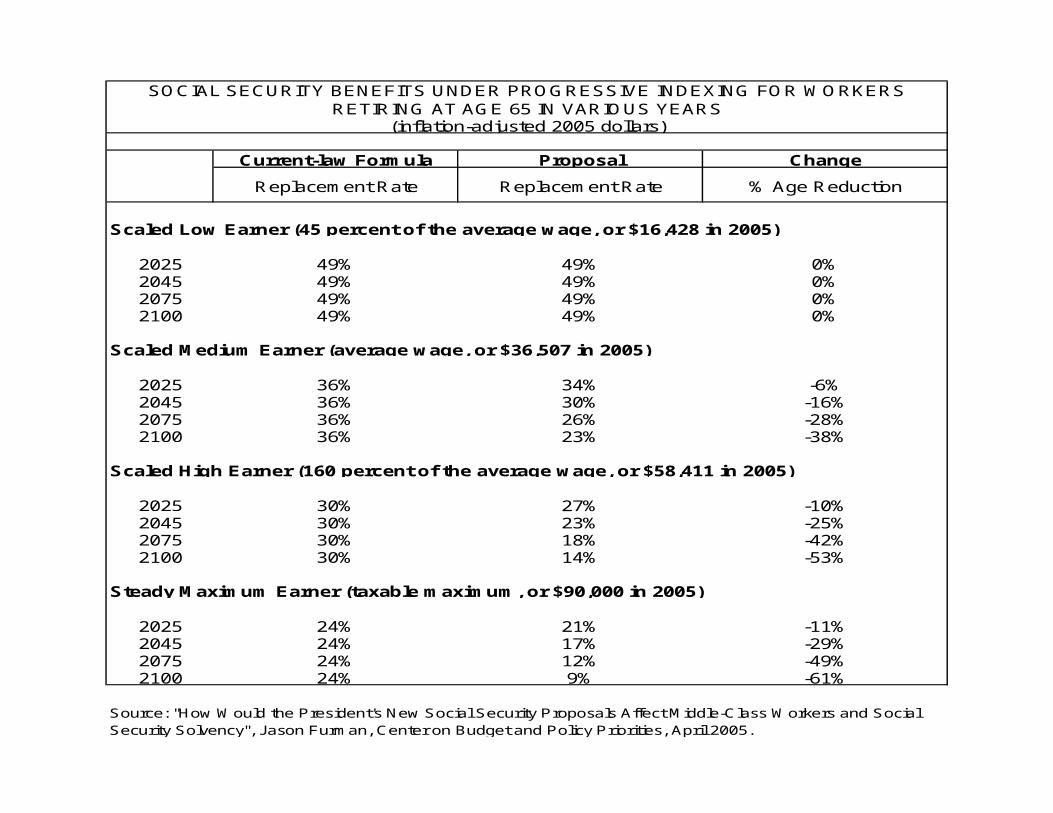
Scaled Low Earner (45 percent of the average wage, or $16,428 in 2005)
2025204520752100
Scaled Medium Earner (average wage, or $36,507 in 2005)
2025204520752100
Scaled High Earner (160 percent of the average wage, or $58,411 in 2005)
2025204520752100
Steady Maximum Earner (taxable maximum, or $90,000 in 2005)
2025204520752100
Source: "How Would the President's New Social Security Proposals Affect Middle-Class Workers and Social Security Solvency", Jason Furman, Center on Budget and Policy Priorities, April 2005.
SOCIAL SECURITY BENEFITS UNDER PROGRESSIVE INDEXING FOR WORKERS RETIRING AT AGE 65 IN VARIOUS YEARS
(inflation-adjusted 2005 dollars)
Current-law Formula Proposal Change
Replacement Rate Replacement Rate % Age Reduction
49% 0%49%49%49%49%
0%0%0%
36% -6%
49%49%49%
34%30%26%23%
-16%-28%-38%
30% -10%
36%36%36%
27%23%18%14%
-25%-42%-53%
24% -11%
30%30%30%
21%17%12%9%
-29%-49%-61%
24%24%24%