Embed Size (px)
Citation preview
Refrigeration Plant Energy Efficiency.
How to minimize running costs!
Dr Michael Bellstedt
Minus40 Pty Ltd
Sydney
Refrigeration in the meat industry
Refrigeration – the largest, yet most neglected
power user!
The energy and carbon cost threats
Synthetic refrigerants – get out now!
Energy efficiency
Where is power used?
Importance of plant stability
Overview of energy savings opportunities
Conclusions and Recommendations
Government finance and funding
Energy
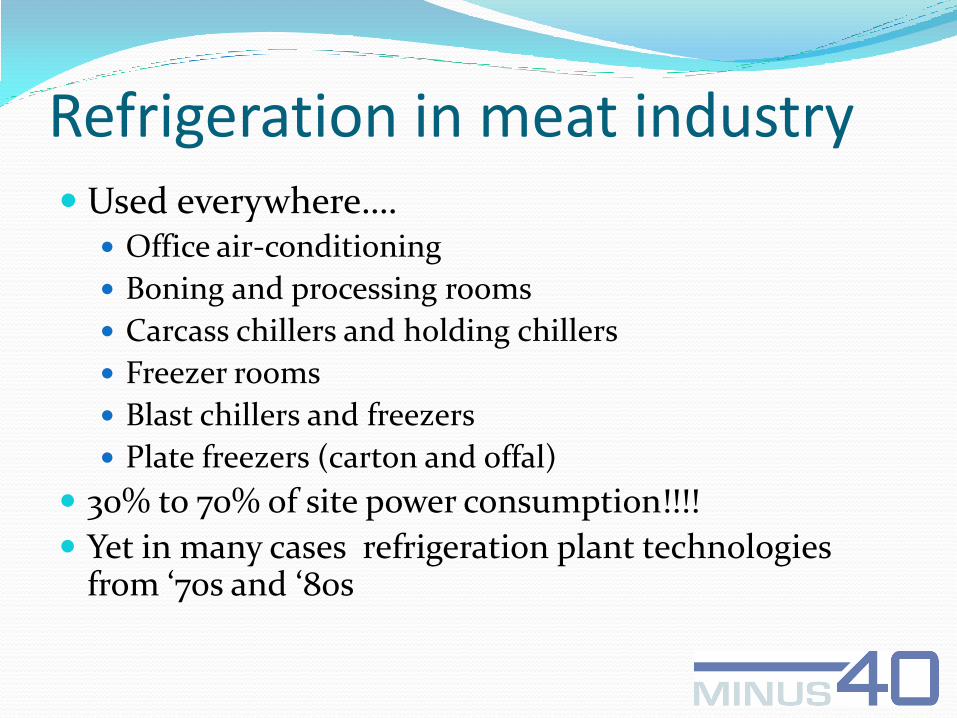
Refrigeration in meat industry Used everywhere….
Office air-conditioning
Boning and processing rooms
Carcass chillers and holding chillers
Freezer rooms
Blast chillers and freezers
Plate freezers (carton and offal)
30% to 70% of site power consumption!!!!
Yet in many cases refrigeration plant technologies from ‘70s and ‘80s
5
5
10
15
20
19
95
/96
19
97
/98
19
99
/00
20
01
/02
20
03
/04
20
05
/06
20
07
/08
20
09
/10
20
11
/12
20
13
/14
20
15
/16
20
17
/18
20
19
/20
Ele
ctri
city
Pri
ce (
c/kW
h)
Year
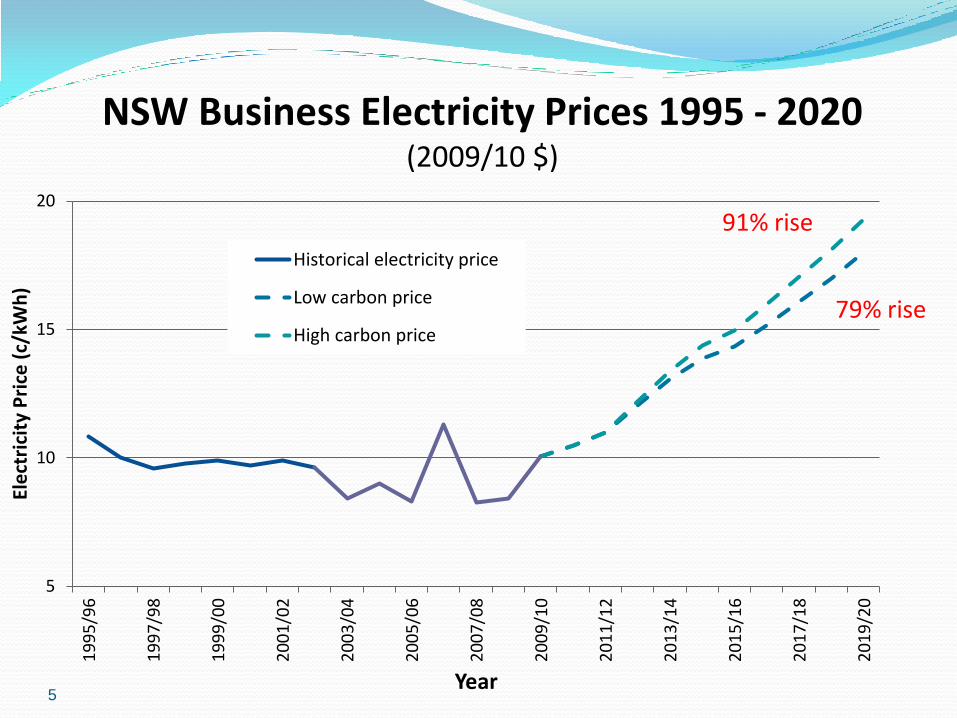
NSW Business Electricity Prices 1995 - 2020 (2009/10 $)
Historical electricity price
Low carbon price
High carbon price79% rise
91% rise
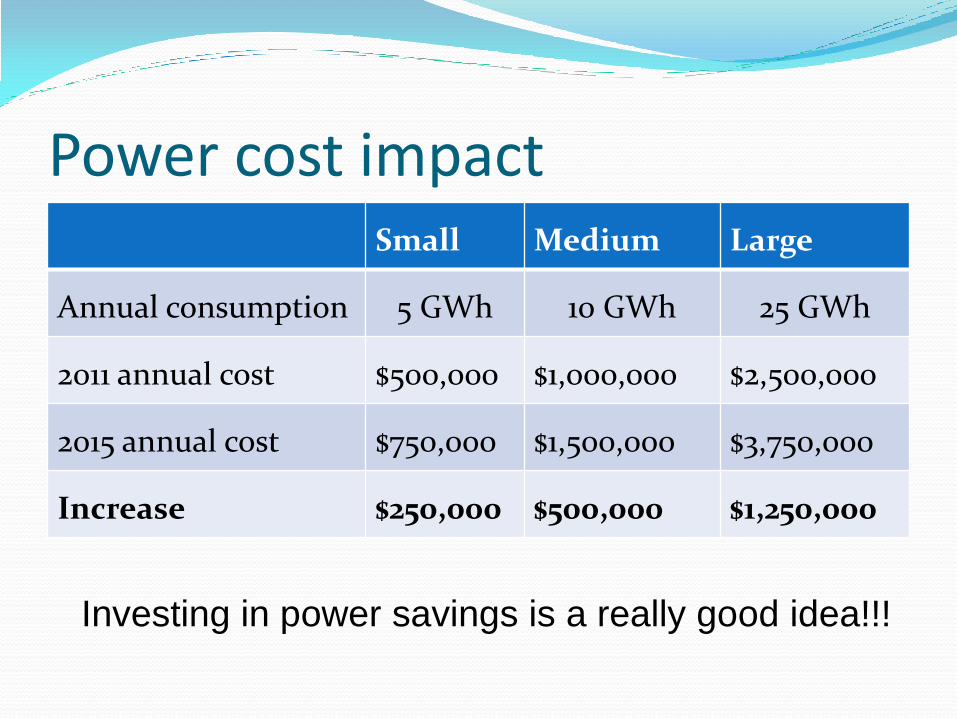
Power cost impact Small Medium Large
Annual consumption 5 GWh 10 GWh 25 GWh
2011 annual cost $500,000 $1,000,000 $2,500,000
2015 annual cost $750,000 $1,500,000 $3,750,000
Increase $250,000 $500,000 $1,250,000
Investing in power savings is a really good idea!!!
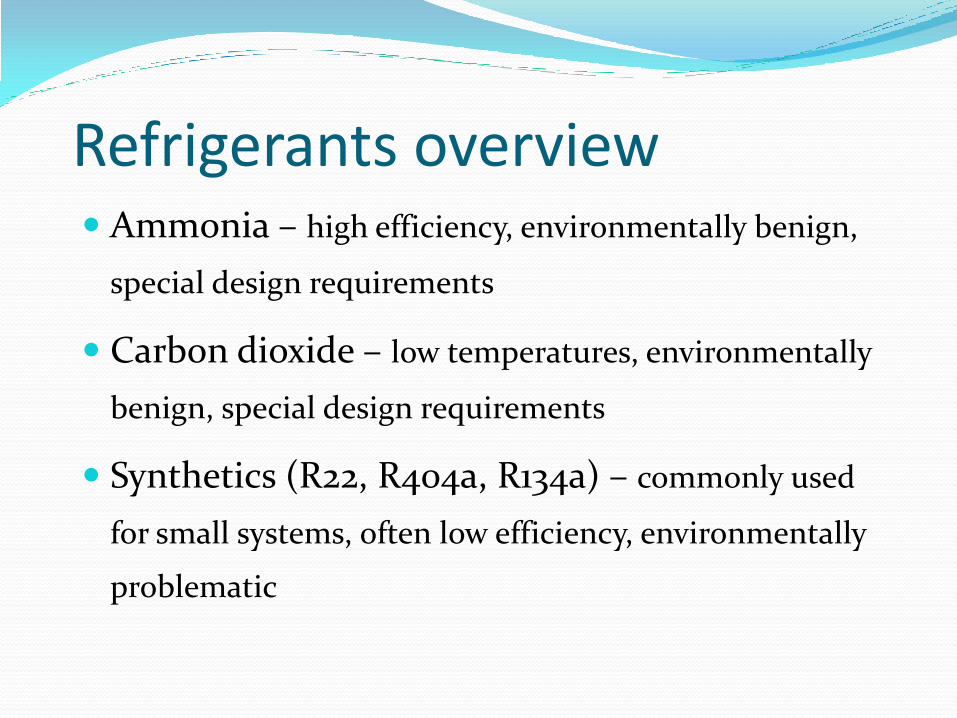
Refrigerants overview Ammonia – high efficiency, environmentally benign,
special design requirements
Carbon dioxide – low temperatures, environmentally
benign, special design requirements
Synthetics (R22, R404a, R134a) – commonly used
for small systems, often low efficiency, environmentally
problematic
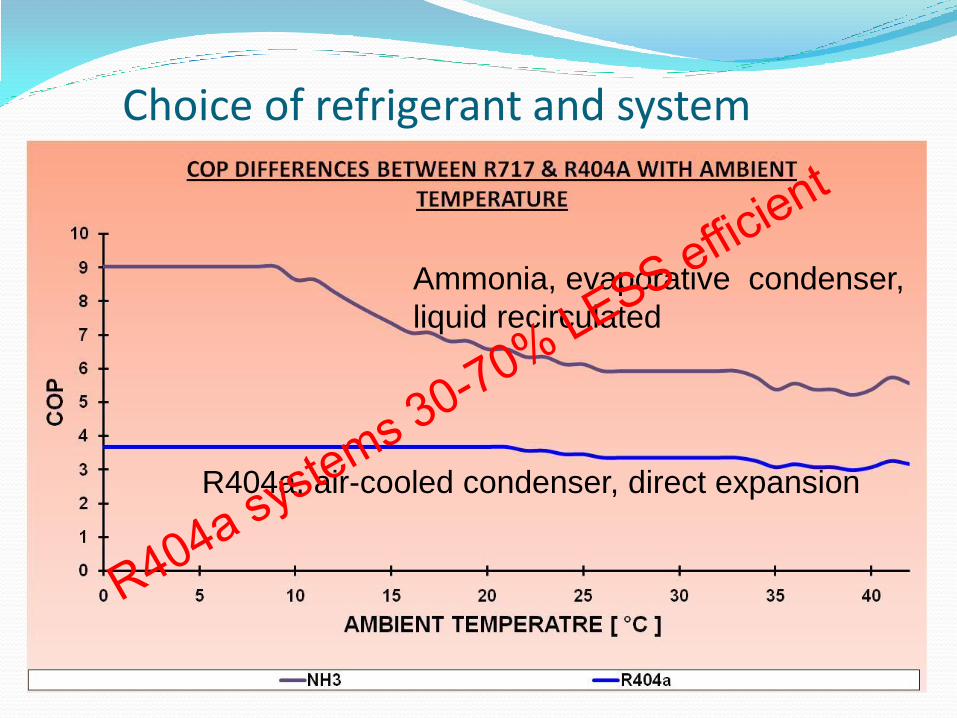
Choice of refrigerant and system
R404a, air-cooled condenser, direct expansion
Ammonia, evaporative condenser,
liquid recirculated
Ammonia and synthetic refrigerants: Energy efficiency
Ammonia systems generally exceed most synthetic refrigerant systems in fundamental cycle efficiency.
Many system options well suited to ammonia are not feasible for synthetic refrigerant systems (e.g. flooded evaporators).
Most ammonia systems use evaporative condensers, whilst synthetic systems generally use air-cooled condensers.
Synthetic refrigerant systems use direct expansion (DX) for nearly all evaporators – this restricts low condensing pressures, a key energy saving technique.
Therefore many energy efficiency options presented here are not applicable to synthetic refrigerant systems, or of limited application.

Carbon
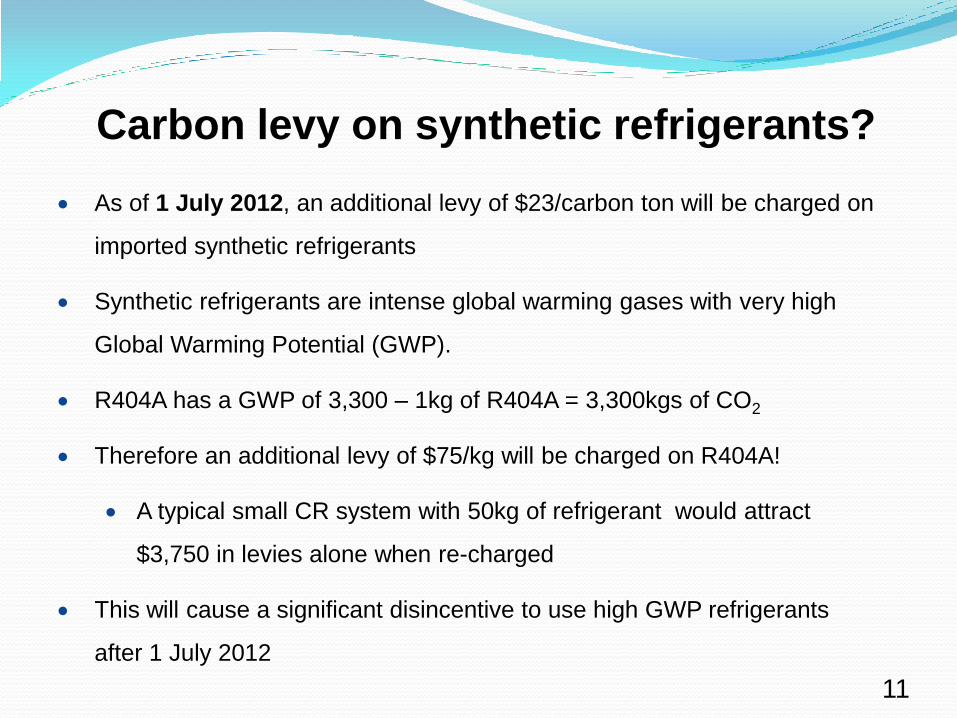
Carbon levy on synthetic refrigerants?
As of 1 July 2012, an additional levy of $23/carbon ton will be charged on
imported synthetic refrigerants
Synthetic refrigerants are intense global warming gases with very high
Global Warming Potential (GWP).
R404A has a GWP of 3,300 – 1kg of R404A = 3,300kgs of CO2
Therefore an additional levy of $75/kg will be charged on R404A!
A typical small CR system with 50kg of refrigerant would attract
$3,750 in levies alone when re-charged
This will cause a significant disincentive to use high GWP refrigerants
after 1 July 2012
11
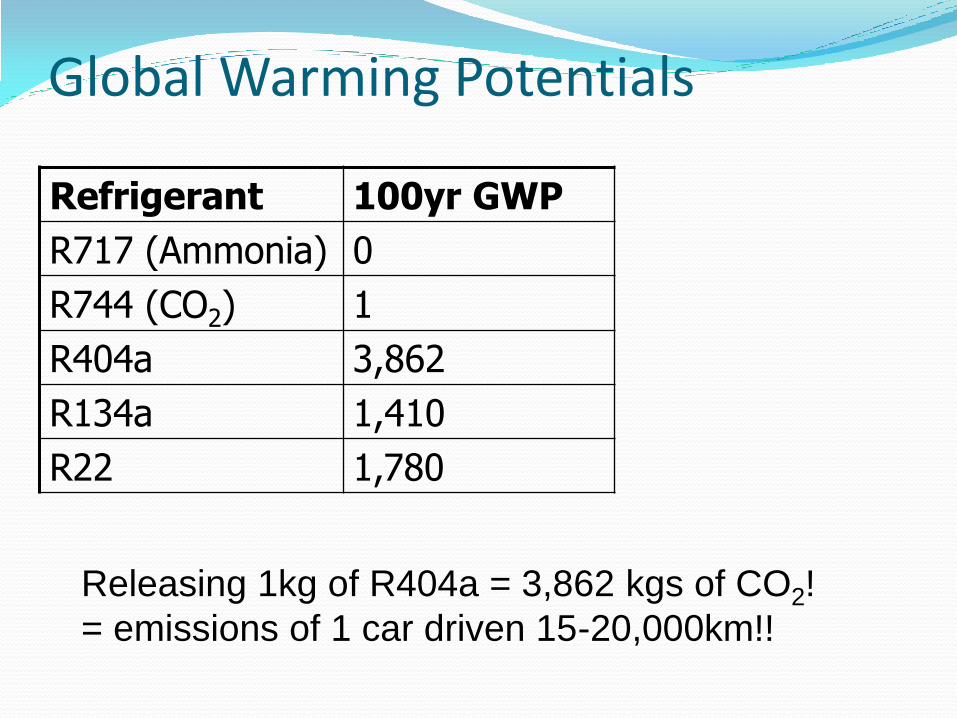
Global Warming Potentials
Refrigerant 100yr GWP
R717 (Ammonia) 0
R744 (CO2) 1
R404a 3,862
R134a 1,410
R22 1,780
Releasing 1kg of R404a = 3,862 kgs of CO2!
= emissions of 1 car driven 15-20,000km!!
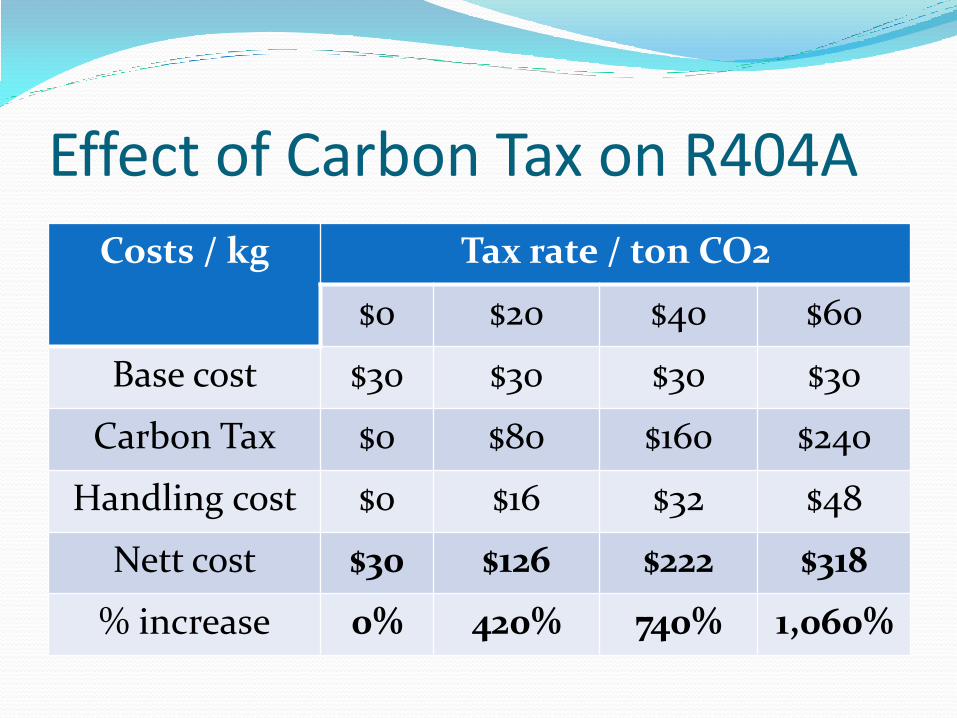
Effect of Carbon Tax on R404A
Costs / kg Tax rate / ton CO2
$0 $20 $40 $60
Base cost $30 $30 $30 $30
Carbon Tax $0 $80 $160 $240
Handling cost $0 $16 $32 $48
Nett cost $30 $126 $222 $318
% increase 0% 420% 740% 1,060%
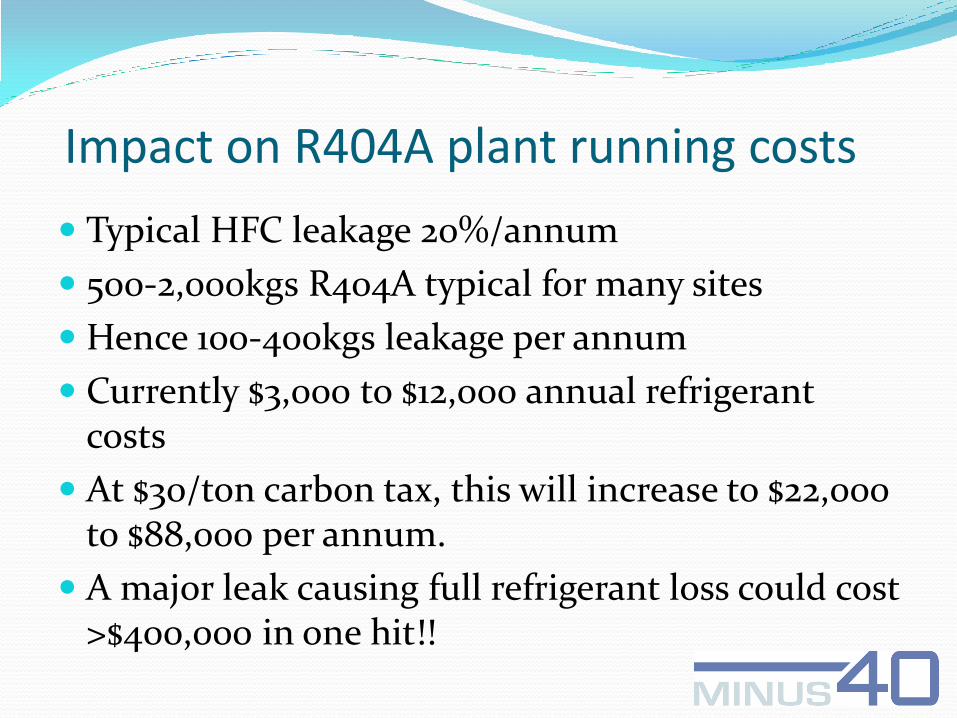
Impact on R404A plant running costs
Typical HFC leakage 20%/annum
500-2,000kgs R404A typical for many sites
Hence 100-400kgs leakage per annum
Currently $3,000 to $12,000 annual refrigerant costs
At $30/ton carbon tax, this will increase to $22,000 to $88,000 per annum.
A major leak causing full refrigerant loss could cost >$400,000 in one hit!!
15
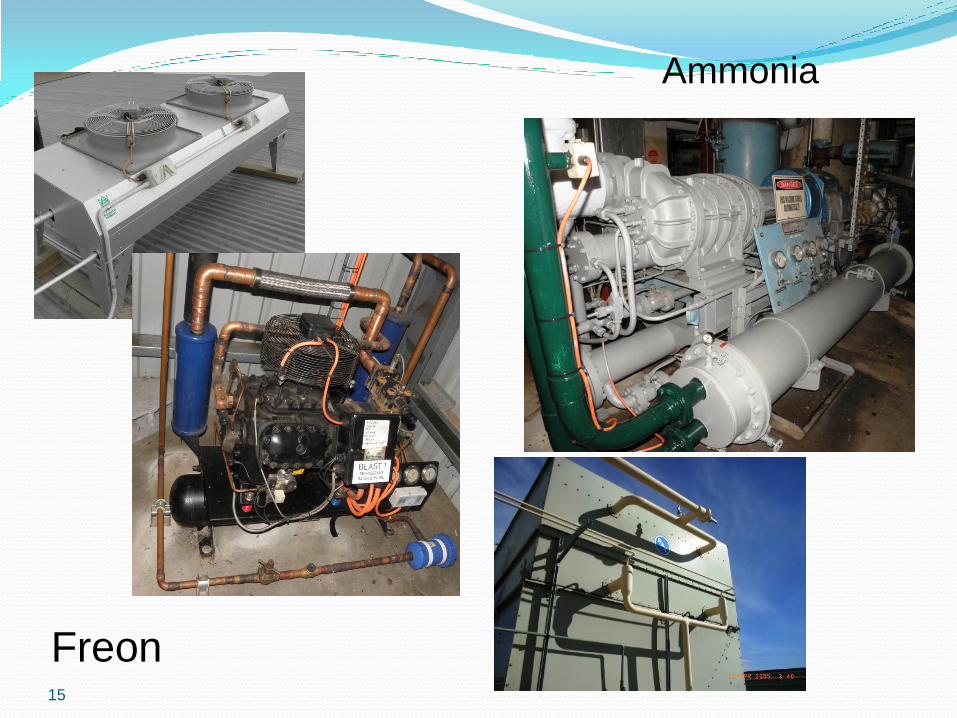
Freon
Ammonia

Energy Savings Opportunities
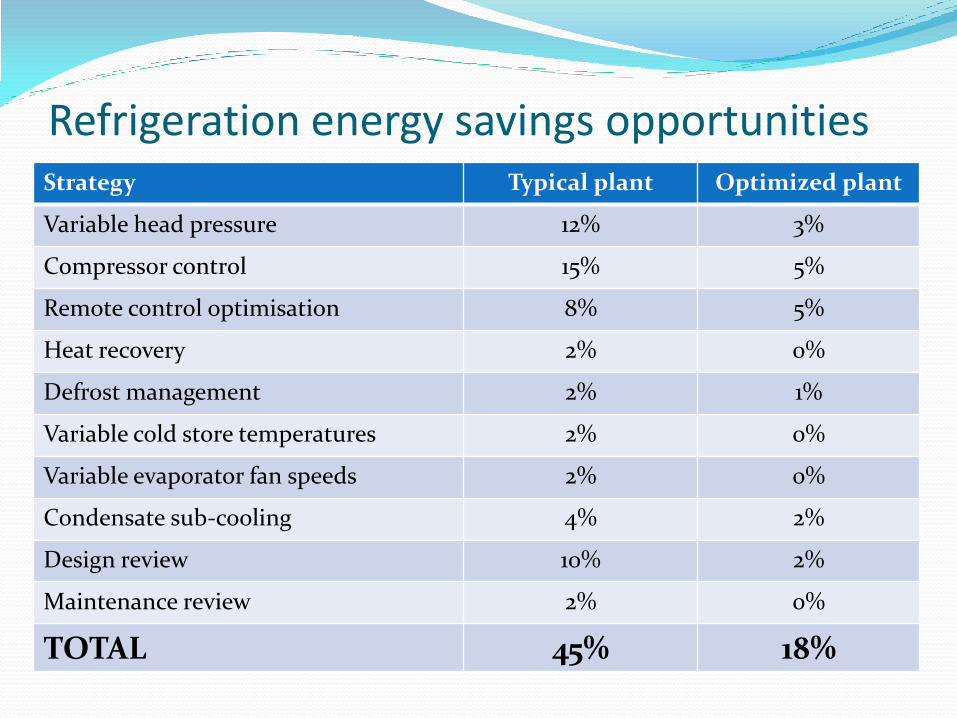
Refrigeration energy savings opportunities Strategy Typical plant Optimized plant
Variable head pressure 12% 3%
Compressor control 15% 5%
Remote control optimisation 8% 5%
Heat recovery 2% 0%
Defrost management 2% 1%
Variable cold store temperatures 2% 0%
Variable evaporator fan speeds 2% 0%
Condensate sub-cooling 4% 2%
Design review 10% 2%
Maintenance review 2% 0%
TOTAL 45% 18%
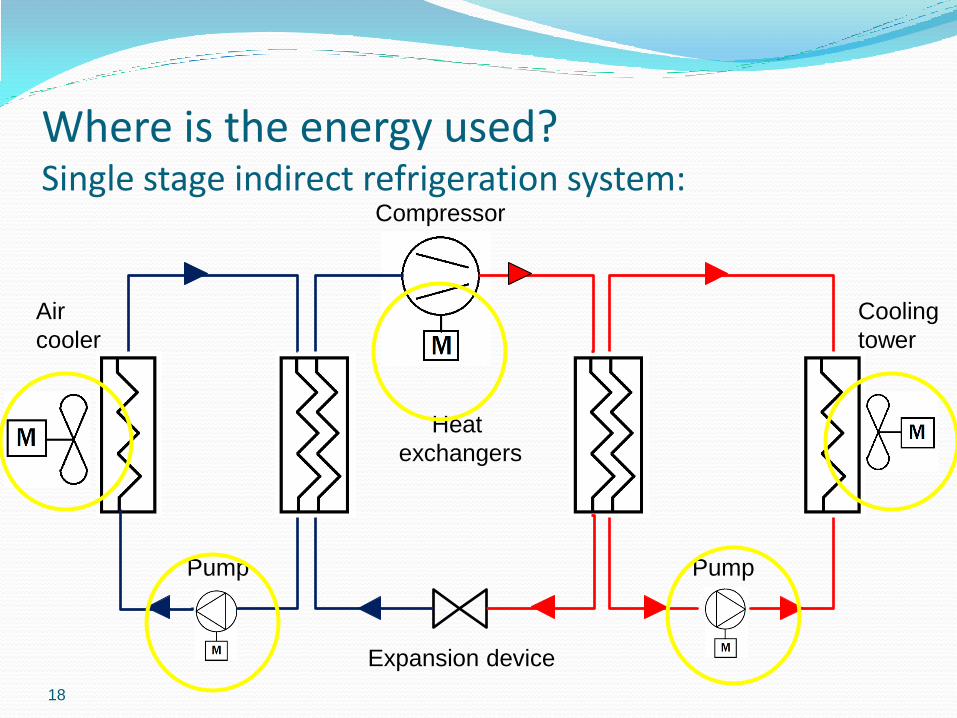
Where is the energy used? Single stage indirect refrigeration system:
18
Compressor
Cooling
tower
Pump Pump
Expansion device
Air
cooler
Heat
exchangers
Refrigeration Plant stability – first priority
Plant stability: stable operating conditions + smooth response to changes
Stable operation = efficient operation.
Instabilities caused by:
On/off condenser fan operation
Simple level control mechanism on vessels
Compressor cycling in response to load changes
Poor control strategies
Hence achieving STABLE plant operation is generally a pre-requisite to effective reduction of energy use.
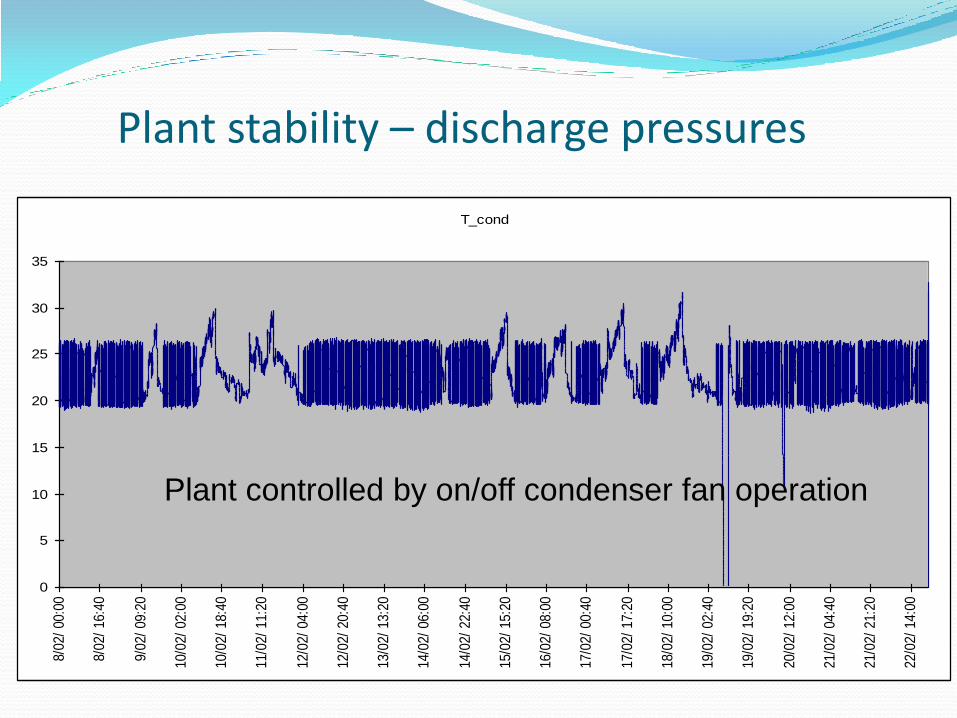
Plant stability – discharge pressures
T_cond
0
5
10
15
20
25
30
35
8/02
/ 00
:00
8/02
/ 16
:40
9/02
/ 09
:20
10/0
2/ 0
2:00
10/0
2/ 1
8:40
11/0
2/ 1
1:20
12/0
2/ 0
4:00
12/0
2/ 2
0:40
13/0
2/ 1
3:20
14/0
2/ 0
6:00
14/0
2/ 2
2:40
15/0
2/ 1
5:20
16/0
2/ 0
8:00
17/0
2/ 0
0:40
17/0
2/ 1
7:20
18/0
2/ 1
0:00
19/0
2/ 0
2:40
19/0
2/ 1
9:20
20/0
2/ 1
2:00
21/0
2/ 0
4:40
21/0
2/ 2
1:20
22/0
2/ 1
4:00
Plant controlled by on/off condenser fan operation
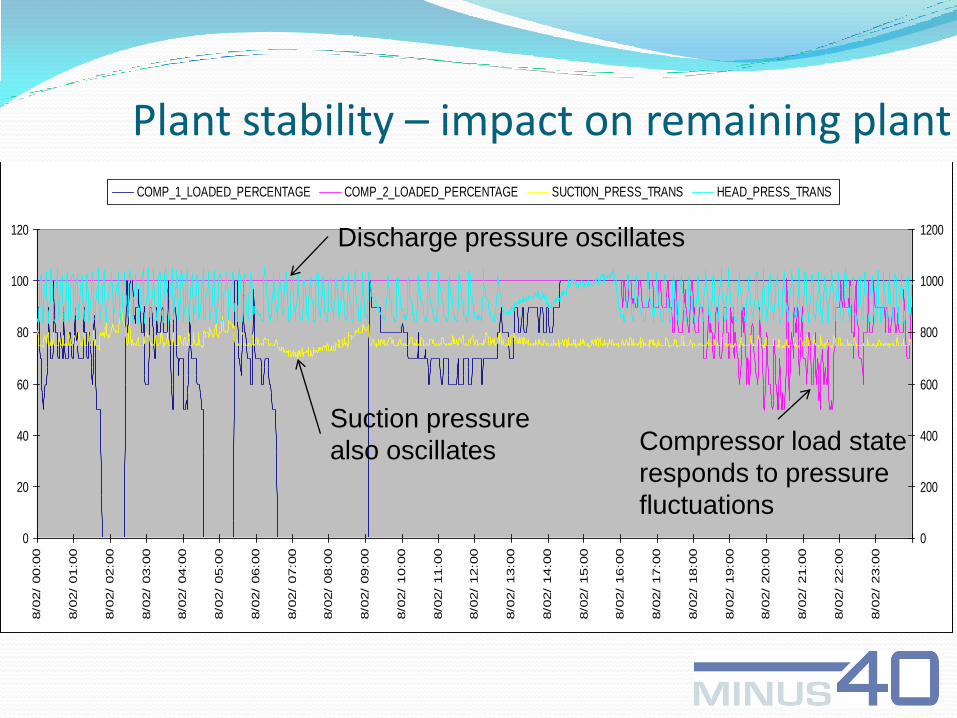
Plant stability – impact on remaining plant Tue
0
20
40
60
80
100
120
8/0
2/
00:0
0
8/0
2/
01:0
0
8/0
2/
02:0
0
8/0
2/
03:0
0
8/0
2/
04:0
0
8/0
2/
05:0
0
8/0
2/
06:0
0
8/0
2/
07:0
0
8/0
2/
08:0
0
8/0
2/
09:0
0
8/0
2/
10:0
0
8/0
2/
11:0
0
8/0
2/
12:0
0
8/0
2/
13:0
0
8/0
2/
14:0
0
8/0
2/
15:0
0
8/0
2/
16:0
0
8/0
2/
17:0
0
8/0
2/
18:0
0
8/0
2/
19:0
0
8/0
2/
20:0
0
8/0
2/
21:0
0
8/0
2/
22:0
0
8/0
2/
23:0
0
0
200
400
600
800
1000
1200
COMP_1_LOADED_PERCENTAGE COMP_2_LOADED_PERCENTAGE SUCTION_PRESS_TRANS HEAD_PRESS_TRANS
Discharge pressure oscillates
Suction pressure
also oscillates Compressor load state
responds to pressure
fluctuations

1) - Fans
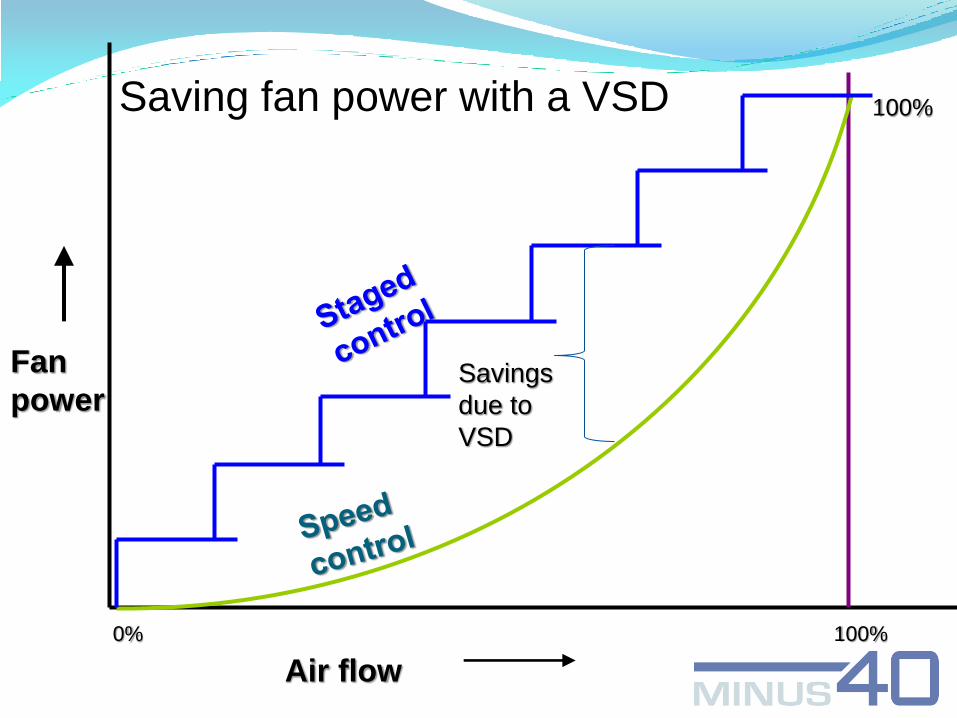
100%
Fan
power
Air flow
0%
Saving fan power with a VSD 100%
Savings
due to
VSD
Fan VSD savings 10kW fan motor
Run fan 50% of the time = 5kW average use
Run fan at 50% fan speed =1.25kW average use
Save 3.75 kW = $5,000/annum
10kW VSD costs <<$5,000!!!
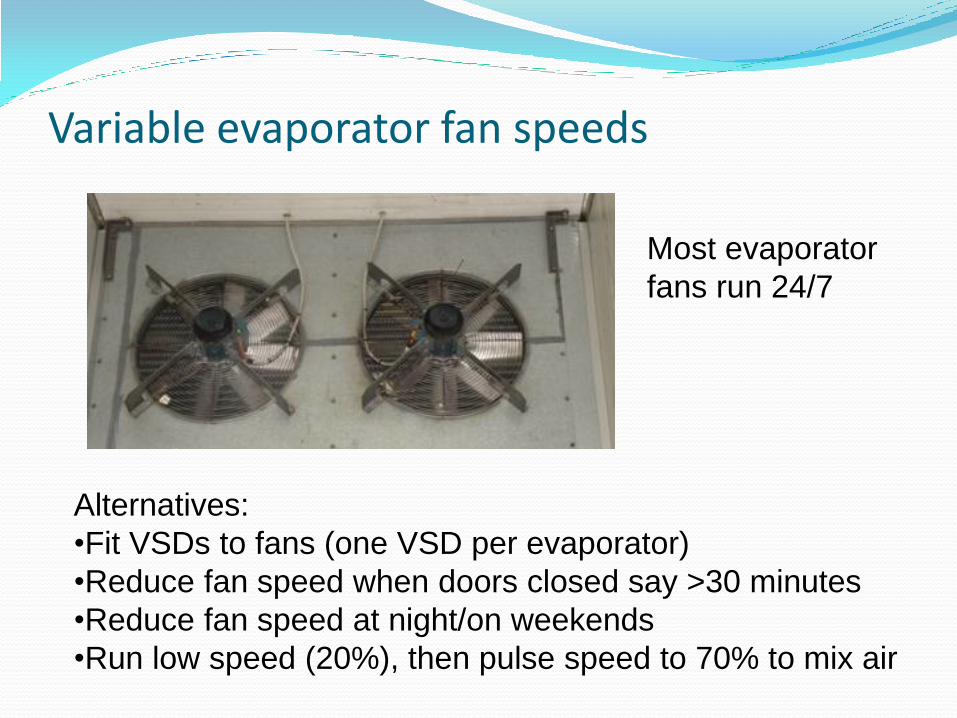
Variable evaporator fan speeds
Most evaporator
fans run 24/7
Alternatives:
•Fit VSDs to fans (one VSD per evaporator)
•Reduce fan speed when doors closed say >30 minutes
•Reduce fan speed at night/on weekends
•Run low speed (20%), then pulse speed to 70% to mix air
Evaporator fans on VSD
Freezer evaporator fan motor – 1.5kW
Refrigeration power required to remove heat – 0.75 kW, hence 2.25 kW total
Annual power costs for 24/7 operation: $3,000!
Use VSD at 70% average fan speed – 0.5kW fan power + 0.25kW = 0.75kW total
Annual power costs for 24/7 operation: $1,000!
Annual savings: $2,000 PER FAN!!

2) – Variable head pressure
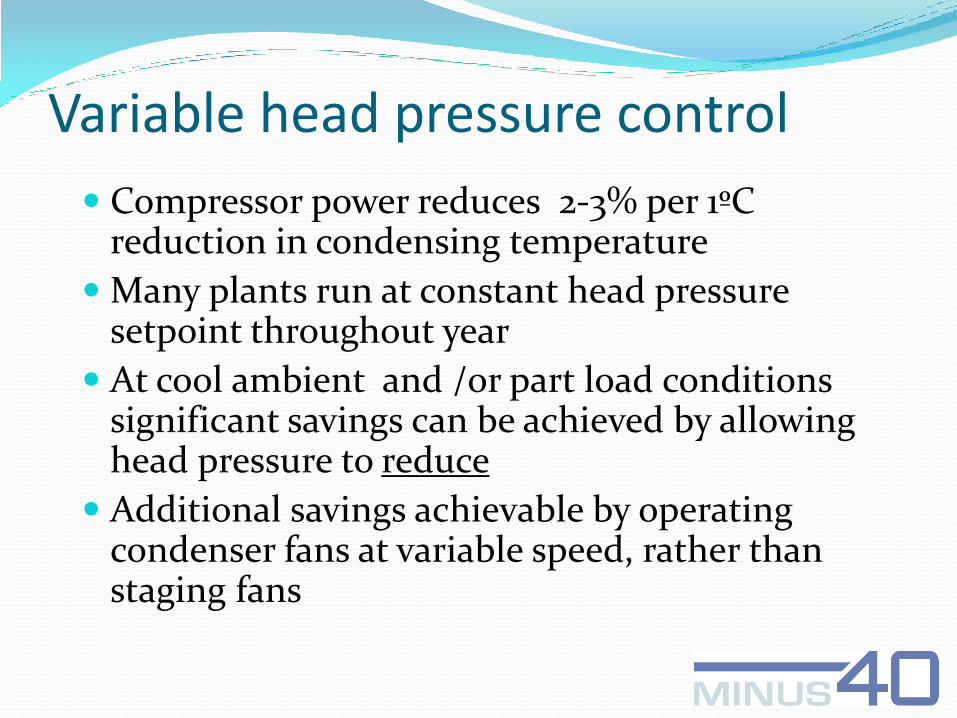
Variable head pressure control
Compressor power reduces 2-3% per 1ºC reduction in condensing temperature
Many plants run at constant head pressure setpoint throughout year
At cool ambient and /or part load conditions significant savings can be achieved by allowing head pressure to reduce
Additional savings achievable by operating condenser fans at variable speed, rather than staging fans
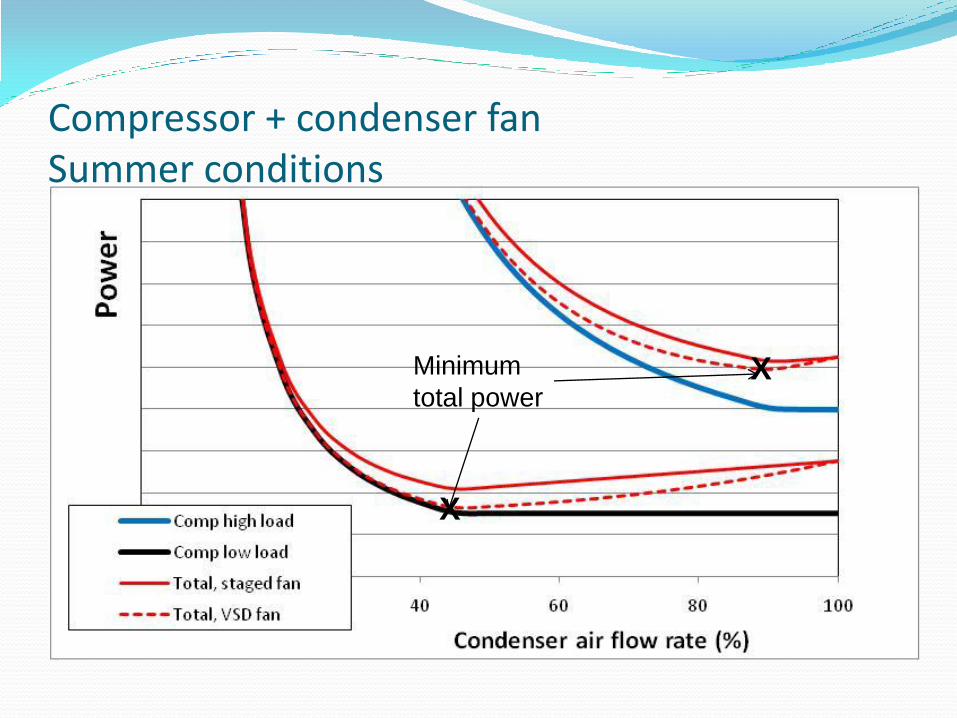
Compressor + condenser fan Summer conditions
X
X
Minimum
total power
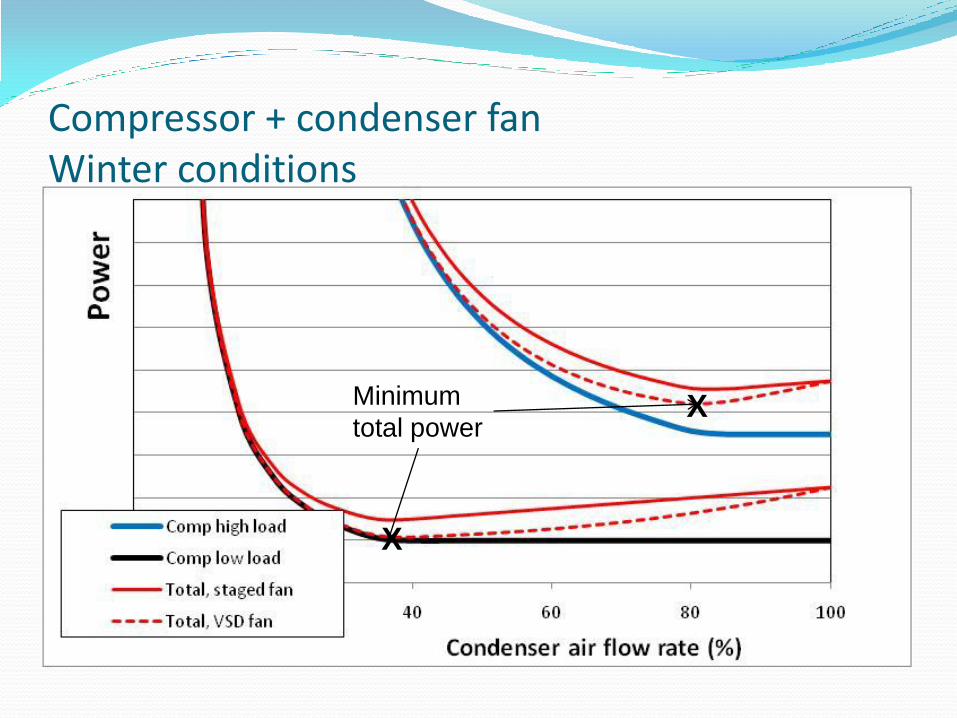
Compressor + condenser fan Winter conditions
X
X
Minimum
total power
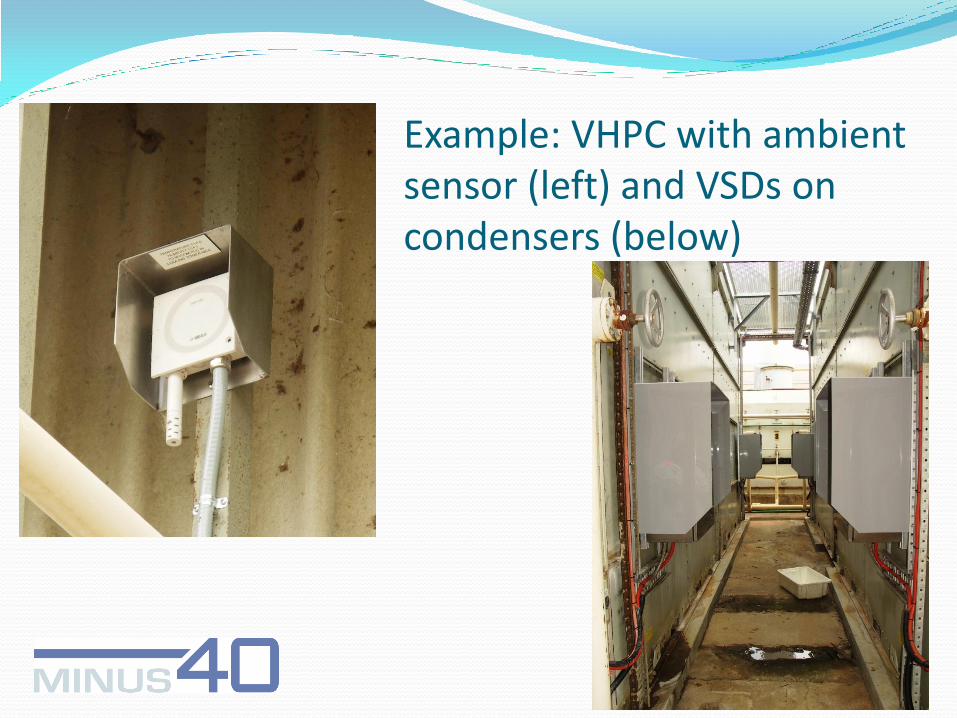
Example: VHPC with ambient sensor (left) and VSDs on condensers (below)
3) – Compressor control
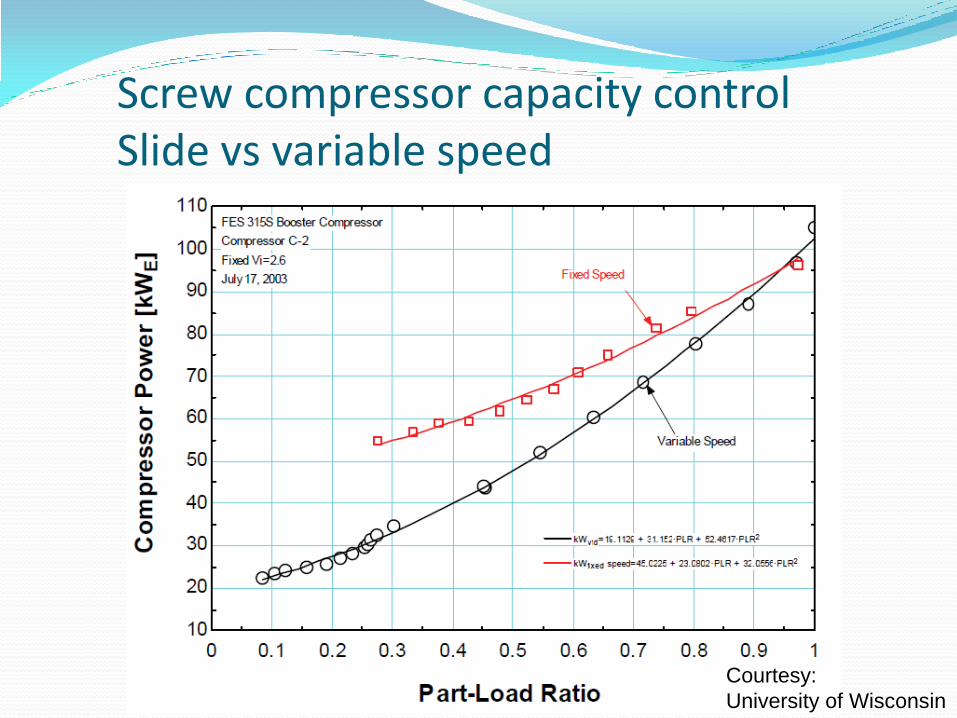
Screw compressor capacity control Slide vs variable speed
Courtesy:
University of Wisconsin
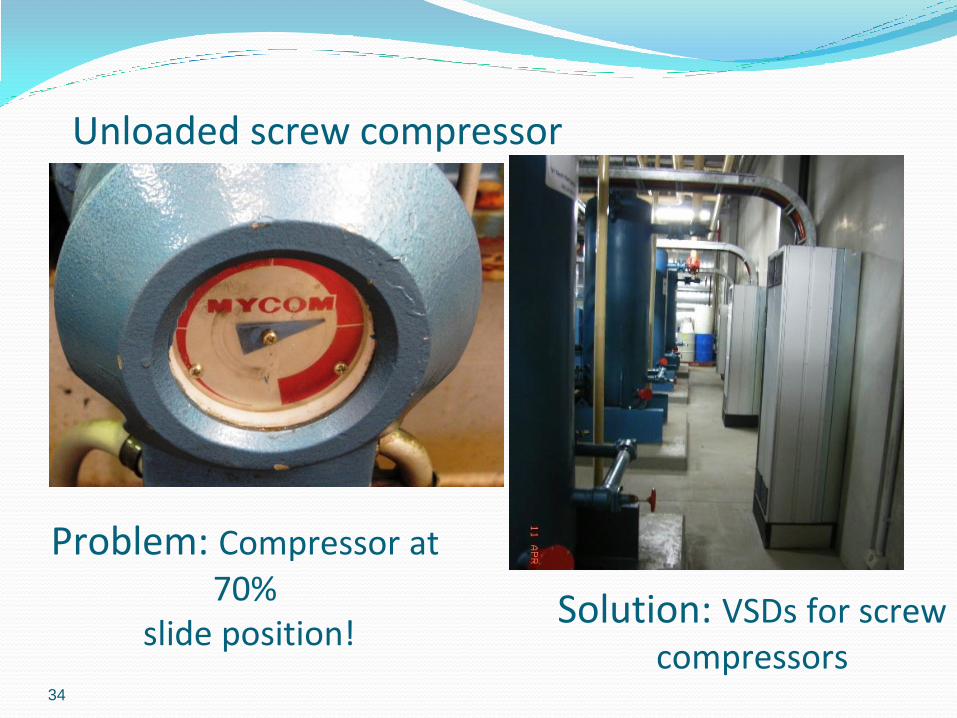
Unloaded screw compressor
34
Problem: Compressor at 70%
slide position! Solution: VSDs for screw
compressors
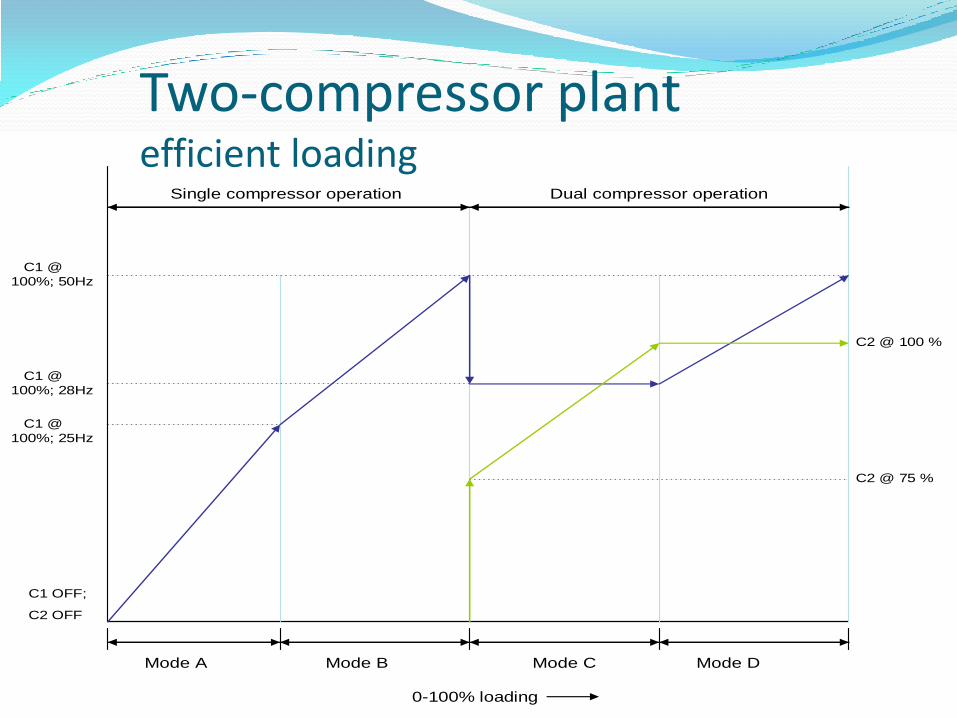
Mode A Mode B Mode C Mode D
C1 @
100%; 50Hz
C1 @
100%; 28Hz
C1 @
100%; 25Hz
C2 @ 75 %
C2 @ 100 %
C1 OFF;
C2 OFF
0-100% loading
Single compressor operation Dual compressor operation
Two-compressor plant efficient loading
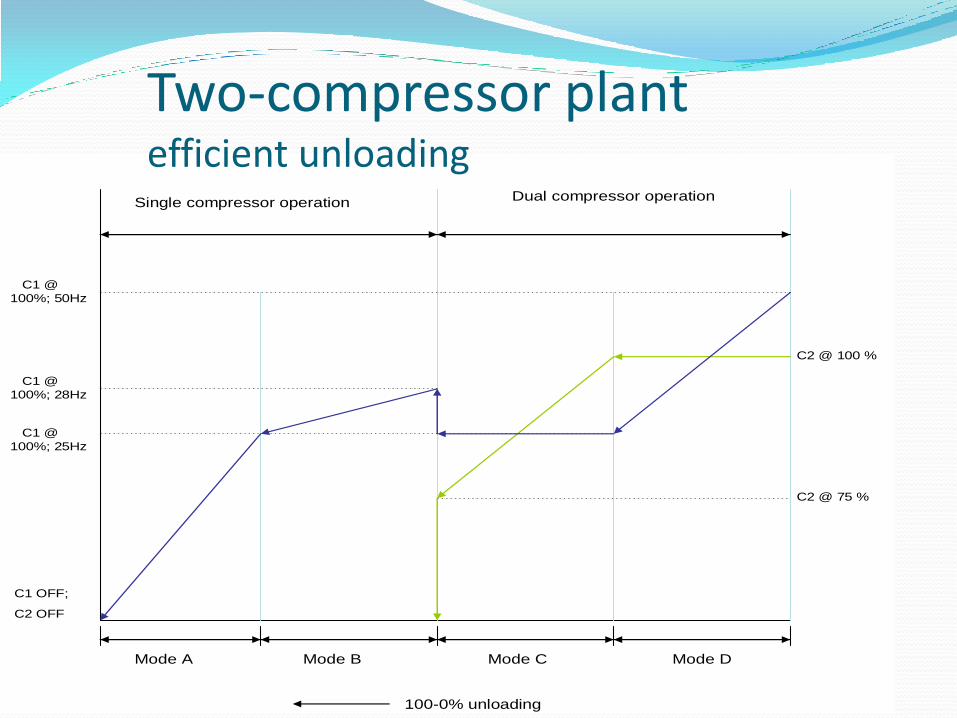
Mode A Mode B Mode C Mode D
C1 @
100%; 50Hz
C1 @
100%; 28Hz
C1 @
100%; 25Hz
C2 @ 75 %
C2 @ 100 %
C1 OFF;
C2 OFF
100-0% unloading
Single compressor operationDual compressor operation
Two-compressor plant efficient unloading
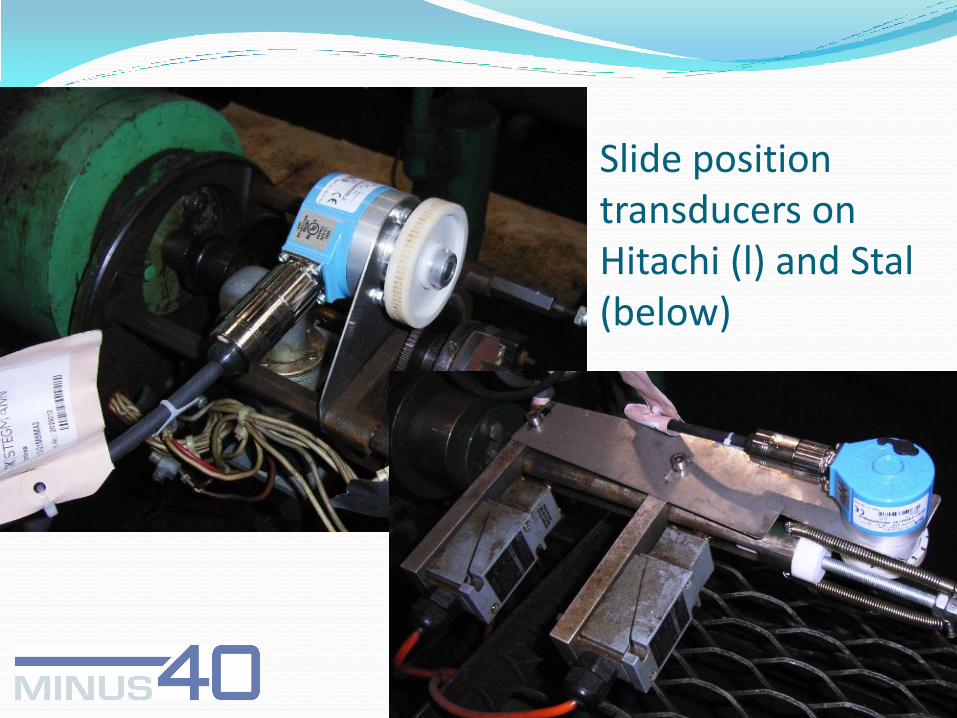
Slide position transducers on Hitachi (l) and Stal (below)

4) – Remote optimization
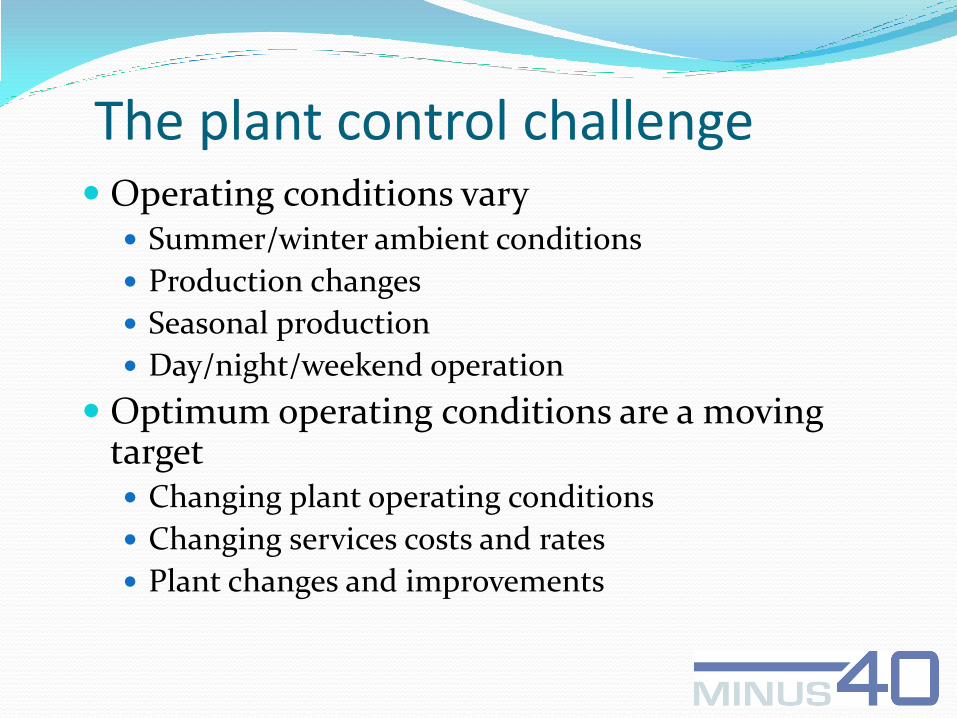
The plant control challenge Operating conditions vary
Summer/winter ambient conditions
Production changes
Seasonal production
Day/night/weekend operation
Optimum operating conditions are a moving target Changing plant operating conditions
Changing services costs and rates
Plant changes and improvements
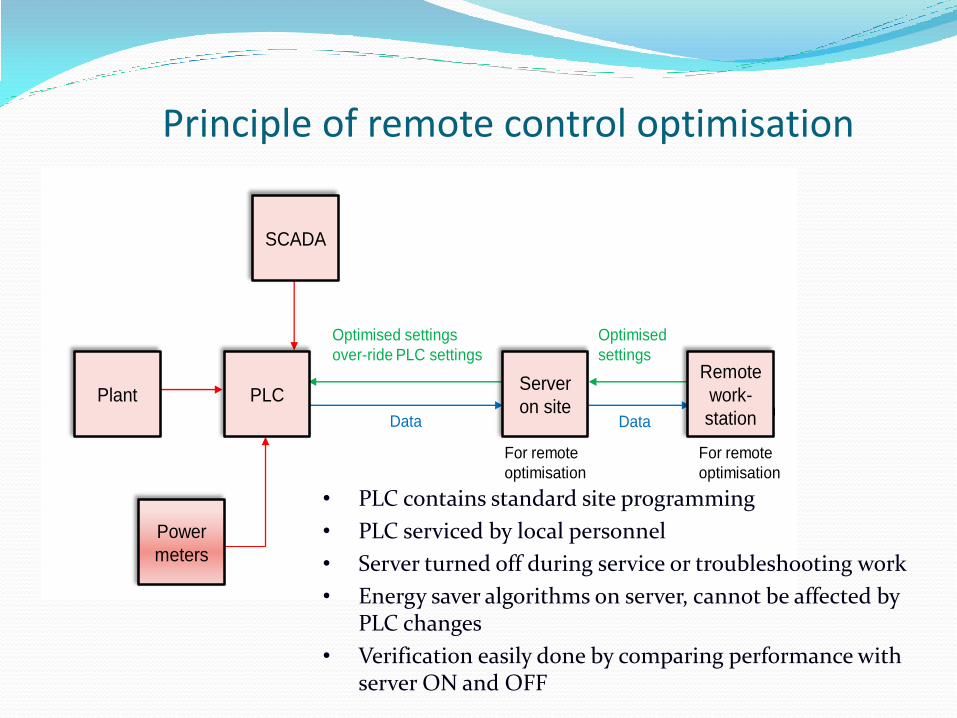
Principle of remote control optimisation
SCADA
PLCPlant
Power
meters
Server
on siteRemote
workstation
For remote
optimisation
For remote
optimisation
Optimised
settings
DataData
Optimised settings
over-ride PLC settings
SCADA
Plant
Power
meters
PLCServer
on site
Remote
work-
station
• PLC contains standard site programming
• PLC serviced by local personnel
• Server turned off during service or troubleshooting work
• Energy saver algorithms on server, cannot be affected by PLC changes
• Verification easily done by comparing performance with server ON and OFF
5) – Heat recovery
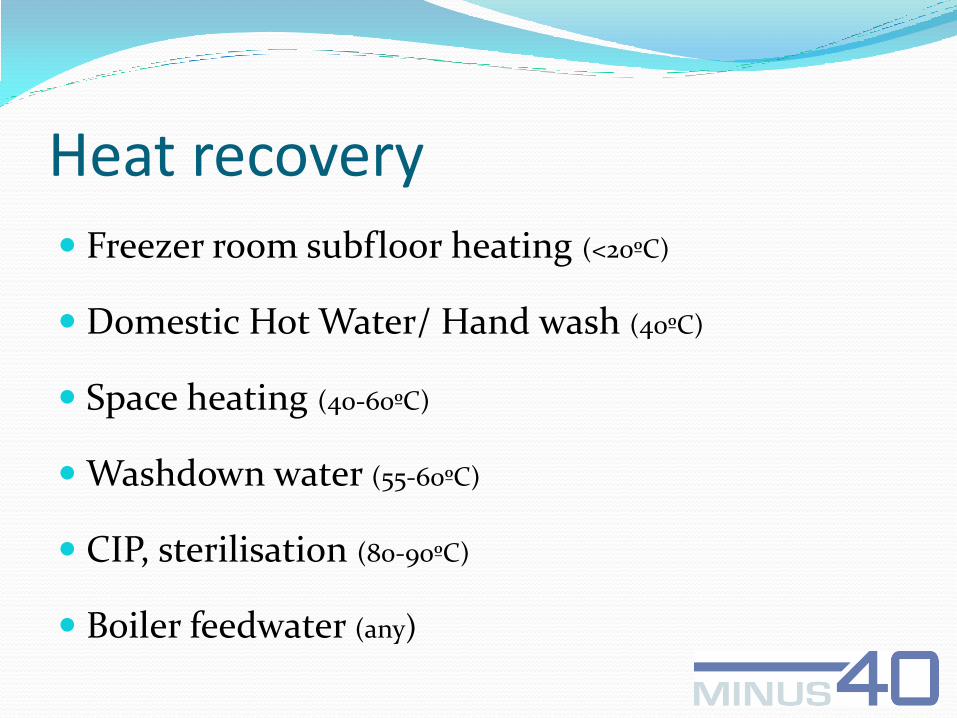
Heat recovery Freezer room subfloor heating (<20ºC)
Domestic Hot Water/ Hand wash (40ºC)
Space heating (40-60ºC)
Washdown water (55-60ºC)
CIP, sterilisation (80-90ºC)
Boiler feedwater (any)
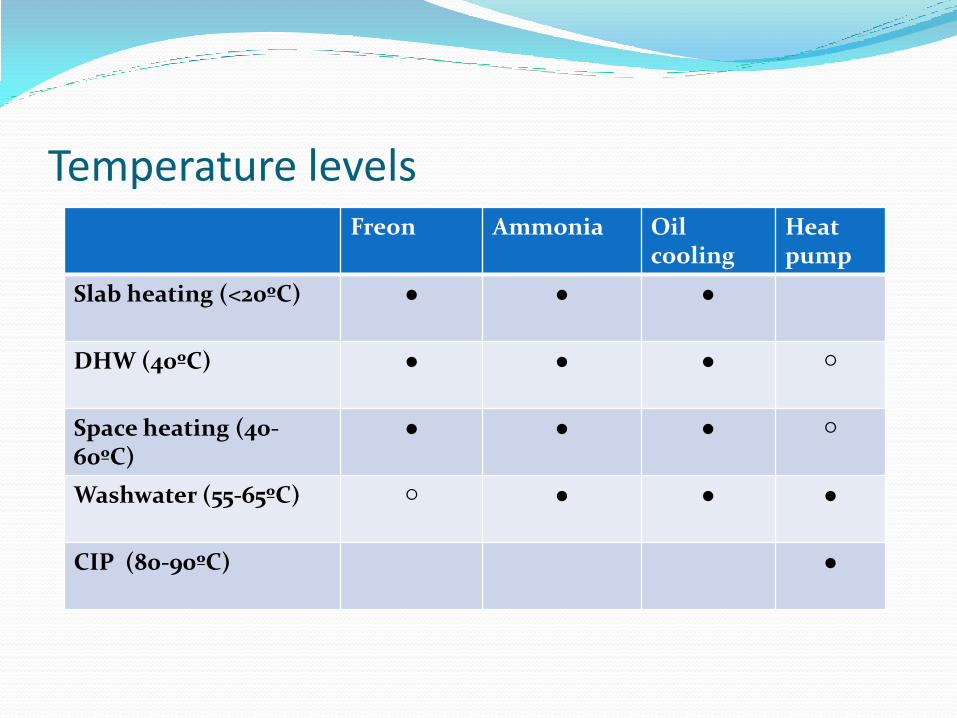
Temperature levels Freon Ammonia Oil
cooling Heat pump
Slab heating (<20ºC) ●
● ●
DHW (40ºC) ● ● ● ○
Space heating (40-60ºC)
● ●
●
○
Washwater (55-65ºC) ○ ●
●
●
CIP (80-90ºC) ●
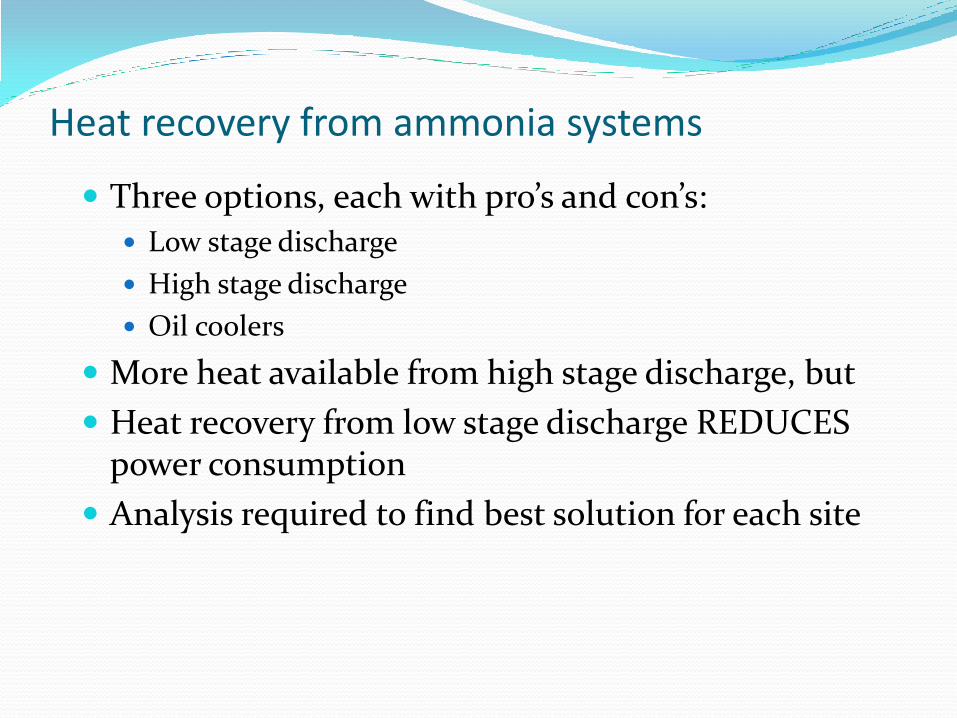
Heat recovery from ammonia systems
Three options, each with pro’s and con’s:
Low stage discharge
High stage discharge
Oil coolers
More heat available from high stage discharge, but
Heat recovery from low stage discharge REDUCES power consumption
Analysis required to find best solution for each site
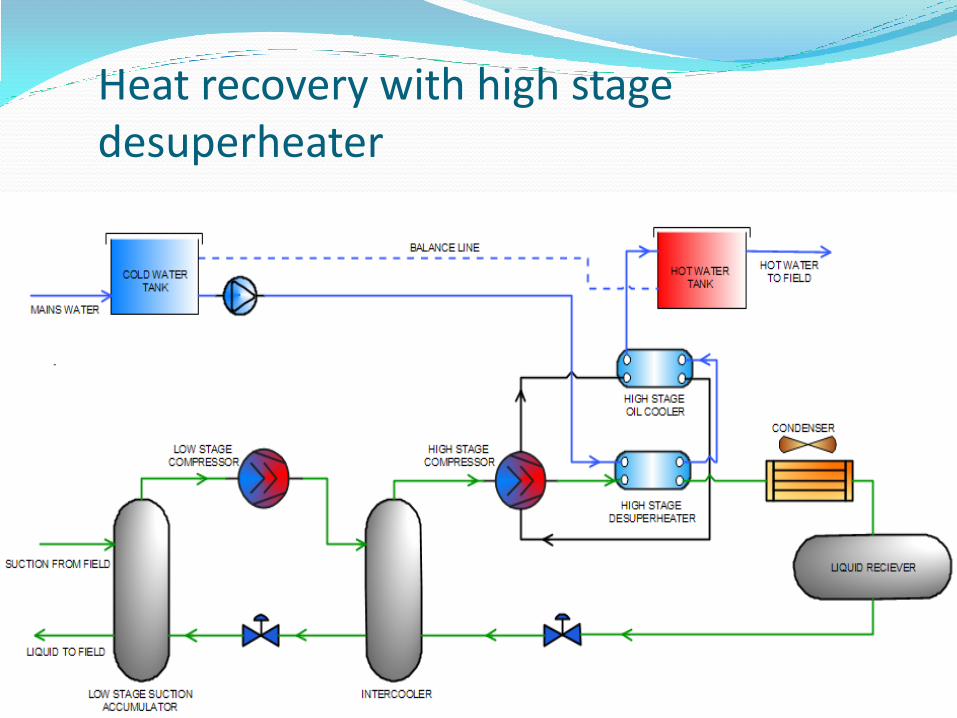
Heat recovery with high stage desuperheater
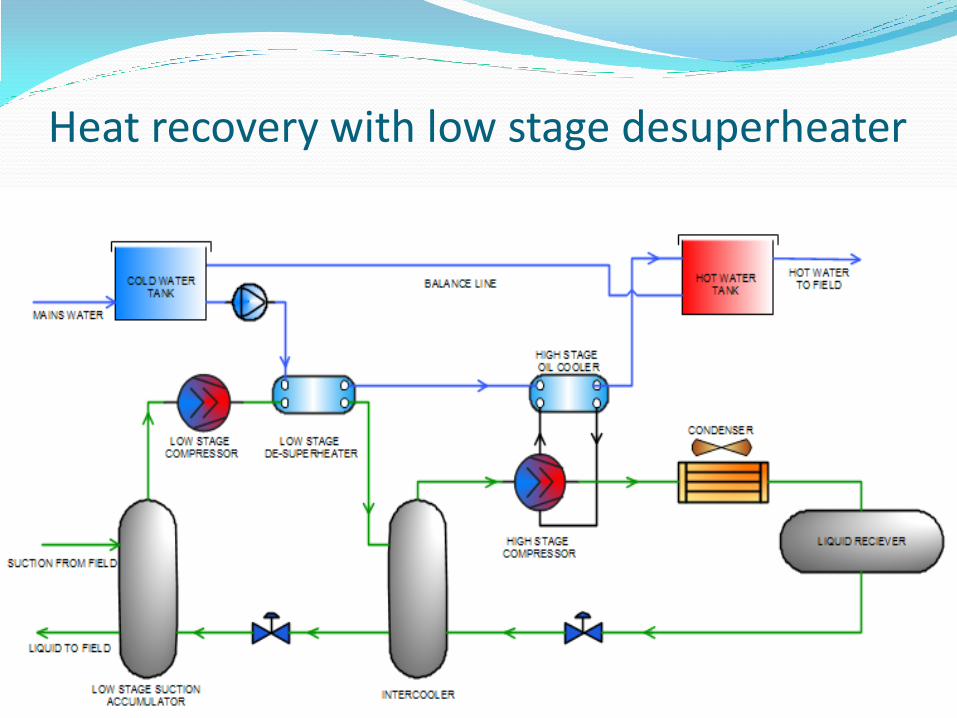
Heat recovery with low stage desuperheater

6) – Condensate subcooling
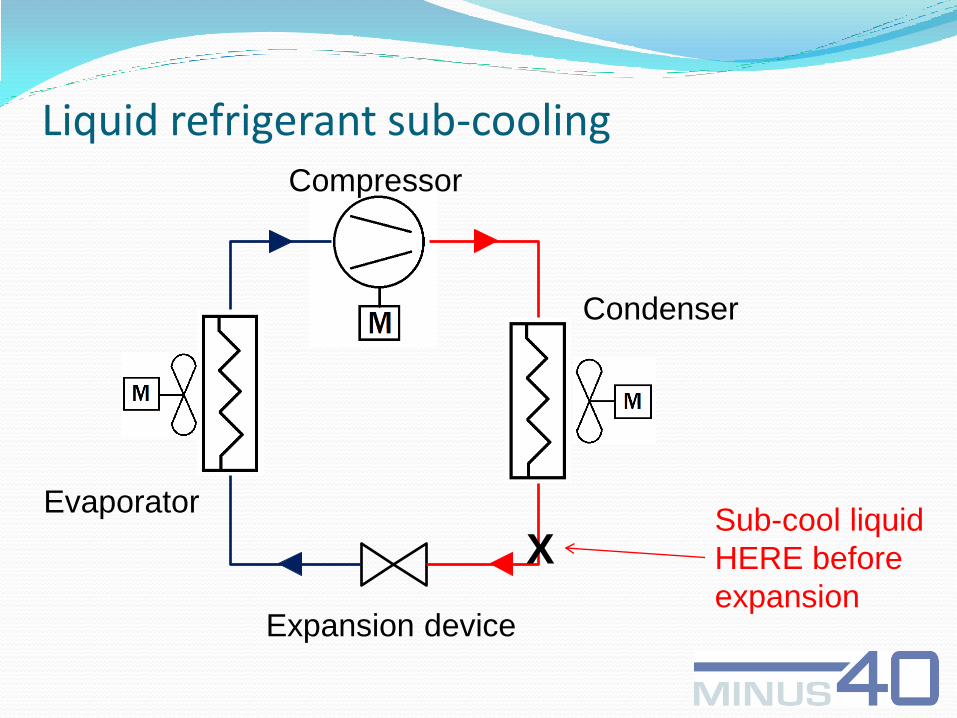
Liquid refrigerant sub-cooling
48
Compressor
Condenser
Evaporator
Expansion device
Sub-cool liquid
HERE before
expansion
X
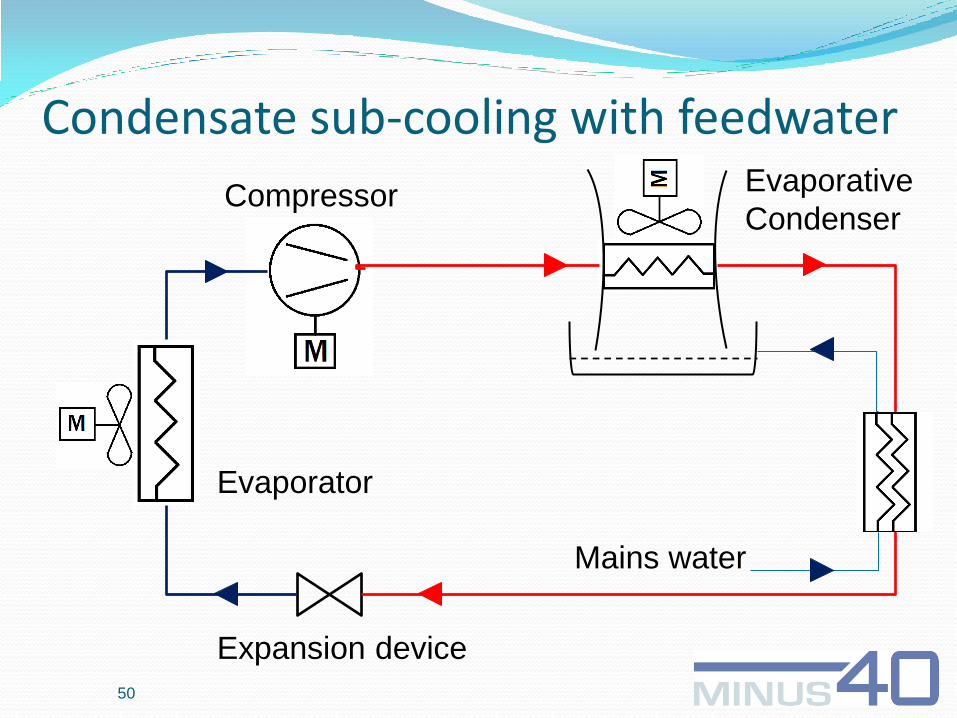
Condensate sub-cooling with feedwater
50
Compressor Evaporative
Condenser
Evaporator
Expansion device
Mains water
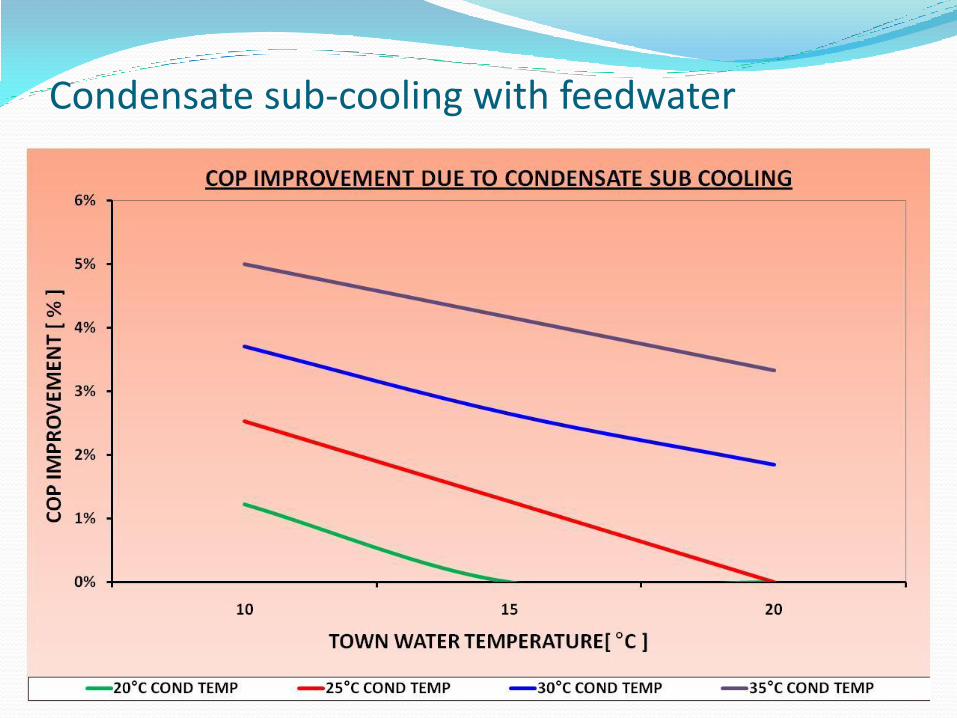
Condensate sub-cooling with feedwater
7) – Economizer on screw compressors
53
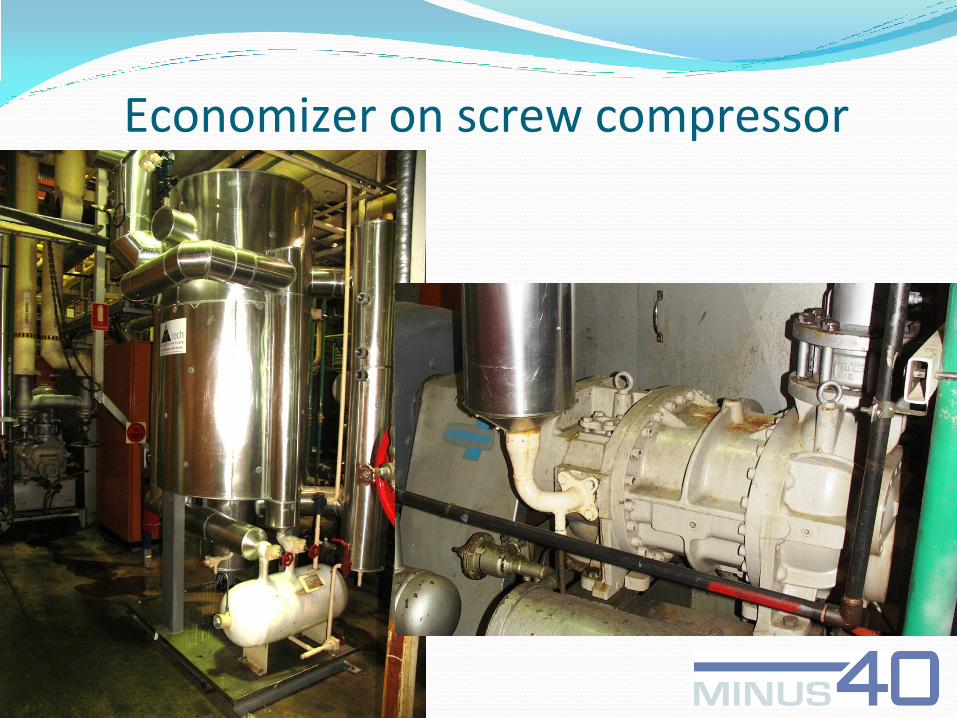
Economizer on screw compressor
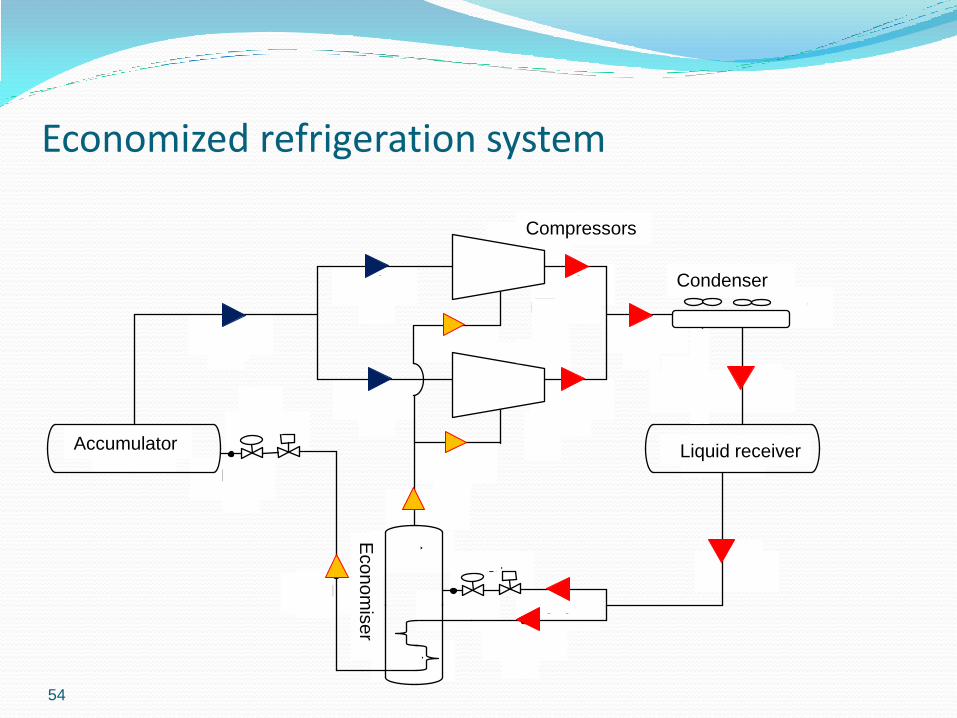
Economized refrigeration system
54
<4>
<5>
<8>
<7>
<6>
<2>
<3>
<9>
[17]
[4]
<1>
[7]
[10]
[9] [8]
[11] [13]
[12]
[15]
[16] [5]
[6]
[14]
[3]
[2]
[1]
Compressors
Liquid receiver Accumulator
Econom
iser
Condenser
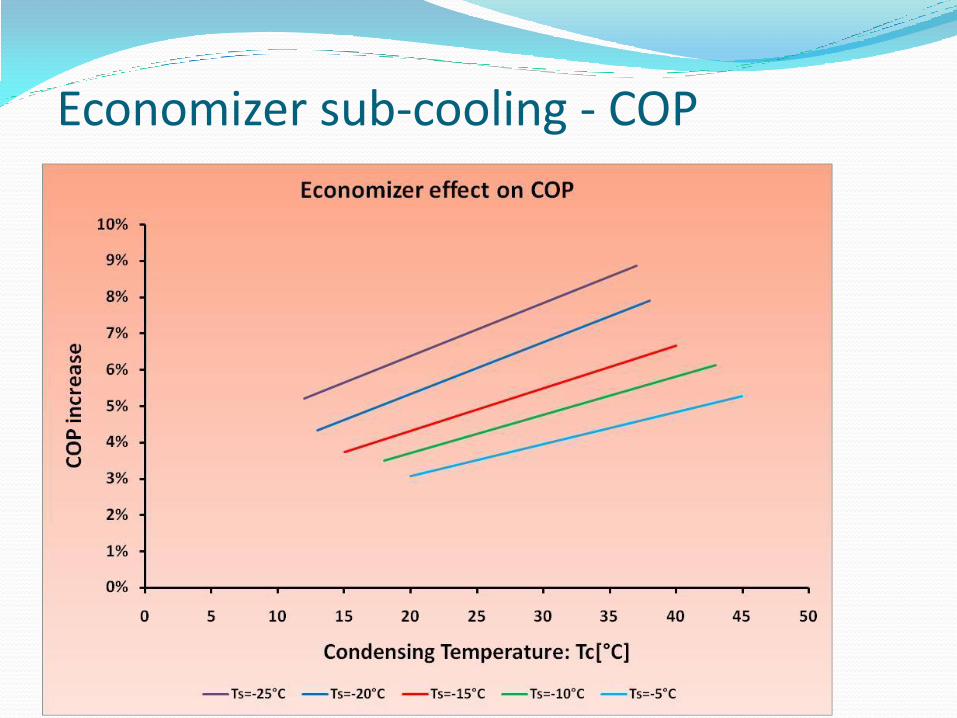
Economizer sub-cooling - COP
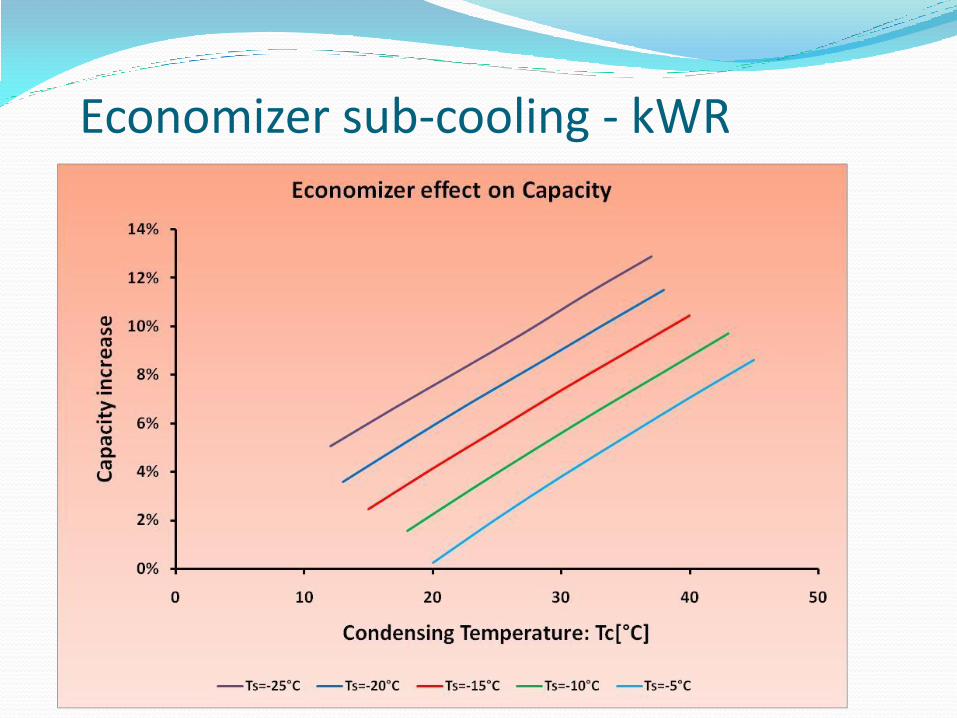
Economizer sub-cooling - kWR

8) – Suction splitting
Suction splitting
Split suction lines to run higher temperature loads
at higher suction pressure
Eg. Blast freezers and holding freezers
Eg. Chiller rooms and processing rooms
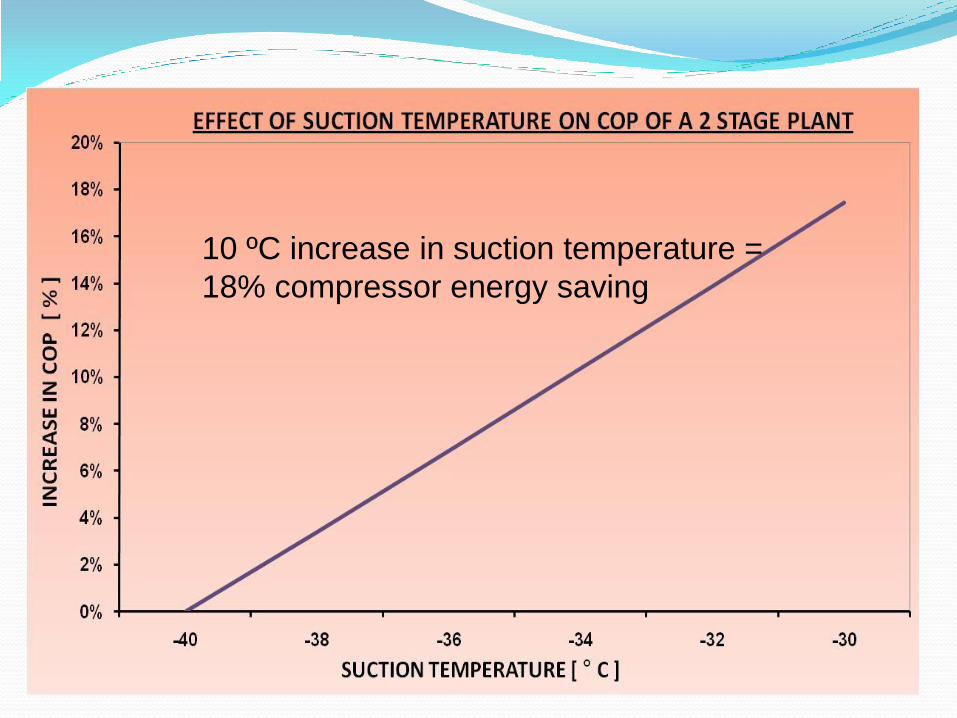
10 ºC increase in suction temperature =
18% compressor energy saving
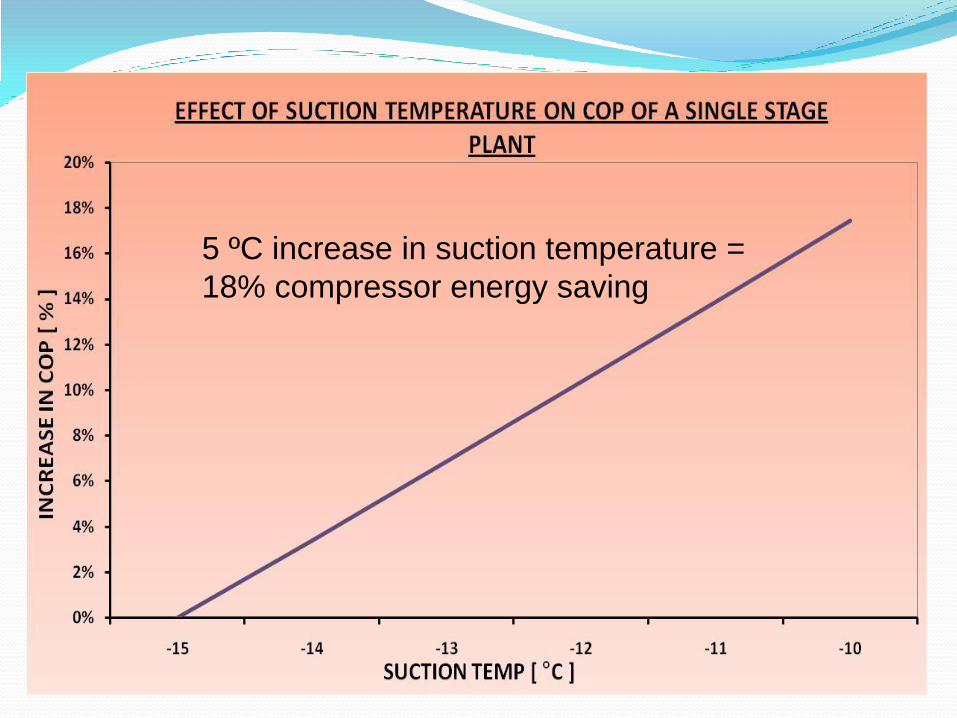
5 ºC increase in suction temperature =
18% compressor energy saving
9) – remove liquid injection oil cooling
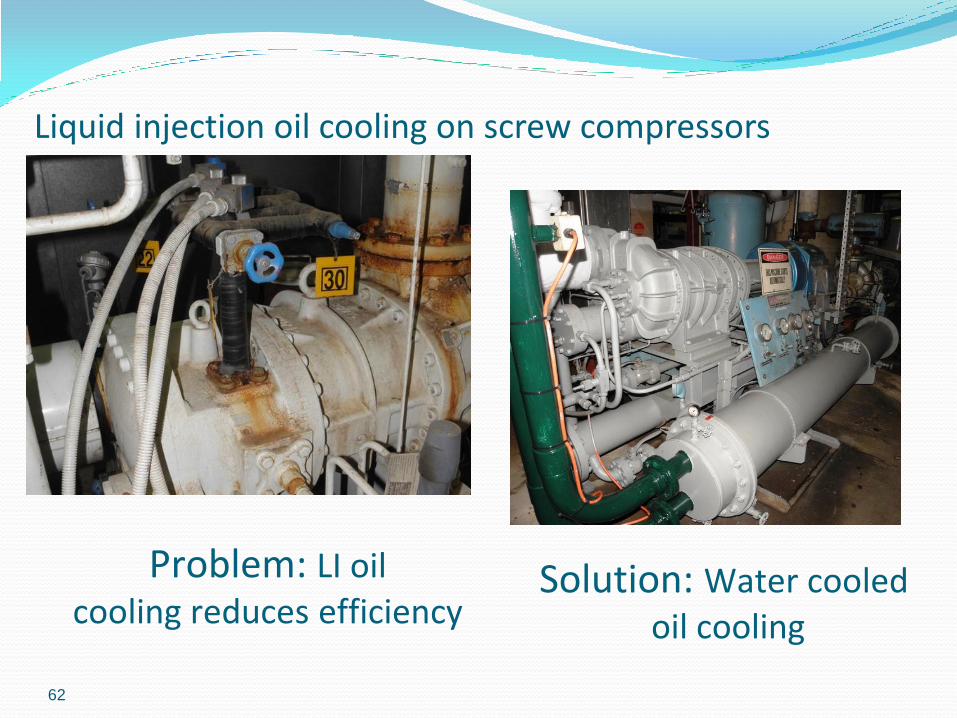
Liquid injection oil cooling on screw compressors
62
Problem: LI oil cooling reduces efficiency
Solution: Water cooled oil cooling
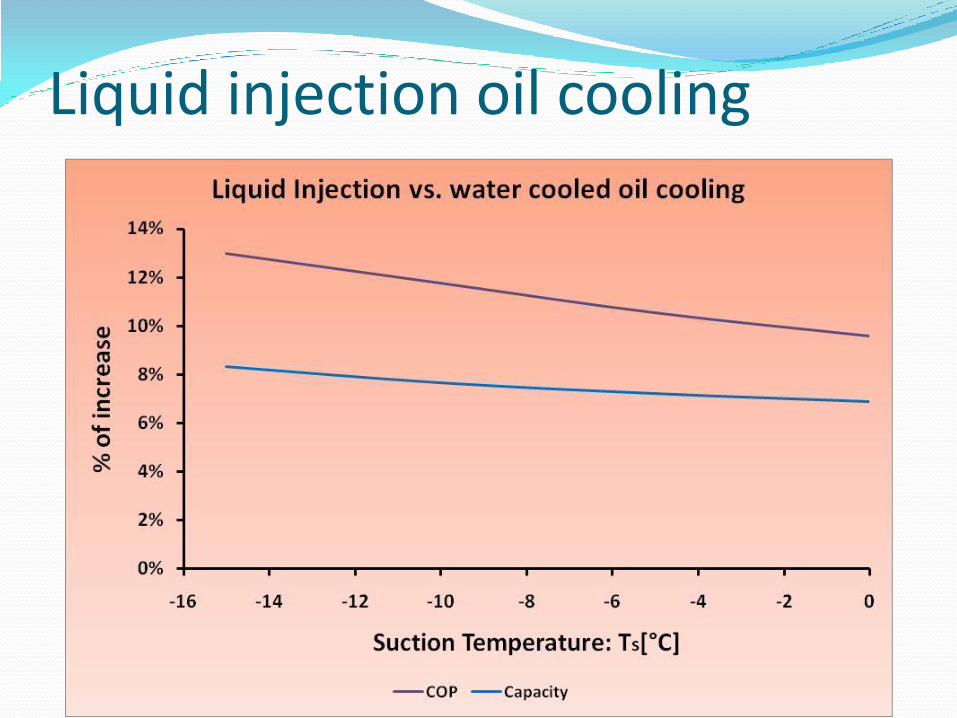
Liquid injection oil cooling
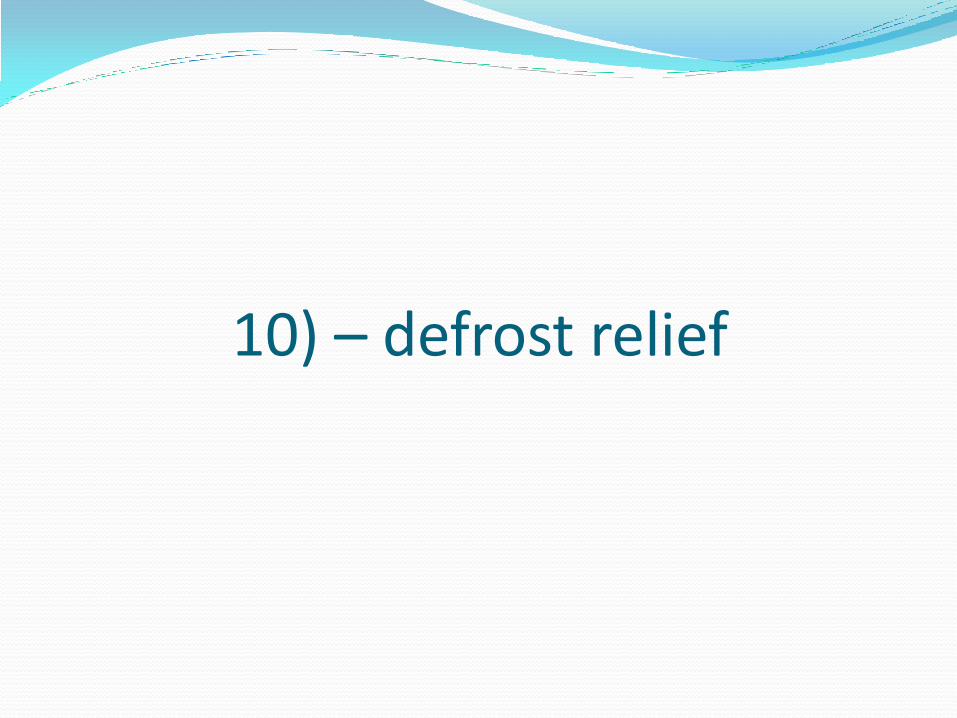
10) – defrost relief
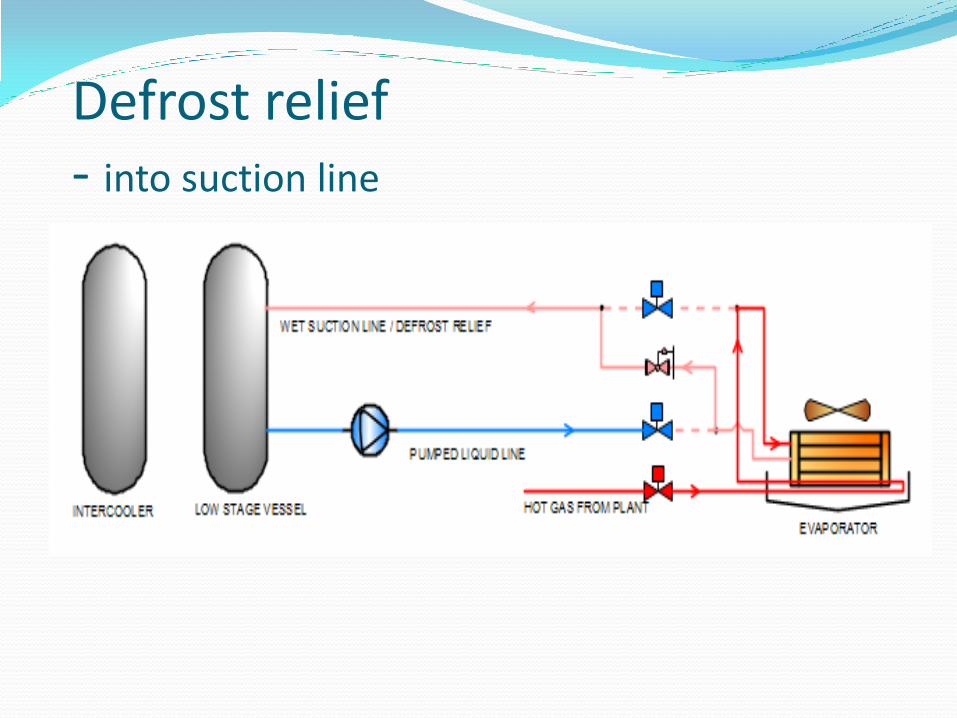
Defrost relief - into suction line
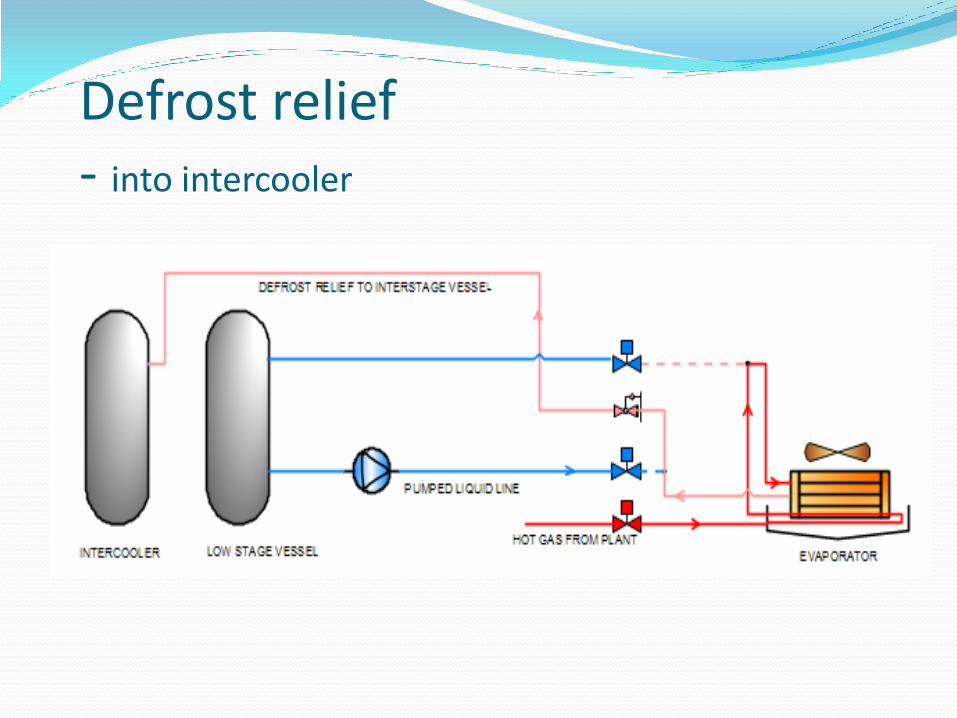
Defrost relief - into intercooler
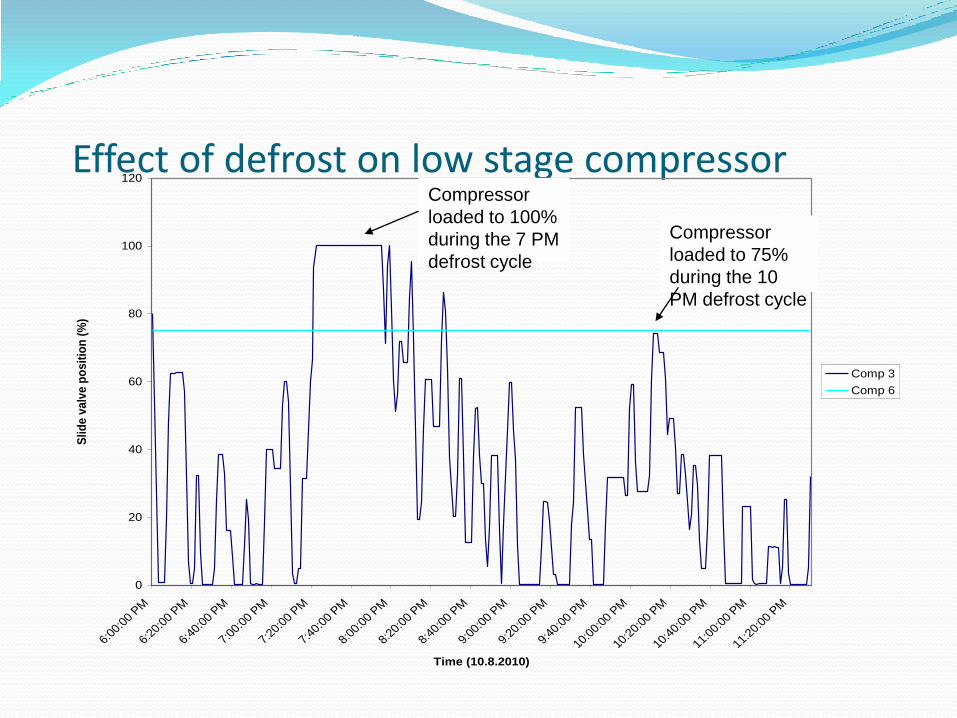
Effect of defrost on low stage compressor
0
20
40
60
80
100
120
6:00
:00
PM
6:20
:00
PM
6:40
:00
PM
7:00
:00
PM
7:20
:00
PM
7:40
:00
PM
8:00
:00
PM
8:20
:00
PM
8:40
:00
PM
9:00
:00
PM
9:20
:00
PM
9:40
:00
PM
10:0
0:00
PM
10:2
0:00
PM
10:4
0:00
PM
11:0
0:00
PM
11:2
0:00
PM
Time (10.8.2010)
Slid
e v
alv
e p
osit
ion
(%
)
Comp 3
Comp 6
Compressor
loaded to 100%
during the 7 PM
defrost cycle
Compressor
loaded to 75%
during the 10
PM defrost cycle
11) – non-condensable control
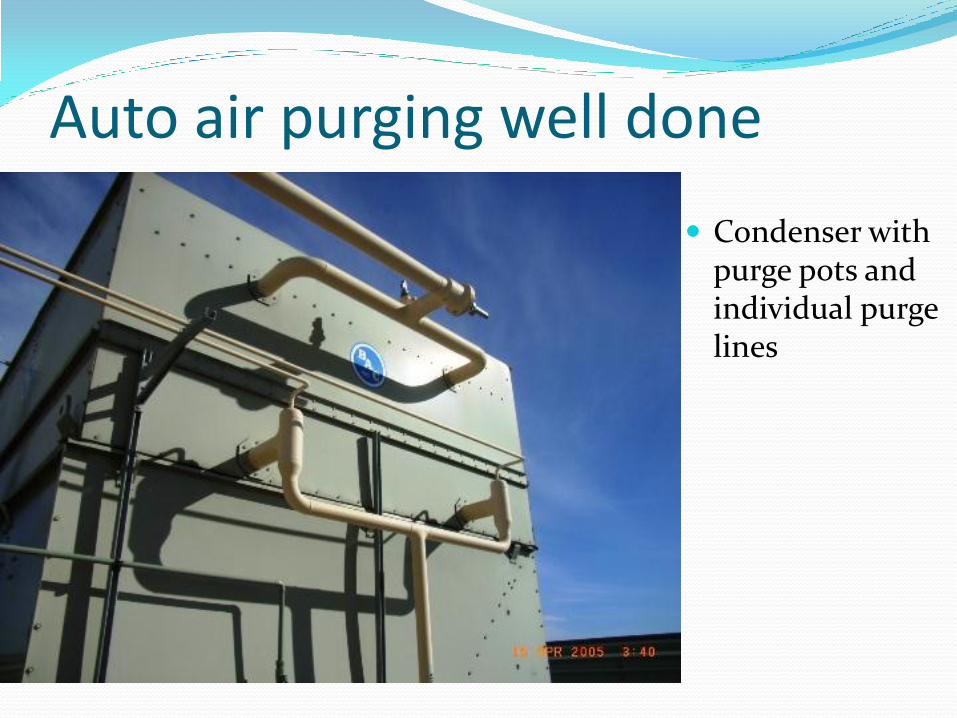
Auto air purging well done
Condenser with purge pots and individual purge lines
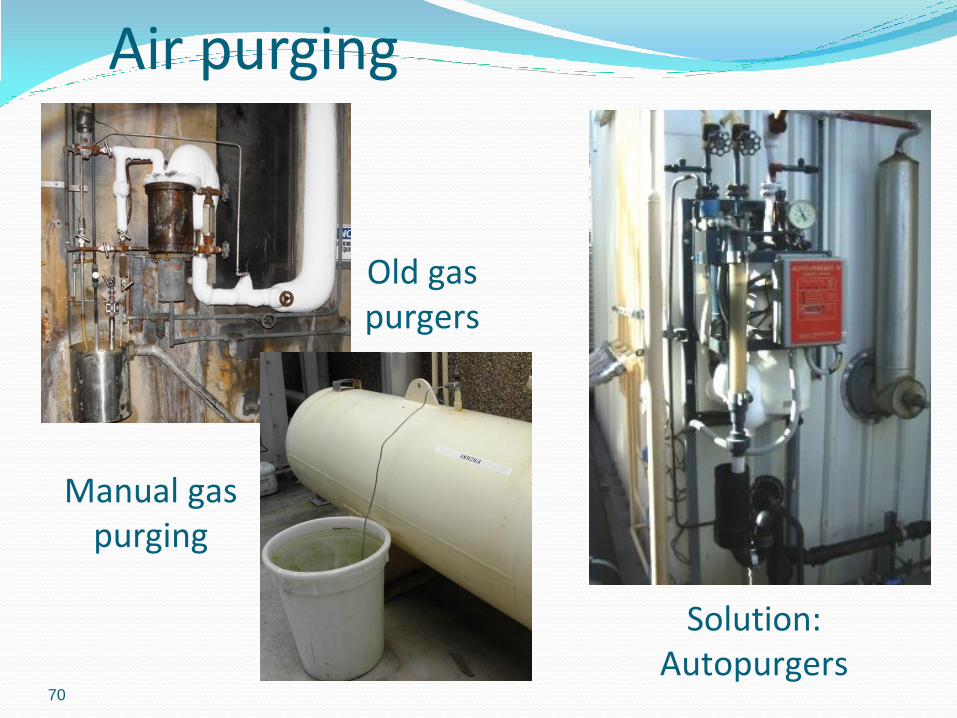
Air purging
70
Old gas purgers
Manual gas purging
Solution: Autopurgers
Air purging

12) – water removal
Water accumulation Water enters with air, but accumulates in the
system
Accumulates on the low temperature side, generally in accumulator/surge vessels
Reduces suction pressure required to achieve setpoint evaporation temperature
Some devices (ice cream churns) act to remove water.
Otherwise water purger required.
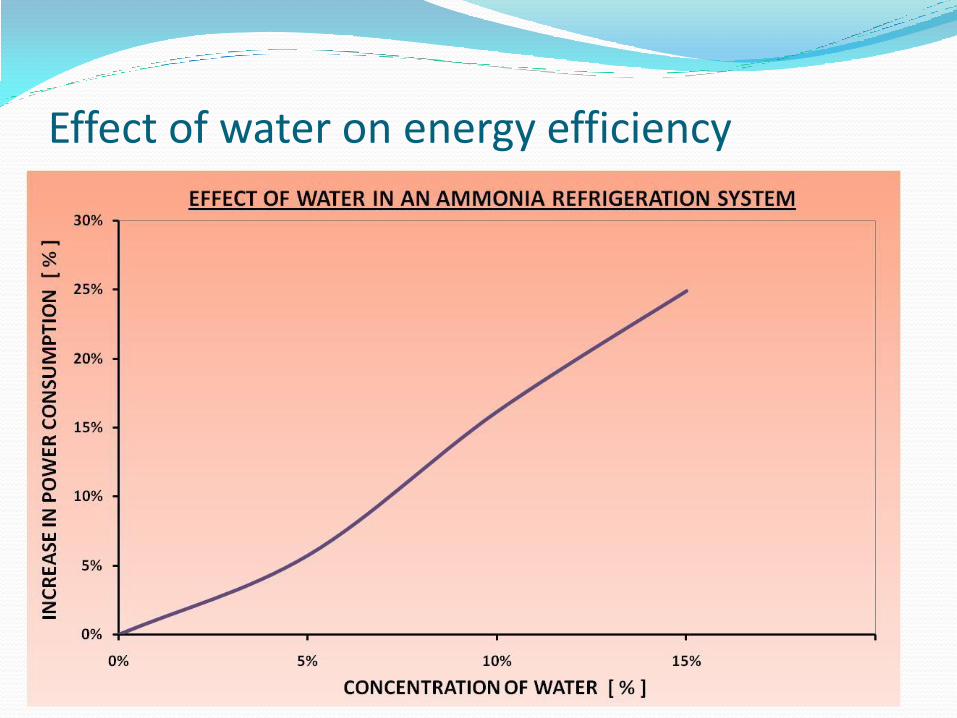
Effect of water on energy efficiency
13) – oil feed rate optimisation
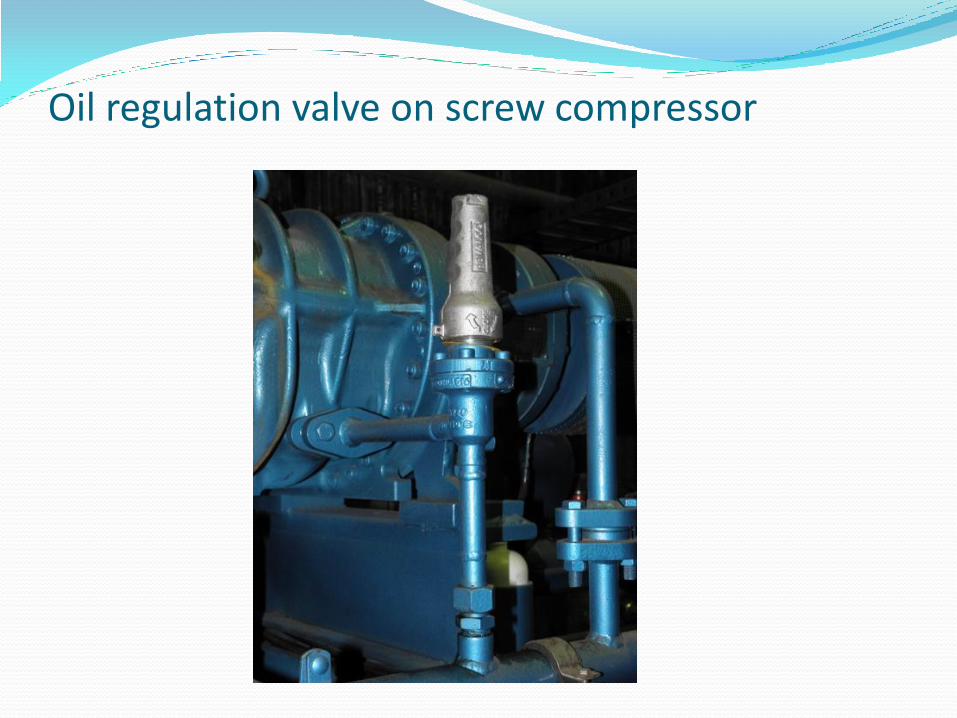
Oil regulation valve on screw compressor
Oil feed to screw compressors Industrial screw compressors require a oil feed into the
compression space to seal the clearances and ensure compression.
Insufficient oil flow – poor efficiency
Excessive oil flow – can cause overcompression or even hydraulic locking
Generally compressor discharge temperature used to adjust oil flow rates
Incorrect adjustment can cause significant inefficiencies
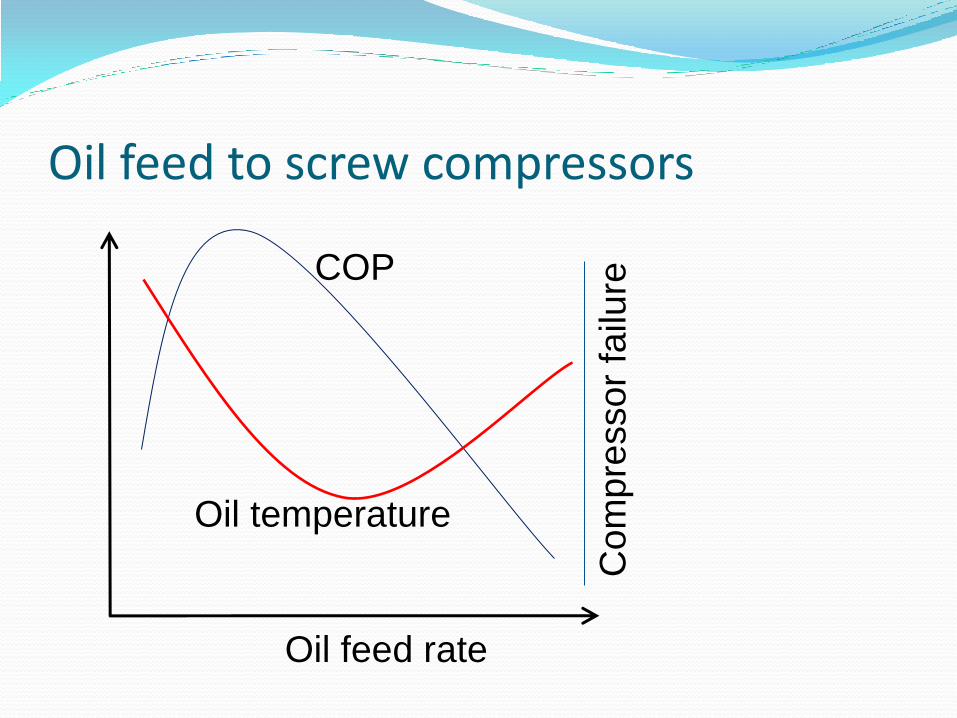
Oil feed to screw compressors
Oil feed rate
COP
Oil temperature
Co
mp
resso
r fa
ilure
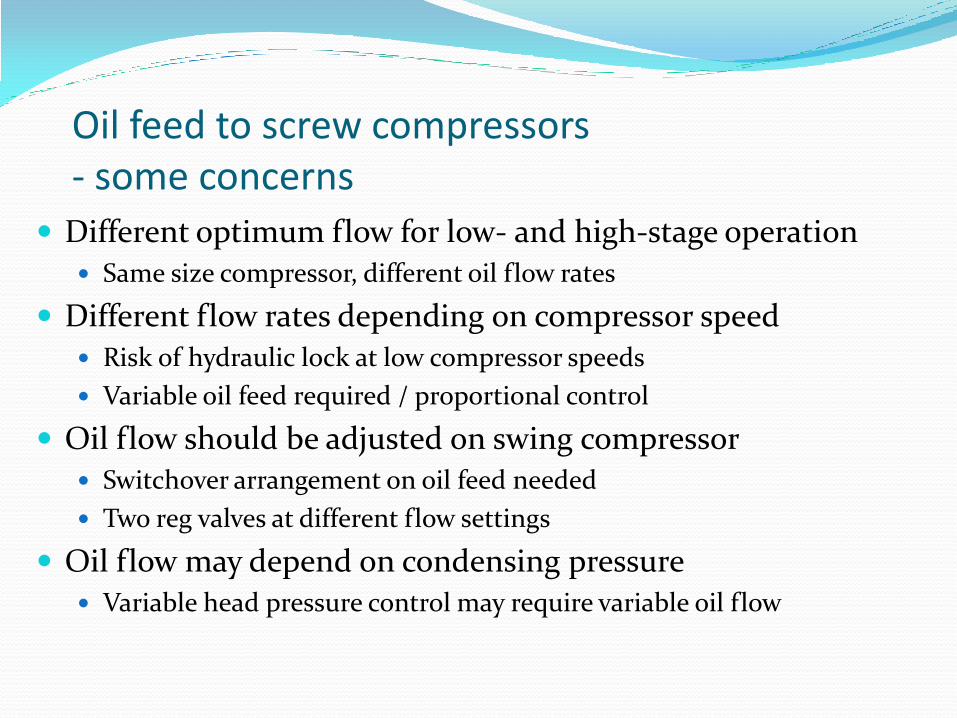
Oil feed to screw compressors - some concerns
Different optimum flow for low- and high-stage operation Same size compressor, different oil flow rates
Different flow rates depending on compressor speed Risk of hydraulic lock at low compressor speeds
Variable oil feed required / proportional control
Oil flow should be adjusted on swing compressor Switchover arrangement on oil feed needed
Two reg valves at different flow settings
Oil flow may depend on condensing pressure Variable head pressure control may require variable oil flow
14) – “bottleneck” removal
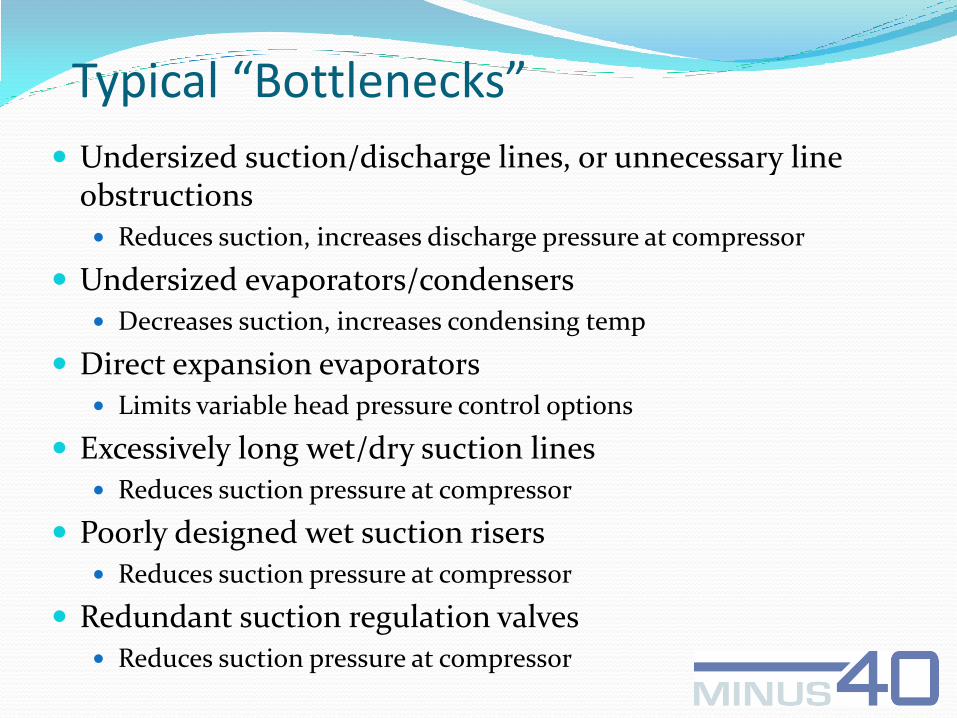
Typical “Bottlenecks”
Undersized suction/discharge lines, or unnecessary line obstructions Reduces suction, increases discharge pressure at compressor
Undersized evaporators/condensers Decreases suction, increases condensing temp
Direct expansion evaporators Limits variable head pressure control options
Excessively long wet/dry suction lines Reduces suction pressure at compressor
Poorly designed wet suction risers Reduces suction pressure at compressor
Redundant suction regulation valves Reduces suction pressure at compressor
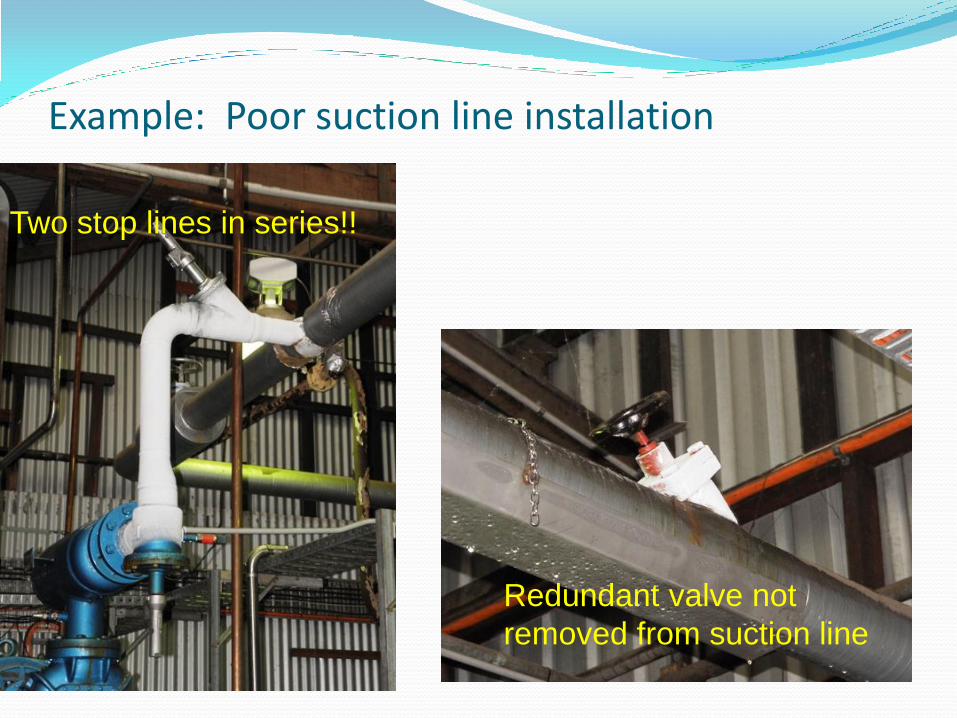
Example: Poor suction line installation
Two stop lines in series!!
Redundant valve not
removed from suction line
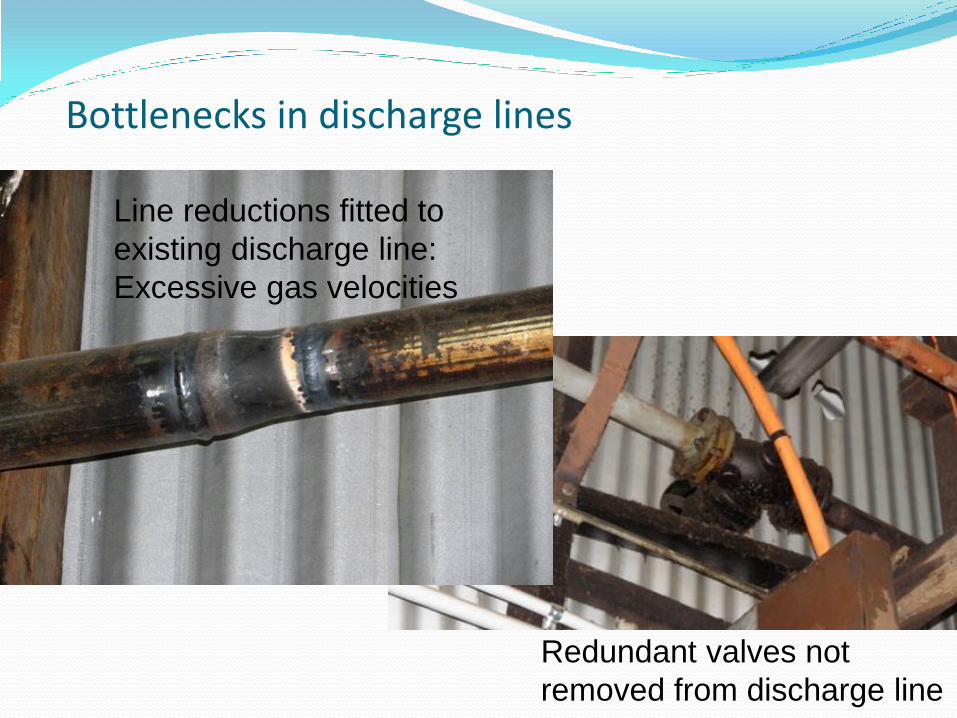
Bottlenecks in discharge lines
Line reductions fitted to
existing discharge line:
Excessive gas velocities
Redundant valves not
removed from discharge line
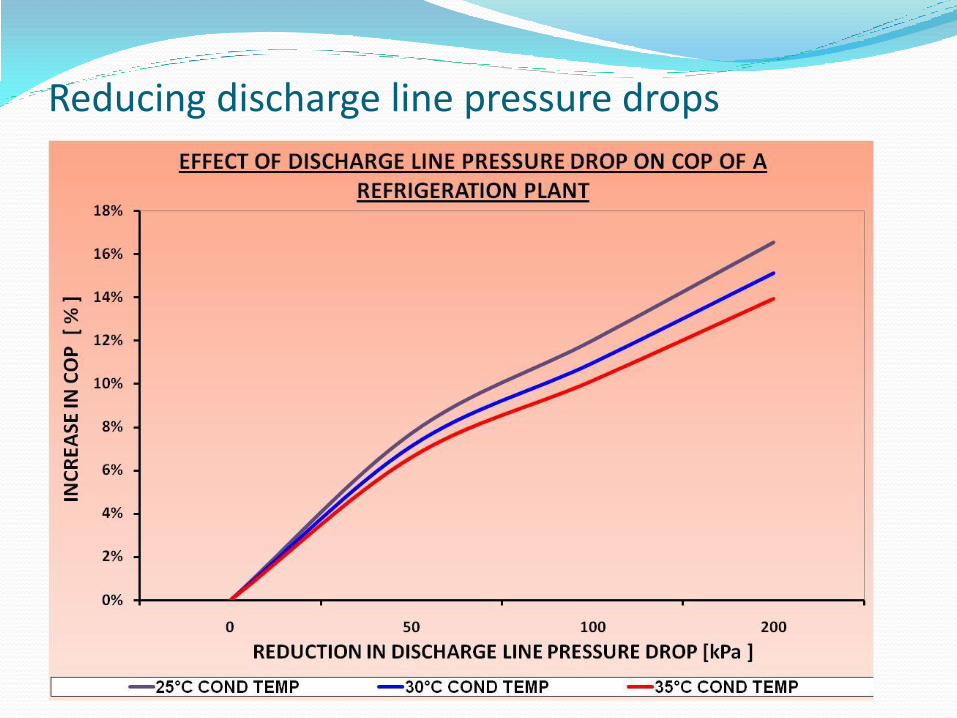
Reducing discharge line pressure drops
Conclusions and Recommendations Analyse your plant for energy savings
opportunities – there are many!
Opportunities not feasible a few years ago are now viable due to higher power costs
Many opportunities are available at relatively minor cost, or require controls upgrade only
Implement viable opportunities NOW
Convert Freon systems to ammonia plant
Apply for government money –there is a lot going around!
85
Government Finance and Funding
NSW Energy Saver Program
NSW Energy Saving Scheme
Low Carbon Australia
Clean Technology Investment Program
Government funding scenario for Example Abattoir
86
NSW Energy Saver Program
70% subsidy for Energy Audit
30 hours engineering support for implementation
$20,000 discretionary Early Adopter Funding for projects >$100,000
Limitations:
NSW sites only
Not applicable to EEO companies
Suitable for sites spending $60K+ p.a. on electricity
87
NSW Energy Saving Scheme
Energy Savings Certificates [ESCs] created for energy savings projects.
ESCs can be traded for CASH
Typical $500k Energy Efficiency project can attract ESCs worth $10,000 to $30,000
Limitations:
NSW only, all sites
88
Low Carbon Australia
Low Interest Finance for Energy Savings projects
Operational Leases
Financial Leases
On-power-bill financing
Direct loans up to 50%
Limitations:
All sites in Australia
Not applicable to greenfield sites
Must satisfy carbon reduction criteria
89
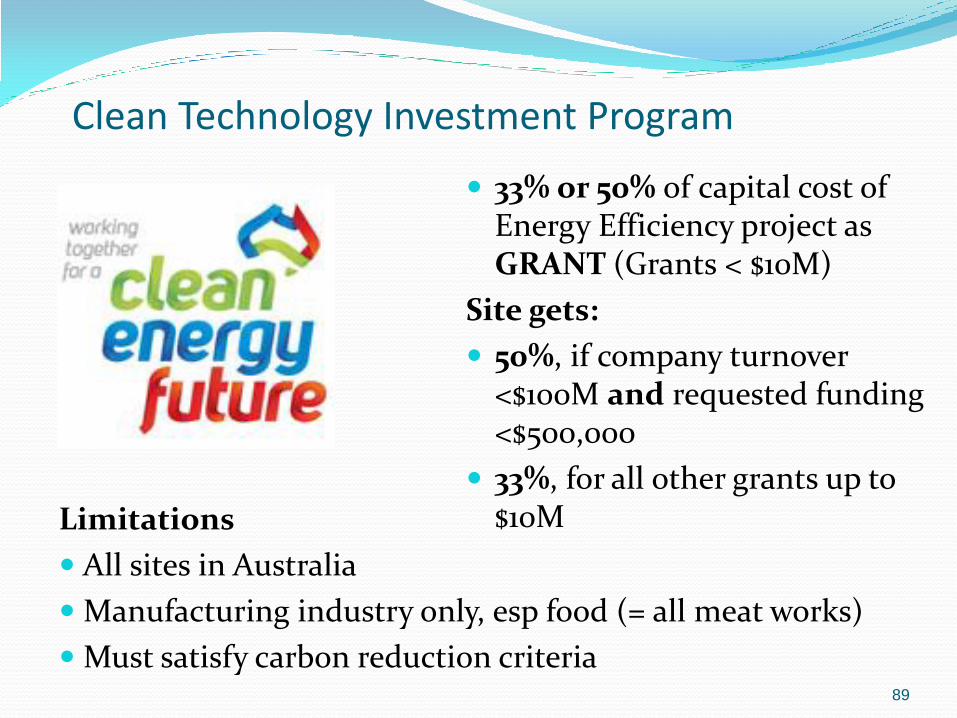
Clean Technology Investment Program
33% or 50% of capital cost of Energy Efficiency project as GRANT (Grants < $10M)
Site gets:
50%, if company turnover <$100M and requested funding <$500,000
33%, for all other grants up to $10M Limitations
All sites in Australia
Manufacturing industry only, esp food (= all meat works)
Must satisfy carbon reduction criteria
90
Government funding scenario for Example abattoir
Total project cost for Energy Efficiency projects on site: $250,000
Energy savings estimated at $93,000 power per annum, 2.7 year simple
payback.
Further engineering costs are applied to fully scope the project and accurately
estimate the savings, say $30,000
Example applies for a low interest loan from Low Carbon Australia (up to
50%), repayable over 5 years
Example obtains a capital grant from the Clean Technology Investment
Program
Example expends another $15,000 on application fees and compliance costs
91
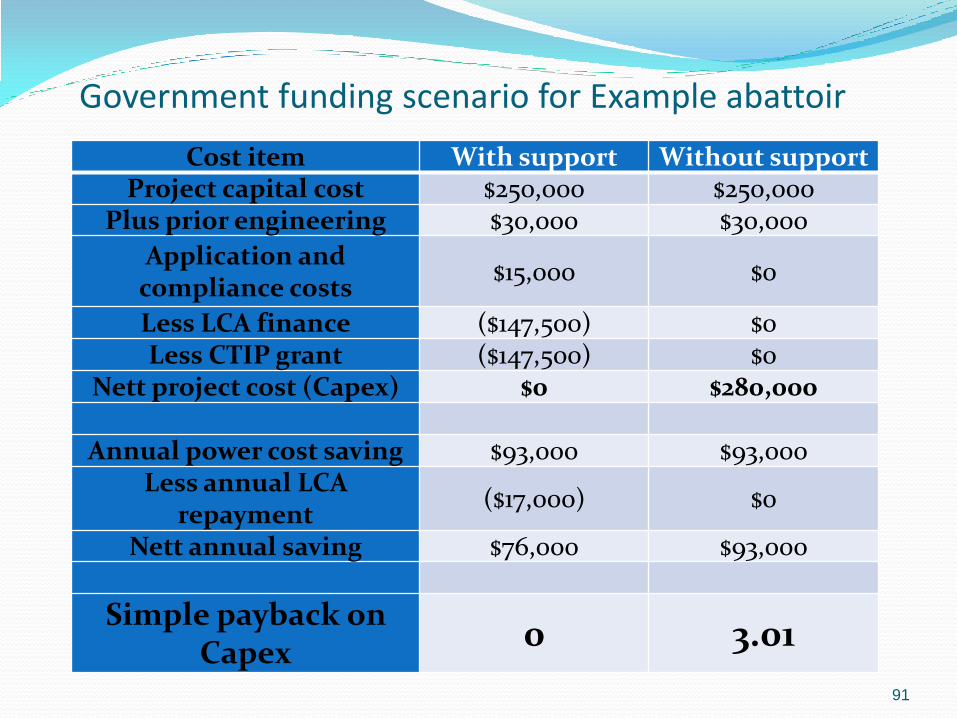
Government funding scenario for Example abattoir
Cost item With support Without support Project capital cost $250,000 $250,000
Plus prior engineering $30,000 $30,000
Application and compliance costs
$15,000 $0
Less LCA finance ($147,500) $0 Less CTIP grant ($147,500) $0
Nett project cost (Capex) $0 $280,000
Annual power cost saving $93,000 $93,000 Less annual LCA
repayment ($17,000) $0
Nett annual saving $76,000 $93,000
Simple payback on Capex
0 3.01

92
Any Questions???