Embed Size (px)
Citation preview
Regents Biology
Types of Variables Dependent Variable - what you measure
in an experiment, graphed on the Y-axis unpredictable change - we don’t know
how it will change until we do the experiment
Independent Variable - what I change in the experiment, graphed on the X-axis
predictable change - it only changes because you made it change
Regents Biology
ControlControl(s) – part of the
experiment that DOES NOT change, kept constant or the same
Regents Biology
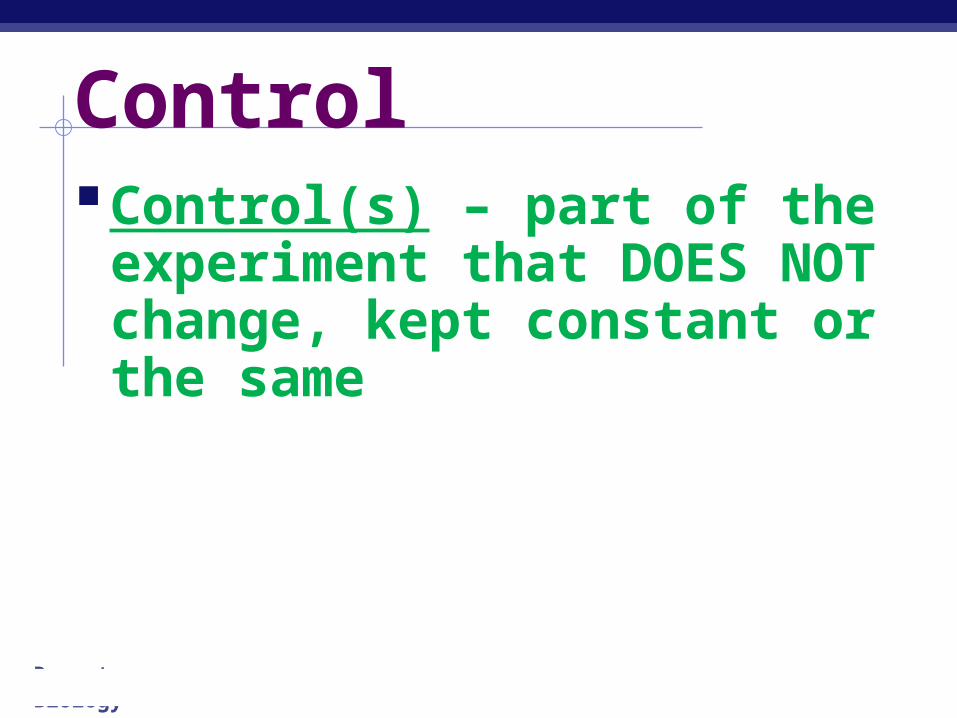
Example How does fertilizer affect the growth rate of
plants? We set up an experiment testing different
amounts of fertilizer on plants and measuring the growth of the plants.
Dependent variable (Y-axis)?Height of plants
Independent variable (X-axis)?Amount of fertilizer
Control?Type of plant
Regents Biology
Example How does exercise affect the heart rate of a
10th grade student? We set up an experiment testing different
lengths of time of exercise on the heart rate of a student.
Dependent variable (Y-axis)?Heart rate
Independent variable (X-axis)?Minutes of exercise
Control?Student
Regents Biology
Example If you spend more time studying, then
your grade will improve?
Dependent variable (Y-axis)?Grade
Independent variable (X-axis)?Amount of time spent studying
Control?Student
Regents Biology
Example If the temperature of the room is
increased, then the bacteria will grow faster.
Dependent variable (Y-axis)?Bacterial growth
Independent variable (X-axis)?Temperature of room
Control?Type of bacteria
Regents Biology 2005-2006
Regents Biology
Create a Graphing Template
In your IAN notebook, you will create the a foldable to help you create and read graphs in this unit.
Take the 8½” x 11” sheet of paper you are given and turn it Landscape Style as shown.
Regents Biology
Creating a Graphing Template
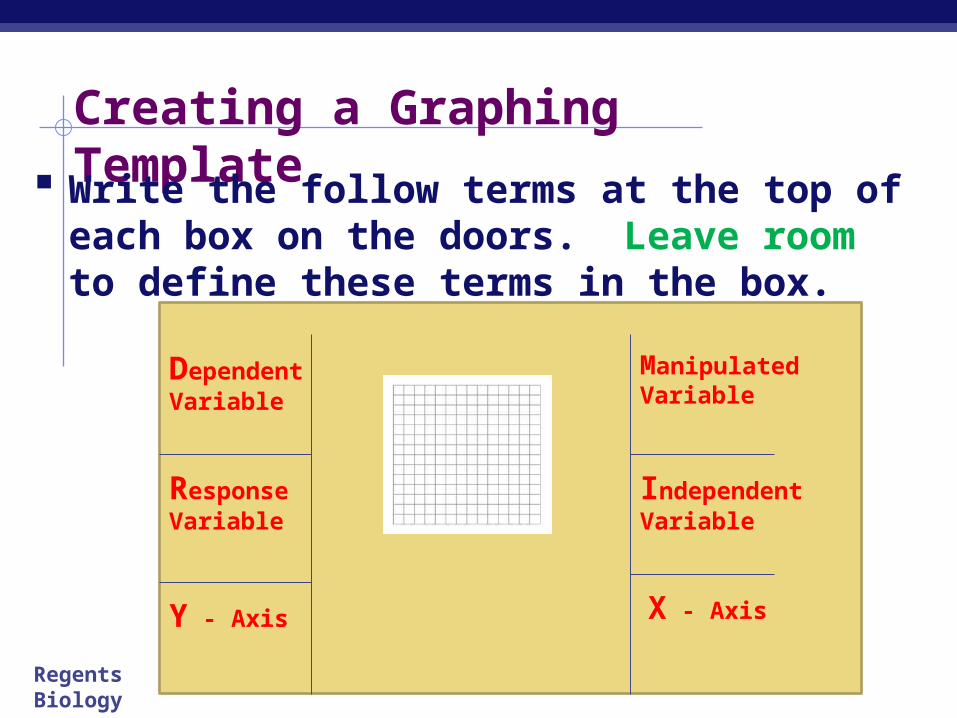
Write the follow terms at the top of each box on the doors. Leave room to define these terms in the box.
Dependent Variable
Response Variable
Y - Axis
Independent Variable
Manipulated Variable
X - Axis
Regents Biology
Copy the definitions as we go thru the slides, copy what is in red.
Dependent Variable – the possible outcome of the experiment; the effect.
Regents Biology 2005-2006
Response Variable – What did I measure? What was the effect of the change?
Regents Biology 2005-2006
Y – Axis = The Vertical Axis on a graph.
Regents Biology 2005-2006
Manipulated Variable – What did I change in the experiment? What will happen if this changes?
Regents Biology 2005-2006
Independent Variable – the variable that you have control over, what you can choose and manipulate.
Regents Biology 2005-2006
X – Axis = The Horizontal Axis on a graph.
Regents Biology
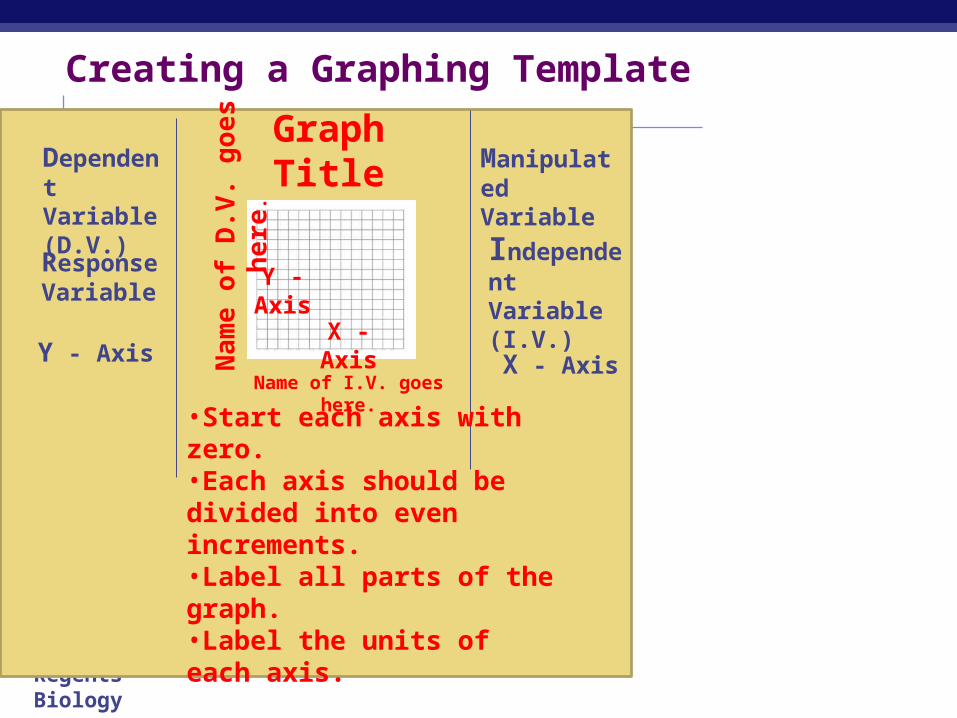
Creating a Graphing Template
Dependent Variable (D.V.)
Response Variable
Y - Axis
Independent Variable (I.V.)
Manipulated Variable
X - Axis
Graph Title
Na
me
of
D.V
. go
es
he
re.
Name of I.V. goes here.
•Start each axis with zero.•Each axis should be divided into even increments.•Label all parts of the graph.•Label the units of each axis.
Y - Axis
X - Axis
Regents Biology
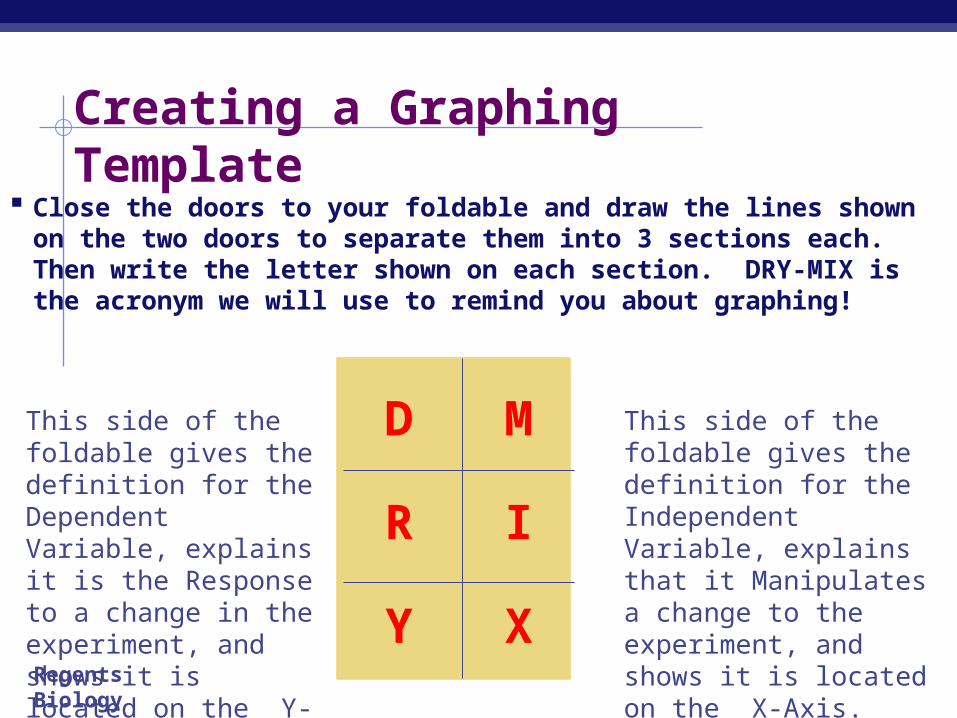
Creating a Graphing Template
Close the doors to your foldable and draw the lines shown on the two doors to separate them into 3 sections each. Then write the letter shown on each section. DRY-MIX is the acronym we will use to remind you about graphing!
D
R
Y
M
I
X
This side of the foldable gives the definition for the Dependent Variable, explains it is the Response to a change in the experiment, and shows it is located on the Y-Axis.
This side of the foldable gives the definition for the Independent Variable, explains that it Manipulates a change to the experiment, and shows it is located on the X-Axis.
Regents Biology
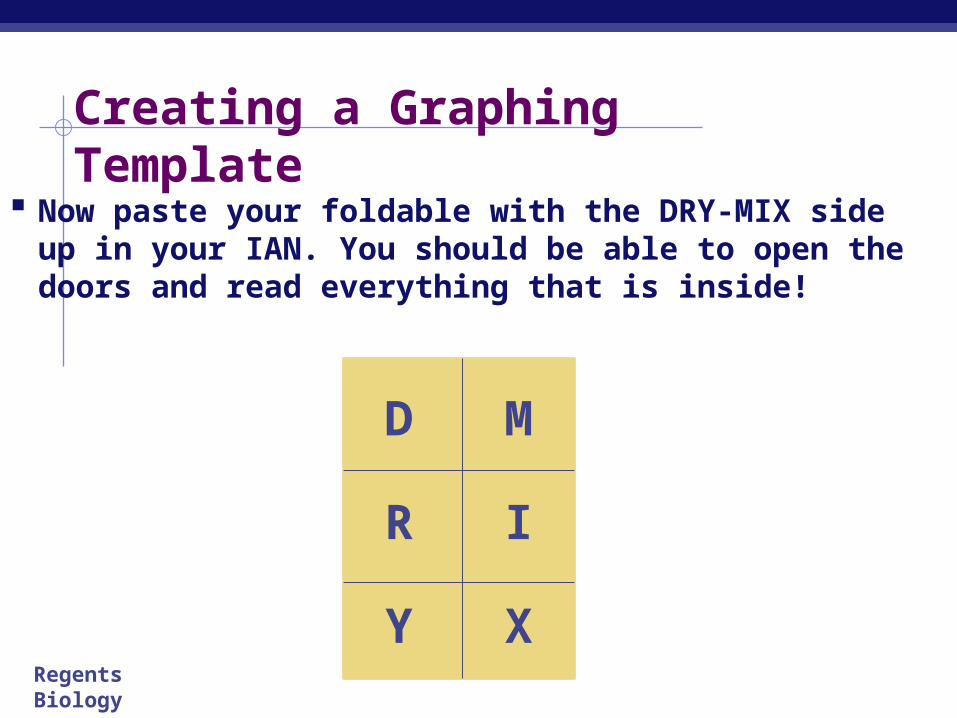
Creating a Graphing Template
Now paste your foldable with the DRY-MIX side up in your IAN. You should be able to open the doors and read everything that is inside!
D
R
Y
M
I
X
Regents Biology
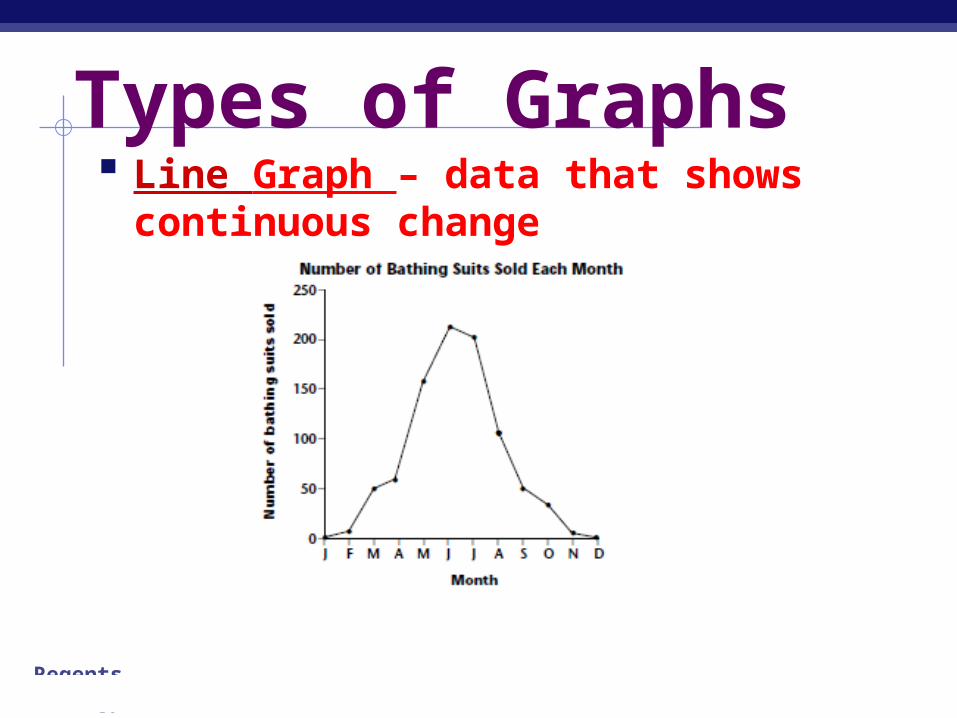
Types of Graphs Line Graph – data that shows
continuous change
Regents Biology
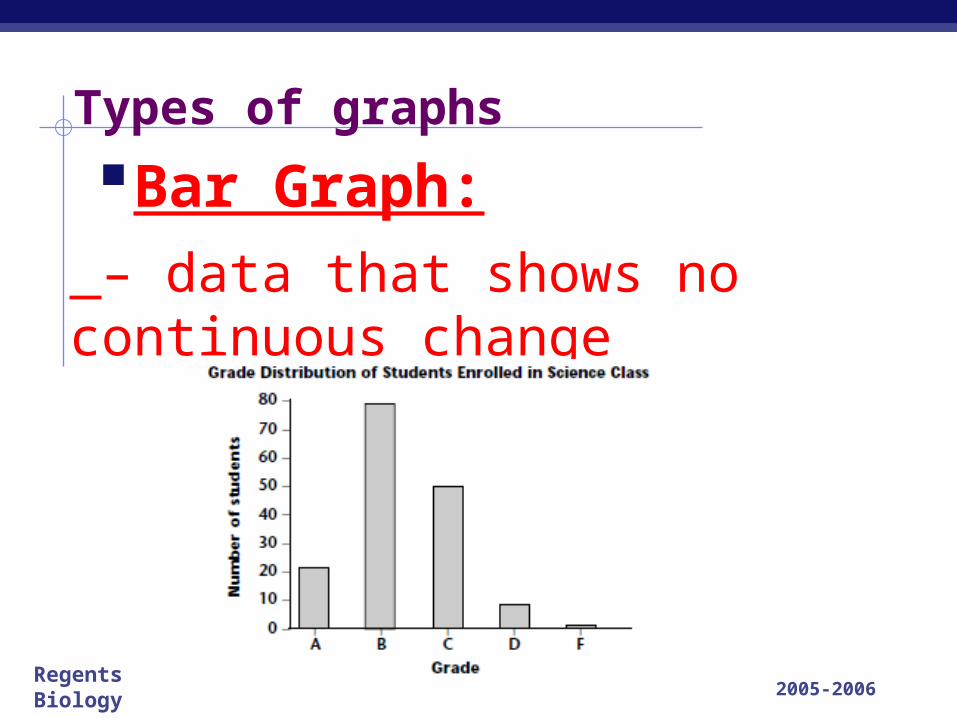
Types of graphs
Bar Graph:
2005-2006
– data that shows no continuous change
Regents Biology
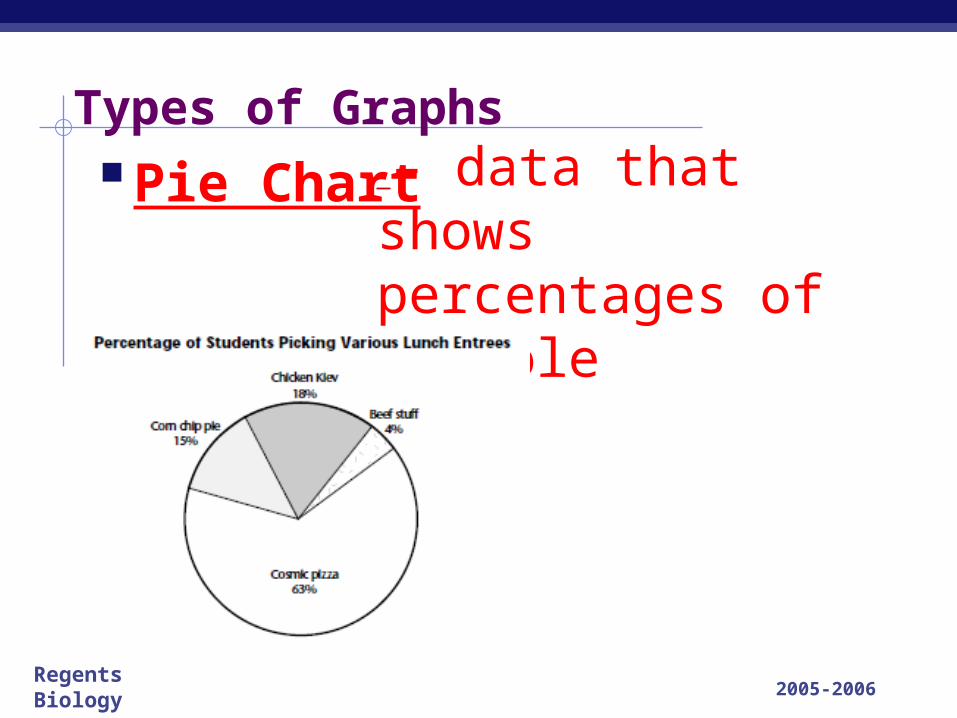
Types of Graphs
Pie Chart
2005-2006
– data that shows percentages of a whole
Regents Biology
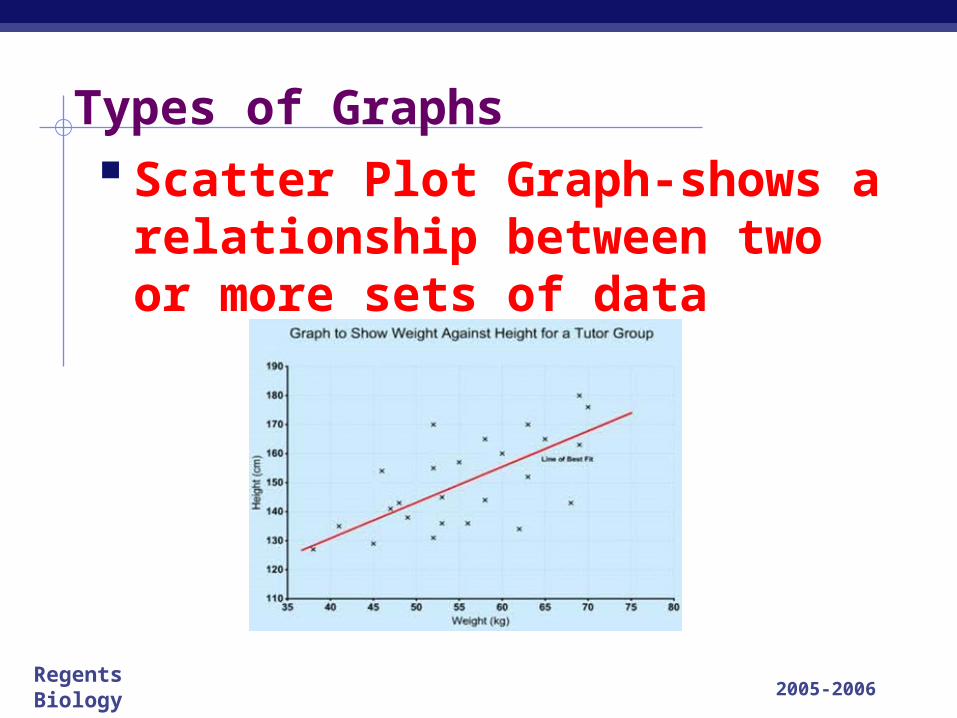
Types of Graphs Scatter Plot Graph-shows a
relationship between two or more sets of data
2005-2006
Regents Biology
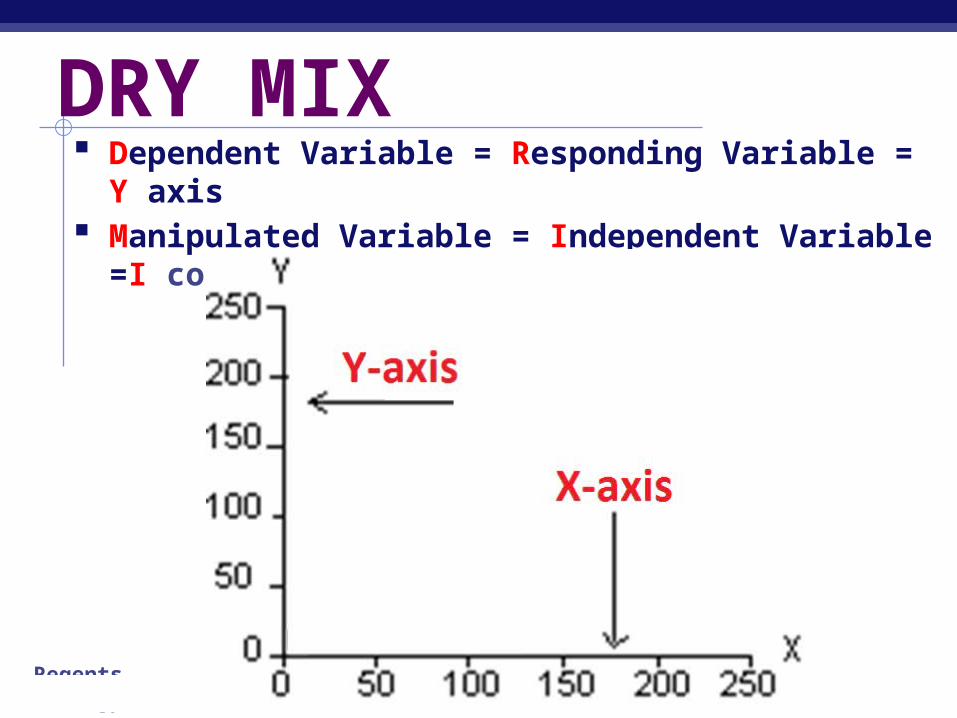
DRY MIX Dependent Variable = Responding Variable = Y axis Manipulated Variable = Independent Variable =I control
= X axis
Regents Biology
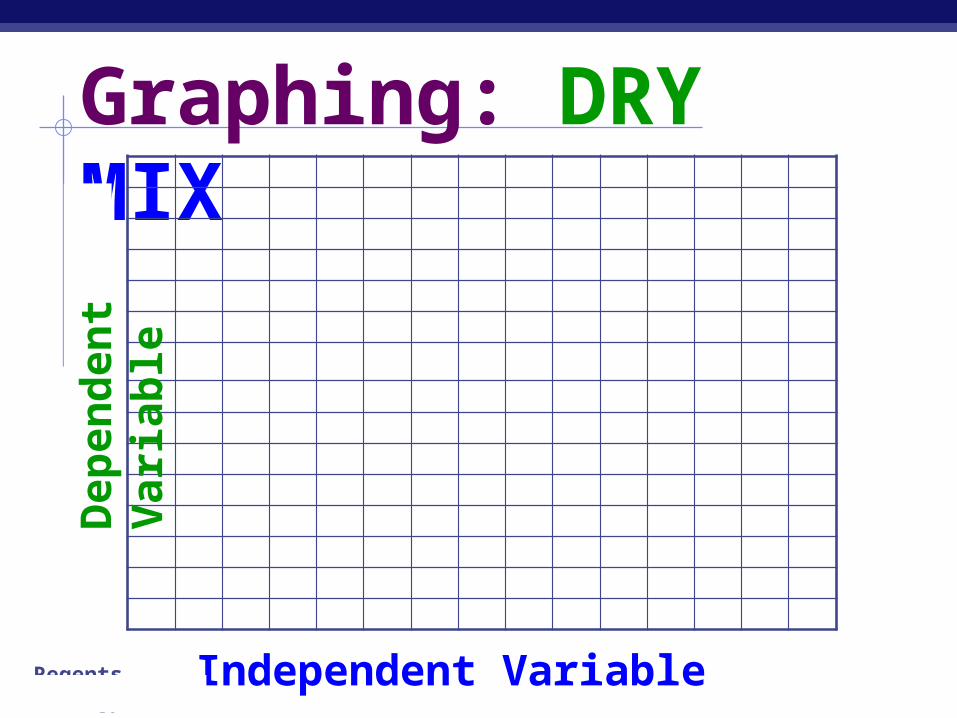
Graphing: DRY MIX
Independent Variable
Dep
end
ent
Var
iab
le

![MODEL RESPONSE SET - Regents ExaminationsAlgebra I – Jan. ’18 [15] Question 28 Score 1: The student graphed (0,4) incorrectly, but gave an appropriate justification. 28 Determine](https://img.pdfslide.net/doc/110x75/5f060a3c7e708231d415fdf4/model-response-set-regents-examinations-algebra-i-a-jan-a18-15-question.jpg)


![MODEL RESPONSE SET - Regents ExaminationsAlgebra I – Jan. ’19 [60] Question 36 Score 2: The student graphed a rate of change of 2° per hour for 7 hours instead of 6, but stated](https://img.pdfslide.net/doc/110x75/5e62c6d44dca5454166a7eff/model-response-set-regents-examinations-algebra-i-a-jan-a19-60-question.jpg)
![The University of the State of New York REGENTS HIGH ... · Geometry – June ’14 [30] Question 35 Score 1: The student graphed and labeled ABC correctly. No further correct work](https://img.pdfslide.net/doc/110x75/5f1f388d4db5d732d1512bc1/the-university-of-the-state-of-new-york-regents-high-geometry-a-june-a14.jpg)