Embed Size (px)
Citation preview
BMO Government Finance Conference| Spring 2016 1
Region of Peel
BMO Government Finance
Conference
May 2016
BMO Government Finance Conference| Spring 2016 2
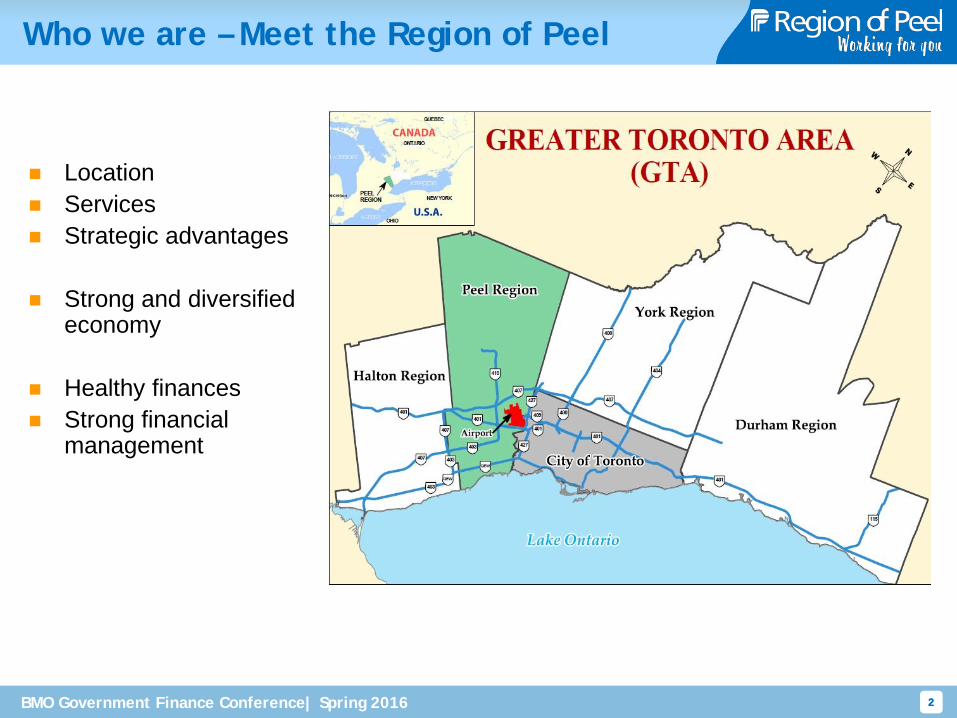
Who we are – Meet the Region of Peel
2
Location Services Strategic advantages
Strong and diversified
economy
Healthy finances Strong financial
management
BMO Government Finance Conference| Spring 2016 3
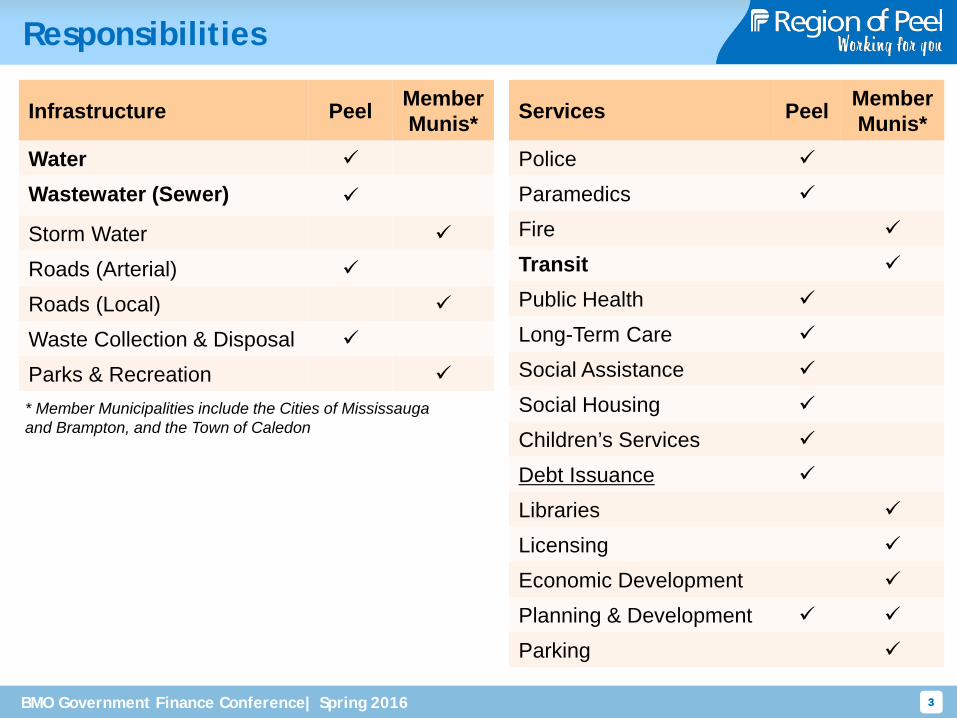
Responsibilities
3
Infrastructure Peel Member Munis*
Water Wastewater (Sewer)
Storm Water Roads (Arterial) Roads (Local) Waste Collection & Disposal Parks & Recreation * Member Municipalities include the Cities of Mississauga and Brampton, and the Town of Caledon
Services Peel Member Munis*
Police Paramedics Fire Transit Public Health Long-Term Care Social Assistance Social Housing Children’s Services Debt Issuance Libraries Licensing Economic Development Planning & Development Parking
BMO Government Finance Conference| Spring 2016 4
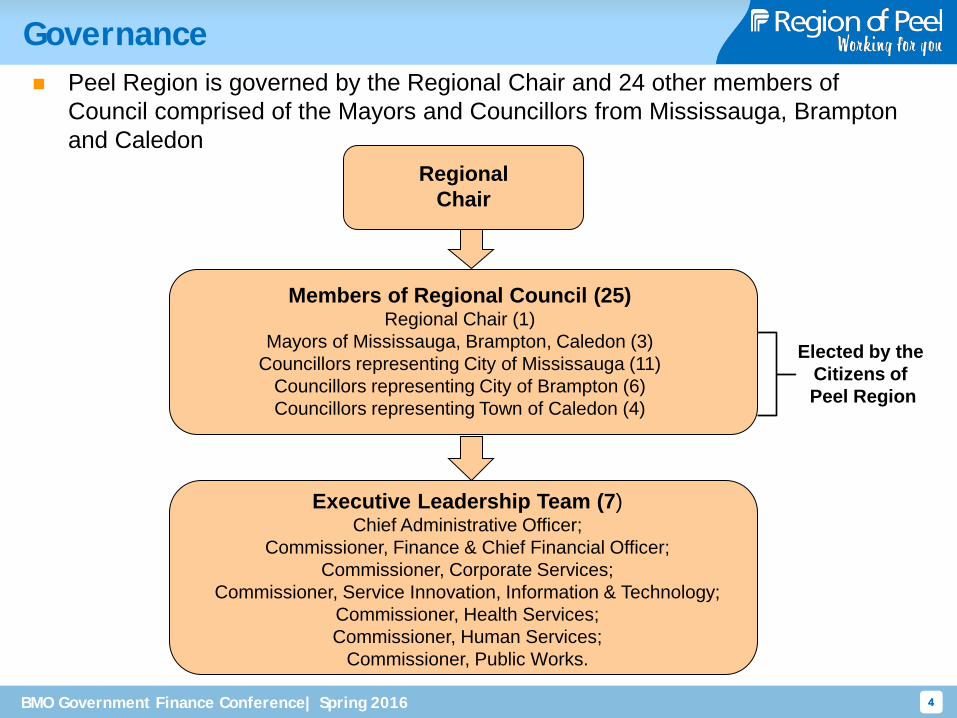
Governance
4
Peel Region is governed by the Regional Chair and 24 other members of Council comprised of the Mayors and Councillors from Mississauga, Brampton and Caledon
Regional Chair
Members of Regional Council (25) Regional Chair (1)
Mayors of Mississauga, Brampton, Caledon (3) Councillors representing City of Mississauga (11)
Councillors representing City of Brampton (6) Councillors representing Town of Caledon (4)
Executive Leadership Team (7) Chief Administrative Officer;
Commissioner, Finance & Chief Financial Officer; Commissioner, Corporate Services;
Commissioner, Service Innovation, Information & Technology; Commissioner, Health Services; Commissioner, Human Services;
Commissioner, Public Works.
Elected by the Citizens of Peel Region
BMO Government Finance Conference| Spring 2016 5
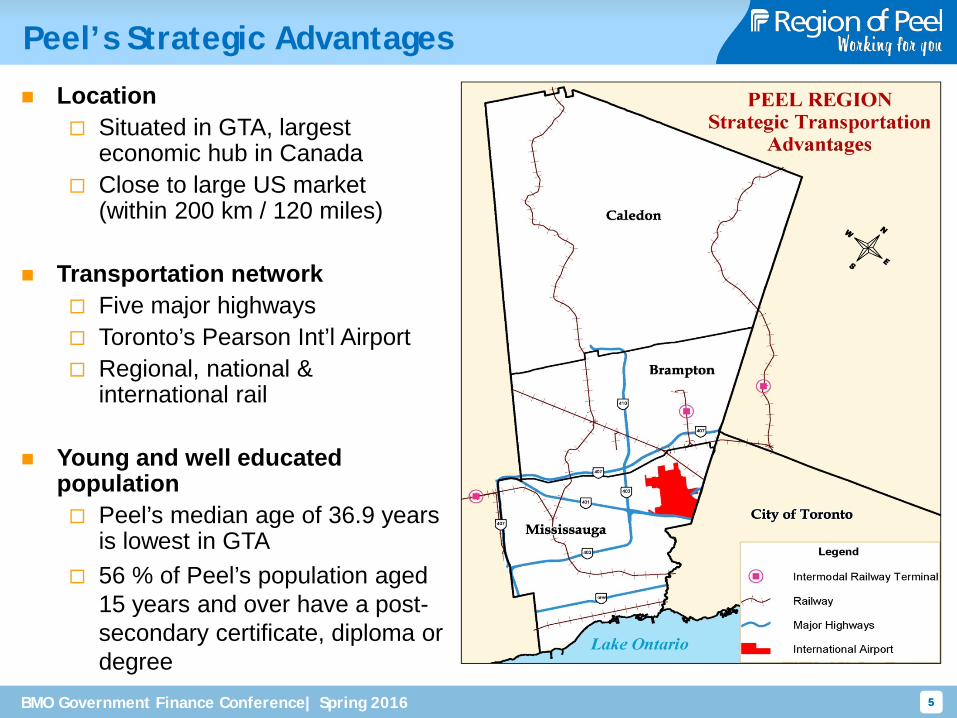
Peel’s Strategic Advantages
5
Location Situated in GTA, largest
economic hub in Canada Close to large US market
(within 200 km / 120 miles)
Transportation network Five major highways Toronto’s Pearson Int’l Airport Regional, national &
international rail
Young and well educated population Peel’s median age of 36.9 years
is lowest in GTA 56 % of Peel’s population aged
15 years and over have a post-secondary certificate, diploma or degree
BMO Government Finance Conference| Spring 2016 6
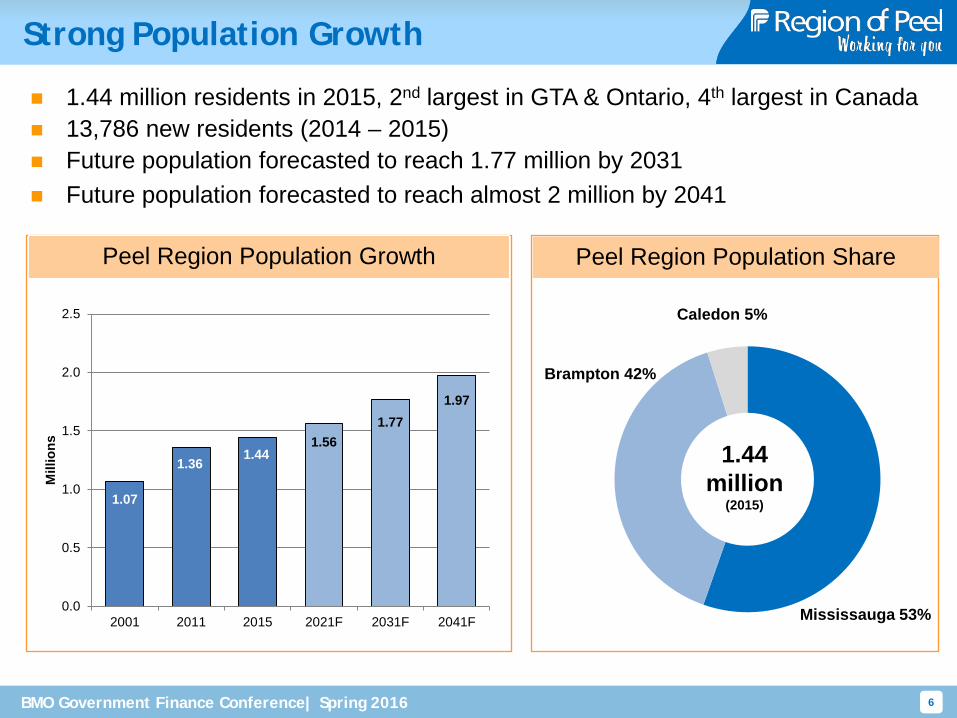
1.44 million residents in 2015, 2nd largest in GTA & Ontario, 4th largest in Canada 13,786 new residents (2014 – 2015) Future population forecasted to reach 1.77 million by 2031 Future population forecasted to reach almost 2 million by 2041
Peel Region Population Growth
1.07
1.36 1.44
1.56 1.77
1.97
0.0
0.5
1.0
1.5
2.0
2.5
2001 2011 2015 2021F 2031F 2041F
Mill
ions
Brampton 42%
1.44 million
(2015)
Peel Region Population Share
Caledon 5%
Mississauga 53%
Strong Population Growth
BMO Government Finance Conference| Spring 2016 7
Diversified Labour Market
7
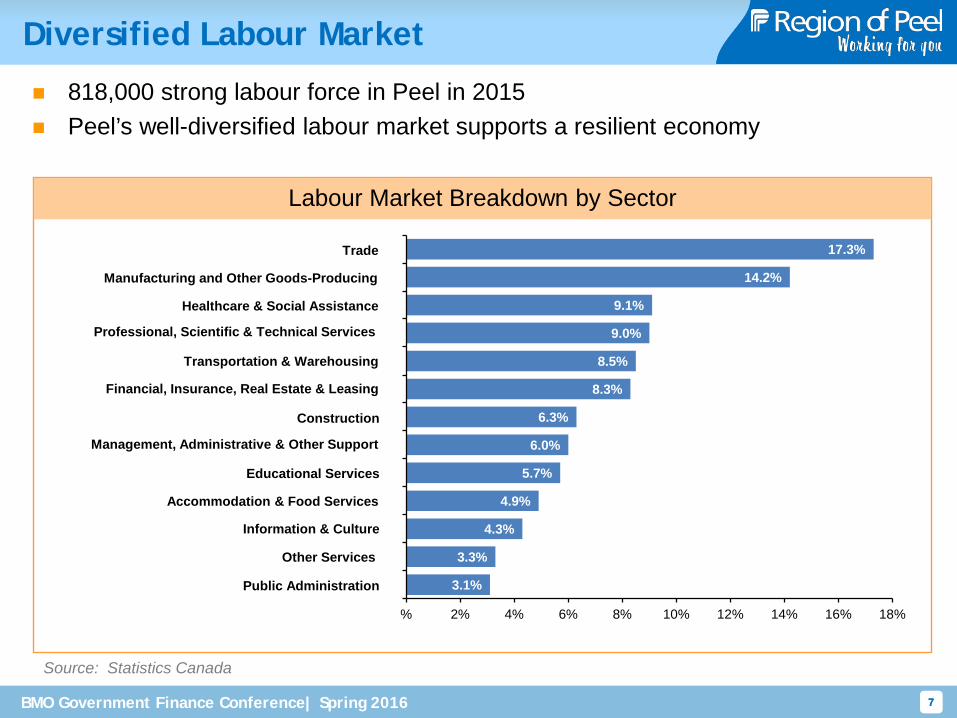
818,000 strong labour force in Peel in 2015 Peel’s well-diversified labour market supports a resilient economy
Source: Statistics Canada
Trade
Transportation & Warehousing
Financial, Insurance, Real Estate & Leasing
Healthcare & Social Assistance
Construction
Professional, Scientific & Technical Services
Information & Culture
Accommodation & Food Services
Public Administration
Other Services
3.1%
3.3%
4.3%
4.9%
5.7%
6.0%
6.3%
8.3%
8.5%
9.0%
9.1%
14.2%
17.3%
% 2% 4% 6% 8% 10% 12% 14% 16% 18%
Labour Market Breakdown by Sector
Educational Services
Manufacturing and Other Goods-Producing
Management, Administrative & Other Support
BMO Government Finance Conference| Spring 2016 8
Labour Market Conditions
8
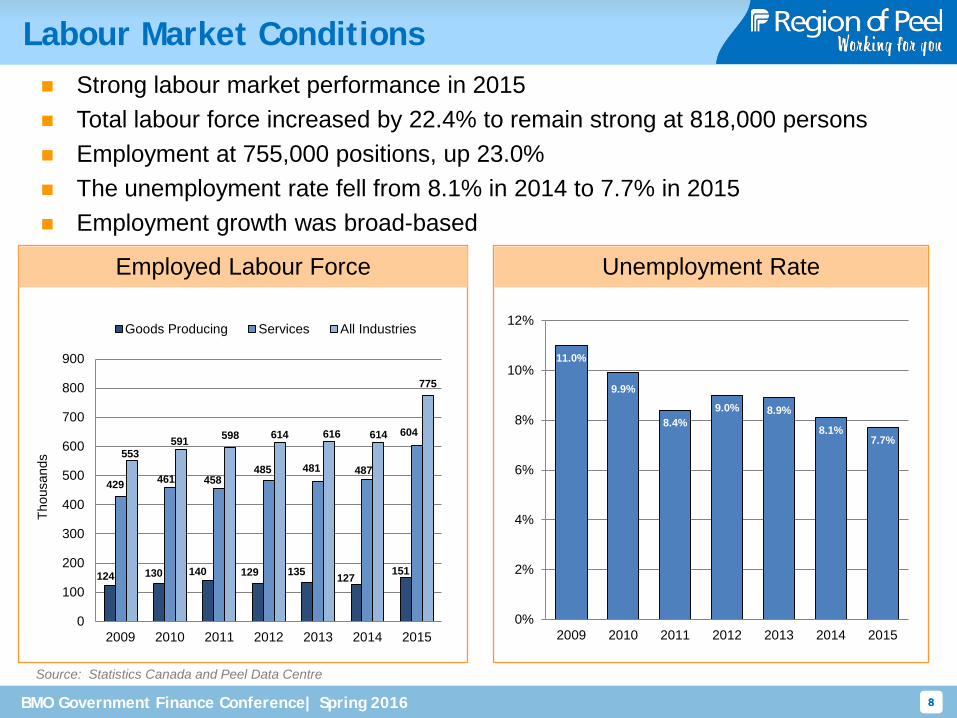
Strong labour market performance in 2015 Total labour force increased by 22.4% to remain strong at 818,000 persons Employment at 755,000 positions, up 23.0% The unemployment rate fell from 8.1% in 2014 to 7.7% in 2015 Employment growth was broad-based
Source: Statistics Canada and Peel Data Centre
Employed Labour Force Unemployment Rate
11.0%
9.9%
8.4% 9.0% 8.9%
8.1% 7.7%
0%
2%
4%
6%
8%
10%
12%
2009 2010 2011 2012 2013 2014 2015
124 130 140 129 135 127 151
429 461 458 485 481 487
604
553 591 598 614 616 614
775
0
100
200
300
400
500
600
700
800
900
2009 2010 2011 2012 2013 2014 2015
Thou
sand
s
Goods Producing Services All Industries
BMO Government Finance Conference| Spring 2016 9
Household Income
9
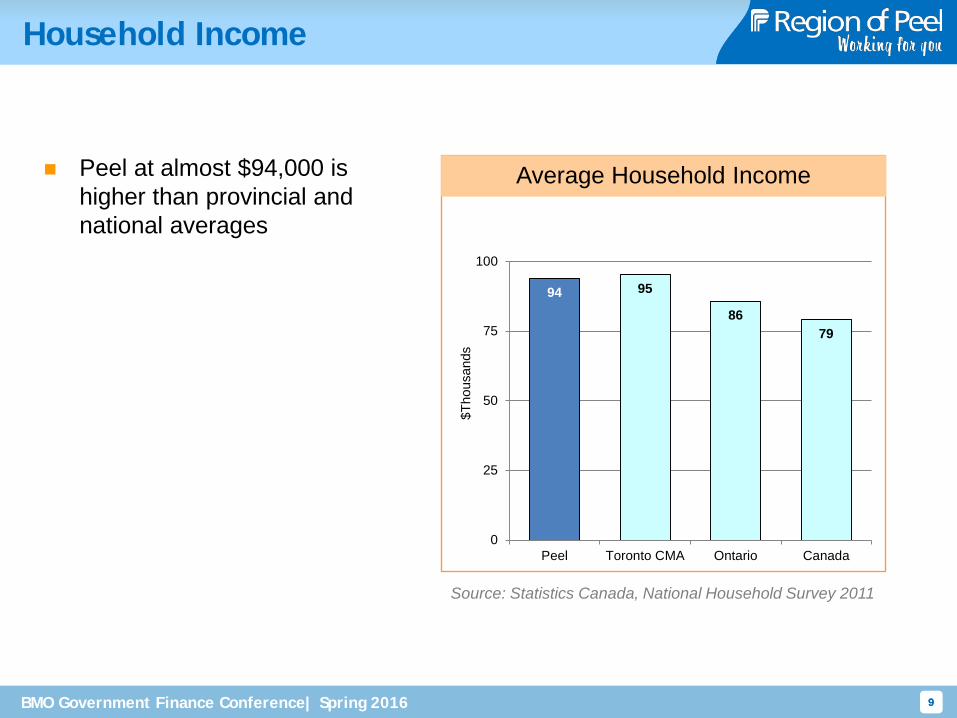
Source: Statistics Canada, National Household Survey 2011
Peel at almost $94,000 is higher than provincial and national averages
Average Household Income
94 95
86 79
0
25
50
75
100
Peel Toronto CMA Ontario Canada
$Tho
usan
ds
BMO Government Finance Conference| Spring 2016 10
Growing Business Sector
10
Source: Statistics Canada and Peel Data Centre
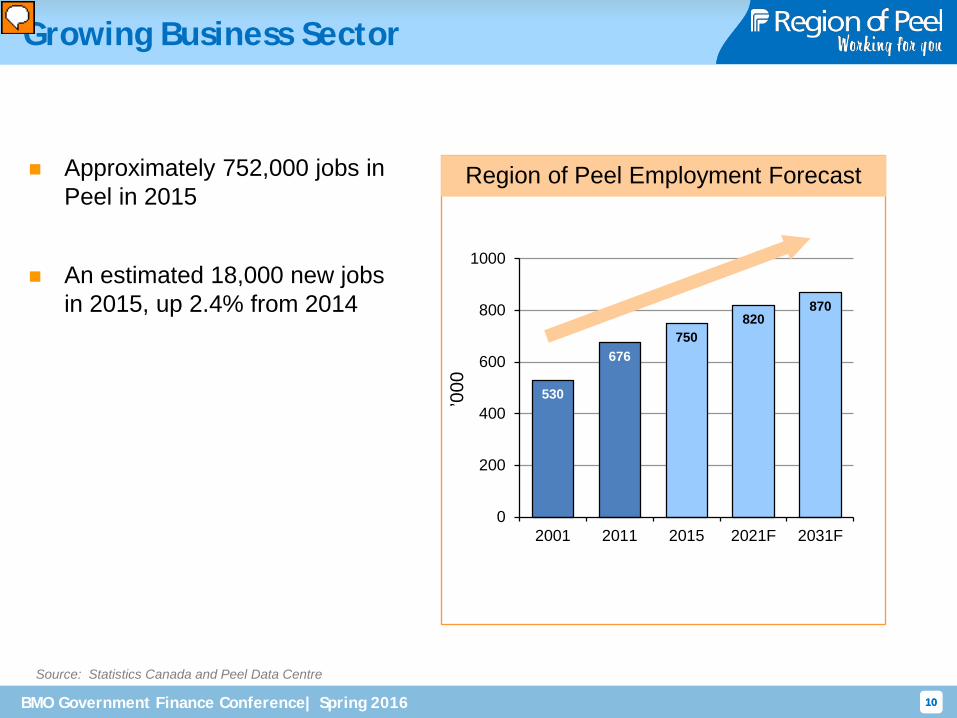
Region of Peel Employment Forecast
530
676 750
820 870
0
200
400
600
800
1000
2001 2011 2015 2021F 2031F
’000
Approximately 752,000 jobs in Peel in 2015
An estimated 18,000 new jobs in 2015, up 2.4% from 2014
BMO Government Finance Conference| Spring 2016 11 11
Diversified Business Sector - 2015
11
Source: Statistics Canada, Canadian Business Patterns
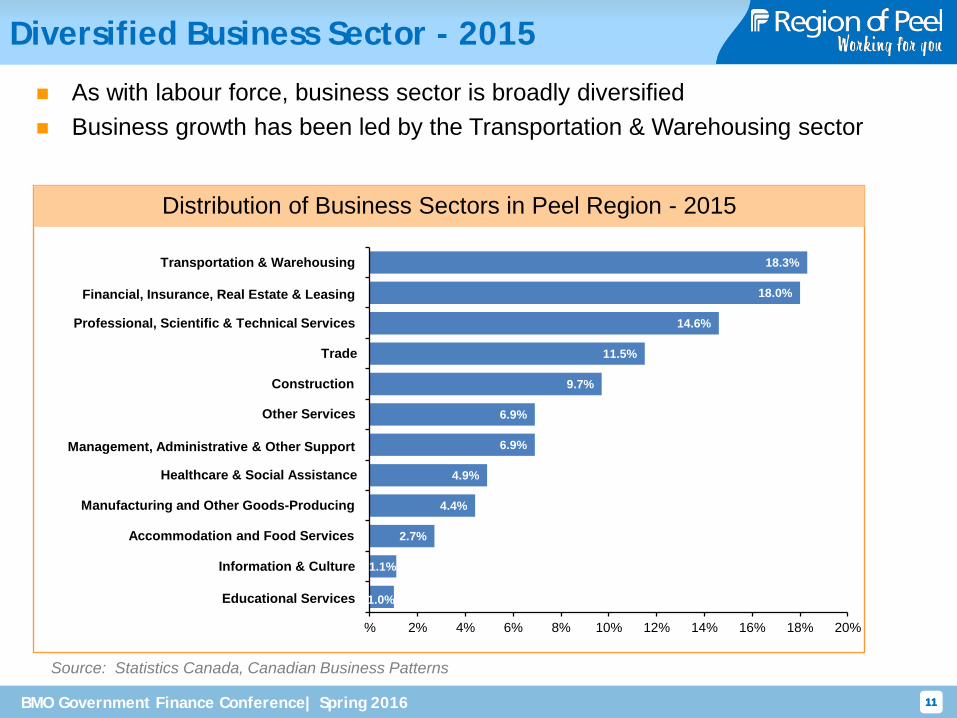
Distribution of Business Sectors in Peel Region - 2015
1.0%
1.1%
2.7%
4.4%
4.9%
6.9%
6.9%
9.7%
11.5%
14.6%
18.0%
18.3%
% 2% 4% 6% 8% 10% 12% 14% 16% 18% 20%
Trade
Manufacturing and Other Goods-Producing
Transportation & Warehousing
Professional, Scientific & Technical Services
Financial, Insurance, Real Estate & Leasing
Construction
Management, Administrative & Other Support
Educational Services
Healthcare & Social Assistance
Accommodation and Food Services
Information & Culture
As with labour force, business sector is broadly diversified Business growth has been led by the Transportation & Warehousing sector
Other Services
BMO Government Finance Conference| Spring 2016 12
Strong Business Sector
12
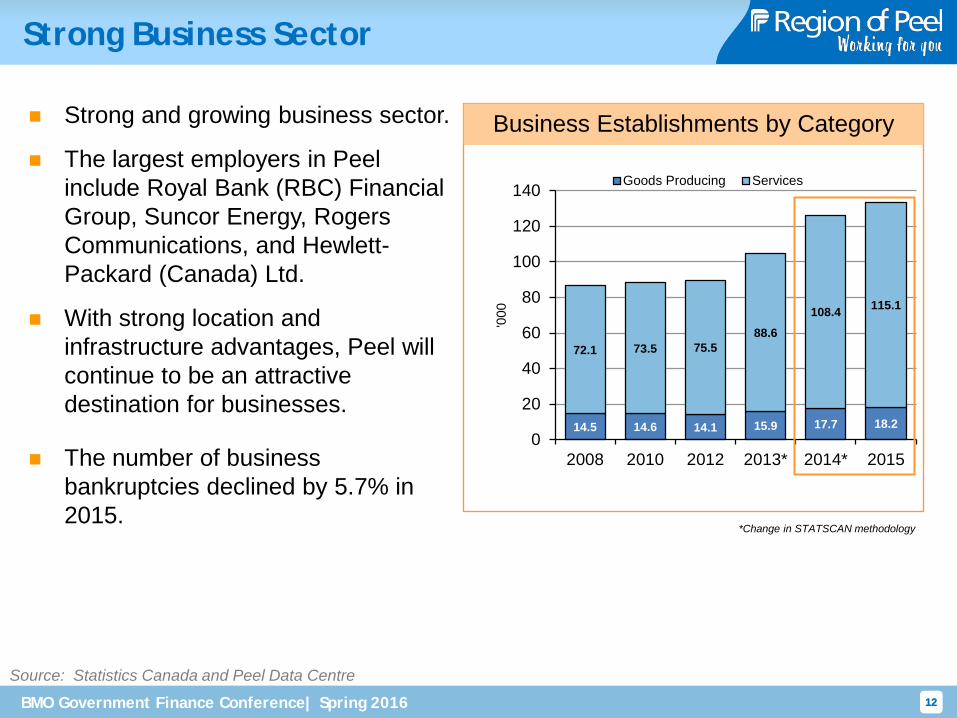
Strong and growing business sector.
The largest employers in Peel include Royal Bank (RBC) Financial Group, Suncor Energy, Rogers Communications, and Hewlett-Packard (Canada) Ltd.
With strong location and infrastructure advantages, Peel will continue to be an attractive destination for businesses.
The number of business bankruptcies declined by 5.7% in 2015.
Source: Statistics Canada and Peel Data Centre
Business Establishments by Category
14.5 14.6 14.1 15.9 17.7 18.2
72.1 73.5 75.5 88.6
108.4 115.1
0
20
40
60
80
100
120
140
2008 2010 2012 2013* 2014* 2015
'000
Goods Producing Services
*Change in STATSCAN methodology
BMO Government Finance Conference| Spring 2016 13
Housing Market
13
Source: Statistics Canada and Peel Data Centre
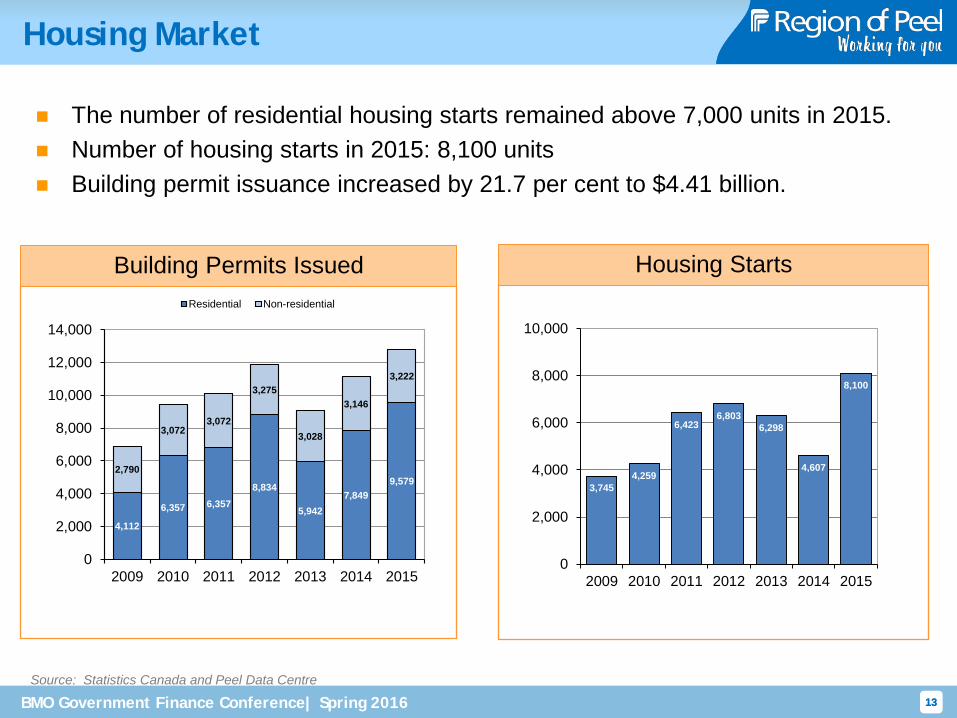
Building Permits Issued
The number of residential housing starts remained above 7,000 units in 2015. Number of housing starts in 2015: 8,100 units Building permit issuance increased by 21.7 per cent to $4.41 billion.
4,112
6,357 6,357 8,834
5,942 7,849
9,579 2,790
3,072 3,072
3,275
3,028
3,146
3,222
0
2,000
4,000
6,000
8,000
10,000
12,000
14,000
2009 2010 2011 2012 2013 2014 2015
Residential Non-residential
Housing Starts
3,745 4,259
6,423 6,803
6,298
4,607
8,100
0
2,000
4,000
6,000
8,000
10,000
2009 2010 2011 2012 2013 2014 2015
BMO Government Finance Conference| Spring 2016 14
Sustained Growth in Assessment
14
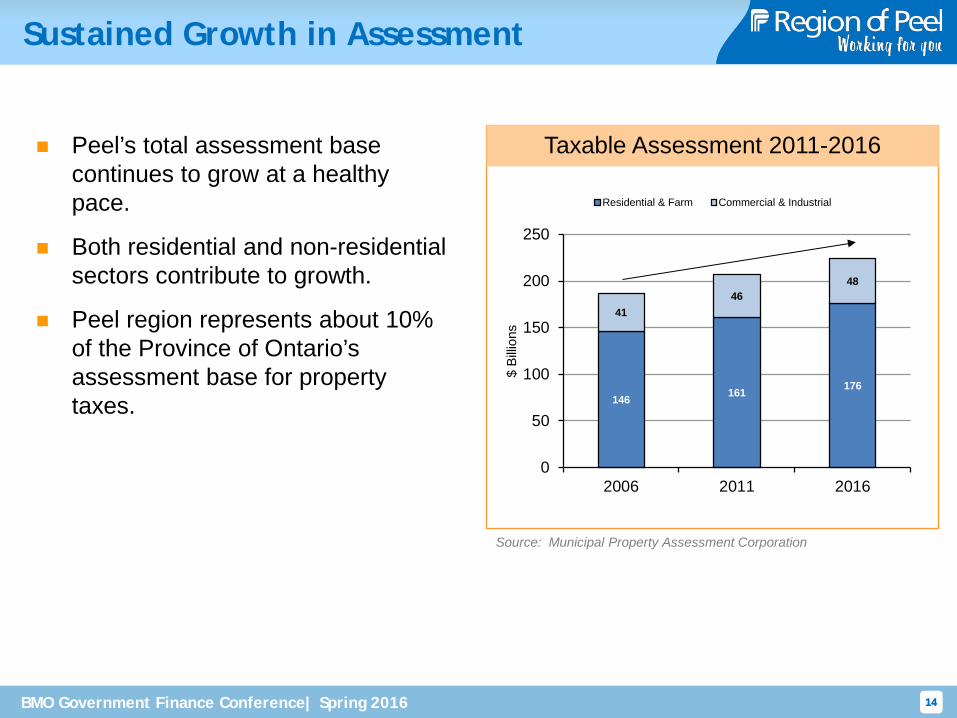
Peel’s total assessment base continues to grow at a healthy pace.
Both residential and non-residential sectors contribute to growth.
Peel region represents about 10% of the Province of Ontario’s assessment base for property taxes.
Taxable Assessment 2011-2016
146 161 176
41 46
48
0
50
100
150
200
250
2006 2011 2016$
Billio
ns
Residential & Farm Commercial & Industrial
Source: Municipal Property Assessment Corporation
BMO Government Finance Conference| Spring 2016 15
Planning Financial Sustainability
Council and Management Actions
Long-term Financial Planning Strategy Term of Council Priority Includes 10 year operating budget model
Commitment to funding infrastructure replacement from reserves Water/wastewater: 3.5% rate increase for reserves in 2015
Phasing out of directly operated childcare centres More contracted out / private sector servicing Eliminated backlog / waitlist
Development Charges By-law Update 2015 Council directed update in 2014 as the 20% threshold was approached Average 13.8% rate increase adopted effective October 5, 2015 Collection of residential DCs for hard services (97% of DC rate) at subdivision
approval expected to offset $100 million in borrowing Changes to process for next update (2018) to include early consultation with area
municipalities and developers in part to minimize debt
BMO Government Finance Conference| Spring 2016
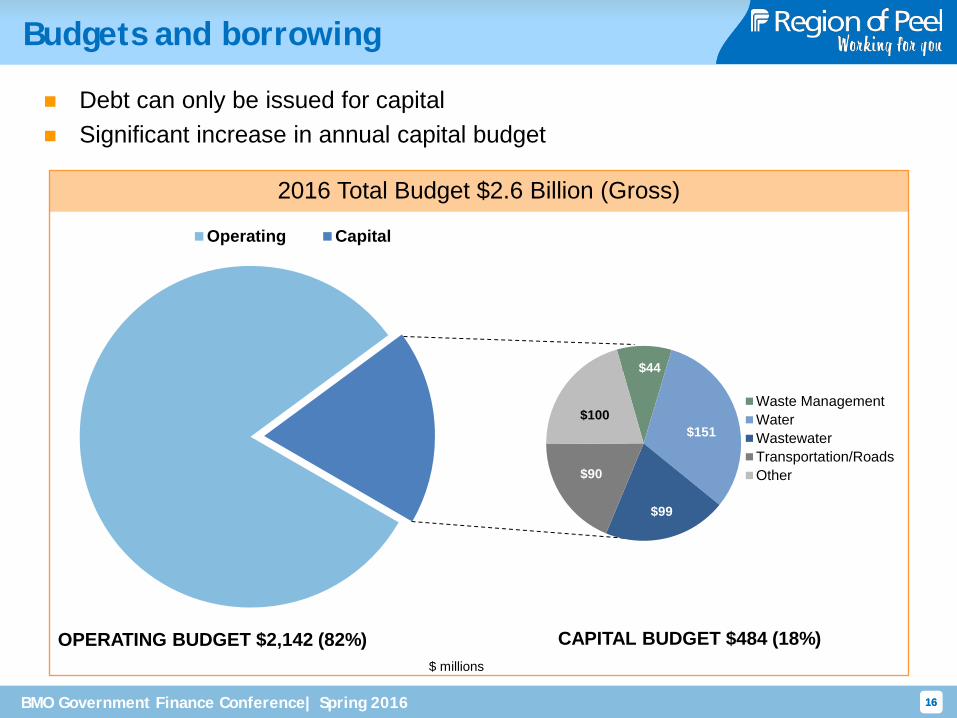
$ millions
CAPITAL BUDGET $484 (18%) OPERATING BUDGET $2,142 (82%)
Operating Capital
$44
$151
$99
$90
$100 Waste ManagementWaterWastewaterTransportation/RoadsOther
16
Budgets and borrowing
16
2016 Total Budget $2.6 Billion (Gross)
Debt can only be issued for capital Significant increase in annual capital budget
BMO Government Finance Conference| Spring 2016 17
Investing in Growth Infrastructure
17
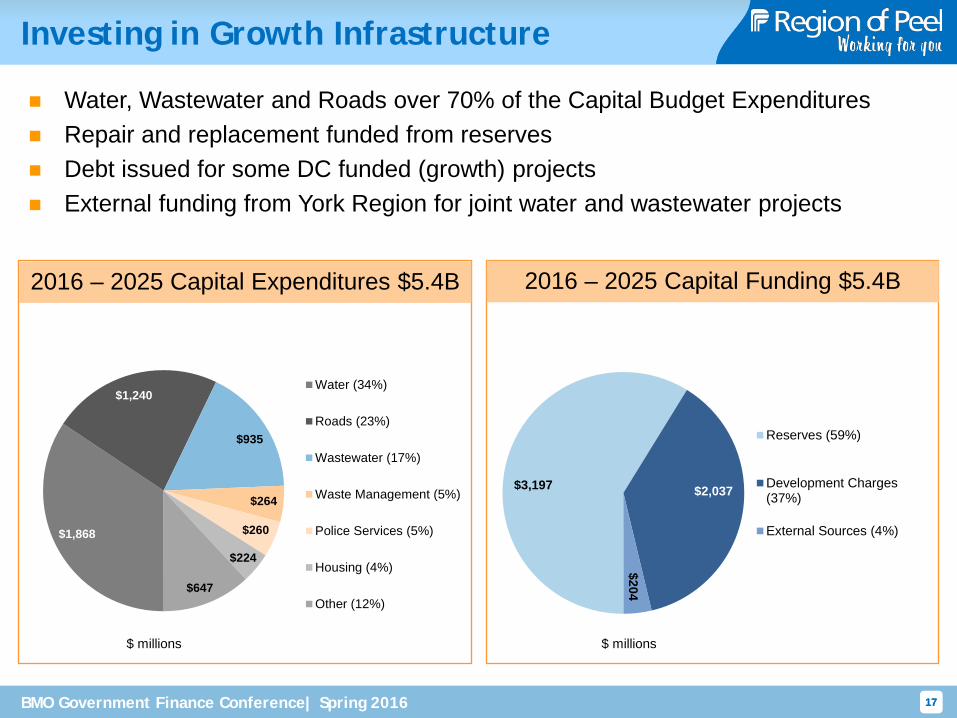
$1,868
$1,240
$935
$264
$260
$224
$647
Water (34%)
Roads (23%)
Wastewater (17%)
Waste Management (5%)
Police Services (5%)
Housing (4%)
Other (12%)
$3,197 $2,037
$204
Reserves (59%)
Development Charges(37%)
External Sources (4%)
$ millions $ millions
Water, Wastewater and Roads over 70% of the Capital Budget Expenditures Repair and replacement funded from reserves Debt issued for some DC funded (growth) projects External funding from York Region for joint water and wastewater projects
2016 – 2025 Capital Funding $5.4B 2016 – 2025 Capital Expenditures $5.4B
BMO Government Finance Conference| Spring 2016 18 18
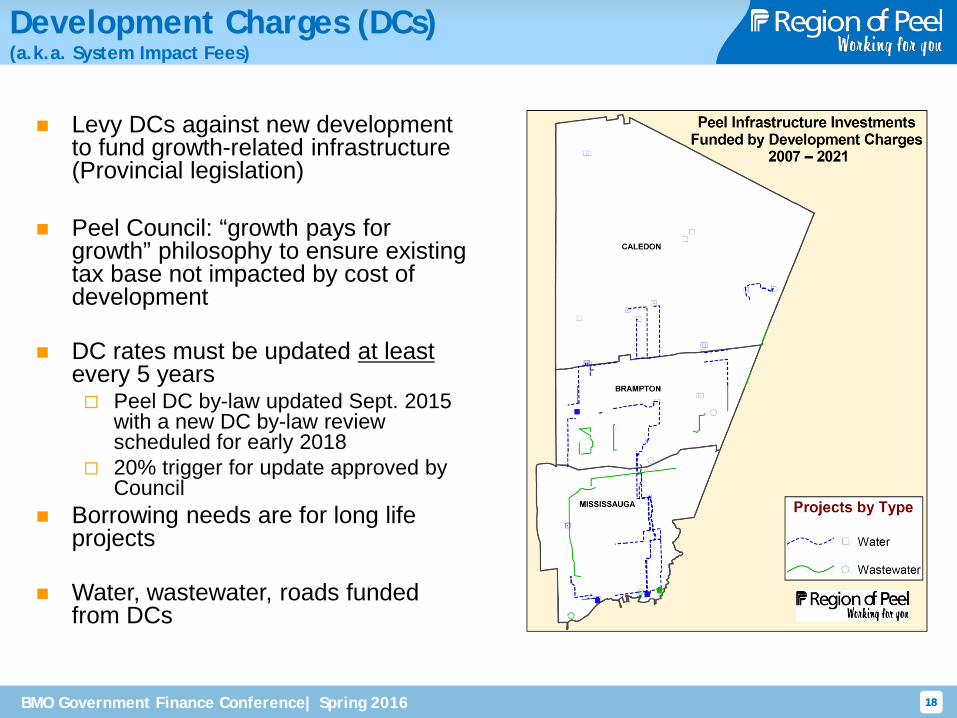
Levy DCs against new development to fund growth-related infrastructure (Provincial legislation)
Peel Council: “growth pays for
growth” philosophy to ensure existing tax base not impacted by cost of development
DC rates must be updated at least every 5 years Peel DC by-law updated Sept. 2015
with a new DC by-law review scheduled for early 2018
20% trigger for update approved by Council
Borrowing needs are for long life projects
Water, wastewater, roads funded from DCs
Development Charges (DCs) (a.k.a. System Impact Fees)
BMO Government Finance Conference| Spring 2016 19
Growth Projects funded with Development Charges
19
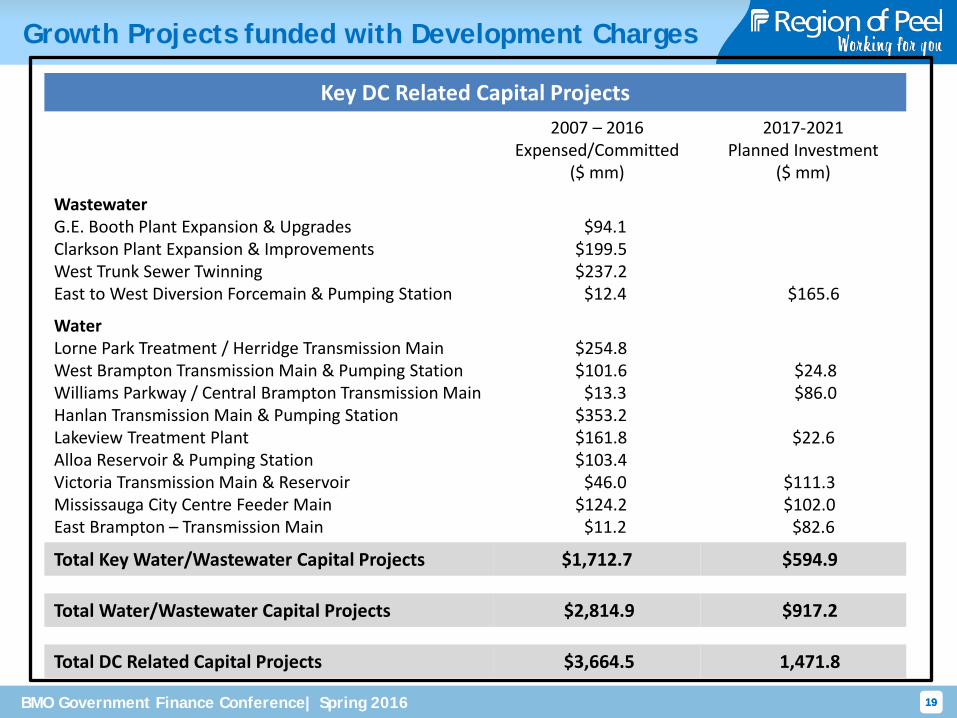
Key DC Related Capital Projects 2007 – 2016
Expensed/Committed ($ mm)
2017-2021 Planned Investment
($ mm)
Wastewater G.E. Booth Plant Expansion & Upgrades Clarkson Plant Expansion & Improvements West Trunk Sewer Twinning East to West Diversion Forcemain & Pumping Station
$94.1 $199.5 $237.2 $12.4
$165.6
Water Lorne Park Treatment / Herridge Transmission Main West Brampton Transmission Main & Pumping Station Williams Parkway / Central Brampton Transmission Main Hanlan Transmission Main & Pumping Station Lakeview Treatment Plant Alloa Reservoir & Pumping Station Victoria Transmission Main & Reservoir Mississauga City Centre Feeder Main East Brampton – Transmission Main
$254.8 $101.6 $13.3 $353.2 $161.8 $103.4 $46.0 $124.2 $11.2
$24.8 $86.0
$22.6
$111.3 $102.0 $82.6
Total Key Water/Wastewater Capital Projects $1,712.7 $594.9
Total Water/Wastewater Capital Projects $2,814.9 $917.2
Total DC Related Capital Projects $3,664.5 1,471.8
BMO Government Finance Conference| Spring 2016 20
Peel’s Competitive Development Charges
20
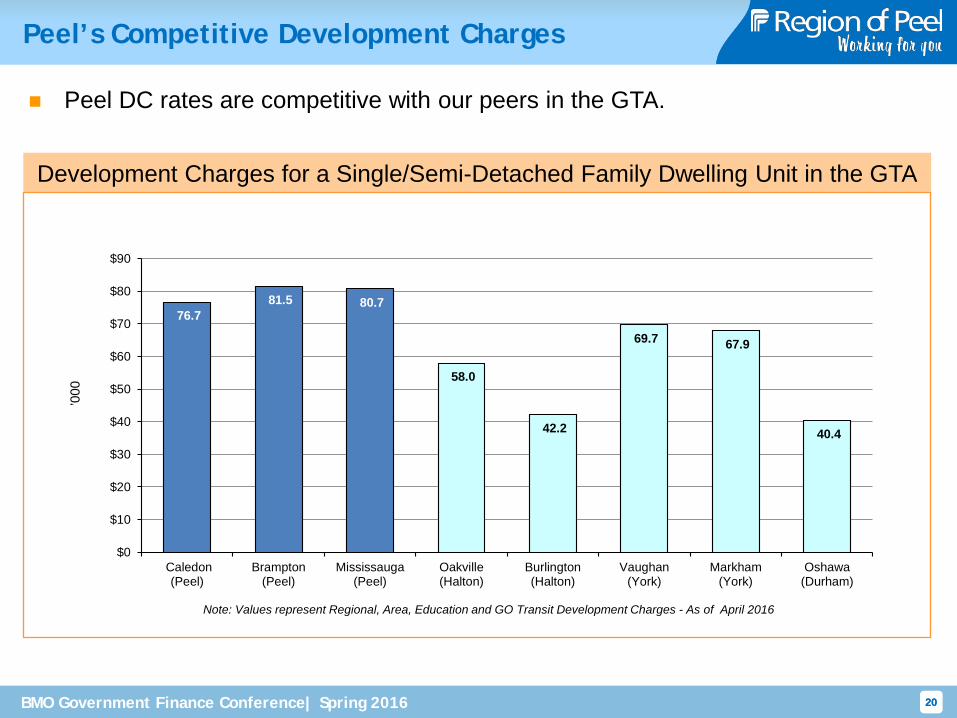
Development Charges for a Single/Semi-Detached Family Dwelling Unit in the GTA
76.7 81.5 80.7
58.0
42.2
69.7 67.9
40.4
$0
$10
$20
$30
$40
$50
$60
$70
$80
$90
Caledon(Peel)
Brampton(Peel)
Mississauga(Peel)
Oakville(Halton)
Burlington(Halton)
Vaughan(York)
Markham(York)
Oshawa(Durham)
Note: Values represent Regional, Area, Education and GO Transit Development Charges - As of April 2016
Peel DC rates are competitive with our peers in the GTA. ’0
00
BMO Government Finance Conference| Spring 2016 21
Peel’s Competitive Development Charges
21
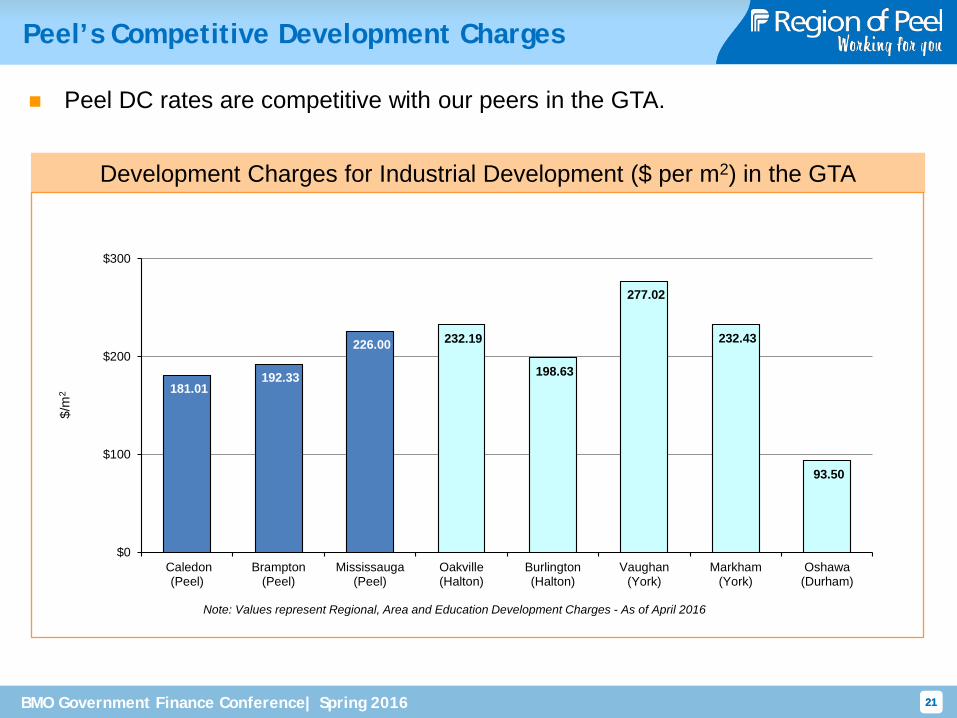
Development Charges for Industrial Development ($ per m2) in the GTA
181.01 192.33
226.00 232.19
198.63
277.02
232.43
93.50
$0
$100
$200
$300
Caledon(Peel)
Brampton(Peel)
Mississauga(Peel)
Oakville(Halton)
Burlington(Halton)
Vaughan(York)
Markham(York)
Oshawa(Durham)
Note: Values represent Regional, Area and Education Development Charges - As of April 2016
Peel DC rates are competitive with our peers in the GTA. $/
m2
BMO Government Finance Conference| Spring 2016 22
Future Development
22
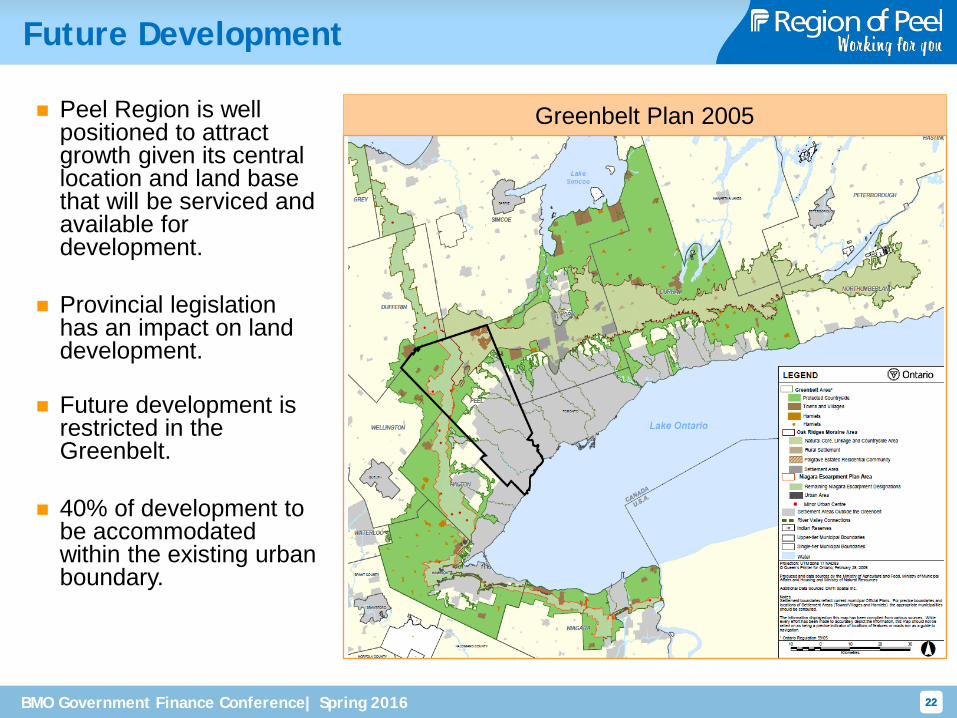
Peel Region is well positioned to attract growth given its central location and land base that will be serviced and available for development.
Provincial legislation has an impact on land development.
Future development is restricted in the Greenbelt.
40% of development to be accommodated within the existing urban boundary.
Greenbelt Plan 2005
BMO Government Finance Conference| Spring 2016 23
$973
$589
$1,001 $1,059 $1,079
$1,020 $1,054
0
200
400
600
800
1,000
1,200
Halton Peel Toronto Vaughan(York)
Richmond Hill(York)
Markham(York)
Durham
$/Ye
ar
23
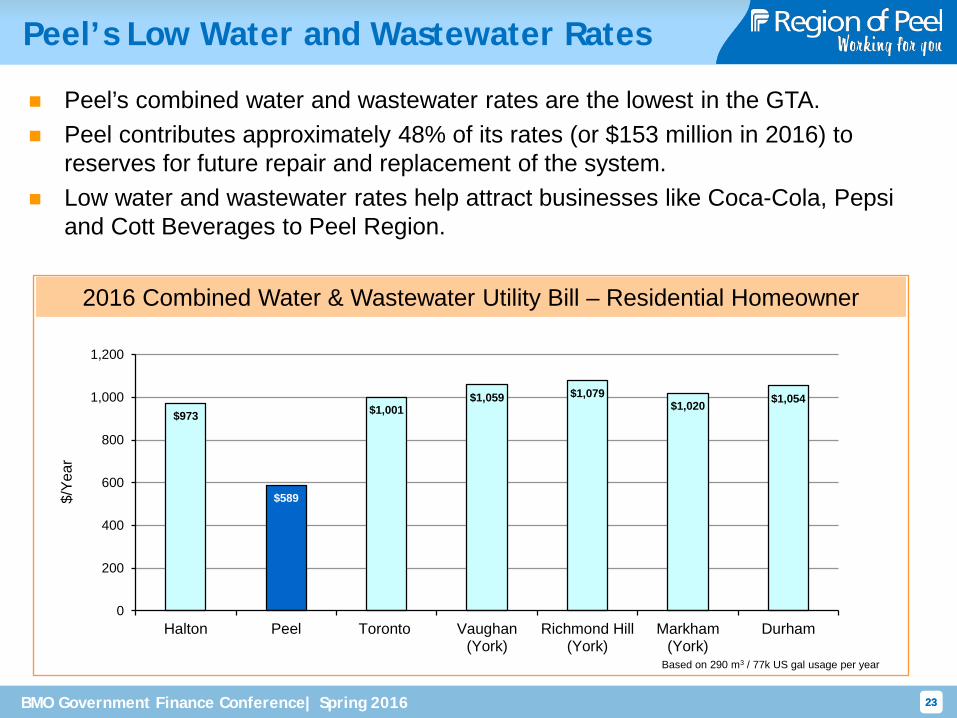
Peel’s Low Water and Wastewater Rates
2016 Combined Water & Wastewater Utility Bill – Residential Homeowner
Peel’s combined water and wastewater rates are the lowest in the GTA. Peel contributes approximately 48% of its rates (or $153 million in 2016) to
reserves for future repair and replacement of the system. Low water and wastewater rates help attract businesses like Coca-Cola, Pepsi
and Cott Beverages to Peel Region.
Based on 290 m3 / 77k US gal usage per year
BMO Government Finance Conference| Spring 2016 24 24
Ontario Municipal Act, 2001 Safeguards
Municipal debentures rank pari passu s.408(7)
Annual budget provisions Debt provision: municipality shall in each year prepare and adopt a
budget including estimates of all sums required during the year including amounts sufficient to pay all debts falling due within the year and amounts required to be raised annually for sinking funds and retirement funds
Balanced budget: budget shall provide that estimated revenues are equal to the estimated expenditures and the municipality will levy taxes sufficient to ensure that this is the case s.289 and 290
Proceeds from the sale of a debenture issue cannot be applied towards the payment of current expenditures s.413(1)
BMO Government Finance Conference| Spring 2016 25 25
Municipal Act, 2001 Safeguards (cont’d)
Debenture by-law cannot be repealed until the debt and interest have been paid s.414(1)
Doctrine of ultra vires Municipalities only have borrowing powers which are expressly set out in
legislation s.s. 9 and 17
Municipal officer guilty of an offense Any municipal officer who refuses to perform his or her duty to ensure that
all the obligations of their municipality’s debenture by-law are fulfilled is guilty of an offence s.422
Liability of members of council for diversion of funds Any member of Council who votes to divert funds to pay current
expenditures – funds that were originally raised to retire debt is personally liable for the misapplied funds and is disqualified from holding any municipal office for two years s.s. 424
BMO Government Finance Conference| Spring 2016 26 26
Strong Credit Rating
Long Range Financial Planning Strategy endorsed by Council commits to maintaining a strong credit rating S&P “AAA” since 2001
Moody’s “Aaa” since 2011
Large, highly liquid investments of $2.1B (as of April 30, 2016)
BMO Government Finance Conference| Spring 2016 27 27
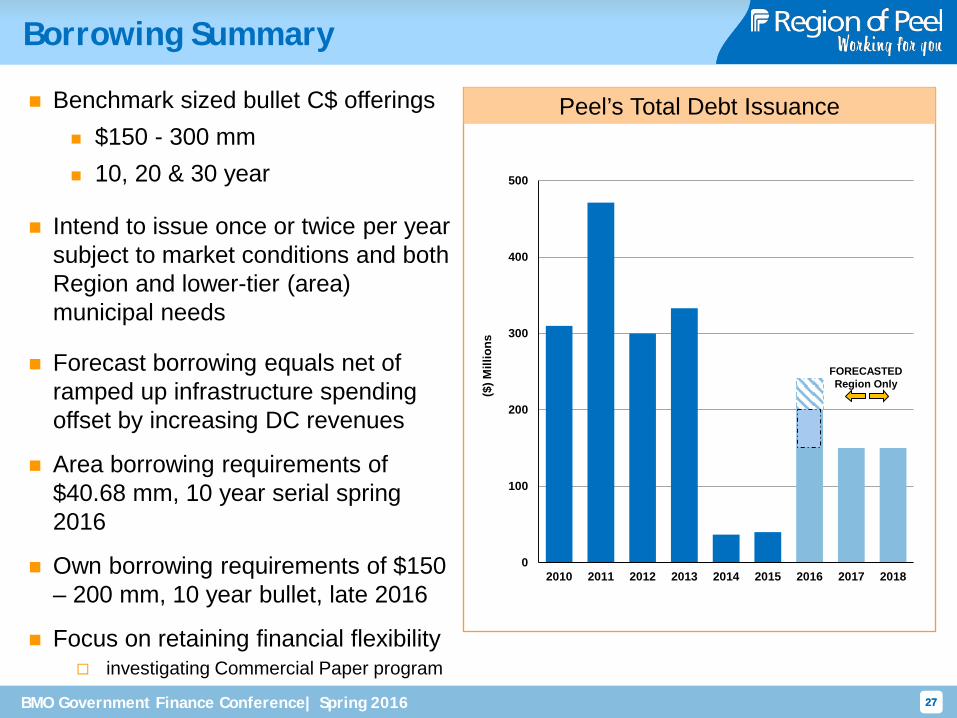
Borrowing Summary
Benchmark sized bullet C$ offerings $150 - 300 mm 10, 20 & 30 year
Intend to issue once or twice per year subject to market conditions and both Region and lower-tier (area) municipal needs
Forecast borrowing equals net of ramped up infrastructure spending offset by increasing DC revenues
Area borrowing requirements of $40.68 mm, 10 year serial spring 2016
Own borrowing requirements of $150 – 200 mm, 10 year bullet, late 2016
Focus on retaining financial flexibility investigating Commercial Paper program
Peel’s Total Debt Issuance
0
100
200
300
400
500
2010 2011 2012 2013 2014 2015 2016 2017 2018
($) M
illio
ns
FORECASTED Region Only
BMO Government Finance Conference| Spring 2016 28 28
Summary
Additional $1.1 billion forecasted to 2031 in Region’s 2015 DC background study primarily for long term expansion of water, wastewater and roads systems
DC’s collected to fund these system investments as development built
Water and Wastewater rates lowest in GTA Peel also issuing for Area municipalities
All Peel debt is general obligation
Strong liquidity ($2.1B) and high credit ratings (S&P AAA, Moodys Aaa)
Strong and diversified Peel economy
peelregion.ca/investors
BMO Government Finance Conference| Spring 2016 29 29
More Information
Paul Pohl, BComm.
Senior Treasury and Portfolio Manager
Finance 10 Peel Centre Drive, Suite A, 2nd Floor Brampton, ON L6T 4B9 Tel: 905-791-7800 ext. 4599 Fax:905-791-0564 [email protected] peelregion.ca/investors
Dave Bingham, MBA, CPA, CMA
Treasurer & Director Corporate Finance
Finance 10 Peel Centre Drive, Suite A, 2nd Floor Brampton, ON L6T 4B9 Tel: 905-791-7800 ext. 4292 Fax:905-791-0564 [email protected] peelregion.ca/investors
Updated information including:
credit rating reports financial statements budget tax and water/wastewater rates development charges peelregion.ca/investors
Peel Investor website