Embed Size (px)
Citation preview


Regional Analysis of the Philippine Services Sector
Ramonette B. Serafica, Jean Colleen M. Vergara,
and Queen Cel A. Oren
Research Paper Series No. 2021-04
Philippine Institute for Development StudiesSurian sa mga Pag-aaral Pangkaunlaran ng Pilipinas

Copyright 2021
Published byPhilippine Institute for Development Studies
Printed in the Philippines. Some rights reserved.
The views expressed in this paper are those of the authors and do not necessarily reflect the views of any individual or organization.
Please address all inquiries to:
Philippine Institute for Development Studies18th Floor, Three Cyberpod Centris - North TowerEDSA corner Quezon Avenue, 1100 Quezon CityTelephone: (63-2) 8877-4000Fax: (63-2) 8877-4099E-mail: [email protected]: https://www.pids.gov.ph
This research paper is under the Creative Commons Attribution Noncommercial License. It shall not be used for commercial purposes. Anyone can use, reuse, distribute, and build upon this material as long as proper attribution is made.
ISSN 1908-3297ISSN 2508-0830 (electronic)RP 05-21-600
Editorial and production team: Sheila V. Siar, Gizelle G. Manuel, and Maryam P. Tubio

iii
v ixxi
1
Table of Contents
List of tables and figuresList of acronyms Abstract Introduction Overview of services 3
Significance of services in the economy 3 The classification of services 7
The Philippine services sector 10 Overall regional trends and patterns 10 Shift-share analysis 13
Methodology 13Review of methodology 14
Application 17Description of data 17Results of shift-share decomposition 22
Harnessing services for regional development 35National Capital Region (NCR) 38Cordillera Administrative Region 43Ilocos (Region I) 43Cagayan Valley (Region II) 44Central Luzon (Region III) 45CALABARZON (Region IVA) 45MIMAROPA (Region IVB) 46Bicol (Region V) 47Western Visayas (Region VI) 47Central Visayas (Region VII) 48Eastern Visayas (Region VIII) 49Zamboanga Peninsula (Region IX) 49Northern Mindanao (Region X) 50Davao (Region XI) 50SOCCSKSARGEN (Region XII) 51Caraga (Region XIII) 52Autonomous Region in Muslim Mindanao (ARMM) 52
Conclusion 53 References 55The Authors 61


v
List of Tables and Figures
Table
1 SDGs and the role of services 22 Significance of services in the economy 4 3 Employment in services by sex (2018) 4 4 Business services as part of producer services 95 Summary of KIBS activities 9 6 Regional indicators (2018) 117 Gross value added in services by region (2018) 138 Total employment in services subsectors 199 Change in total employment in services by sector 20 and region (2012–2018)10 Change in total employment in services 21 by sector and region (2012–2018) (%)11 Total change in employment and shift-share 23 decomposition for Sector G: Wholesale and retail trade; repair of motor vehicles and motorcycles; and personal and household goods12 Total change in employment and shift-share 24 decomposition for Sector H: Transportation and storage13 Total change in employment and shift-share 26 decomposition for Sector J: Information and communication14 Total change in employment and shift-share 27 decomposition for Sector K: Financial and insurance activities15 Total change in employment and shift-share 28 decomposition for Sector L: Real estate activities16 Total change in employment and shift-share 29 decomposition for Sector M: Professional, scientific, and technical activities17 Total change in employment and shift-share 31 decomposition for Sector N: Administrative and support service activities

vi
18 Total change in employment and shift-share 32 decomposition for Sector I: Accommodation and food service activities19 Total change in employment and shift-share 33 decomposition for Sector R: Arts, entertainment and recreation20 Total change in employment and shift-share 34 decomposition for Sector S: Other service activities21 Total change in employment and shift-share 36 decomposition for Sector P: Education22 Total change in employment and shift-share 37 decomposition for Sector Q: Human health and social work activitiesFigure
1 Services value-added as a share of GDP (%) 5 2 Employment in services (% of total employment) 5 (modeled ILO estimate)3 Share of GDP and population by region (%) 12 4 Share of the services sector in GDP/GRDP 12 at current prices (%) 5 Share of services sector in total employment (%) 18 6 Total change in employment with its components 23 for Sector G: Wholesale and retail trade; repair of motor vehicles and motorcycles; and personal and household goods7 Total change in employment with its components 24 for Sector H: Transportation and storage8 Total change in employment with its components 26 for Sector J: Information and communication9 Total change in employment with its components 27 for Sector K: Financial and insurance activities10 Total change in employment with its components 28 for Sector L: Real estate activities11 Total change in employment with its components 29 for Sector M: Professional, scientific, and technical activities

vii
12 Total change in employment with its components 31 for Sector N: Administrative and support service activities13 Total change in employment with its components 32 for Sector I: Accommodation and food service activities14 Total change in employment with its components 33 for Sector R: Arts, entertainment, and recreation15 Total change in employment with its components 34 for Sector S: Other service activities16 Total change in employment with its components 36 for Sector P: Education17 Total change in employment with its components 37 for Sector Q: Human health and social work activities18 Employment in services and GRDP 3919 Employment in services and poverty incidence 41

ix
AEC actual economic change ARMM Autonomous Region in Muslim Mindanao BLISTT Benguet, La Trinidad, Itogon, Sablan, Tuba,
and TublayBPO business process outsourcingCALABARZON Cavite, Laguna, Batangas, Rizal, and QuezonCAR Cordillera Administrative RegionDIP digital intermediation platform GDP gross domestic product GRDP gross regional domestic product IM industry mix ICT information and communications technology ISIC International Standard Industrial Classification KIBS knowledge-intensive business services LFS Labor Force Survey MIMAROPA Mindoro, Marinduque, Romblon, and Palawan MFP multifactor partitioning NCR National Capital Region NEDA National Economic and Development AuthorityNEDA RO NEDA Regional OfficeNS national share OECD Organisation for Economic Co-operation
and Development ONS Office of National StatisticsPIDS Philippine Institute for Development StudiesPSIC Philippine Standard Industrial Classification RS regional shift R&D research and development
List of Acronyms

x
SOCCSKSARGEN South Cotabato, Cotabato, Sultan Kudarat,Sarangani, and General Santos
SDG Sustainable Development GoalTEC total economic changeUNCTAD United Nations Conference on Trade
and DevelopmentUP University of the Philippines

xi
Abstract
The services sector is composed of a diverse range of services, including retail and business services, education, and health, among others. Some services are used as inputs in production, while others have direct impacts on human capital development.
In the Philippines, the services sector accounts for 60 percent of gross domestic product and almost 57 percent of employment. Across regions and subsectors, however, the contribution of services varies. Using a simple shift-share technique, this study examines the patterns at the regional and subsector level and decomposes the changes into three factors: national share (growth effect), industry mix (sectoral effect), and regional shift (competitive effect).
Focusing on changes in employment, the shift-share decomposition reveals that the overall growth of the economy from 2012 to 2018 had a positive impact in all sectors and regions. However, some industries showed negative sectoral effects, namely, accommodation and food service activities; arts, entertainment, and recreation; and education. Industry-specific factors in education services were quite strong that the economy’s dynamism failed to offset the industry mix effect. It was the only sector that registered lower total employment during the period. In terms of the regional shift effects, 109 out of the total 204 regional service industries (53%) displayed locational disadvantages.
Shift-share is a purely descriptive tool, and further analysis must be done to explain the factors that influence sectoral changes and a region’s economic potential and constraints. As services are critical for production, human capital development, and, more broadly, in the enhancement of the quality of life, understanding the drivers or inhibitors of services growth and addressing the locational weaknesses in the relevant service industries will be useful in promoting growth in the region and a more balanced economic development for the country.


Introduction
The services sector is composed of a diverse range of industries, including retail and business services, education, and health, among others.2 Some services are used as inputs in production, while others have direct impacts on human capital development. With transport, energy, financial services, telecommunication, and information and communications technology (ICT) services sectors playing a critical role in development, the United Nations Conference on Trade and Development (UNCTAD 2017) claims that achieving the 2030 Agenda for Sustainable Development is to a great degree a services agenda. Fiorini and Hoekman (2018) mapped out some of the connections between services and the Sustainable Development Goals (SDGs) (Table 1). They noted that 11 of the 17 SDGs explicitly refer to (or imply) at least one distinct service sector as a means of attaining the particular goal. Moreover, services are also relevant for SDGs that do not explicitly refer to services. For example, the services sector plays an important role in gender equality (SDG 5) as it offers greater opportunities for employment and empowerment for women.
There is a common perception that the Philippines is a services economy because of the significant contribution of the sector. In 2018, services accounted for 60 percent of the country’s gross domestic product (GDP) and almost 57 percent in terms of share in employment. At the regional level, however, the share of services in the gross regional domestic product (GRDP) ranged from 84.5 percent in the National Capital Region (NCR) to 36 percent in Autonomous Region in Muslim Mindanao (ARMM). In terms of spatial distribution, more than 50 percent of total services value-added came from NCR.
Given that the role of services varies across regions, a deeper understanding of services development in the different subsectors is needed. According to Cuadrado-Roura (2016), regional analysis is useful as sectoral changes in services determine a higher or lower growth capacity for regions. Moreover, the evolution of some specific service activities can explain both the modernization processes of some regions and the existing and potential socioeconomic dynamics operating between them. In the Philippines, some regions have grown faster than others. Identifying possible factors that led to these differences in productivity
1 In this paper, sector, industry, and subsector are used interchangeably.
1

2
Regional Analysis of the Philippine Services Sector
Table 1. Sustainable Development Goals and the role of servicesSustainable Development Goals Services Sector and Activity
Goal 1: End poverty in all its forms everywhere
Health services (basic services)Education services (basic services)Sanitation services (basic services)Financial services (microfinance)ICT services (new technology)
Goal 2: End hunger, achieve food security and improved nutrition, and promote sustainable agriculture
Financial servicesR&D services (seeds, climate resistance)
Goal 3: Ensure healthy lives and promote well-being for all at all ages
Health services/sexual and reproductive health servicesFinancial services (Financial risk protection)R&D services (R&D of vaccines and medicines)
Goal 4: Ensure inclusive and equitable quality education and promote lifelong learning opportunities for all
Education services (preprimary/primary/secondary/vocational/tertiary education)
Goal 6: Ensure availability and sustainable management of water and sanitation for all
Sanitation servicesWater services (drinking water/water
quality/water use and management)Goal 7: Ensure access to affordable, reliable, sustainable, and modern energy for all
Energy services (distribution of energy)
Goal 8: Promote sustained, inclusive, and sustainable economic growth, full and productive employment, and decent work for all
Financial servicesR&D services (technological innovation)Tourism (sustainable tourism)
Goal 9: Build resilient infrastructure, promote inclusive and sustainable industrialization, and foster innovation
Financial servicesR&D services (scientific research/technological capabilities/innovation/R&D workers)Transport services (infrastructure)Construction services (infrastructure)
Goal 10: Reduce inequality within and among countries
Transport services (transport systems/public transport)
Goal 11: Make cities and human settlements inclusive, safe, resilient, and sustainable
Waste management services (waste management)
Goal 12: Ensure sustainable consumption and production patterns
Waste management services (recycling/reuse)
ICT = information and communications technology; R&D = research and developmentSource: Adapted from Fiorini and Hoekman (2018)

3
Overview of Services
would be beneficial in promoting regional development, especially for the lagging regions (Manasan and Mercado 1999). Additionally, Chapter 9 of the Philippine Development Plan 2017–2022 on “Expanding Economic Opportunities in Industry and Services through Trabaho at Negosyo” aims to develop high value-added, competitive, and sustainable sectors to transform the economy and achieve broad-based growth.
Overview of services
Significance of services in the economy
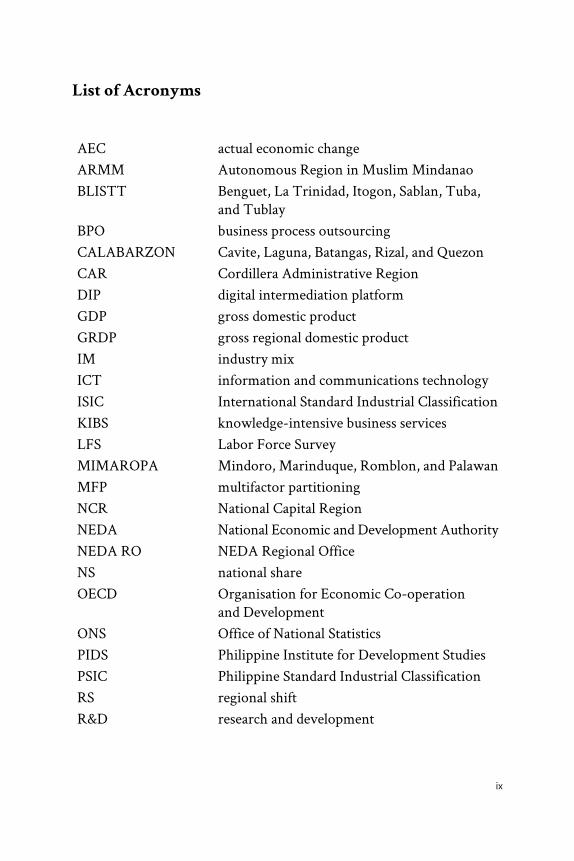
The services sector accounts for a large share of the economy not only in advanced countries but also across different income groups (Table 2). Services are so crucial to industries, such as agriculture and manufacturing, and all other economic and social activities, such that an inefficient service sector is like a prohibitive tax on a national economy (UNCTAD 2004). Services are embodied in goods production, either as inputs (e.g., design, marketing, or distribution costs included in the value of a good) or as trade enablers (e.g., logistics services or e-commerce platforms). Thus, the productivity of the services sector will be increasingly important in determining the feasibility of manufacturing-led development (Hallward-Driemeier and Nayyar 2018).
Services also account for the largest share of employment for both female and male workers, particularly in high-income countries. In the Philippines, 3 out of 4 female workers are absorbed in the services sector (Table 3). Employment patterns in the service sectors are remarkably diverse. A wide range of skill intensities from low-skilled jobs, in retail and personal services, to high-skilled jobs, in professional, scientific, and technical activities, was observed. There are also sectors, such as transport and communications, which closely resemble parts of manufacturing with employment dominated by full-time male employees. In retailing or hotels and catering, many jobs are filled by part-time or casual labor, predominantly female holding basic positions (on-the-job training) with a few highly trained professionals holding key positions (Begg 1993).
Over time, services tend to assume a greater role in the economy in terms of both value-added and employment (Figures 1 and 2).
4
Regional Analysis of the Philippine Services Sector
Table 2. Significance of services in the economy
GDP = gross domestic productNotes: 1 The services sector includes wholesale and retail trade and restaurants and hotels; transport, storage, and communications; financing, insurance, real estate, and business services; and community, social, and personal services, in accordance with divisions 6–9 (International Standard Industrial Classification [ISIC] 2) or categories G–Q (ISIC 3) or categories G–U (ISIC 4). 2 Employment is defined as persons of working age who are engaged in any activity to produce goods or provide services for pay or profit, whether at work during the reference period or not at work due to temporary absence from a job or working-time arrangement. These figures are based on modeled estimates from the International Labour Organization.Source: World Bank (n.d.)
Country/GroupingServices1, Value-added
(% of GDP)2016
Employment in Services2
(% of Total Employment)2018
World 65.04 51.71
Low-income 40.79 22.32
Middle-income 54.07 49.75
- Lower-middle 49.44 40.11
- Upper-middle 55.45 58.68
High-income 69.61 74.44
Philippines 59.60 56.84
Table 3. Employment in services by sex (2018)
Country/Grouping Female Employment (%) Male Employment (%)
World 58.21 47.56Low income 22.01 22.58Middle income 55.17 46.56
- Lower middle 41.21 39.60
- Upper middle 64.92 54.16
High income 87.47 64.32Philippines 74.19 45.35
Source: World Bank (n.d.)
The increasing share of services in the economy has been attributed to various factors (Schettkat and Yocarini 2003; Cuadrado-Roura 2013, 2016). One explanation for the higher employment in services is the shift in the structure of final demand from goods to services due to higher incomes following Engel’s law. Other drivers that influence the changes

5
Overview of Services
Figure 1. Services value-added as a share of GDP (%)
GDP = gross domestic product; WLD = world; LIC = low-income countries; MIC = middle-income countries; LMC = lower-middle-income countries; UMC= upper-middle-income countries; HIC = high-income countries; and PHL = PhilippinesSource: World Bank (n.d.)
ILO = International Labour Organization; WLD = world; LIC = low-income countries; MIC = middle-income countries; LMC = lower-middle-income countries; UMC= upper-middle-income countries; HIC = high-income countries; and PHL = PhilippinesSource: World Bank (n.d.)
Figure 2. Employment in services (% of total employment) (modeled ILO estimate)

6
Regional Analysis of the Philippine Services Sector
in the structure of household expenditures, such as urbanization, increase in labor force participation of women, and other demographic changes, also come into play.
The interindustrial demand for services in manufacturing, which is linked to outsourcing processes, is another factor. Increased use for services in the goods sector and other service industries has driven the demand. Servicification, a process where nonservices sectors in the economy (1) buy and produce and (2) sell and export more services than before, often as a package deal with the good, have been on the rise (National Board of Trade 2012, 2013). Pasadilla and Liao (2007) and Serafica (2016), for instance, examined the role of services in manufacturing production and trade in the case of the Philippines. Unlike other countries, the contribution of services to growth in manufacturing decreased from the 1980s to the 1990s (Pasadilla and Liao 2007). Moreover, the share of services embodied in Philippine manufacturing exports is among the lowest in the region (Serafica 2016).
Finally, rising international trade-in services and services demand in the government also contribute to the growth of the services sector.
On the supply side, interindustry productivity differentials between manufacturing and services, with the former enjoying higher productivity (in terms of both level and growth), have been cited as the reason for increased employment in services. Another factor explaining services growth from the supply side includes the nonmarket services produced by public administrations linked to welfare state development. Finally, innovations in the ICT sector are also either driving the creation of new services or transforming traditional services.
UNCTAD (2017) notes that the simple structural transformation model characterized by a steady progression from agriculture to manufacturing followed by services no longer holds. The main challenge for countries is how the services sector will be promoted to create exports and jobs in the sector (as escalator sector) while supporting other sectors in the economy. In this way, the services sector does not end up absorbing the low-skilled workers with few prospects, a phenomenon associated with premature deindustrialization.

7
Overview of Services
The classification of services
According to Schettkat and Yocarini (2003), a number of studies have attempted to develop a better understanding of the expansion of service employment by regrouping or reclassifying service industries. The rationale behind the reclassification is that service demand is related to the purpose of a service (consumer vs. business services) or the form of its provision (market/private vs. public provision). The information and knowledge content of different services has also been considered to influence the economic effects of expanding employment in services.
Browning and Singelmann (1975) proposed a six-sector classification of industries which they believe provide a more meaningful representation of services, unlike the Fisher-Clark tripartite division of labor, which only divides the industries into three sectors: primary sector (agriculture, mining, fishing, forestry), secondary sector (manufacturing, construction, and utilities), and tertiary sector (transportation, commerce, and services). The six sectors include the following sectors:
1. Extractive (identical with primary sector)2. Transformative (identical with secondary sector)3. Distributive services (transportation, communication, wholesale
and retail trade, except eating and drinking)4. Producer services (financial, insurance, engineering, law, and
business services)5. Social services (health, education, welfare, and government)6. Personal services (domestic, lodging, repair, and entertainment)
Distributive and producer services are goods-oriented services since they cater to goods or matters related to property. Moreover, they are intermediate between the first two “production” sectors and the last two “consumption” sectors. Social services are such because their industries partly depend on government revenues to operate. Finally, personal services are more heterogeneous, although a common characteristic is an orientation to the individual consumer.
Scharpf (1990), as cited in Schettkat and Yocarini (2003), classified services into two broad groups—producer and consumer services. Producer services include transport, storage, communication, finance, insurance, real estate, and business services. On the other hand, consumer services include trade (retail), restaurants and hotels, community, social,

8
Regional Analysis of the Philippine Services Sector
and personal services. Business services cover a wide range of industries, from the relatively unsophisticated or routinary, such as industrial cleaning services, to the more sophisticated knowledge-intensive services needed for research and development (R&D) and innovation. Table 4 from Rubalcaba and Kox (2007) lists various business and business-related services. In this classification, distributive services, as defined by Browning and Singelmann (1975), are subsumed under producer services.
Within business services, there are also knowledge-intensive business services (KIBS) (Table 5).
In the latest International Standard Industrial Classification (ISIC) Revision 4, where the 2009 Philippine Standard Industrial Classification (PSIC) is based, the following are considered part of the services sector:
• Section G. Wholesale and retail trade; repair of motor vehicles and motorcycles
• Section H. Transportation and storage • Section I. Accommodation and food service activities • Section J. Information and communication • Section K. Financial and insurance activities • Section L. Real estate activities • Section M. Professional, scientific, and technical activities • Section N. Administrative and support service activities • Section O. Public administration and defense and compulsory
social security • Section P. Education • Section Q. Human health and social work activities • Section R. Arts, entertainment, and recreation • Section S. Other service activities
Other sectors also have a services component, for example: • Section D. Electricity, gas, steam, and air conditioning supply; • Section E. Water supply; sewerage, waste management, and
remediation activities; and Section F. Construction • Section A. Agriculture, Forestry, and Fishing
- Division 01 Group 016 Support activities to agriculture and postharvest crop activities
- Class 0170 Hunting, trapping, and related service activities

9
Table 4. Business Services as part of producer services
Source: Rubalcaba and Kox (2007) as cited in Rubalcaba (2013, p. 273)
Prod
ucer
ser
vice
s
Busin
ess-
rela
ted
serv
ices
Busin
ess
serv
ices
Know
ledg
e-in
tens
ive
busin
ess
serv
ices
(KIB
S)
Software and computer servicesStrategy and management consultancyAccountancy, tax, and legal adviceMarketing services and opinion pollingTechnical services and engineeringPersonal training and headhunting
Ope
ratio
nal
busin
ess
serv
ices
Security services Facility management, cleaning Administration bookkeeping Temporary labor recruitment Other operational services (e.g., catering, photography, translating, call centers
Distribution and trade servicesTransport and logisticsBanking, insurance, and stock exchangeTelecommunication and couriersEnergy services
Consumer services, partly used by enterprises (business travel, company health services, and social insurance services)
Table 5. Summary of activities under knowledge-intensive business services
Computing and related activities
Hardware consultancySoftware consultancy and supplyData processingDatabase activitiesMaintenance and repair of office, accounting, and
computing machineryOther computer-related activities
R&D Research and experimental development on natural sciences and engineering
Research and experimental development on social sciences and humanities
Other business activities
Legal activitiesAccountingMarket researchBusiness and management consultancyArchitectural and engineering activitiesTechnical testing and analysisAdvertisingLabor recruitment
Source: Huggins (2011, p. 1462)
Overview of Services
10
Regional Analysis of the Philippine Services Sector
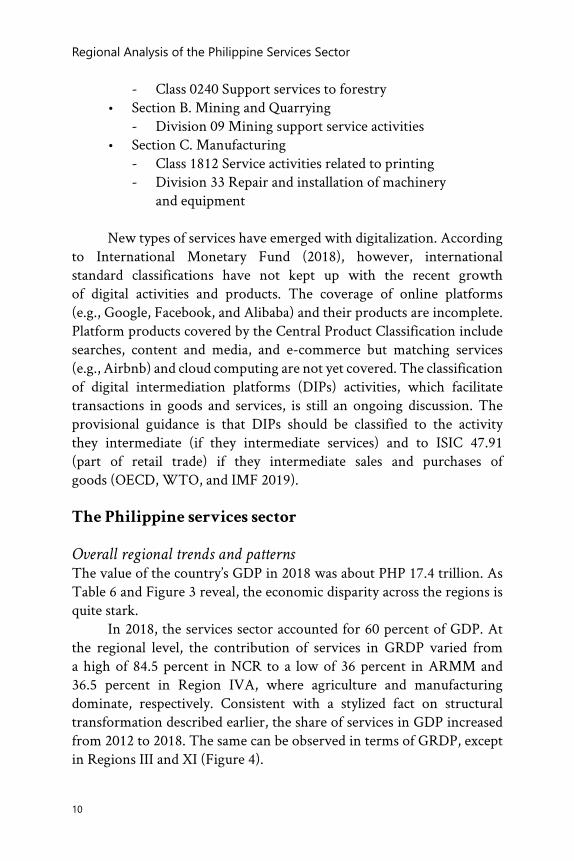
- Class 0240 Support services to forestry • Section B. Mining and Quarrying
- Division 09 Mining support service activities• Section C. Manufacturing
- Class 1812 Service activities related to printing - Division 33 Repair and installation of machinery
and equipment
New types of services have emerged with digitalization. According to International Monetary Fund (2018), however, international standard classifications have not kept up with the recent growth of digital activities and products. The coverage of online platforms (e.g., Google, Facebook, and Alibaba) and their products are incomplete. Platform products covered by the Central Product Classification include searches, content and media, and e-commerce but matching services (e.g., Airbnb) and cloud computing are not yet covered. The classification of digital intermediation platforms (DIPs) activities, which facilitate transactions in goods and services, is still an ongoing discussion. The provisional guidance is that DIPs should be classified to the activity they intermediate (if they intermediate services) and to ISIC 47.91 (part of retail trade) if they intermediate sales and purchases of goods (OECD, WTO, and IMF 2019).
The Philippine services sector
Overall regional trends and patterns
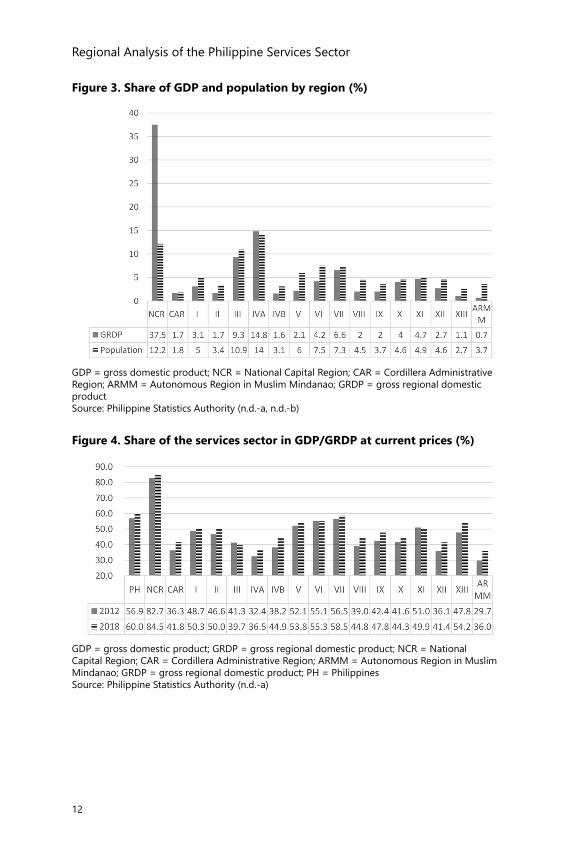
The value of the country’s GDP in 2018 was about PHP 17.4 trillion. As Table 6 and Figure 3 reveal, the economic disparity across the regions is quite stark.
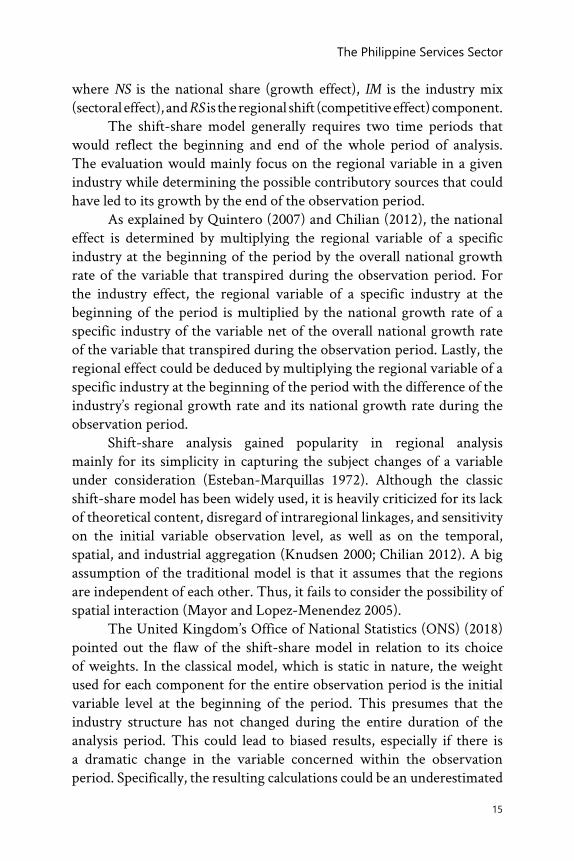
In 2018, the services sector accounted for 60 percent of GDP. At the regional level, the contribution of services in GRDP varied from a high of 84.5 percent in NCR to a low of 36 percent in ARMM and 36.5 percent in Region IVA, where agriculture and manufacturing dominate, respectively. Consistent with a stylized fact on structural transformation described earlier, the share of services in GDP increased from 2012 to 2018. The same can be observed in terms of GRDP, except in Regions III and XI (Figure 4).

Tabl
e 6.
Reg
iona
l ind
icat
ors
(201
8)
Regi
onGR
DP
at C
urre
nt
Pric
es (i
n PH
P bi
llion
)
Popu
latio
n (in
thou
sand
pe
rson
s)
Per C
apita
GRD
P at
Cur
rent
Pric
es
(in P
HP)
Per C
apita
Inde
x w
ith R
efer
ence
to
the
Nat
iona
l Av
erag
e, a
t Cu
rren
t Pric
es
Pove
rty
Inci
denc
e am
ong
Fam
ilies
(%
), Fi
rst
Sem
este
r
PHIL
IPPI
NES
17,4
26
106,
599
163,
475
100.
0 16
.1N
CR
Nat
iona
l Cap
ital R
egio
n6,
535
13,0
4550
0,94
730
6.4
4.9
CAR
Cord
iller
a Ad
min
istra
tive
Regi
on30
4 1,
880
161,
888
99.0
13
.8I
Iloco
s54
8 5,
325
102,
819
62.9
8.
7II
Caga
yan
Valle
y30
3 3,
644
83,1
5850
.9
15.3
III
Cent
ral L
uzon
1,
620
11,5
8813
9,83
385
.5
7.8
IVA
CALA
BARZ
ON
2,57
1 14
,922
172,
310
105.
4 7.
6IV
BM
IMAR
OPA
27
4 3,
281
83,6
1451
.1
15.0
V Bi
col
374
6,38
858
,600
35.8
21
.4VI
W
este
rn V
isaya
s73
9 8,
029
92,0
4356
.3
15.9
VII
Cent
ral V
isaya
s1,
157
7,81
114
8,06
790
.6
19.0
VIII
East
ern
Visa
yas
355
4,79
273
,996
45.3
30
.4IX
Za
mbo
anga
Pen
insu
la34
2 3,
963
86,3
6852
.8
32.4
wX
Nor
ther
n M
inda
nao
692
4,93
314
0,22
485
.8
25.4
XI
Dav
ao R
egio
n 81
7 5,
248
155,
657
95.2
17
.7XI
I SO
CCSK
SARG
EN47
3 4,
871
97,0
3459
.4
27.2
XIII
Cara
ga19
4 2,
886
67,2
2841
.1
28.3
ARM
M
Auto
nom
ous R
egio
n in
Mus
lim M
inda
nao
129
3,99
532
,220
19.7
55
.4GR
DP
= gr
oss r
egio
nal d
omes
tic p
rodu
ct; C
ALAB
ARZO
N =
Cav
ite, L
agun
a, B
atan
gas,
Riza
l, an
d Q
uezo
n; M
IMAR
OPA
= M
indo
ro, M
arin
duqu
e, R
ombl
on, a
nd P
alaw
an;
SOCC
SKSA
RGEN
= S
outh
Cot
abat
o, C
otab
ato,
Sul
tan
Kuda
rat,
Sara
ngan
i, an
d Ge
nera
l San
tos;
PHP
= Ph
ilipp
ine
peso
So
urce
: Phi
lippi
ne S
tatis
tics A
utho
rity
(n.d
.-a, n
.d.-b
)
12
Regional Analysis of the Philippine Services Sector
Figure 4. Share of the services sector in GDP/GRDP at current prices (%)
GDP = gross domestic product; GRDP = gross regional domestic product; NCR = National Capital Region; CAR = Cordillera Administrative Region; ARMM = Autonomous Region in Muslim Mindanao; GRDP = gross regional domestic product; PH = PhilippinesSource: Philippine Statistics Authority (n.d.-a)
Figure 3. Share of GDP and population by region (%)
GDP = gross domestic product; NCR = National Capital Region; CAR = Cordillera Administrative Region; ARMM = Autonomous Region in Muslim Mindanao; GRDP = gross regional domestic productSource: Philippine Statistics Authority (n.d.-a, n.d.-b)

13
The Philippine Services Sector
In terms of spatial distribution, 53 percent of total services value-added came from NCR. The same concentration is observed in most services except in Transport, Storage, and Communications services, which appear to be more distributed to neighboring regions (Regions III and IVA) (Table 7).
Table 7. Gross value added in services by region: 2018 distribution at current prices (%)
Region SER TSC TRD FIN RERBA OSER PAD
PHIL 100.0 100.0 100.0 100.0 100.0 100.0 100.0
NCR 52.8 28.6 62.2 51.6 57.9 44.6 51.9 CAR 1.2 1.2 0.6 1.0 1.6 2.0 1.5 I 2.6 4.4 1.5 3.1 1.9 3.9 3.1 II 1.4 3.2 0.6 1.5 0.9 2.4 2.3 III 6.2 11.4 4.2 8.0 5.8 6.1 4.9 IVA 9.0 12.9 7.1 8.7 12.5 7.6 5.2 IVB 1.2 2.4 0.5 1.1 0.8 2.0 1.9 V 1.9 3.1 1.0 2.2 1.5 2.6 3.6 VI 3.9 5.9 3.3 4.3 2.3 5.5 4.3 VII 6.5 7.1 6.1 7.0 6.1 7.6 4.5 VIII 1.5 3.1 0.7 1.6 0.9 2.2 3.0 IX 1.6 2.1 1.3 1.5 0.9 2.3 2.5 X 2.9 4.2 3.8 2.1 1.7 3.0 2.8 XI 3.9 4.4 5.2 3.3 2.7 4.0 2.4 XII 1.9 2.6 1.6 1.9 1.3 2.5 2.3 XIII 1.0 3.0 0.3 0.8 0.7 1.4 1.6 ARMM 0.4 0.5 0.1 0.4 0.4 0.5 2.1
SER = services; TSC = transport, storage, and communications; TRD = trade retail distribution; FIN = financial services; RERBA = real estate, renting, and business activities; OSER = other services; PAD = public administration and defense; PHIL = Philippines; NCR = National Capital Region; CAR = Cordillera Administrative Region; ARMM = Autonomous Region in Muslim MindanaoSource: Philippine Statistics Authority (n.d.-a)
Shift-share analysis
Methodology
To interpret the shares and growth of the various service sectors at the regional level, a shift-share model is used. Shift share is a standard regional analysis method that attempts to determine how much regional growth can be attributed to national trends, industry factors, and unique regional factors. It is a purely descriptive tool and does not seek to explain the factors that influence the overall changes in local economies.

14
Regional Analysis of the Philippine Services Sector
It merely shows out- or underperforming sectors per region relative to the national level. Furthermore, shift-share analysis is a ‘snapshot’ between two particular time periods and is, on occasions, sensitive to the time period chosen (Oguz and Knight 2010).
As explained in Quintero (2007), Oguz and Knight (2010), Otsuka (2016), and Loveridge (1995), national share represents factors common to all industries at the national level. It is the regional growth that would occur if a particular variable present in all industries within the region grew at the same rate as the growth of the overall national economy. This component can signal a particular region’s unrealized potential had they experienced the same growth enjoyed by the economy as a whole. The industry mix represents factors that are industry-specific at the national level. It is the structural effect reflected by the deviation of a particular industry’s national growth rate from the overall aggregate growth rate. Lastly, the regional shift compares the industry’s growth rate at the local level with its growth rate at the national level. It is essentially the extent of regional growth driven by local forces. Regions that have positive (negative) regional shift effects possess local advantages (disadvantages) for activities affecting the performance of particular industries. It reflects the competitiveness of a certain region in a specific sector.
A decomposition through shift-share analysis focuses on the structural changes occurring in the main sectors—rather than the usual overall growth evaluation—to highlight the structural changes at the regional level (Chilian 2012). Overall, shift-share analysis provides a simple and straightforward approach to distinguish national and industrial contributions from local growth effects. The ability to separate local growth factors from national growth factors is important in understanding local economies. When used in combination with other analyses, the technique offers a valuable tool to understand a region’s economic potential better.
Review of methodology
In conducting a classical shift-share analysis, the working equation for the total economic change (TEC) would be a simple summation:
TEC = NS + IM + RS
15
The Philippine Services Sector
where NS is the national share (growth effect), IM is the industry mix (sectoral effect), and RS is the regional shift (competitive effect) component.
The shift-share model generally requires two time periods that would reflect the beginning and end of the whole period of analysis. The evaluation would mainly focus on the regional variable in a given industry while determining the possible contributory sources that could have led to its growth by the end of the observation period.
As explained by Quintero (2007) and Chilian (2012), the national effect is determined by multiplying the regional variable of a specific industry at the beginning of the period by the overall national growth rate of the variable that transpired during the observation period. For the industry effect, the regional variable of a specific industry at the beginning of the period is multiplied by the national growth rate of a specific industry of the variable net of the overall national growth rate of the variable that transpired during the observation period. Lastly, the regional effect could be deduced by multiplying the regional variable of a specific industry at the beginning of the period with the difference of the industry’s regional growth rate and its national growth rate during the observation period.
Shift-share analysis gained popularity in regional analysis mainly for its simplicity in capturing the subject changes of a variable under consideration (Esteban-Marquillas 1972). Although the classic shift-share model has been widely used, it is heavily criticized for its lack of theoretical content, disregard of intraregional linkages, and sensitivity on the initial variable observation level, as well as on the temporal, spatial, and industrial aggregation (Knudsen 2000; Chilian 2012). A big assumption of the traditional model is that it assumes that the regions are independent of each other. Thus, it fails to consider the possibility of spatial interaction (Mayor and Lopez-Menendez 2005).
The United Kingdom’s Office of National Statistics (ONS) (2018) pointed out the flaw of the shift-share model in relation to its choice of weights. In the classical model, which is static in nature, the weight used for each component for the entire observation period is the initial variable level at the beginning of the period. This presumes that the industry structure has not changed during the entire duration of the analysis period. This could lead to biased results, especially if there is a dramatic change in the variable concerned within the observation period. Specifically, the resulting calculations could be an underestimated
16
Regional Analysis of the Philippine Services Sector
national growth and industry mixes with an overestimated regional shift (Loveridge 1995). Another criticism stems from the usage of mere crude growth rates. These considerations paved the way for the theoretical advancements of the shift-share model.
The development of a multifactor partitioning (MFP) model was introduced by Ray in 1990 and Lemarche et al. in 2003 (ONS 2018). The MFP primarily corrected the mathematical conceptual errors of its classical predecessor. Specifically, in MFP, the use of static weights is corrected using a dynamic version, which allows industry mixes and growth rates to vary over time through the utilization of standardized growth rates. In the study by Toh et al. (2004), the major criticism of the shift-share model is its disregard for possible interactions, for instance, between the industry mix and regional effects. To resolve this, they used Esteban-Marquillas’ concept of homotheticity by extending the model with a fourth component—the allocation effect—which intends to account for the interaction effects.
In the study of Margaritis et al. (2005), the shift-share methodology was also used to analyze sectoral productivity exploring the possible relation between biased technological change and the changes in sectoral composition. In the study, shift-share analysis dissected aggregate productivity growth into three components: (1) intersectoral or “within” sector component; (2) “in-between” (static) component; and (3) interaction (dynamic) component. The “within” sector component tried to calculate each industry’s (counterfactual) contribution to overall productivity growth. The “in-between” component estimated the effect of changes in industry employment shares on aggregate productivity. Lastly, the dynamic component captured the residual effect of changes in both industry productivity and employment shares. The results of the study showed that industry contributions to overall labor productivity growth for member-countries of the Organisation for Economic Co-operation and Development (OECD) are mainly dominated by “within” sector effects with few contributions from sectoral shifts (the “static” and “dynamic” effects). The study concluded that there is only minimal impact on overall productivity growth from lower productivity industries losing shares or higher productivity industries gaining employment shares (Margaritis 2005). This was also the decomposition used in an OECD working paper where they used the “within”
17
The Philippine Services Sector
industry effect as the sum of labor productivity growth weighted by initial output shares. Their second component is the “shift-effect”, which is the sum of proportional shifts in labor input weighted by the initial relative productivity levels. The interaction effect, being their last component, is the product of changes in labor input and productivity (Sila et al. 2017).
Application
In this paper, the standard shift-share model is adopted, which decomposes the TEC that transpired for a particular region in a given sector for a given period through a simple summation of national share (NS), industry mix (IM), and regional shift (RS):
The actual economic change (AEC), which is merely the difference between the latest and initial levels of regional employment in a given industry, should be equal to the TEC since the shift-share model merely attributes a portion of change to the factor responsible for it.
Description of data
For this study, employment data from the Labor Force Survey (LFS) are used since it already adopts the 2009 PSIC (based on ISIC 4), which better reflects the industrial structure of modern economies, particularly in the services sector.

18
Regional Analysis of the Philippine Services Sector
Consistent with the pattern in services value-added presented earlier, the share of services to total employment was higher in 2018 compared to 2012. This was observed in aggregate (total for the Philippines) and across all regions.2 In the NCR, where services already accounted for 79.2 percent of total employment, the increase in percentage points was marginal (Figure 5).
From 2012 to 2018, employment in the services sector increased by 21.4 percent, significantly higher than the 11.13-percent increase in total employment. Except for education services, all sectors expanded with administrative and support service activities leading with a 69-percent jump (Table 8).
In terms of regions, employment in the services sector increased across the board, led by CALABARZON (Region IVA), with the highest growth rate of 37 percent. As Tables 9 and 10 reveal, however, the results are mixed across industries and regions. The expansion of employment in all service industries occurred only for Region IVA.
2 The services sector classification reported in GDP/GRDP estimates is not exactly the same as the one used in the LFS because the former is still based on 1994 PSIC (old ISIC 3.1).
Figure 5. Share of services sector in total employment (%)
PH = Philippines; NCR = National Capital Region; CAR = Cordillera Administrative Region; ARMM = Autonomous Region in Muslim Mindanao Source: PSA (n.d.-c, n.d.-d)

Serv
ices
Sub
sect
ors
2012
% o
f Tot
al20
18%
of T
otal
% C
hang
eG.
Who
lesa
le a
nd re
tail
trade
; rep
air o
f mot
or v
ehic
les a
nd
mot
orcy
cles
; and
per
sona
l and
hou
seho
ld g
oods
6,8
63,9
70
18.5
4 7
,993
,913
19
.43
16.4
6
H. T
rans
port
and
stor
age
2,6
16,8
71
7.07
3,2
20,1
84
7.82
23.0
5I.
Acco
mm
odat
ion
and
food
serv
ice
activ
ities
1,5
71,3
19
4.24
1,7
27,4
40
4.20
9.94
J. In
form
atio
n an
d co
mm
unic
atio
n 3
38,0
34
0.91
403
,495
0.
9819
.37
K. F
inan
cial
and
insu
ranc
e ac
tiviti
es 4
37,4
38
1.18
540
,444
1.
3123
.55
L. Re
al e
stat
e ac
tiviti
es 1
70,4
26
0.46
203
,705
0.
5019
.53
M. P
rofe
ssio
nal s
cien
tific
and
tech
nica
l act
iviti
es 1
88,9
01
0.51
274
,629
0.
6745
.38
N. A
dmin
istra
tive
and
supp
ort s
ervi
ce a
ctiv
ities
936
,559
2.
53 1
,583
,887
3.
8569
.12
O. P
ublic
adm
inist
ratio
n an
d de
fens
e; c
ompu
lsory
soci
al se
curit
y 1
,957
,989
5.
29 2
,559
,454
6.
2230
.72
P. E
duca
tion
1,2
00,0
22
3.24
1,1
96,6
40
2.91
-0.2
8Q
. Hum
an h
ealth
and
soci
al w
ork
activ
ities
437
,648
1.
18 5
17,5
83
1.26
18.2
6R.
Arts
, ent
erta
inm
ent,
and
recr
eatio
n 3
27,7
79
0.89
363
,097
0.
8810
.78
S. O
ther
serv
ice
activ
ities
2,1
48,8
27
5.80
2,7
23,5
97
6.62
26.7
5Se
rvic
es to
tal
19,
195,
783
23,
308,
068
21.4
2Sh
are
of se
rvic
es in
tota
l em
ploy
men
t 51
.84
56.6
4To
tal e
mpl
oym
ent
37,
031,
614
100.
00 4
1,15
2,53
7 10
0.00
11.1
3So
urce
: PSA
(n.d
.-c, n
.d.-d
)
Tabl
e 8.
Tot
al e
mpl
oym
ent i
n se
rvic
es s
ubse
ctor
s

Tabl
e 9.
Cha
nge
in to
tal e
mpl
oym
ent i
n se
rvic
es b
y se
ctor
and
regi
on (2
012–
2018
)
Sect
or
Code
NCR
CAR
III
IIIIV
AIV
BV
VIVI
IVI
IIIX
XXI
XII
XIII
ARM
MTo
tal
G53
,920
1,
405
66,2
56
32,0
66
167,
942
314,
445
36,7
45
70,7
68
79,5
70
62,8
13
59,1
31
(9,0
75)
76,8
89
22,9
21
49,6
76
34,8
38
9,63
2 1,
129,
942
H14
0,06
7 3,
547
(12,
091)
13,8
49
73,3
23
134,
092
17,4
72
9,84
6 12
,511
51
,729
21
,694
33
,915
26
,154
33
,946
35
,913
3,
773
3,57
3 60
3,31
2
I21
,600
2,
839
10,3
33
14,5
58
14,4
74
51,8
00
12,0
97
2,25
0 14
,998
30
,267
(8
08)
(6,3
82)
(10,
257)
5,23
3 (2
,493
)(4
,153
)(2
35)
156,
122
J21
,789
(4
)1,
529
1,90
0 8,
062
28,2
95
(484
)(3
,822
)(1
,319
)1,
499
(4,6
12)
1,57
5 4,
207
4,64
7 41
8 1,
918
(137
)65
,461
K27
,810
75
2 6,
885
736
10,7
99
32,9
21
(724
)2,
740
1,75
5 5,
863
1,96
8 32
9 3,
304
1,42
6 2,
117
3,30
8 1,
018
103,
006
L(2
,970
)(6
3)1,
269
382
6,26
0 17
,038
6
1,49
4 (1
,399
)4,
990
148
(588
)1,
258
3,16
4 1,
970
917
(596
)33
,279
M16
,522
2,
730
5,25
9 3,
139
13,0
59
25,0
32
2,16
4 4,
841
928
3,98
8 (1
7)1,
415
(745
)3,
382
2,24
1 1,
888
(98)
85,7
28
N22
3,69
7 6,
730
13,7
23
1,54
7 58
,250
14
6,04
0 10
,491
7,
661
43,6
48
61,1
52
11,8
15
1,51
4 15
,530
16
,196
15
,522
7,
790
6,02
2 64
7,32
9
O34
,098
17
,697
32
,790
33
,319
39
,367
48
,723
14
,864
40
,143
55
,954
31
,022
64
,651
60
,858
29
,275
27
,297
25
,428
32
,293
13
,686
60
1,46
5
P8,
493
2,05
2 6,
718
(3,0
91)
4,25
0 38
,132
2,
193
475
(20,
941)
(9,7
57)
(5,2
61)
(25,
141)
(2,8
74)
15,4
42
4,86
4 (5
,539
)(1
3,39
7)(3
,382
)
Q23
,429
3,
049
6,22
9 2,
139
11,6
63
12,2
18
155
1,09
7 7,
464
4,09
9 (2
,683
)(3
14)
3,41
4 (3
2)5,
734
(572
)2,
846
79,9
35
R4,
877
(857
)1,
530
2,36
9 (2
,602
)23
,386
90
1 (2
,598
)1,
382
8,91
3 (1
,813
)94
(2
,237
)56
7 (2
,307
)3,
696
18
35,3
19
S14
3,04
7 1,
549
26,4
94
9,16
4 30
,741
13
5,26
9 16
,109
19
,852
37
,298
57
,639
20
,275
37
8 20
,850
23
,122
13
,994
16
,633
2,
353
574,
769
TOTA
L71
6,37
8 41
,427
16
6,92
6 11
2,07
8 43
5,58
7 1,
007,
392
111,
989
154,
745
231,
849
314,
216
164,
489
58,5
78
164,
768
157,
311
153,
077
96,7
89
24,6
86
4,11
2,28
4
Not
e: P
arts
in g
ray
are
nega
tive
valu
es.
NCR
= N
atio
nal C
apita
l Reg
ion;
CAR
= C
ordi
llera
Adm
inist
rativ
e Re
gion
; ARM
M =
Aut
onom
ous R
egio
n in
Mus
lim M
inda
nao
Sect
ors:
G. W
hole
sale
and
Ret
ail T
rade
; Rep
air o
f Mot
or V
ehic
les a
nd M
otor
cycl
es; H
. Tra
nspo
rtatio
n an
d St
orag
e; I.
Acc
omm
odat
ion
and
Food
Ser
vice
Act
iviti
es; J
. Inf
orm
atio
n an
d Co
mm
unic
atio
n; K
. Fin
anci
al a
nd In
sura
nce
Activ
ities
; L. R
eal E
stat
e Ac
tiviti
es; M
. Pro
fess
iona
l, Sc
ient
ific,
and
Tech
nica
l Act
iviti
es; N
. Adm
inist
rativ
e an
d Su
ppor
t Ser
vice
Act
iviti
es;
O. P
ublic
Adm
inist
ratio
n an
d D
efen
se; P
. Edu
catio
n; Q
. Hum
an H
ealth
and
Soc
ial W
ork
Activ
ities
; R. A
rts, E
nter
tain
men
t, an
d Re
crea
tion;
and
S. O
ther
Ser
vice
Act
iviti
es.
Sour
ce: P
SA (n
.d.-c
, n.d
.-d)

Tabl
e 10
. Cha
nge
in to
tal e
mpl
oym
ent i
n se
rvic
es b
y se
ctor
and
regi
on (2
012–
2018
) (%
)
Not
e: P
arts
in g
ray
indi
cate
neg
ativ
e va
lues
.N
CR =
Nat
iona
l Cap
ital R
egio
n; C
AR =
Cor
dille
ra A
dmin
istra
tive
Regi
on; A
RMM
= A
uton
omou
s Reg
ion
in M
uslim
Min
dana
o Se
ctor
s: G.
Who
lesa
le a
nd R
etai
l Tra
de; R
epai
r of M
otor
Veh
icle
s and
Mot
orcy
cles
; H. T
rans
porta
tion
and
Stor
age;
I. A
ccom
mod
atio
n an
d Fo
od S
ervi
ce A
ctiv
ities
; J.
Info
rmat
ion
and
Com
mun
icat
ion;
K. F
inan
cial
and
Insu
ranc
e Ac
tiviti
es; L
. Rea
l Est
ate
Activ
ities
; M. P
rofe
ssio
nal,
Scie
ntifi
c, an
d Te
chni
cal A
ctiv
ities
; N. A
dmin
istra
tive
and
Supp
ort S
ervi
ce A
ctiv
ities
; O. P
ublic
Adm
inist
ratio
n an
d D
efen
se; P
. Edu
catio
n; Q
. Hum
an H
ealth
and
Soc
ial W
ork
Activ
ities
R. A
rts, E
nter
tain
men
t, an
d Re
crea
tion;
and
S.
Oth
er S
ervi
ce A
ctiv
ities
. So
urce
: PSA
(n.d
.-c, n
.d.-d
)
Sect
or
Code
NCR
CAR
III
IIIIV
AIV
BV
VIVI
IVI
IIIX
XXI
XII
XIII
ARM
M
G5.
0 1.
6 18
.8
17.7
21
.0
34.7
21
.7
17.0
15
.3
12.3
19
.2
(4.2
)23
.0
6.4
18.3
18
.5
6.2
H36
.2
11.6
(8
.8)
19.7
19
.7
35.0
27
.1
6.8
6.0
30.6
22
.6
42.8
23
.1
26.3
34
.6
6.2
5.1
I5.
9 12
.1
14.5
54
.5
7.7
18.7
36
.7
3.1
12.3
29
.0
(1.9
)(2
1.7)
(16.
1)7.
7 (5
.4)
(14.
1)(3
.1)
J19
.5
(0.1
)15
.2
50.3
20
.3
50.5
(9
.8)
(30.
2)(7
.1)
5.2
(46.
4)44
.9
41.5
47
.9
6.7
33.6
(3
6.8)
K23
.6
19.2
40
.7
7.7
20.7
45
.4
(8.2
)17
.6
6.1
18.0
17
.9
3.2
17.5
7.
3 18
.7
45.2
16
4.7
L(4
.0)
(4.0
)44
.8
69.9
44
.2
38.0
0.
3 63
.6
(15.
9)72
.2
8.8
(45.
0)49
.2
69.9
15
2.6
238.
9 (9
0.0)
M23
.5
130.
2 11
2.3
128.
8 67
.3
67.8
98
.6
127.
2 7.
8 30
.0
(0.6
)52
.3
(13.
1)56
.5
78.8
14
0.5
(21.
6)
N66
.2
47.7
52
.8
14.2
56
.3
87.1
12
1.1
36.8
90
.4
74.7
90
.0
9.6
56.8
49
.0
96.7
11
0.8
141.
8
O13
.7
37.3
34
.1
48.4
22
.4
22.4
19
.4
32.2
34
.6
20.0
56
.8
74.9
28
.1
33.0
29
.7
44.0
30
.8
P6.
6 6.
8 10
.1
(7.2
)3.
3 26
.2
5.7
0.6
(19.
5)(9
.7)
(8.9
)(5
3.7)
(4.8
)32
.9
10.4
(1
4.5)
(38.
7)
Q23
.2
36.2
34
.3
22.4
25
.4
16.8
1.
5 5.
7 21
.5
14.8
(1
4.9)
(2.7
)20
.9
(0.2
)44
.5
(6.0
)19
2.5
R10
.7
(31.
2)8.
3 29
.2
(4.0
)30
.3
11.5
(1
6.0)
7.5
50.4
(2
0.1)
2.4
(24.
6)4.
0 (2
4.6)
85.6
3.
8
S42
.9
7.4
21.2
15
.5
11.4
46
.1
30.2
15
.5
18.5
31
.7
20.5
0.
6 20
.5
24.9
21
.8
33.1
19
.1
TOTA
L21
.0
14.8
17
.7
22.7
19
.1
36.6
23
.3
14.7
15
.5
22.0
21
.0
10.4
19
.0
17.8
22
.5
20.3
7.
4
22
Regional Analysis of the Philippine Services Sector
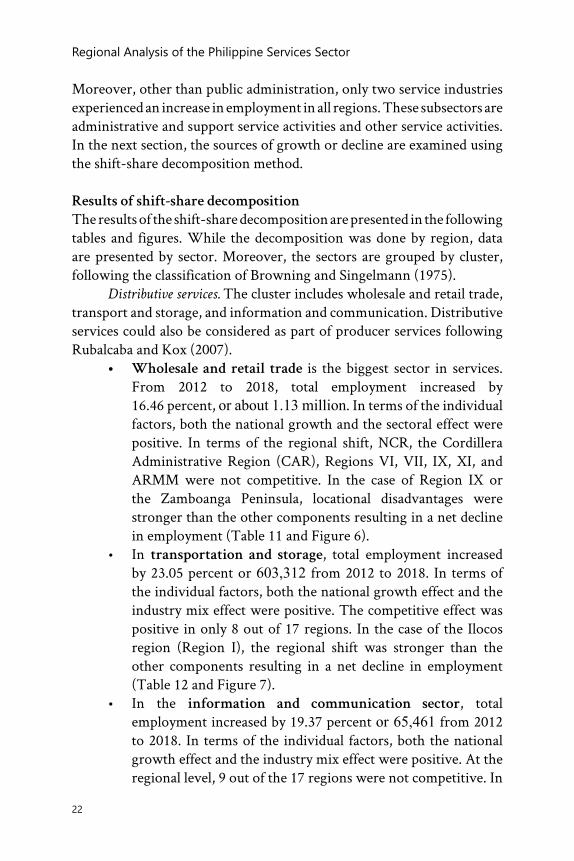
Moreover, other than public administration, only two service industries experienced an increase in employment in all regions. These subsectors are administrative and support service activities and other service activities. In the next section, the sources of growth or decline are examined using the shift-share decomposition method.
Results of shift-share decomposition
The results of the shift-share decomposition are presented in the following tables and figures. While the decomposition was done by region, data are presented by sector. Moreover, the sectors are grouped by cluster, following the classification of Browning and Singelmann (1975).
Distributive services. The cluster includes wholesale and retail trade, transport and storage, and information and communication. Distributive services could also be considered as part of producer services following Rubalcaba and Kox (2007).
• Wholesale and retail trade is the biggest sector in services. From 2012 to 2018, total employment increased by 16.46 percent, or about 1.13 million. In terms of the individual factors, both the national growth and the sectoral effect were positive. In terms of the regional shift, NCR, the Cordillera Administrative Region (CAR), Regions VI, VII, IX, XI, and ARMM were not competitive. In the case of Region IX or the Zamboanga Peninsula, locational disadvantages were stronger than the other components resulting in a net decline in employment (Table 11 and Figure 6).
• In transportation and storage, total employment increased by 23.05 percent or 603,312 from 2012 to 2018. In terms of the individual factors, both the national growth effect and the industry mix effect were positive. The competitive effect was positive in only 8 out of 17 regions. In the case of the Ilocos region (Region I), the regional shift was stronger than the other components resulting in a net decline in employment (Table 12 and Figure 7).
• In the information and communication sector, total employment increased by 19.37 percent or 65,461 from 2012 to 2018. In terms of the individual factors, both the national growth effect and the industry mix effect were positive. At the regional level, 9 out of the 17 regions were not competitive. In

Table 11. Total change in employment and shift-share decomposition for Sector G: Wholesale and retail trade; repair of motor vehicles and motorcycle; and personal and household goods
Region National Share
Industry Mix
Regional Shift
Total Change in Employment
National Capital Region 120,947 57,971 (124,998) 53,920 Cordillera Administrative Region
9,896 4,743 (13,234) 1,405
I - Ilocos 39,128 18,754 8,374 66,256 II - Cagayan Valley 20,215 9,689 2,163 32,066 III - Central Luzon 88,999 42,658 36,285 167,942 IVA - CALABARZON 100,904 48,365 165,176 314,445 IVB - MIMAROPA 18,860 9,040 8,845 36,745 V - Bicol 46,206 22,147 2,414 70,768 VI - Western Visayas 58,045 27,822 (6,297) 79,570 VII - Central Visayas 56,689 27,172 (21,048) 62,813 VIII - Eastern Visayas 34,319 16,450 8,363 59,131 IX - Zamboanga Peninsula 23,985 11,496 (44,556) (9,075)X - Northern Mindanao 37,156 17,809 21,923 76,889 XI - Davao Region 39,804 19,078 (35,961) 22,921 XII - SOCCSKSARGEN 30,288 14,517 4,870 49,676 XIII - Caraga 20,985 10,058 3,795 34,838 Autonomous Region in Muslim Mindanao
17,406 8,343 (16,116) 9,632
Note: Parts in gray indicate negative values. CALABARZON = Cavite, Laguna, Batangas, Rizal, and Quezon; MIMAROPA = Occidental Mindoro, Oriental Mindoro, Marinduque, Romblon, and Palawan; SOCCSKSARGEN = South Cotabato, Cotabato, Sultan Kudarat, Sarangani, and General SantosSource: Authors’ computation using data on employment for 2012 and 2018 from PSA (n.d.-c, n.d.-d)
Figure 6. Total change in employment with its components for Sector G: Wholesale and retail trade; repair of motor vehicles and motorcycles; and personal and household goods
CALABARZON = Cavite, Laguna, Batangas, Rizal, and Quezon; MIMAROPA = Occidental Mindoro, Oriental Mindoro, Marinduque, Romblon, and Palawan; SOCCSKSARGEN = South Cotabato, Cotabato, Sultan Kudarat, Sarangani, and General SantosSource: Authors’ computation using data on employment for 2012 and 2018 from PSA (n.d.-c, n.d.-d)

Figure 7. Total change in employment with its components for Sector H: Transportation and storage
CALABARZON = Cavite, Laguna, Batangas, Rizal, and Quezon; MIMAROPA = Occidental Mindoro, Oriental Mindoro, Marinduque, Romblon, and Palawan; SOCCSKSARGEN = South Cotabato, Cotabato, Sultan Kudarat, Sarangani, and General SantosSource: Authors’ computation using data on employment for 2012 and 2018 from PSA (n.d.-c, n.d.-d)
Table 12. Total change in employment and shift-share decomposition for Sector H: Transportation and storage
Region National Share
Industry Mix
Regional Shift
Total Change in Employment
National Capital Region 43,065 46,155 50,846 140,067 Cordillera Administrative Region
3,416 3,661 (3,530) 3,547
I - Ilocos 15,271 16,367 (43,729) (12,091)II - Cagayan Valley 7,827 8,388 (2,366) 13,849 III - Central Luzon 41,424 44,396 (12,498) 73,323 IVA - CALABARZON 42,587 45,643 45,862 134,092 IVB - MIMAROPA 7,174 7,689 2,609 17,472 V - Bicol 16,034 17,185 (23,373) 9,846 VI - Western Visayas 23,074 24,730 (35,293) 12,511 VII - Central Visayas 18,818 20,168 12,742 51,729 VIII - Eastern Visayas 10,667 11,433 (406) 21,694 IX - Zamboanga Peninsula 8,827 9,461 15,628 33,915 X - Northern Mindanao 12,598 13,502 54 26,154 XI - Davao Region 14,352 15,382 4,212 33,946 XII - SOCCSKSARGEN 11,563 12,392 11,958 35,913 XIII - Caraga 6,745 7,229 (10,202) 3,773 Autonomous Region in Muslim Mindanao
7,765 8,322 (12,514) 3,573
Note: Parts in gray indicate negative values.CALABARZON = Cavite, Laguna, Batangas, Rizal, and Quezon; MIMAROPA = Occidental Mindoro, Oriental Mindoro, Marinduque, Romblon, and Palawan; SOCCSKSARGEN = South Cotabato, Cotabato, Sultan Kudarat, Sarangani, and General SantosSource: Authors’ computation using data on employment for 2012 and 2018 from PSA (n.d.-c, n.d.-d)
25
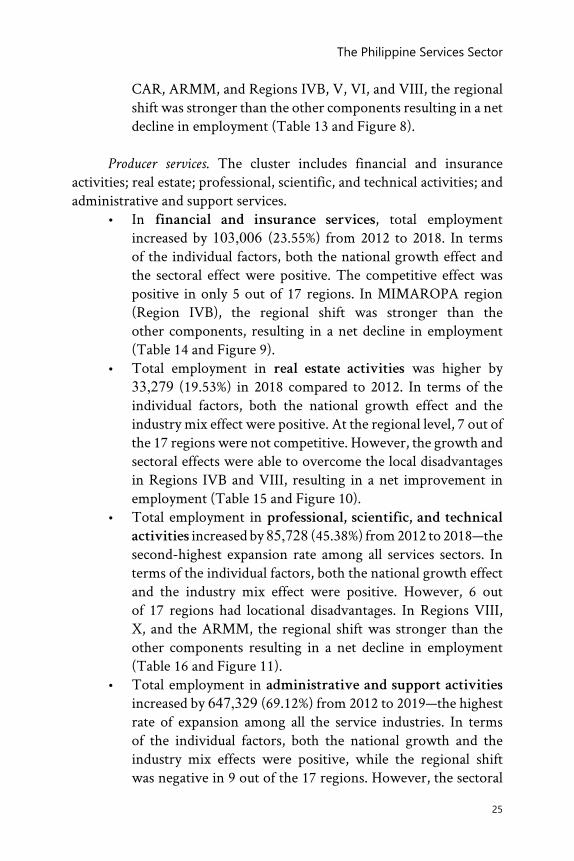
CAR, ARMM, and Regions IVB, V, VI, and VIII, the regional shift was stronger than the other components resulting in a net decline in employment (Table 13 and Figure 8).
Producer services. The cluster includes financial and insurance activities; real estate; professional, scientific, and technical activities; and administrative and support services.
• In financial and insurance services, total employment increased by 103,006 (23.55%) from 2012 to 2018. In terms of the individual factors, both the national growth effect and the sectoral effect were positive. The competitive effect was positive in only 5 out of 17 regions. In MIMAROPA region (Region IVB), the regional shift was stronger than the other components, resulting in a net decline in employment (Table 14 and Figure 9).
• Total employment in real estate activities was higher by 33,279 (19.53%) in 2018 compared to 2012. In terms of the individual factors, both the national growth effect and the industry mix effect were positive. At the regional level, 7 out of the 17 regions were not competitive. However, the growth and sectoral effects were able to overcome the local disadvantages in Regions IVB and VIII, resulting in a net improvement in employment (Table 15 and Figure 10).
• Total employment in professional, scientific, and technical
activities increased by 85,728 (45.38%) from 2012 to 2018—the second-highest expansion rate among all services sectors. In terms of the individual factors, both the national growth effect and the industry mix effect were positive. However, 6 out of 17 regions had locational disadvantages. In Regions VIII, X, and the ARMM, the regional shift was stronger than the other components resulting in a net decline in employment (Table 16 and Figure 11).
• Total employment in administrative and support activities
increased by 647,329 (69.12%) from 2012 to 2019—the highest rate of expansion among all the service industries. In terms of the individual factors, both the national growth and the industry mix effects were positive, while the regional shift was negative in 9 out of the 17 regions. However, the sectoral
The Philippine Services Sector
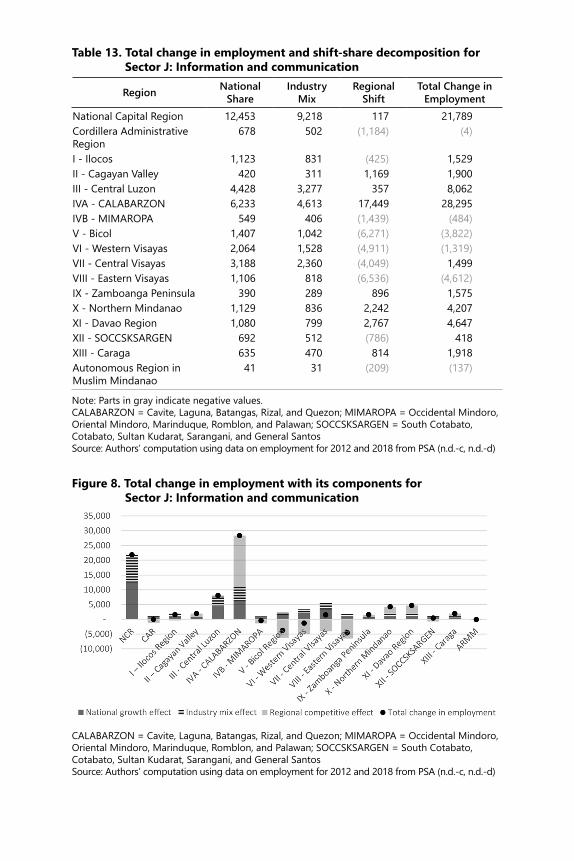
Figure 8. Total change in employment with its components for Sector J: Information and communication
CALABARZON = Cavite, Laguna, Batangas, Rizal, and Quezon; MIMAROPA = Occidental Mindoro, Oriental Mindoro, Marinduque, Romblon, and Palawan; SOCCSKSARGEN = South Cotabato, Cotabato, Sultan Kudarat, Sarangani, and General SantosSource: Authors’ computation using data on employment for 2012 and 2018 from PSA (n.d.-c, n.d.-d)
Table 13. Total change in employment and shift-share decomposition for Sector J: Information and communication
Region National Share
Industry Mix
Regional Shift
Total Change in Employment
National Capital Region 12,453 9,218 117 21,789 Cordillera Administrative Region
678 502 (1,184) (4)
I - Ilocos 1,123 831 (425) 1,529 II - Cagayan Valley 420 311 1,169 1,900 III - Central Luzon 4,428 3,277 357 8,062 IVA - CALABARZON 6,233 4,613 17,449 28,295 IVB - MIMAROPA 549 406 (1,439) (484)V - Bicol 1,407 1,042 (6,271) (3,822)VI - Western Visayas 2,064 1,528 (4,911) (1,319)VII - Central Visayas 3,188 2,360 (4,049) 1,499 VIII - Eastern Visayas 1,106 818 (6,536) (4,612)IX - Zamboanga Peninsula 390 289 896 1,575 X - Northern Mindanao 1,129 836 2,242 4,207 XI - Davao Region 1,080 799 2,767 4,647 XII - SOCCSKSARGEN 692 512 (786) 418 XIII - Caraga 635 470 814 1,918 Autonomous Region in Muslim Mindanao
41 31 (209) (137)
Note: Parts in gray indicate negative values.CALABARZON = Cavite, Laguna, Batangas, Rizal, and Quezon; MIMAROPA = Occidental Mindoro, Oriental Mindoro, Marinduque, Romblon, and Palawan; SOCCSKSARGEN = South Cotabato, Cotabato, Sultan Kudarat, Sarangani, and General SantosSource: Authors’ computation using data on employment for 2012 and 2018 from PSA (n.d.-c, n.d.-d)

Table 14. Total change in employment and shift-share decomposition for Sector K: Financial and insurance activities
Region National Share
Industry Mix
Regional Shift
Total Change in Employment
National Capital Region 13,137 14,661 12 27,810 Cordillera Administrative Region
436 487 (172) 752
I - Ilocos 1,880 2,099 2,906 6,885 II - Cagayan Valley 1,067 1,191 (1,522) 736 III - Central Luzon 5,794 6,467 (1,462) 10,799 IVA - CALABARZON 8,066 9,002 15,854 32,921 IVB - MIMAROPA 977 1,091 (2,792) (724)V - Bicol 1,735 1,937 (933) 2,740 VI - Western Visayas 3,178 3,547 (4,969) 1,755 VII - Central Visayas 3,633 4,055 (1,826) 5,863 VIII - Eastern Visayas 1,226 1,368 (625) 1,968 IX - Zamboanga Peninsula 1,142 1,274 (2,087) 329 X - Northern Mindanao 2,103 2,347 (1,146) 3,304 XI - Davao Region 2,161 2,411 (3,146) 1,426 XII - SOCCSKSARGEN 1,259 1,405 (547) 2,117 XIII - Caraga 815 910 1,583 3,308 Autonomous Region in Muslim Mindanao
69 77 872 1,018
Note: Parts in gray indicate negative values.CALABARZON = Cavite, Laguna, Batangas, Rizal, and Quezon; MIMAROPA = Occidental Mindoro, Oriental Mindoro, Marinduque, Romblon, and Palawan; SOCCSKSARGEN = South Cotabato, Cotabato, Sultan Kudarat, Sarangani, and General SantosSource: Authors’ computation using data on employment for 2012 and 2018 from PSA (n.d.-c, n.d.-d)
Figure 9. Total change in employment with its components for Sector K: Financial and insurance activities
CALABARZON = Cavite, Laguna, Batangas, Rizal, and Quezon; MIMAROPA = Occidental Mindoro, Oriental Mindoro, Marinduque, Romblon, and Palawan; SOCCSKSARGEN = South Cotabato, Cotabato, Sultan Kudarat, Sarangani, and General SantosSource: Authors’ computation using data on employment for 2012 and 2018 from PSA (n.d.-c, n.d.-d)

Figure 10. Total change in employment with its components for Sector L: Real estate activities
CALABARZON = Cavite, Laguna, Batangas, Rizal, and Quezon; MIMAROPA = Occidental Mindoro, Oriental Mindoro, Marinduque, Romblon, and Palawan; SOCCSKSARGEN = South Cotabato, Cotabato, Sultan Kudarat, Sarangani, and General SantosSource: Authors’ computation using data on employment for 2012 and 2018 from PSA (n.d.-c, n.d.-d)
Table 15. Total change in employment and shift-share decomposition for Sector L: Real estate activities
Region National Share
Industry Mix
Regional Shift
Total Change in Employment
National Capital Region 8,253 6,228 (17,451) (2,970)Cordillera Administrative Region
174 132 (369) (63)
I - Ilocos 315 238 716 1,269 II - Cagayan Valley 61 46 275 382 III - Central Luzon 1,576 1,190 3,494 6,260 IVA - CALABARZON 4,983 3,761 8,293 17,038 IVB - MIMAROPA 212 160 (367) 6 V - Bicol 261 197 1,035 1,494 VI - Western Visayas 978 738 (3,114) (1,399)VII - Central Visayas 769 580 3,641 4,990 VIII - Eastern Visayas 189 142 (183) 148 IX - Zamboanga Peninsula 145 110 (844) (588)X - Northern Mindanao 285 215 759 1,258 XI - Davao Region 504 380 2,280 3,164 XII - SOCCSKSARGEN 144 108 1,718 1,970 XIII - Caraga 43 32 843 917 Autonomous Region in Muslim Mindanao
74 56 (726) (596)
Note: Parts in gray indicate negative values. CALABARZON = Cavite, Laguna, Batangas, Rizal, and Quezon; MIMAROPA = Occidental Mindoro, Oriental Mindoro, Marinduque, Romblon, and Palawan; SOCCSKSARGEN = South Cotabato, Cotabato, Sultan Kudarat, Sarangani, and General SantosSource: Authors’ computation using data on employment for 2012 and 2018 from PSA (n.d.-c, n.d.-d)
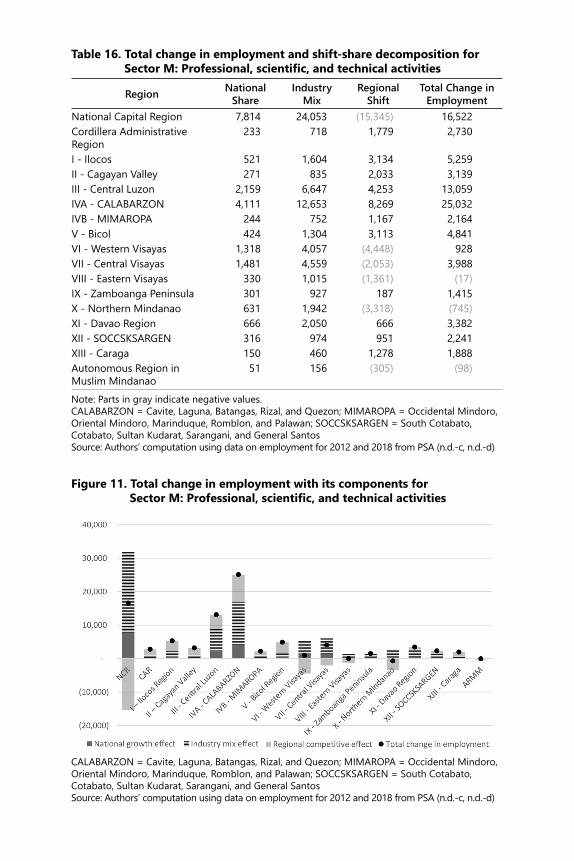
Table 16. Total change in employment and shift-share decomposition for Sector M: Professional, scientific, and technical activities
Region National Share
Industry Mix
Regional Shift
Total Change in Employment
National Capital Region 7,814 24,053 (15,345) 16,522 Cordillera Administrative Region
233 718 1,779 2,730
I - Ilocos 521 1,604 3,134 5,259 II - Cagayan Valley 271 835 2,033 3,139 III - Central Luzon 2,159 6,647 4,253 13,059 IVA - CALABARZON 4,111 12,653 8,269 25,032 IVB - MIMAROPA 244 752 1,167 2,164 V - Bicol 424 1,304 3,113 4,841 VI - Western Visayas 1,318 4,057 (4,448) 928 VII - Central Visayas 1,481 4,559 (2,053) 3,988 VIII - Eastern Visayas 330 1,015 (1,361) (17)IX - Zamboanga Peninsula 301 927 187 1,415 X - Northern Mindanao 631 1,942 (3,318) (745)XI - Davao Region 666 2,050 666 3,382 XII - SOCCSKSARGEN 316 974 951 2,241 XIII - Caraga 150 460 1,278 1,888 Autonomous Region in Muslim Mindanao
51 156 (305) (98)
Note: Parts in gray indicate negative values.CALABARZON = Cavite, Laguna, Batangas, Rizal, and Quezon; MIMAROPA = Occidental Mindoro, Oriental Mindoro, Marinduque, Romblon, and Palawan; SOCCSKSARGEN = South Cotabato, Cotabato, Sultan Kudarat, Sarangani, and General SantosSource: Authors’ computation using data on employment for 2012 and 2018 from PSA (n.d.-c, n.d.-d)
Figure 11. Total change in employment with its components for Sector M: Professional, scientific, and technical activities
CALABARZON = Cavite, Laguna, Batangas, Rizal, and Quezon; MIMAROPA = Occidental Mindoro, Oriental Mindoro, Marinduque, Romblon, and Palawan; SOCCSKSARGEN = South Cotabato, Cotabato, Sultan Kudarat, Sarangani, and General SantosSource: Authors’ computation using data on employment for 2012 and 2018 from PSA (n.d.-c, n.d.-d)

30
Regional Analysis of the Philippine Services Sector
effect was so strong that it was able to overcome locational disadvantages resulting in a net improvement in employment in all regions (Table 17 and Figure 12).
Personal services. This cluster includes accommodation and food service activities; arts, entertainment, and recreation; and other service activities.
• Total employment in accommodation and food services
activities increased by 156,122 (9.94%) from 2012 to 2018. In terms of the individual factors, the national growth effect was positive, as expected. However, the sectoral effect was negative, indicating industry-specific weaknesses. In addition, only seven regions had locational advantages in this sector. The combination of the national share and the regional shifts still resulted in a net improvement in employment in 11 out of 17 regions (Table 18 and Figure 13).
• Total employment in arts, entertainment, and recreation
increased by 35,319 (10.78%) from 2012 to 2018. In terms of the individual factors, the national growth effect was positive as in the previous sector in this cluster. The sectoral effect, however, was negative, which indicates industry-specific weaknesses. Only five regions had locational advantages in this sector. Results also show that the economy-wide effect was not enough to overcome the combined industry and the regional effects resulting in a net decline in employment in 6 out of 17 regions (Table 19 and Figure 14).
• Total employment in other service activities increased by 574,769 (26.75%) from 2012 to 2018. In terms of the individual factors, both the national growth effect and the industry mix effect were positive. Even though the competitive effect was negative in 12 out of 17 regions, the other components were strong enough to increase net employment in all regions (Table 20 and Figure 15).
Social services. This cluster includes education services and human health and social work activities.
• Total employment education services decreased by 3,382 (-0.28%) from 2012 to 2018. This is the only service industry that declined during the period. In terms of the individual
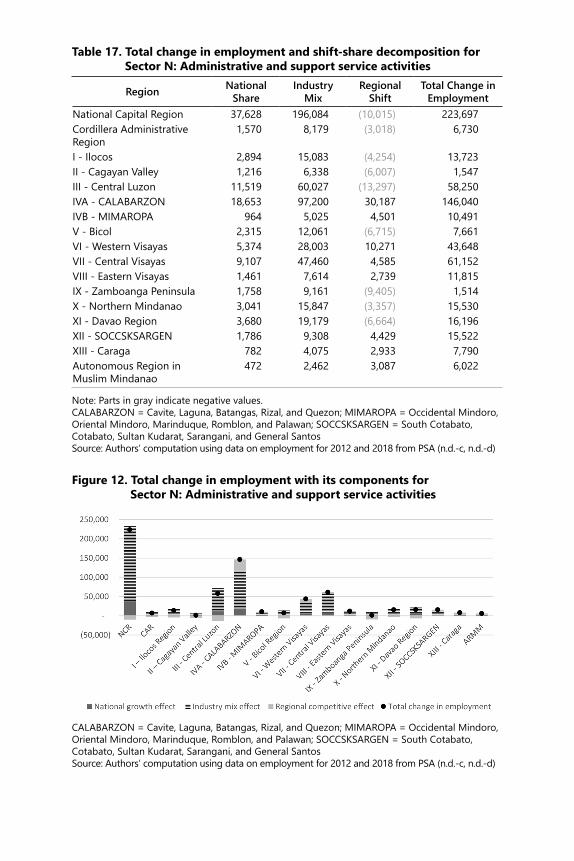
Table 17. Total change in employment and shift-share decomposition for Sector N: Administrative and support service activities
Region National Share
Industry Mix
Regional Shift
Total Change in Employment
National Capital Region 37,628 196,084 (10,015) 223,697 Cordillera Administrative Region
1,570 8,179 (3,018) 6,730
I - Ilocos 2,894 15,083 (4,254) 13,723 II - Cagayan Valley 1,216 6,338 (6,007) 1,547 III - Central Luzon 11,519 60,027 (13,297) 58,250 IVA - CALABARZON 18,653 97,200 30,187 146,040 IVB - MIMAROPA 964 5,025 4,501 10,491 V - Bicol 2,315 12,061 (6,715) 7,661 VI - Western Visayas 5,374 28,003 10,271 43,648 VII - Central Visayas 9,107 47,460 4,585 61,152 VIII - Eastern Visayas 1,461 7,614 2,739 11,815 IX - Zamboanga Peninsula 1,758 9,161 (9,405) 1,514 X - Northern Mindanao 3,041 15,847 (3,357) 15,530 XI - Davao Region 3,680 19,179 (6,664) 16,196 XII - SOCCSKSARGEN 1,786 9,308 4,429 15,522 XIII - Caraga 782 4,075 2,933 7,790 Autonomous Region in Muslim Mindanao
472 2,462 3,087 6,022
Note: Parts in gray indicate negative values. CALABARZON = Cavite, Laguna, Batangas, Rizal, and Quezon; MIMAROPA = Occidental Mindoro, Oriental Mindoro, Marinduque, Romblon, and Palawan; SOCCSKSARGEN = South Cotabato, Cotabato, Sultan Kudarat, Sarangani, and General SantosSource: Authors’ computation using data on employment for 2012 and 2018 from PSA (n.d.-c, n.d.-d)
Figure 12. Total change in employment with its components for Sector N: Administrative and support service activities
CALABARZON = Cavite, Laguna, Batangas, Rizal, and Quezon; MIMAROPA = Occidental Mindoro, Oriental Mindoro, Marinduque, Romblon, and Palawan; SOCCSKSARGEN = South Cotabato, Cotabato, Sultan Kudarat, Sarangani, and General SantosSource: Authors’ computation using data on employment for 2012 and 2018 from PSA (n.d.-c, n.d.-d)

Figure 13. Total change in employment with its components for Sector I: Accommodation and food service activities
CALABARZON = Cavite, Laguna, Batangas, Rizal, and Quezon; MIMAROPA = Occidental Mindoro, Oriental Mindoro, Marinduque, Romblon, and Palawan; SOCCSKSARGEN = South Cotabato, Cotabato, Sultan Kudarat, Sarangani, and General SantosSource: Authors’ computation using data on employment for 2012 and 2018 from PSA (n.d.-c, n.d.-d)
Table 18. Total change in employment and shift-share decomposition for Sector I: Accommodation and food service activities
Region National Share
Industry Mix
Regional Shift
Total Change in Employment
National Capital Region 40,827 (4,375) (14,852) 21,600 Cordillera Administrative Region
2,603 (279) 515 2,839
I - Ilocos 7,939 (851) 3,244 10,333 II - Cagayan Valley 2,975 (319) 11,902 14,558 III - Central Luzon 20,943 (2,244) (4,225) 14,474 IVA - CALABARZON 30,752 (3,295) 24,343 51,800 IVB - MIMAROPA 3,669 (393) 8,821 12,097 V - Bicol 8,094 (867) (4,976) 2,250 VI - Western Visayas 13,565 (1,453) 2,887 14,998 VII - Central Visayas 11,607 (1,244) 19,904 30,267 VIII - Eastern Visayas 4,658 (499) (4,967) (808)IX - Zamboanga Peninsula 3,269 (350) (9,301) (6,382)X - Northern Mindanao 7,097 (761) (16,594) (10,257)XI - Davao Region 7,583 (812) (1,537) 5,233 XII - SOCCSKSARGEN 5,154 (552) (7,094) (2,493)XIII - Caraga 3,266 (350) (7,070) (4,153)Autonomous Region in Muslim Mindanao
857 (92) (1,000) (235)
Note: Parts in gray indicate negative values.CALABARZON = Cavite, Laguna, Batangas, Rizal, and Quezon; MIMAROPA = Occidental Mindoro, Oriental Mindoro, Marinduque, Romblon, and Palawan; SOCCSKSARGEN = South Cotabato, Cotabato, Sultan Kudarat, Sarangani, and General SantosSource: Authors’ computation using data on employment for 2012 and 2018 from PSA (n.d.-c, n.d.-d)

Table 19. Total change in employment and shift-share decomposition for Sector R: Arts, entertainment, and recreation
Region National Share
Industry Mix
Regional Shift
Total Change in Employment
National Capital Region 5,073 (161) (35) 4,877 Cordillera Administrative Region
306 (10) (1,153) (857)
I - Ilocos 2,063 (65) (468) 1,530 II - Cagayan Valley 904 (29) 1,494 2,369 III - Central Luzon 7,245 (230) (9,618) (2,602)IVA - CALABARZON 8,596 (273) 15,062 23,386 IVB - MIMAROPA 872 (28) 57 901 V - Bicol 1,805 (57) (4,345) (2,598)VI - Western Visayas 2,049 (65) (602) 1,382 VII - Central Visayas 1,968 (62) 7,007 8,913 VIII - Eastern Visayas 1,004 (32) (2,786) (1,813)IX - Zamboanga Peninsula 446 (14) (337) 94 X - Northern Mindanao 1,010 (32) (3,215) (2,237)XI - Davao Region 1,557 (49) (941) 567 XII - SOCCSKSARGEN 1,043 (33) (3,316) (2,307)XIII - Caraga 481 (15) 3,231 3,696 Autonomous Region in Muslim Mindanao
53 (2) (33) 18
Note: Parts in gray indicate negative values.CALABARZON = Cavite, Laguna, Batangas, Rizal, and Quezon; MIMAROPA = Occidental Mindoro, Oriental Mindoro, Marinduque, Romblon, and Palawan; SOCCSKSARGEN = South Cotabato, Cotabato, Sultan Kudarat, Sarangani, and General SantosSource: Authors’ computation using data on employment for 2012 and 2018 from PSA (n.d.-c, n.d.-d)
Figure 14. Total change in employment with its components for Sector R: Arts, entertainment, and recreation
CALABARZON = Cavite, Laguna, Batangas, Rizal, and Quezon; MIMAROPA = Occidental Mindoro, Oriental Mindoro, Marinduque, Romblon, and Palawan; SOCCSKSARGEN = South Cotabato, Cotabato, Sultan Kudarat, Sarangani, and General SantosSource: Authors’ computation using data on employment for 2012 and 2018 from PSA (n.d.-c, n.d.-d)

Table 20. Total change in employment and shift-share decomposition for Sector S: Other service activities
Region National Share
Industry Mix
Regional Shift
Total Change in Employment
National Capital Region 37,127 52,113 53,806 143,047 Cordillera Administrative Region
2,322 3,260 (4,032) 1,549
I - Ilocos 13,889 19,495 (6,890) 26,494 II - Cagayan Valley 6,559 9,207 (6,602) 9,164 III - Central Luzon 29,987 42,092 (41,338) 30,741 IVA - CALABARZON 32,666 45,851 56,752 135,269 IVB - MIMAROPA 5,929 8,322 1,858 16,109 V - Bicol 14,241 19,989 (14,378) 19,852 VI - Western Visayas 22,481 31,555 (16,738) 37,298 VII - Central Visayas 20,220 28,381 9,038 57,639 VIII - Eastern Visayas 11,005 15,446 (6,176) 20,275 IX - Zamboanga Peninsula 6,892 9,674 (16,187) 378 X - Northern Mindanao 11,329 15,902 (6,381) 20,850 XI - Davao Region 10,353 14,533 (1,764) 23,122 XII - SOCCSKSARGEN 7,158 10,047 (3,211) 13,994 XIII - Caraga 5,596 7,855 3,181 16,633 Autonomous Region in Muslim Mindanao
1,370 1,922 (939) 2,353
Note: Parts in gray indicate negative values.CALABARZON = Cavite, Laguna, Batangas, Rizal, and Quezon; MIMAROPA = Occidental Mindoro, Oriental Mindoro, Marinduque, Romblon, and Palawan; SOCCSKSARGEN = South Cotabato, Cotabato, Sultan Kudarat, Sarangani, and General SantosSource: Authors’ computation using data on employment for 2012 and 2018 from PSA (n.d.-c, n.d.-d)
Figure 15. Total change in employment with its components for Sector S: Other service activities
CALABARZON = Cavite, Laguna, Batangas, Rizal, and Quezon; MIMAROPA = Occidental Mindoro, Oriental Mindoro, Marinduque, Romblon, and Palawan; SOCCSKSARGEN = South Cotabato, Cotabato, Sultan Kudarat, Sarangani, and General SantosSource: Authors’ computation using data on employment for 2012 and 2018 from PSA (n.d.-c, n.d.-d)

35
factors, the national growth effect was likewise positive. However, the sectoral effect was negative, indicating industry-specific weaknesses. Moreover, eight regions had locational disadvantages in this sector, resulting in a net decline in employment in these regions (Table 21 and Figure 16).
• In human health and social work activities, total employment increased by 79,935 (18.26%) from 2012 to 2018. In terms of the individual factors, both the national growth effect and the industry mix effect were positive. The regional shift factor was negative in 8 out of 17 regions, but in 4 of these, the effects of the other components were strong enough, resulting in a net increase in employment. Thus, a net decline in employment occurred in only 4 regions. See Table 22 and Figure 17.
In summary, the overall growth of the economy from 2012 to 2018 resulted in a positive effect in all sectors and regions. However, some industries exhibited weaknesses, namely, accommodation and food service activities; arts, entertainment, and recreation; and education. Industry-specific factors in education services were quite strong that the dynamism of the economy failed to offset the industry mix effect. It was the only sector that registered lower total employment during the period, which could be due to the interim impact of the reforms introduced in this sector (see Brillantes Jr. et al. 2018; Ortiz et al. 2019). Finally, 109 out of the total 204 regional service industries (53.43%) displayed negative regional shift effects.
Harnessing services for regional development
Services play different roles in the economy. Certain types of services are critical to industries, as well as in the efficient functioning of markets. Others have direct impacts on human capital development. Services may not be tangible, but they affect an individual’s economic and social lives in all aspects. As such, they can play a crucial role in meeting the SDGs and the overall aspiration of “leaving no one behind”. Access to efficient and affordable services will contribute towards meeting the overarching SDG, while uncompetitive and inadequate basic services will make it impossible for families, regions, and even nations to catch up.
Harnessing Services for Regional Development
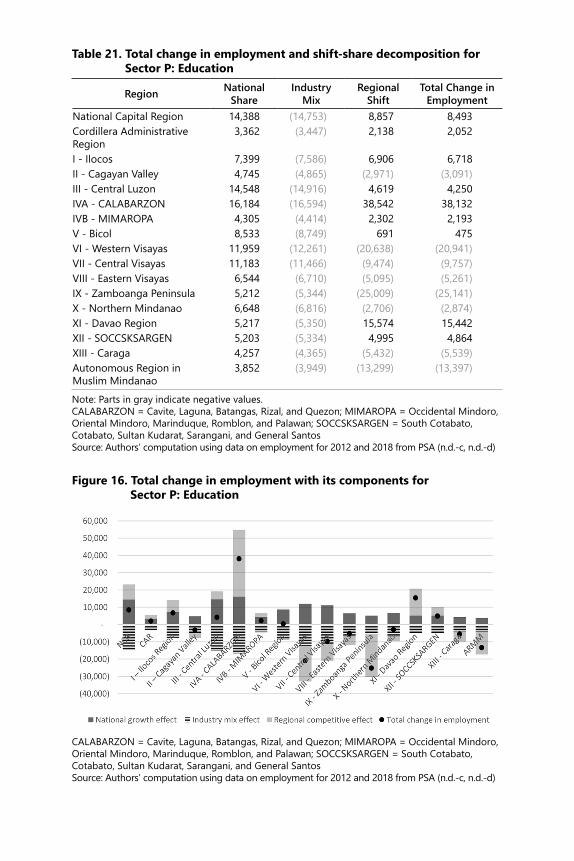
Table 21. Total change in employment and shift-share decomposition for Sector P: Education
Region National Share
Industry Mix
Regional Shift
Total Change in Employment
National Capital Region 14,388 (14,753) 8,857 8,493 Cordillera Administrative Region
3,362 (3,447) 2,138 2,052
I - Ilocos 7,399 (7,586) 6,906 6,718 II - Cagayan Valley 4,745 (4,865) (2,971) (3,091)III - Central Luzon 14,548 (14,916) 4,619 4,250 IVA - CALABARZON 16,184 (16,594) 38,542 38,132 IVB - MIMAROPA 4,305 (4,414) 2,302 2,193 V - Bicol 8,533 (8,749) 691 475 VI - Western Visayas 11,959 (12,261) (20,638) (20,941)VII - Central Visayas 11,183 (11,466) (9,474) (9,757)VIII - Eastern Visayas 6,544 (6,710) (5,095) (5,261)IX - Zamboanga Peninsula 5,212 (5,344) (25,009) (25,141)X - Northern Mindanao 6,648 (6,816) (2,706) (2,874)XI - Davao Region 5,217 (5,350) 15,574 15,442 XII - SOCCSKSARGEN 5,203 (5,334) 4,995 4,864 XIII - Caraga 4,257 (4,365) (5,432) (5,539)Autonomous Region in Muslim Mindanao
3,852 (3,949) (13,299) (13,397)
Note: Parts in gray indicate negative values. CALABARZON = Cavite, Laguna, Batangas, Rizal, and Quezon; MIMAROPA = Occidental Mindoro, Oriental Mindoro, Marinduque, Romblon, and Palawan; SOCCSKSARGEN = South Cotabato, Cotabato, Sultan Kudarat, Sarangani, and General SantosSource: Authors’ computation using data on employment for 2012 and 2018 from PSA (n.d.-c, n.d.-d)
Figure 16. Total change in employment with its components for Sector P: Education
CALABARZON = Cavite, Laguna, Batangas, Rizal, and Quezon; MIMAROPA = Occidental Mindoro, Oriental Mindoro, Marinduque, Romblon, and Palawan; SOCCSKSARGEN = South Cotabato, Cotabato, Sultan Kudarat, Sarangani, and General SantosSource: Authors’ computation using data on employment for 2012 and 2018 from PSA (n.d.-c, n.d.-d)
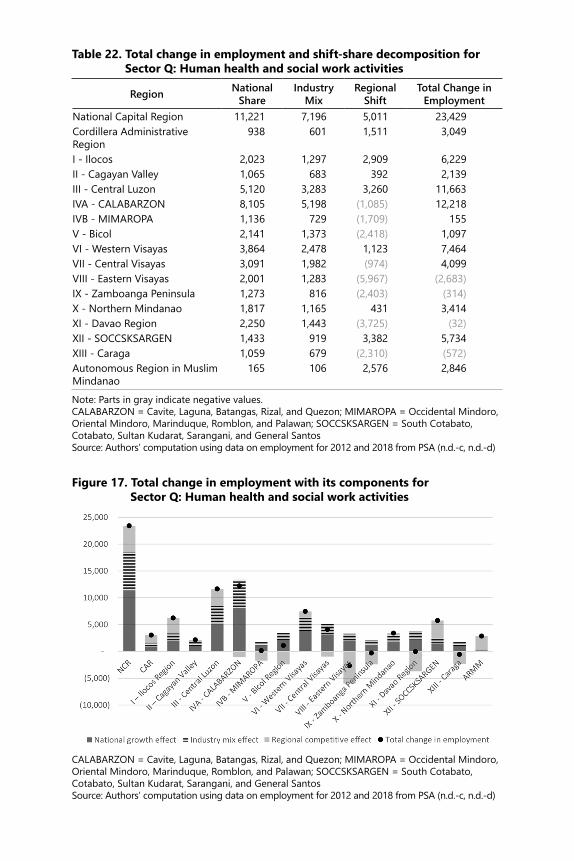
Table 22. Total change in employment and shift-share decomposition for Sector Q: Human health and social work activities
Region National Share
Industry Mix
Regional Shift
Total Change in Employment
National Capital Region 11,221 7,196 5,011 23,429 Cordillera Administrative Region
938 601 1,511 3,049
I - Ilocos 2,023 1,297 2,909 6,229 II - Cagayan Valley 1,065 683 392 2,139 III - Central Luzon 5,120 3,283 3,260 11,663 IVA - CALABARZON 8,105 5,198 (1,085) 12,218 IVB - MIMAROPA 1,136 729 (1,709) 155 V - Bicol 2,141 1,373 (2,418) 1,097 VI - Western Visayas 3,864 2,478 1,123 7,464 VII - Central Visayas 3,091 1,982 (974) 4,099 VIII - Eastern Visayas 2,001 1,283 (5,967) (2,683)IX - Zamboanga Peninsula 1,273 816 (2,403) (314)X - Northern Mindanao 1,817 1,165 431 3,414 XI - Davao Region 2,250 1,443 (3,725) (32)XII - SOCCSKSARGEN 1,433 919 3,382 5,734 XIII - Caraga 1,059 679 (2,310) (572)Autonomous Region in Muslim Mindanao
165 106 2,576 2,846
Note: Parts in gray indicate negative values.CALABARZON = Cavite, Laguna, Batangas, Rizal, and Quezon; MIMAROPA = Occidental Mindoro, Oriental Mindoro, Marinduque, Romblon, and Palawan; SOCCSKSARGEN = South Cotabato, Cotabato, Sultan Kudarat, Sarangani, and General SantosSource: Authors’ computation using data on employment for 2012 and 2018 from PSA (n.d.-c, n.d.-d)
Figure 17. Total change in employment with its components for Sector Q: Human health and social work activities
CALABARZON = Cavite, Laguna, Batangas, Rizal, and Quezon; MIMAROPA = Occidental Mindoro, Oriental Mindoro, Marinduque, Romblon, and Palawan; SOCCSKSARGEN = South Cotabato, Cotabato, Sultan Kudarat, Sarangani, and General SantosSource: Authors’ computation using data on employment for 2012 and 2018 from PSA (n.d.-c, n.d.-d)

38
Regional Analysis of the Philippine Services Sector
As earlier shown in Table 6, there is a great economic disparity among the regions. While GRDP per capita in the NCR is three times the national average, it is barely a fifth in the case of ARMM. As Figures 18 and 19 show, services employment is positively associated with output while negatively associated with poverty incidence. Although they do not indicate the direction of causality, they illustrate how a growing services sector, measured here in terms of employment, is correlated with key economic outcomes.
The previous section revealed the regions that exhibited locational disadvantages in specific services. These regions showed negative shift-share effects that cannot be attributed to general macroeconomic conditions or industry-specific factors. Out of the total 204 regional service industries, 109 (53.43%) displayed negative regional shift effects. While this might reflect a restructuring of the local economies rather than an actual disadvantage, it is useful to discuss the implications of these results in the context of the region’s economic characteristics (Table 6) and development goals.
National Capital Region (NCR)
The NCR recorded the highest contribution to the economy with a GRDP of PHP 6.54 trillion or 37.5 percent of GDP. It is also the second most populous region with 13 million inhabitants—CALABARZON being the highest. It enjoys the highest GRDP per capita of PHP 500,947 and the lowest poverty incidence of 4.9 percent.
The sectors with the highest positive shift effects were other service activities and transport and storage. These are followed by education, human health, and social work activities, information and communication, and financial and insurance activities. In industries, such as wholesale and retail trade, real estate activities, professional scientific and technical activities, accommodation and food service activities, administrative and support service activities, and arts, entertainment, and recreation, NCR showed locational disadvantages.
The negative regional shift effect in administrative and support service activities may be due to the deliberate strategy of the government to shift business process outsourcing (BPO) activities to cities outside Metro Manila. Other sectors could be experiencing the market pressures to move out of the capital region. The negative regional shift effect in

39
Harnessing Services for Regional Development
Figure 18. Employment in services and GRDP

40
Regional Analysis of the Philippine Services Sector
Figure 18. (continued)
GRDP = gross regional domestic product; NCR = National Capital Region; CAR = Cordillera Administrative Region; ARMM = Autonomous Region in Muslim Mindanao Source: Authors’ computation using data from PSA (n.d.-a, n.d.-d)

41
Harnessing Services for Regional Development
Figure 19. Employment in services and poverty incidence

42
Regional Analysis of the Philippine Services Sector
NCR = National Capital Region; CAR = Cordillera Administrative Region; ARMM = Autonomous Region in Muslim MindanaoSource: Authors’ computation using data from PSA (n.d.-b, n.d.-d)
Figure 19. (continued)

43
Harnessing Services for Regional Development
wholesale and retail combined with the positive regional shift effect in transport and storage may be due to the rise of e-commerce, which requires less manpower in brick and mortar stores and more towards delivery and logistics. The positive shift effect in other service activities is not necessarily beneficial to the region as jobs in this sector tend to be low-skilled. Since the NCR is the services center of the country (Table 7), economic activity in the region should be encouraged to shift towards high value-adding industries with high-skilled jobs.
Cordillera Administrative Region
The region has the least population with only 1.88 million. Though it has the fifth-lowest GRDP in the country (PHP 304 billion), its poverty incidence of 13.8 percent is below the national average of 16.1 percent.
Only 4 out of 12 services subsectors displayed locational advantages in the region, namely, education; professional, scientific, and technical activities; human health and social work activities; and accommodation and food service activities. The highest negative regional shift effect is observed in wholesale and retail trade followed by other service activities; transport and storage; administrative and support service activities; information and communication; arts, entertainment, and recreation; real estate activities; and financial and insurance activities.
Expanding distributive and producer services will help increase productivity, particularly in agriculture, as it employs almost half of the workforce of the region. The designation of BLISTT3 and Eastern Kalinga as regional growth centers should help boost the services sector. Successful implementation of local culture and arts council activities and initiatives should contribute to growing the personal services in the region. These will assist CAR’s vision toward being a self-reliant region rooted in its rich culture and heritage (NEDA RO CAR 2017).
Ilocos (Region I)
In 2018, the GRDP of Ilocos region was recorded at PHP 548 billion. With a population of 5.33 million, the region has a per capita GRDP of PHP 102,819. Its poverty incidence of 8.7 percent ranks fourth to the lowest across all regions in the Philippines.
3 Also known as Metro Baguio. It is an agglomeration of the city of Baguio and five municipalities of Benguet province, namely, La Trinidad, Itogon, Sablan, Tuba, and Tublay.

44
Regional Analysis of the Philippine Services Sector
In terms of regional shift, the region is competitive in wholesale and retail trade; accommodation and food service activities; professional, scientific, and technical activities; social services (education and human health and social work activities); financial and insurance activities; and real estate activities. The region also showed negative effects in services such as transport and storage; other service activities; administrative and support service activities; arts, entertainment, and recreation; and information and communication.
Since the region envisions to be the agribusiness, industrial, and tourism hub of the Northern Philippines (NEDA RO I 2017), efficient distributive and producer services, as well as competitive personal services, will be needed. Prioritizing services such as transportation and storage, information and communications, and arts and entertainment will help in achieving the region’s goals.
Cagayan Valley (Region II)
The Cagayan Valley region ranks fourth to the lowest in terms of both GRDP and population, with PHP 303 billion and 3.64 million, respectively. Its per capita GRDP is PHP 83,158, while poverty incidence is recorded at 15.3 percent.
It is competitive in accommodation and food service activities; wholesale and retail trade; professional, scientific, and technical activities; arts, entertainment, and recreation; information and communication; human health and social work activities; and real estate activities while shows locational disadvantage in other service activities; administrative and support service activities; education; transport and storage; and financial and insurance activities.
In the medium-term, the region seeks to establish itself as the “prime water resource, agro-industrial hub, and emerging tourism destination” (NEDA RO II 2017) in the country. Producer and distributive services will add value to the region through improved agricultural productivity. Transport and storage, as well as financial services, will need to grow not only to support tourism but also to strengthen market connectivity. To enhance the human resources of the region, access to education services will also need to increase.

45
Harnessing Services for Regional Development
Central Luzon (Region III)
Central Luzon has the third-highest GRDP of PHP 1.62 trillion in 2018 and a population of 11.59 million. Its strategic location links the abundant resources of Northern Luzon to the market consumers in NCR. With a poverty incidence of 7.8 percent, it ranks third to the lowest across all regions in the Philippines.
In terms of regional shift, the region is competitive in services, such as wholesale and retail trade; education; professional, scientific, and technical activities; real estate activities; human health and social work activities; and information and communication sectors. In contrast, it has displayed locational disadvantage in financial and insurance activities; accommodation and food service activities; arts, entertainment, and recreation; transport and storage; administrative and support service activities; and other service activities. The region will need to address the weaknesses in these industries to achieve its vision of having “a globally competitive human resources, a highly productive and profitable agricultural sector, seamless and integrated physical access, and a transshipment and logistics hub in the Asia-Pacific region” (NEDA RO III 2017). It should take advantage of its strategic position as the only region that can be accessed through three international gateways with another international airport on the rise. Focusing on distributive services, particularly transport and storage, can help propel the region to become a major logistics hub.
CALABARZON (Region IVA)
CALABARZON is the most populous region in the Philippines with an estimate of 14.92 million in 2018. With advantages, such as having a huge population size, a hub for manufacturing industry, an abundance of agricultural products, a close proximity to NCR, and a strategic location connecting to the south part of the Philippines, the region was the second-highest contributor of the Philippine economy. In 2018, its GRDP reached PHP 2.57 trillion (14.76% of GDP). It also has the second to the lowest poverty incidence of 7.6 percent.
Except for human health and social work activities, all services sector has been thriving with wholesale and retail trade as leading

46
Regional Analysis of the Philippine Services Sector
subsector followed by other service activities; transport and storage; education; administrative and support service activities; accommodation and food service activities; information and communication; financial and insurance activities; arts, entertainment, and recreation; real estate activities; and professional, scientific, and technical activities.
With its proximity to NCR, a large population, and thriving manufacturing industries, the region remains an attractive investment destination (NEDA RO IVA 2017). Distributive and producer services, such as wholesale and retail trade, transport and storage, and administrative and support service activities, continue to add value to the manufacturing sector. Apart from these services, the information and communications service sector is also seen to provide solutions that will boost the region’s agricultural sector and help it transform towards agribusiness, agro-ecotourism, and organic product production. The knowledge economy has also been flourishing through multinational investments in BPO, information technology, and creative industry sectors. Such may also be attributed to the growth of the education sector, which implies the provision of competent human resources. Accommodation and food service activities should also be utilized to achieve the region’s goal of becoming a world-class destination for tourism. Human health and social work activities will need to expand to ensure that the quality of life in the region will not deteriorate with industrialization.
MIMAROPA (Region IVB)
The MIMAROPA region has the third to the lowest GRDP of about PHP 274 billion. It is also the third least populous region at 3.28 million. The region’s per capita GRDP is PHP 83,614, while its poverty incidence is at 15 percent.
In terms of regional shift effects, it is competitive in wholesale and retail trade; accommodation and food service activities; administrative and support service activities, as well as transport and storage; education; other service activities; professional, scientific, and technical activities; and arts, entertainment, and recreation. The region exhibited locational disadvantage in financial and insurance activities; human health and social work activities; information and communication; and real estate activities.
The region was also the second-fastest growing economy in 2018 (PSA 2019). The region aims to achieve sustainable growth through
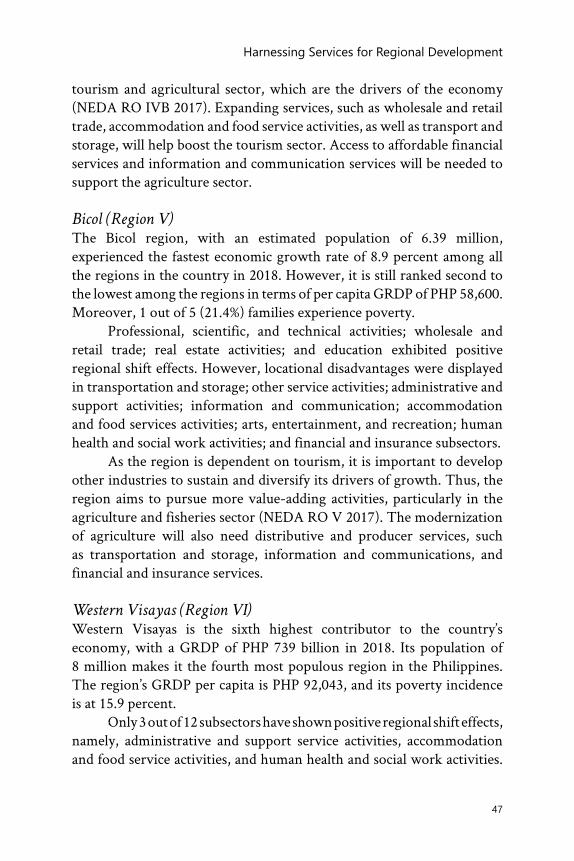
47
Harnessing Services for Regional Development
tourism and agricultural sector, which are the drivers of the economy (NEDA RO IVB 2017). Expanding services, such as wholesale and retail trade, accommodation and food service activities, as well as transport and storage, will help boost the tourism sector. Access to affordable financial services and information and communication services will be needed to support the agriculture sector.
Bicol (Region V)
The Bicol region, with an estimated population of 6.39 million, experienced the fastest economic growth rate of 8.9 percent among all the regions in the country in 2018. However, it is still ranked second to the lowest among the regions in terms of per capita GRDP of PHP 58,600. Moreover, 1 out of 5 (21.4%) families experience poverty.
Professional, scientific, and technical activities; wholesale and retail trade; real estate activities; and education exhibited positive regional shift effects. However, locational disadvantages were displayed in transportation and storage; other service activities; administrative and support activities; information and communication; accommodation and food services activities; arts, entertainment, and recreation; human health and social work activities; and financial and insurance subsectors.
As the region is dependent on tourism, it is important to develop other industries to sustain and diversify its drivers of growth. Thus, the region aims to pursue more value-adding activities, particularly in the agriculture and fisheries sector (NEDA RO V 2017). The modernization of agriculture will also need distributive and producer services, such as transportation and storage, information and communications, and financial and insurance services.
Western Visayas (Region VI)
Western Visayas is the sixth highest contributor to the country’s economy, with a GRDP of PHP 739 billion in 2018. Its population of 8 million makes it the fourth most populous region in the Philippines. The region’s GRDP per capita is PHP 92,043, and its poverty incidence is at 15.9 percent.
Only 3 out of 12 subsectors have shown positive regional shift effects, namely, administrative and support service activities, accommodation and food service activities, and human health and social work activities.

48
Regional Analysis of the Philippine Services Sector
Other services, such as transport and storage; education; other service activities; wholesale and retail trade; financial and insurance activities; information and communication; professional, scientific, and technical activities; real estate activities; and arts, entertainment, and recreation, have shown locational disadvantage.
Western Visayas depends mainly on its agriculture and the tourism sectors. Its typography, however, poses a disadvantage to its growth. Hence, strengthening its transport and storage, as well as information and communications subsectors, will help link the various islands that comprise the region (NEDA RO VI 2017). Education services, which is critical for human capital development, must also be accessible throughout the region.
Central Visayas (Region VII)
The region’s GRDP is PHP 1.16 trillion, making it the fourth-biggest contributor to the Philippine economy. With a population estimate of 7.8 million, its per capita GRDP is PHP 148,067. Although it is regionally competitive in the economy, 1 out of 5 (19%) families still experience poverty, which is mainly attributed to the geographical disadvantages and concentration of the economy and population in Metro Cebu.
In terms of regional effects, Central Visayas is competitive in accommodation and food service activities; transport and storage; other service activities; arts, entertainment, and recreation; administrative and support service activities; and real estate subsectors. On the other hand, the wholesale and retail trade sector experienced the highest locational disadvantage, followed by education; human health and social work activities; financial and insurance activities; professional, scientific, and technical activities; and information and communication.
Central Visayas aims to achieve geographically balanced development. As such, the government has been strengthening the country’s transport system by building roads and ports (NEDA RO VII 2017). In addition to investment in infrastructure, distributive and producer services will need to expand for the region to remain competitive. Social services, such as education and human health, and social work activities, are also important for long-term development.
49
Harnessing Services for Regional Development
Eastern Visayas (Region VIII)
Eastern Visayas recorded a GRDP of PHP 355 billion in 2018. With a population of 4.79 million, it ranked fourth to the lowest in per capita GRDP (PHP 73,996). The region also has the third to the highest rate of poverty incidence (30.4%) among all the regions in the country.
Wholesale and retail trade was the only sector with a positive regional shift effect, with all the other service sectors displaying locational disadvantages.
Leyte has one of the biggest geothermal power plants in the Visayas region and is home to the copper smelting and refining operations of the Philippine Associated Smelting and Refining Corporation—the country’s only copper smelting and refining firm and also one of the biggest in Asia. Distributive and producer services are necessary for creating a competitive downstream copper industry and other business activities in agriculture and fishery to support the economic rehabilitation of the region that was devastated by Super Typhoon Yolanda (NEDA RO VIII 2017). Improving connectivity and the availability of personal services will help boost tourism, particularly ecotourism. Strengthening the human resources of the region through education and health services is also important to reduce poverty in the medium to long term.
Zamboanga Peninsula (Region IX)
In 2018, the GRDP of the Zamboanga Peninsula reached PHP 342 billion. In the same year, its population reached 3.96 million, resulting in a per capita GRDP of PHP 86,368. It has a poverty incidence of 32.4 percent—the second-highest in the country.
In terms of regional shift effects, the region was competitive in transport and storage; information and communication; and professional, scientific, and technical activities. However, it showed locational disadvantages in wholesale and retail trade; education; other service activities; administrative and support service activities; accommodation and food service activities; human health and social work activities; financial and insurance activities; real estate activities; and arts, entertainment, and recreation.
As the region envisions to become the “center of Sustainable Agri-Fishery Industries of the Philippines” in the medium

50
Regional Analysis of the Philippine Services Sector
term (NEDA RO IX 2017), it cannot ignore its distributive and producer services, such as wholesale and retail trade and financial and insurance services. Expansion in personal service activities would create jobs for low-skilled workers, while investments in education and health would contribute to human capital development.
Northern Mindanao (Region X)
Northern Mindanao was the seventh biggest regional economy in 2018. Its GRDP and population reached PHP 692 billion and 4.93 million, respectively, resulting in a per capita GRDP of PHP 140,224. Moreover, 1 in every 4 families in the region lives below the poverty threshold.
The region exhibited a positive shift effect in wholesale and retail trade, information and communication, real estate activities, human health and social work activities, and transport and storage. While locational disadvantage was observed in accommodation and food service activities; other service activities; administrative and support service activities; professional, scientific, and technical activities; arts, entertainment, and recreation; education; and financial and insurance activities.
Distributive services will help meet the region’s vision to become the gateway and leading industrial base and trade center in Southern Philippines (NEDA RO X 2017). However, competitive producer services, such as financial and insurance activities; professional, scientific, and technical activities; and administrative and support service activities are also necessary for industrialization.
Davao (Region XI)
Together with MIMAROPA, Davao was also named as the second fastest-growing region in 2018. In the same year, the region contributed 4.69 percent of the country’s total GDP (PHP 817 billion). Its population was estimated at about 5.25 million in 2018, resulting in a GRDP per capita of PHP 155,657—the fourth highest in the country. The region’s poverty incidence was at 17.7 percent.
Positive regional shift effects were highest in education, followed by transport and storage; information and communication; real estate activities; and professional, scientific, and technical activities. Locational disadvantages were observed the most in wholesale and retail trade followed by administrative and support service activities; human health

51
Harnessing Services for Regional Development
and social work activities; financial and insurance activities; other service activities; accommodation and food service activities, and in arts, entertainment, and recreation.
Most of the priority industry clusters of the region are agriculture and fisheries-based (14 out of the 18). These industries, however, face several challenges, such as inadequate logistics and infrastructure, weak market linkages (including insufficient market information), and inadequate technical or extension services (NEDA RO XI 2017). While the region has displayed locational advantages in a number of distributive and producer services as earlier identified, further expansion of these services will be needed to support the growth of priority industries.
SOCCSKSARGEN (Region XII)
The provinces of South Cotabato, Cotabato, Sultan Kudarat, Sarangani, and General Santos, collectively called SOCCSKSARGEN, had an estimated population of 4.87 million in 2018. It also generated PHP 473 billion in GRDP in the same year or a GRDP per capita of PHP 97,034. Poverty remains the major concern of the region, with a 27.2 percent poverty incidence.
In terms of regional shift effects, locational advantages were exhibited in transport and storage; education; wholesale and retail trade; administrative and support service activities; human health and social work activities; real estate activities; and professional, scientific, and technical activities. In contrast, the region was not competitive in accommodation and food service activities; arts, entertainment, and recreation; other service activities; information and communication; and financial and insurance activities.
The region adopts a sustainable agri-industrial development strategy to realize its vision of being an agri-industrial hub and ecotourism center in Southern Philippines (NEDA RO XII 2017). Given its aspirations, there is a need for efficient distributive services and producer services to support the region’s goal—becoming an agri-industrial hub. Information and communications services and financial and insurance activities must be specially strengthened given the locational disadvantage exhibited by the region in these services. Competitive personal services will also need to be made available to develop ecotourism in the region.
52
Regional Analysis of the Philippine Services Sector
Caraga (Region XIII)
Caraga’s contribution to the economy was the second-lowest among the regions, with just PHP 194 billion in 2018. It is also among the least populous with only 2.89 million people, resulting in a GRDP per capita of PHP 67,228—the third-lowest in the country. Moreover, it has a high poverty incidence at 28.3 percent.
The region displayed locational advantages in administrative and support service activities; financial and insurance activities; real estate activities; professional, scientific, and technical activities; wholesale and retail trade; arts, entertainment, and recreation; other service activities; and information and communication. However, Caraga region did not show competitiveness in transport and storage; accommodation and food service activities; education; and human health and social work activities.
As the region aspires to be the fishery, agro-forestry, mineral, and ecotourism center of the country, it will be important to increase the productivity of these industries through processing and value-adding activities (NEDA RO Caraga 2017). While locational advantages have been displayed in most distributive and producer services, further growth of these sectors must be ensured, and the weakness in transport and storage be addressed. Personal services would also need to expand to support ecotourism. Investment in human capital through education and health services is needed to sustain the region’s development and growth.
Autonomous Region in Muslim Mindanao (ARMM)4
The ARMM recorded a GRDP of PHP 129 billion in 2018. With a population of almost 4 million, its per capita GRDP was recorded at PHP 32,220. Around half (55.4%) of the families live below the poverty threshold.
The region displayed positive shift effects in administrative and support service activities, human health and social work activities, and financial and insurance activities service sector. In wholesale and retail trade, the region had locational disadvantages. In addition, negative regional shift effects were observed in education; transport and storage; accommodation and food service activities; other service activities;
4 It should be noted that the shift-share analysis used data for the years 2012 and 2018, which were generated before the creation of the Bangsamoro Autonomous Region in Muslim Mindanao.
53
Conclusion
real estate activities; professional, scientific, and technical activities; information and communication; and arts, entertainment, and recreation.
Agriculture, forestry, and fishing industries account for 60 percent of the local economy. Making sure that distributive and producer services, such as wholesale and retail trade; transport and storage; real estate activities; professional, scientific, and technical activities; and information and communication, are available throughout the whole region will help improve productivity in the agriculture, forestry, and fishing industries. Expanding education services must also be a priority for the long-term development of the region.
Conclusion
Using a simple shift-share decomposition technique, this paper identified the regions with locational advantages and disadvantages in terms of their service industries. When used in combination with other analytical techniques, shift-share can help better understand a region’s economic potential and constraints.
Since it is purely a descriptive tool, further studies will be needed to explain the factors influencing sectoral changes at the regional level. Moreover, this paper adopted the standard shift-share model and examined only the changes in employment due to data limitations. Future work may either explore more sophisticated techniques and other economic variables or further disaggregate the sectors of interest.
Both demand-side and supply-side factors influence the expansion of services. As services are critical for production, human capital development, and enhancing the quality of life more broadly, understanding the drivers or inhibitors of services growth and addressing the locational weaknesses in the relevant service industries will be useful in promoting regional growth and a more balanced economic development for the country.


55
References
Begg, I. 1993. The service sector in regional development. Regional Studies 27(8):817–825.
Brillantes Jr., A., K.D. Brillantes, and J.B. Jovellanos. 2018. Process evaluation of the CHED K to 12 Adjustment Assistance Program. PIDS Discussion Paper Series No. 2018-05. Quezon City, Philippines: Philippine Institute for Development Studies. https://pidswebs.pids.gov.ph/CDN/PUBLICATIONS/pidsdps1805.pdf (accessed on May 10, 2021).
Browning, H.L. and J. Singelmann. 1975. The Emergence of a Service Society:
Demographic and Sociological Aspects of the Sectoral Transformation
of the Labor Force in the U.S.A. Springfield, VA: National Technical Information Service.
Chilian, M. 2012. Evolution of regional and sub-regional disparities in Romania: A sectoral shift-share analysis. Journal for Economic Forecasting 15:87–204.
Cuadrado-Roura, J.R. 2013. Towards increasingly ‘tertiarised’ economies: Facts, factors, and prospects. In Service industries and regions: Growth, location
and regional effects, edited by J.R. Cuadrado-Roura. Berlin/Heidelberg, Germany: Springer-Verlag.
———. 2016. Service industries and regional analysis: New directions and challenges. Journal of Regional Research 36:107–127.
Esteban-Marquillas, J.M. 1972. A reinterpretation of shift-share analysis. Regional and Urban Economics 2(3):249–255.
Fiorini, M. and B. Hoekman. 2018. Services trade policy and sustainable development. World Development 112:1–12.
Hallward-Driemeier, M. and G. Nayyar. 2018. Trouble in the making? The future of
manufacturing-led development. Washington, D.C.: World Bank.Huggins, R. 2011. The growth of knowledge-intensive business services: Innovation,
markets, and networks. European Planning Studies 19(8):1459–1480.International Monetary Fund (IMF). 2018. Measuring the digital economy.
IMF Policy Paper. https://www.imf.org/en/Publications/Policy-Papers/Issues/2018/04/03/02 2818-measuring-the-digital-economy (accessed on December 10, 2019).
Knudsen, D. 2000. Shift-share analysis: Further examination of models for the description of economic change. Socio-Economic Planning Sciences 34(3):177–198.
Loveridge, S. 1995. A Practical Approach to Shift-Share Analysis. Community
Development Society 26(1):110–124.
56
Regional Analysis of the Philippine Services Sector
Manasan, R. and R. Mercado. 1999. Regional economic growth and convergence in the Philippines: 1975–1997. PIDS Discussion Paper Series 1999-13. Makati, Philippines: Philippine Institute for Development Studies. https://dirp3.pids.gov.ph/ris/ris/pdf/pidsdps9913.PDF (accessed on February 25, 2019).
Margaritis, D., F. Scrimgeour, M. Cameron, and J. Tessler. 2005. Productivity and Economic Growth in Australia, New Zealand and Ireland. Agenda - A
Journal of Policy Analysis and Reform 12(4):291–308.Mayor, M. and A. Lopez-Menendez. 2005. The spatial shift-share analysis:
New developments and some findings for the Spanish case. 45th Congress of the European Regional Science Association. Asturias, Spain: Department of Applied Economics, University of Oviedo. https://www.researchgate.net/publication/23731795_The_spatial_shift-share_analysis_-_new_developments_and_some_findings_for_the_Spanish_case (accessed on February 25, 2019).
National Board of Trade. 2012. Everybody in services: The impact of servicification
in manufacturing on trade and trade policy. Stockholm, Sweden: National Board of Trade.
———. 2013. Just add services: A case study on servicification and the agrifood sector. Stockholm, Sweden: National Board of Trade.
National Economic and Development Authority. 2017. Philippine Development
Plan 2017–2022. Pasig City, Philippines: NEDA.National Economic and Development Authority Regional Office CAR (NEDA
RO CAR). 2017. Cordillera Administrative Region Regional Development
Plan, 2017–2022. Benguet, Philippines: NEDA RO CAR.National Economic and Development Authority Regional Office Caraga (NEDA
RO Caraga). 2017. Caraga Regional Development Plan, 2017–2022. Agusan del Norte, Philippines: NEDA RO Caraga.
National Economic and Development Authority Regional Office I (NEDA RO I). 2017. Ilocos Regional Development Plan, 2017–2022. La Union, Philippines: NEDA RO I.
National Economic and Development Authority Regional Office II (NEDA RO II). 2017. Cagayan Valley Regional Development Plan, 2017–2022. Cagayan, Philippines: NEDA RO II.
National Economic and Development Authority Regional Office III (NEDA RO III). 2017. Central Luzon Regional Development Plan 2017-2022. Pampanga, Philippines: NEDA RO III.
National Economic and Development Authority Regional Office IVA (NEDA RO IVA). 2017. Calabarzon Regional Development Plan 2017–2022. Laguna, Philippines: NEDA RO IVA.
National Economic and Development Authority Regional Office IVB (NEDA RO IVB). 2017. MIMAROPA Regional Development Plan, 2017–2022. Mindoro Oriental, Philippines: NEDA RO IVB.

57
References
National Economic and Development Authority Regional Office IX (NEDA RO IX). 2017. Zamboanga Peninsula Regional Development Plan 2017–2022.
Zamboanga del Sur, Philippines: NEDA RO IX.National Economic and Development Authority Regional Office V (NEDA
RO V). 2017. Bicol Region Regional Development Plan 2017–2022. Albay, Philippines: NEDA RO V.
National Economic and Development Authority Regional Office VI (NEDA RO VI). 2017. Western Visayas Regional Development Plan 2017–2022. Iloilo, Philippines: NEDA RO VI.
National Economic and Development Authority Regional Office VII (NEDA RO VII). 2017. Central Visayas Regional Development Plan 2017–2022. Cebu, Philippines: NEDA RO VII.
National Economic and Development Authority Regional Office VIII (NEDA RO VIII). 2017. Eastern Visayas Regional Development Plan 2017–2022. Leyte, Philippines: NEDA RO VIII.
National Economic and Development Authority Regional Office X (NEDA RO X). 2017. Northern Mindanao Regional Development Plan 2017–2022. Misamis Oriental, Philippines: NEDA RO X.
National Economic and Development Authority Regional Office XI (NEDA RO XI). 2017. Davao Regional Development Plan 2017–2022. Davao del Sur, Philippines: NEDA RO XI.
National Economic and Development Authority Regional Office XII (NEDA RO XII). 2017. Regional Development Plan 2017–2022. South Cotabato, Philippines: NEDA RO XII.
Organisation for Economic Co-operation and Development (OECD), World Trade Organization (WTO), and International Monetary Fund (IMF). 2019. Handbook on measuring digital trade, Version 1. http://www.oecd.org/sdd/its/Handbook-on-Measuring-Digital-Trade.htm (accessed on March 4, 2020).
Ortiz, M.K., K.A. Melad, N.V. Araos, A. Orbeta Jr., and C. Reyes. 2019. Process evaluation of the Universal Access to Quality Tertiary Education Act (RA 10931): Status and prospects for improved implementation. PIDS Discussion Paper Series No. 2019-36. Quezon City, Philippines: Philippine Institute for Development Studies. https://pidswebs.pids.gov.ph/CDN/PUBLICATIONS/pidsdps1936.pdf (accessed on May 10, 2021).
Office for National Statistics (ONS). 2018. Examining regional gross value added growth in the UK: 1998 to 2016. https://www.ons.gov.uk/economy/nationalaccounts/uksectoraccounts/compendium/economicreview/april2018/examiningregionalgrossvalueaddedgrowthintheuk1998to2016 (accessed on February 25, 2020).
58
Regional Analysis of the Philippine Services Sector
Oguz, S. and J. Knight. 2010. Regional economic indicators: A focus on regional gross value added using shift-share analysis. Economic and Labour Market
Review 4(8):74–87.Otsuka, A. 2016. Regional energy demand in Japan: Dynamic shift-share analysis.
Energy, Sustainability and Society 6(10). https://energsustainsoc.biomedcentral.com/articles/10.1186/s13705-016-0076-x (accessed on March 21, 2019).
Pasadilla, G. and C. Liao. 2007. Has liberalization strengthened the link between services and manufacturing? PIDS Discussion Paper Series 2007-13. Makati City, Philippines: Philippine Institute for Development Studies. https://pidswebs.pids.gov.ph/CDN/PUBLICATIONS/pidsdps0713.pdf (accessed on February 25, 2019).
Philippine Statistics Authority. n.d.-a. 2009–2018 Gross regional domestic product (at current and constant 2000 prices, as of April 25, 2019). Quezon City, Philippines: PSA. https://psa.gov.ph/grdp/data-series (accessed on September 28, 2019).
———. n.d.-b. Table 1. First semester per capita poverty threshold and poverty incidence among families with measures of precision, by region and province: 2015–2018. Quezon City, Philippines: PSA. https://psa.gov.ph/poverty-press-releases/data (accessed on September 29, 2019).
———. n.d.-c. Labor Force Survey 2012 annual estimates. Quezon City, Philippines: PSA. http://www.psa.gov.ph/statistics/survey/labor-and-employment/labor-force-survey/table (accessed on November 15, 2019).
———. n.d.-d. Labor Force Survey 2018 annual estimates. Quezon City, Philippines: PSA. http://www.psa.gov.ph/statistics/survey/labor-and-employment/labor-force-survey/table (accessed on November 15, 2019).
Quintero, J. 2007. Regional economic development: An economic base study and shift-share analysis of Hays County, Texas. San Marcos, TX: Masters of Public Administration, Texas State University.
Rubalcaba, L. and H. Kox. 2007. Business services in European economic growth. Houndmills Basingstoke, UK: Palgrave MacMillan.
Scharpf, F.W. 1990. Structures of postindustrial society or does mass unemployment disappear in the service and information economy?. In Labor market adjustments to structural change and technological progress, edited by E. Appelbaum and R. Schettkat. New York, NY: Praeger Publishers.
Schettkat, R. and L. Yocarini. 2003. The shift to services : A review of the literature. IZA Discussion Papers. Bonn, Germany: Institute for the Study of Labor (IZA).
Serafica, R.B. 2016. Why manufacturing resurgence will mean more services, not less. PIDS Discussion Paper Series No. 2016-46, Quezon City, Philippines: Philippine Institute for Development Studies. https://pidswebs.pids.gov.ph/CDN/PUBLICATIONS/pidsdps1646.pdf (accessed on February 25, 2019).
59
Sila, U., H. Morgavi, and J. Dall’Orso. 2017. Trends in productivity and sources of productivity growth in Slovenia. OECD Economics Department Working Papers 1368. Paris, France: OECD Publishing.
Toh, R, H. Khan, and L.L. Lim. 2004. Two-stage shift-share analyses of tourism arrivals and arrivals by purpose of visit: The Singapore experience. Journal
of Travel Research 43(1):57–66. United Nations Conference on Trade and Development (UNCTAD). 2004.
World Investment Report 2004: The shift towards services. New York, NY, and Geneva, Switzerland: United Nations.
———. 2017. Services and structural transformation for development. New York, NY, and Geneva, Switzerland: United Nations.
World Bank. n.d. World development indicators. Washington, D.C.: World Bank. https://databank.worldbank.org (accessed on April 15, 2019).


61
The Authors
Ramonette B. Serafica is a senior research fellow at the Philippine Institute for Development Studies (PIDS). She has a PhD in Economics from the University of Hawai’i at Manoa and has worked on several researches in the field of services policy, regulation, and trade in services.
Jean Colleen M. Vergara is a former research analyst at PIDS. She has a BS in Business Economics from the University of the Philippines (UP) Diliman and is taking her Juris Doctor degree at the San Beda University in Manila.
Queen Cel A. Oren is a research analyst at PIDS. She has a BS in Statistics from UP Diliman and is studying MA Psychology at the same university.