Embed Size (px)
Citation preview
Asia Pacific Journal of Education, Arts and Sciences, Vol. 4 No. 1, January 2017 _________________________________________________________________________________________________________
1 P-ISSN 2362-8022 | E-ISSN 2362-8030 | www.apjeas.apjmr.com
Regional Differences in Maternal Mortality in
the Philippines
Mark Anthony Mujer Quintos
University of the Philippines Los Baños, Laguna, Philippines
Date Received: November 21, 2016; Date Revised: January 30, 2017
Asia Pacific Journal of
Education, Arts and Sciences
Vol. 4 No.1, 1-14
January 2017
Part II
P-ISSN 2362-8022
E-ISSN 2362-8030
www.apjeas.apjmr.com
Abstract - This research was launched in order to
determine the differences in the access to health
services and rate of maternal mortality between the 17
regions of the Philippines over a period of almost 40
years. Two different publications – the Philippine
Health Statistics (PHS) and the Philippine
Demographic and Health Surveys (DHS) – were used
as sources of secondary data. The study found that
regions in Luzon, especially the National Capital
Region, generally have lower rates of maternal
mortality than the regions in Visayas and Mindanao.
This may be because of a large disparity between the
women residing in Luzon, particularly in NCR, and
those residing in Visayas and Mindanao in their
access to health care services. However, it must be
noted that even regions in Luzon, except for NCR,
generally suffer low rates of access to health facilities
during childbirth and access to skilled delivery care.
This leads to the observation that there is a large
disparity in development in the Philippines in terms of
health care, with much of the development being
centralized in NCR while the rest of the 16 regions of
the Philippines are left behind. The study also found
that there is a large difference in access to health care
services among the women in the country, with the
highly educated and wealthy enjoying greater access
to health care services than the poor and uneducated.
Recommendations for further research on the matter
are provided.
Keywords – Inequality, Maternal Mortality,
Philippines, Healthcare
INTRODUCTION
Central to the survival of the human species is the
process of reproduction wherein the species replaces
its new members with new ones. No species is
immortal and its members eventually die over the
course of time. New members of the species must be
born in order to replace those who have died. Human
beings are not exempt from this. Though the
populations of human societies grow through a
combination of both fertility and migration, it is only
through reproduction that human civilization as a
whole replaces its lost members. It is ironic that it is
also within this process that the mother is in great
risks of dying. From gestation to parturition, the life of
the mother is constantly in danger. As it is often said
in the Tagalog regions of the Philippines, ―When you
are giving birth, it‘s almost as if one of your foot is
already under the grave‖ – a proverb brought about by
the shared experiences of women from on how much
peril a mother faces every time she gives birth.
Thanks to developments in medical knowledge and
technology, it is possible to lessen the risk of dying for
the mother. The question, however, is whether women
from all parts of the country are able to take advantage
of these health care services.
At the onset of the new millennium, a convention
at the United Nations headquarters in New York was
held. It was attended by 147 world leaders
representing 189 member countries of the United
Nations with the intention of reducing the gap in the
pace of development between the member countries.
This convention resulted in the formulation of the
eight priorities which the convention believed would
serve as an effective ‗blueprint‘ for social and
economic progress. They named these eight priorities
as the Millennium Development Goals (MDG). One
of these goals is MDG 5: Improve Maternal Health.
The fifth MDG is aimed at reducing the number of
women who die due to pregnancy-related causes. The
primary method by which the member countries
would proceed in achieving this goal is by increasing
the accessibility of health services that cater to the
needs of the mother. These health services include
obstetrical care during pregnancy and during
parturition such as access to health facilities during
childbirth and skilled assistance during childbirth. It
must be noted that an improvement in the access to
health care for mothers is also beneficial for the
children. It has been observed in empirical studies that
Asia Pacific Journal of Education, Arts and Sciences, Vol. 4 No. 1, January 2017 _________________________________________________________________________________________________________
2 P-ISSN 2362-8022 | E-ISSN 2362-8030 | www.apjeas.apjmr.com
improving mothers‘ access to health care is an
effective way to reduce the rate of mothers dying due
to pregnancy-related causes as well as infant
mortality. Furthermore, it has been observed that a
considerable proportion of children who die are
motherless [1]. In addition, children who are
motherless have also been found to be shorter in
height and tend to have less years of schooling and
lower economic success [2]. Therefore, an
improvement in mothers‘ access to health care can be
crucial for the welfare of both the mother and the
child.
Maternal death is one of the widely utilized bases
of ascertaining three pertinent elements of social
development: (1) the overall health of a society, (2)
the status of women in a particular society, and (3) the
quality of health systems in a particular society [3]. Its
usefulness in describing the welfare of society as a
whole and in terms of the health of half of society‘s
constituents, as well as the health-related social
structures of a society, make maternal deaths a
phenomenon of interest in sociology and social
demography. The social scientific importance of
inquiries into maternal mortality is even more
pronounced because it serves not only as an indicator
of public health but also of social inequality.
Described as an ―avoidable crisis‖ [4], many cases of
maternal death could have been prevented if only the
mothers have quality and accessible emergency
obstetric care. Unfortunately, women of differing
nationalities, educational attainment, economic class,
race, and age differ in their chances of safe pregnancy
and childbirth due to their differing degrees of access
to necessary obstetric care – resulting in this unequal
access to reproductive health being regarded by some
sectors as a human rights violation [5]. The
inequality, however, is not limited to socio-economic
differences but also has a spatial element. Given the
nature of maternal mortality as a macro-phenomenon
related to public health, the experience of maternity
can also differ from one place to another due to spatial
differences in the degree of development of public
health institutions. The experience of an expectant
mother from a highly developed urban area, for
example, can be vastly different from that of an
expectant mother in a rural area. This urban-rural
difference in maternal experience can even be made
more complicated when taking into account the
differences in infrastructural development among
regions. In the last Philippine presidential elections,
the eventual-victorious candidate Rodrigo Roa Duterte
spoke of ―Imperial Manila‖ as part of his rhetoric in
favor of federalism and change in the country.
According to the rhetoric on Imperial Manila, much of
the funds, and consequently, the development in the
country are limited to Manila and its surrounding
areas which goes against the interest of the rest of the
country. This now begs the question: Is there veracity
to this claim as far as maternal health is concerned?
This study aims to compare the rates of maternal
death among the 17 regions of the country from the
1970s when the political/administrative regions were
first established by President Ferdinand Marcos to the
present. This is done not only to see how much
progress the Philippines has gone through in the past
four decades but also to see whether the regions are
benefitting equally in terms of improvements to
maternal health. Specifically, this study shall aim to
describe the trend in maternal mortality rate from the
1970s to the present for the Philippines as a whole and
determine if there are salient regional disparities in
maternal health.
Data Source
The study is conducted through secondary data
analysis. Two different series of publications were
utilized in order to obtain secondary data on specific
mortality rates and mother‘s access to health care. The
first publication is the Philippine Health Statistics or
the PHS annual reports. The PHS reports are statistical
reports published by the Department of Health (DOH)
through the National Epidemiology Center. It provides
statistical data on various aspects of health, with
particular attention being given to statistical data on
births and deaths. It is from the PHS reports that the
data utilized in this paper for the rates of maternal
death were obtained. PHS gathers its data through the
use of vital registers – primarily in the form of birth
and death certificates - provided by the Vital Statistics
Division of the Philippine Statistics Authority (PSA).
The statistical data found in PHS reports only account
for registered live births and deaths. It may suffer
from under-reporting or under-registration and it
cannot account for live births and deaths which have
not been reported to the PSA by the parties concerned.
A caveat should be noted at this point: vital
Statistics on deaths may be prone to under-
registration. For example, in a study by Kao, Chen,
Shi, and Weinrich [6] on the problem of under-
reporting and misclassification of maternal mortality
in Taiwan, they concluded that it would be incorrect
to depend only on death certificates as there is a
Asia Pacific Journal of Education, Arts and Sciences, Vol. 4 No. 1, January 2017 _________________________________________________________________________________________________________
3 P-ISSN 2362-8022 | E-ISSN 2362-8030 | www.apjeas.apjmr.com
substantial amount of under-reporting that is
happening, especially on maternal, stillbirth and fetal
deaths. In the Philippines, the issue of under-
registration is especially problematic in areas where
civil unrest is frequent such as the Autonomous
Region of Muslim Mindanao (ARMM). For this
reason, data from ARMM must be appreciated with
caution. There are several reasons why under-
reporting happens. Chief among these reasons is
neglect and inadequate training on the part of the
health worker. Under-reporting happens when the
health worker tasked with accomplishing the death
certificate neglects to provide an accurate
classification of the death or simply fail to provide an
accurate classification due to lack of training. For
example, when it comes to maternal and fetal deaths,
the health worker may miss certain indicators that
would classify the deaths as pregnancy-related [7].
Despite the potential limitation of publications based
on vital statistics like the PHS, it remains to be a more
preferable data source due to its attempt to be a
complete enumeration of vital events in the country as
opposed to its alternative: the Field Health Service
Information System. Just like the PHS, the FHSIS
reports are also published by the DOH. The main
purpose of FHSIS reports is to provide statistical data
on the status of public health programs. Its data are
obtained from the reports of local field health
personnel in public health facilities through the
regional and provincial health offices. The reports are
then consolidated at the Central Office. Just like the
PHS, FHSIS also have its own limitations. The main
limitation suffered by the FHSIS reports when used as
a secondary resource for studies of this nature is that
its data are obtained only from public health facilities.
Statistical data reflected in the FHSIS reports are only
those obtained from clients availing of health services
from public health facilities and it does not include
information which may be derived from clients
availing of health services from private health sectors.
The second source of secondary information
utilized by this study is the five reports on the
Philippines published by the Demographic and Health
Surveys or DHS. These are the 1993, 1998, 2003,
2008, and 2013 Philippine DHS. These reports are
based on data collected from a nationwide survey of
women aged 15-49 in the Philippines and are designed
to give access to policy-makers and researchers to up-
to-date information on various demographic topics
such as fertility rates, mortality rates, family planning,
and health. It is from these five DHS reports that this
study obtained the data for the percentage of women
residing in the various regions of the Philippines who
have access to various health services. It must be
noted that DHS reports on access to health services
span the period of five years each. For example, the
percentage of women who have access to a specific
health service included in the 1993 DHS report
represented the 1988 to 1993 time period.
RESULTS AND DISCUSSION
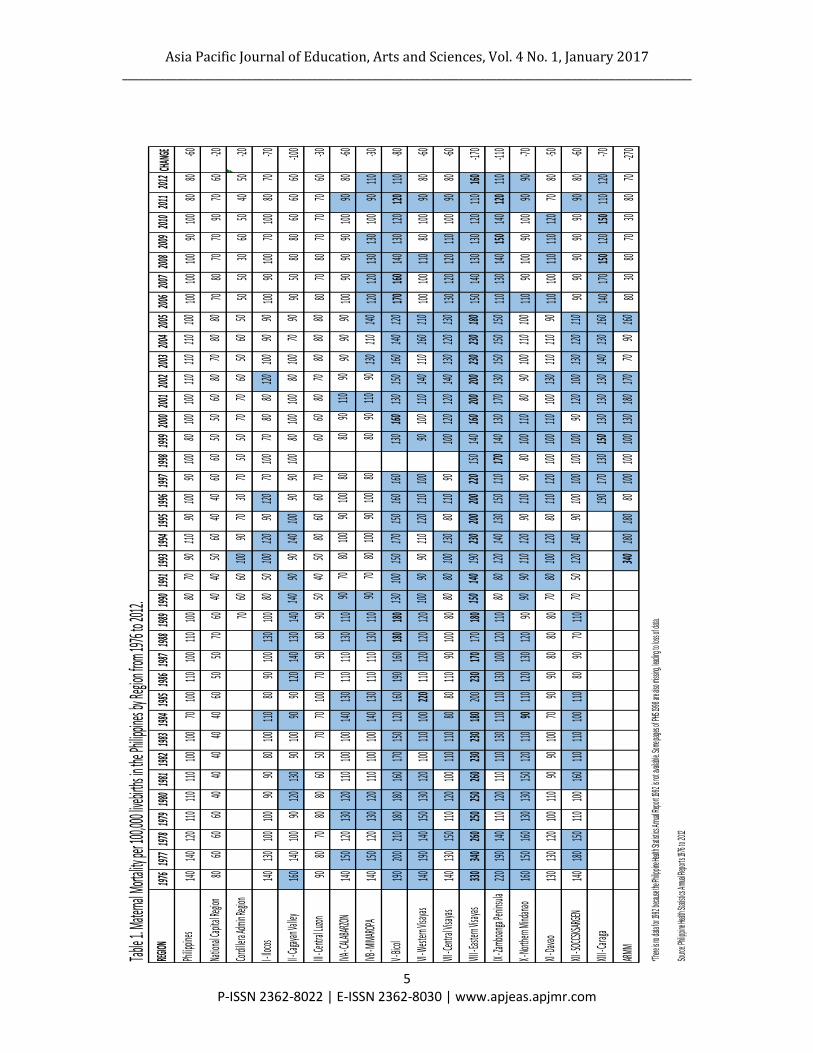
The data obtained from the PHS annual reports
show that the rate of maternal death in the country
improved from 1976 to the latest available report,
2012, with 140 women dying due to pregnancy-
related causes per 100,000 live births in 1976 to just
80 women dying per 100,000 live births in 2012. The
trend from 1976 to 2012 is not a steady decline but is
instead mired by fluctuations. For example, the
Maternal Mortality Ratio for 1988 was 110 mothers
dying per 100,000 live births, which declined to 100
by 1989, further down to 80 by 1990 and 70 by 1991.
However, this increased again to 90 by 1993 and 110
by 1994. Regardless of these fluctuations, the MMR
for the country has declined by 60 deaths from 1976
to 2012. It can therefore be said that there are
improvements in maternal health in the Philippines. In
order to provide a better analysis of the differences in
the trends of maternal mortality per 100,000 live
births of each region from 1976 to 2012, a tabular
summary of the 1976-2012 reports of the PHS is
provided in Table 1.
Table 1 is constructed in such a way that
important sections are already emphasized. The
bolded values highest reported MMRs for each
specific year. All values in shaded cells are values of
MMR which are above the national average – or the
values reported for the Philippines – during a specific
year. The last column, Change, is an indicator of how
much the mortality rate of the region has changed
from 1976 to 2012. The values under this columns are
obtained by subtracting the value under the column
2012 from the value under the column 1976. In cases
whereupon the region has no value for 1976, the
minuend becomes the value under the year when the
region first reported mortality rates. Analysis of the
contents of Table 1 yielded the following findings:
From 1976 to 2012, Region V-Bicol and the rest
of the regions in Visayas and Mindanao generally had
MMRs higher than the national average. This is
especially true for regions V-Bicol, VI-Western
Visayas, VII-Central Visayas, VIII-Eastern Visayas
Asia Pacific Journal of Education, Arts and Sciences, Vol. 4 No. 1, January 2017 _________________________________________________________________________________________________________
4 P-ISSN 2362-8022 | E-ISSN 2362-8030 | www.apjeas.apjmr.com
and IX-Zamboanga Peninsula which had MMRs
higher or equal to the national average for more than
90% of the time. This is indicative of a huge disparity
between the regions of Luzon and the regions of
Visayas and Mindanao in terms of the security that
women‘s lives have during pregnancy and childbirth.
While it cannot be categorically said that women‘s
lives during pregnancy and childbirth are safe in the
regions in Luzon, there is basis to say that
childbearing women of Luzon, except for those from
the Bicol region, enjoy relative security for their lives
during the reproductive process as compared to their
fellow Filipino women living in Visayas and
Mindanao. Second, the National Capital Region has
some of the lowest rates of Maternal Mortality. In
fact, it has the least maternal deaths per 100,000 live
births from 1976 to 1995. After 1995, it competes
with the Cordillera Administrative Region as the
region with the lowest MMR. Furthermore, its MMR
are always below the national average. Region III-
Central Luzon also consistently had MMRs lower than
the national average while CAR and Region IVA-
CALABARZON could follow suit, though these two
regions also have at least one year in their history
when the regional MMR is higher than the national
average. Meanwhile, Region VIII-Eastern Visayas has
the highest MMR for 26 of the 36 years analyzed in
the study.
Third, during 1976, NCR has the lowest MMR
while Region VIII-Eastern Visayas had the highest.
By 2012, CAR has the lowest MMR, with 10 less
maternal deaths per 100,000 livebirths than NCR.
Nevertheless, NCR reported the second lowest MMR
during 2012. On the other hand, Region VIII-Eastern
Visayas continues to hold the highest MMR in the
country. More worrisome is the fact that while the
region had an MMR of 110 during 2011, this once
again increased to 160 by 2012. Fourth, on its first
year of recognition as a region in 1993, ARMM
reported the highest MMR ever among all regions
from 1976 to 2012 with an MMR of 340 maternal
deaths per 100,000 live births (though it should be
noted that Region VIII-Eastern Visayas, also had an
MMR of 340 in 1977 – it‘s highest reported MMR in
the years included in the study). This MMR is more
than half of the usual respective MMR of the other
regions. From the year 1993 onwards, further analysis
of the table would show that the ARMM had the
biggest improvement in terms of MMR – reducing the
number of maternal deaths per 100,000 live births by
270 from 1993 to 2012. However, despite this huge
decrease in its MMR, it is possible that this is partially
skewed by the data limitations brought about by vital
registration problems experienced in ARMM.
Finally, the table would show that Region V-Bicol
and the Visayan and Mindanao regions generally have
the biggest decrease in MMR from 1976 to 2012.
Most notable of these are the decrease in maternal
deaths in Regions VIII-Eastern Visayas (less 170
maternal deaths per 100,000 livebirths), IX-
Zamboanga Peninsula (less 110 maternal deaths per
100,000 livebirths), and ARMM (less 270 maternal
deaths per 100,000 livebirths). Meanwhile, NCR and
CAR had the least decrease in MMR, though these
two regions have the lowest MMR among the regions.
A quick look at the shaded cells of Table 1 would
show the general pattern of the regional differences in
maternal mortality in the Philippines from 1976 to
2012. It can be observed that the shaded cells – which
denotes MMRs higher than the national average – are
concentrated in the regions south of the Metro Manila
area. This suggests a very Luzon-, and in particular, a
Manila-centric advantage against maternal deaths.
Access to Antenatal Care
What could be a possible explanation for these
substantial differences in the number of maternal
deaths? A mother‘s access to health care during her
gestation and parturition periods have been proven to
have an influence on her chances of survival.
Antenatal care has been found to be negatively
associated with maternal mortality [8]-[12]. This is
because many of the major causes of maternal death
are preventable if they are immediately acted upon by
skilled medical personnel. In their 2010 report, the
United Nations Development Programme (UNDP)
have observed that those areas with greater access to
antenatal care from skilled health workers have lower
rates of maternal mortality [13]. This study traced the
access to antenatal care from various providers of the
women of the 17 regions of the Philippines from 1988
to 2013 through the use of the 1993, 1998, 2003,
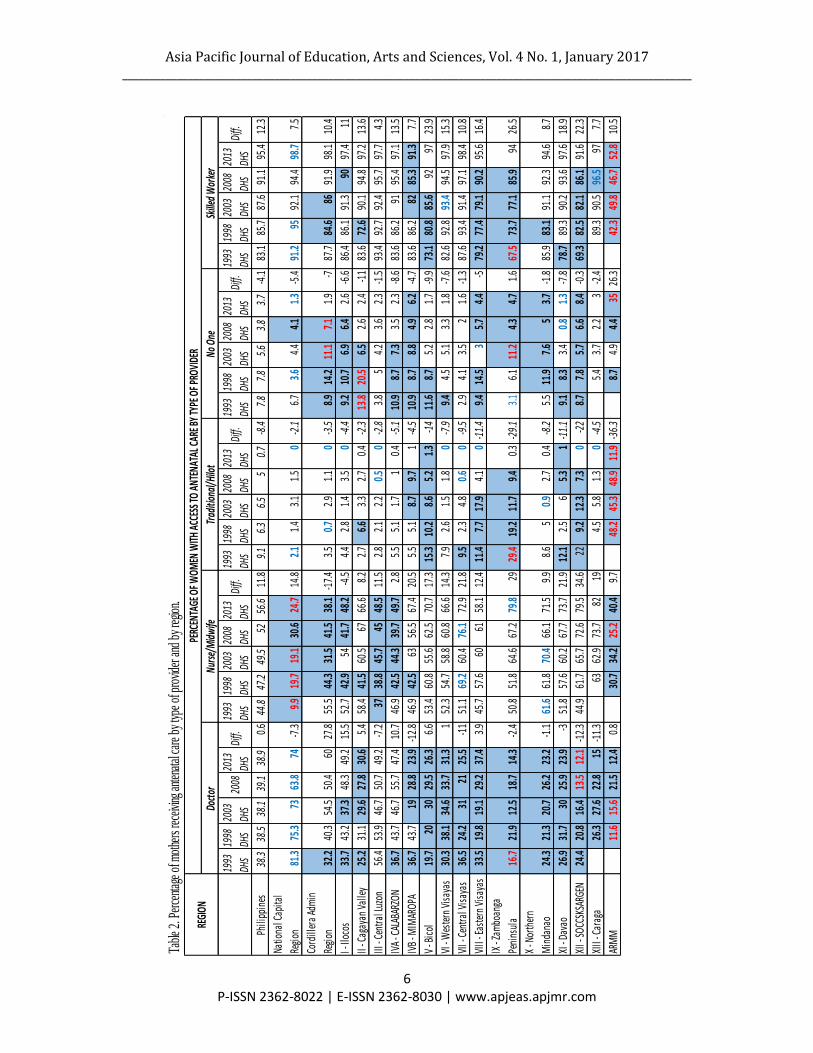
2008, and 2013 Philippine DHS reports. Table 2
summarizes the access to, and source of, antenatal
care of pregnant women in the Philippines.
From the table, it can be observed that from 1988
to 2013, majority of women had access to antenatal
care from skilled workers in all regions. In fact, by the
2008 DHS, roughly nine out of every ten women in all
regions have access to skilled antenatal care.
Asia Pacific Journal of Education, Arts and Sciences, Vol. 4 No. 1, January 2017 _________________________________________________________________________________________________________
5 P-ISSN 2362-8022 | E-ISSN 2362-8030 | www.apjeas.apjmr.com
Table 1
. Mate
rnal M
ortality
per 10
0,000
livebirt
hs in t
he Phi
lippine
s by R
egion
from 19
76 to 2
012.
REGION
1976
1977
1978
1979
1980
1981
1982
1983
1984
1985
1986
1987
1988
1989
1990
1991
1993
1994
1995
1996
1997
1998
1999
2000
2001
2002
2003
2004
2005
2006
2007
2008
2009
2010
2011
2012
CHAN
GE
Philipp
ines
140140
120110
110110
100100
70100
110100
110100
8070
90110
90100
90100
80100
100110
110110
100100
100100
90100
8080
-60
Natio
nal Ca
pital R
egion
8060
6060
4040
4040
4060
5050
7060
4040
5060
4040
6060
5050
6080
7080
8070
8070
7090
7060
-20
Cordill
era Ad
min Re
gion
7060
60100
9070
3070
5050
7070
6050
6050
5050
3060
5040
50-20
I - Iloc
os140
130100
10090
9080
100110
8090
100130
10080
50100
12090
12070
10070
8080
120100
9090
10090
10070
10080
70-70
II - Cag
ayan V
alley
160140
10090
120130
90100
9090
120140
130140
14090
90140
10090
90100
80100
10080
10070
9090
5080
8060
6060
-100
III - Ce
ntral L
uzon
9080
7080
8060
5070
70100
7090
8090
5040
5080
6060
7060
6080
7080
8080
8070
8070
7070
60-30
IVA - C
ALABAR
ZON140
150120
130120
110100
100140
130110
110130
11090
7080
10090
10080
8090
11090
9090
90100
9090
90100
9080
-60
IVB - M
IMARO
PA140
150120
130120
110100
100140
130110
110130
11090
7080
10090
10080
8090
11090
130110
140120
120130
130100
90110
-30
V - Bic
ol190
200210
180180
160170
150120
160190
160180
180130
100150
170150
160160
130160
130150
160140
120170
160140
130120
120110
-80
VI - We
stern V
isayas
140190
140150
130120
100110
100220
110120
120120
10090
90110
120110
10090
100110
140110
160110
100100
11080
10090
80-60
VII - Ce
ntral V
isayas
140130
150110
120100
110110
8080
11090
10080
8080
100130
80110
90100
120120
140130
120130
130120
120110
10090
80-60
VIII - Ea
stern V
isayas
330340
260250
250260
230230
180200
230170
170180
150140
190230
200200
220150
140160
200200
230230
180150
140130
130120
110160
-170
IX - Za
mboan
ga Pen
insula
220190
140110
120110
110130
110110
130100
120110
8080
120140
130150
110170
140130
170130
150150
150110
130140
150140
120110
-110
X - No
rthern
Minda
nao160
150160
130130
150120
11090
110120
130120
9090
90110
12090
11090
80100
11080
90100
110100
11090
10090
10090
90-70
XI - Da
vao130
130120
100110
9090
10070
9090
8080
8070
80100
12080
110120
100100
110100
130110
11090
110100
110110
12070
80-50
XII - SO
CCSKSA
RGEN
140180
150110
100160
110110
100110
8090
70110
7050
120140
90100
100100
10090
120100
130120
11090
9090
9090
9080
-60
XIII - C
araga
190170
130150
130130
130140
130160
140170
150120
150110
120-70
ARMM
340180
18080
100100
100130
180170
7090
16080
3080
7030
8070
-270
*There
is no
data
for 19
92 be
cause
the Ph
ilippin
e Heal
th Sta
tistic
s Annu
al Rep
ort 19
92 is
not a
vailab
le. So
me pa
ges o
f PHS
1998
are a
lso mi
ssing
, lead
ing to
loss
of da
ta.
Sourc
e: Phili
ppine
Healt
h Stat
istics
Annua
l Rep
orts 1
976 t
o 2012
Asia Pacific Journal of Education, Arts and Sciences, Vol. 4 No. 1, January 2017 _________________________________________________________________________________________________________
6 P-ISSN 2362-8022 | E-ISSN 2362-8030 | www.apjeas.apjmr.com
1993
DHS
1998
DHS
2003
DHS
2008
2013
DHS
Diff.
1993
DHS
1998
DHS
2003
DHS
2008
DHS
2013
DHS
Diff.
1993
DHS
1998
DHS
2003
DHS
2008
DHS
2013
DHS
Diff.
1993
DHS
1998
DHS
2003
DHS
2008
DHS
2013
DHS
Diff.
1993
DHS
1998
DHS
2003
DHS
2008
DHS
2013
DHS
Diff.
Phili
ppin
es38
.338
.538
.139
.138
.90.
644
.847
.249
.552
56.6
11.8
9.1
6.3
6.5
50.
7-8
.47.
87.
85.
63.
83.
7-4
.183
.185
.787
.691
.195
.412
.3
Natio
nal C
apita
l
Regi
on81
.375
.373
63.8
74-7
.39.
919
.719
.130
.624
.714
.82.
11.
43.
11.
50
-2.1
6.7
3.6
4.4
4.1
1.3
-5.4
91.2
9592
.194
.498
.77.
5
Cord
iller
a Ad
min
Regi
on32
.240
.354
.550
.460
27.8
55.5
44.3
31.5
41.5
38.1
-17.
43.
50.
72.
91.
10
-3.5
8.9
14.2
11.1
7.1
1.9
-787
.784
.686
91.9
98.1
10.4
I - Il
ocos
33.7
43.2
37.3
48.3
49.2
15.5
52.7
42.9
5441
.748
.2-4
.54.
42.
81.
43.
50
-4.4
9.2
10.7
6.9
6.4
2.6
-6.6
86.4
86.1
91.3
9097
.411
II - C
agay
an V
alle
y25
.231
.129
.627
.830
.65.
458
.441
.560
.567
66.6
8.2
2.7
6.6
3.3
2.7
0.4
-2.3
13.8
20.5
6.5
2.6
2.4
-11
83.6
72.6
90.1
94.8
97.2
13.6
III -
Cent
ral L
uzon
56.4
53.9
46.7
50.7
49.2
-7.2
3738
.845
.745
48.5
11.5
2.8
2.1
2.2
0.5
0-2
.83.
85
4.2
3.6
2.3
-1.5
93.4
92.7
92.4
95.7
97.7
4.3
IVA
- CAL
ABAR
ZON
36.7
43.7
46.7
55.7
47.4
10.7
46.9
42.5
44.3
39.7
49.7
2.8
5.5
5.1
1.7
10.
4-5
.110
.98.
77.
33.
52.
3-8
.683
.686
.291
95.4
97.1
13.5
IVB
- MIM
AROP
A36
.743
.719
28.8
23.9
-12.
846
.942
.563
56.5
67.4
20.5
5.5
5.1
8.7
9.7
1-4
.510
.98.
78.
84.
96.
2-4
.783
.686
.282
85.3
91.3
7.7
V - B
icol
19.7
2030
29.5
26.3
6.6
53.4
60.8
55.6
62.5
70.7
17.3
15.3
10.2
8.6
5.2
1.3
-14
11.6
8.7
5.2
2.8
1.7
-9.9
73.1
80.8
85.6
9297
23.9
VI -
Wes
tern
Vis
ayas
30.3
38.1
34.6
33.7
31.3
152
.354
.758
.860
.866
.614
.37.
92.
61.
51.
80
-7.9
9.4
4.5
5.1
3.3
1.8
-7.6
82.6
92.8
93.4
94.5
97.9
15.3
VII -
Cen
tral V
isay
as36
.524
.231
2125
.5-1
151
.169
.260
.476
.172
.921
.89.
52.
34.
80.
60
-9.5
2.9
4.1
3.5
21.
6-1
.387
.693
.491
.497
.198
.410
.8
VIII
- Eas
tern
Vis
ayas
33.5
19.8
19.1
29.2
37.4
3.9
45.7
57.6
6061
58.1
12.4
11.4
7.7
17.9
4.1
0-1
1.4
9.4
14.5
35.
74.
4-5
79.2
77.4
79.1
90.2
95.6
16.4
IX -
Zam
boan
ga
Peni
nsul
a16
.721
.912
.518
.714
.3-2
.450
.851
.864
.667
.279
.829
29.4
19.2
11.7
9.4
0.3
-29.
13.
16.
111
.24.
34.
71.
667
.573
.777
.185
.994
26.5
X - N
orth
ern
Min
dana
o24
.321
.320
.726
.223
.2-1
.161
.661
.870
.466
.171
.59.
98.
65
0.9
2.7
0.4
-8.2
5.5
11.9
7.6
53.
7-1
.885
.983
.191
.192
.394
.68.
7
XI -
Dava
o26
.931
.730
25.9
23.9
-351
.857
.660
.267
.773
.721
.912
.12.
56
5.3
1-1
1.1
9.1
8.3
3.4
0.8
1.3
-7.8
78.7
89.3
90.2
93.6
97.6
18.9
XII -
SOCC
SKSA
RGEN
24.4
20.8
16.4
13.5
12.1
-12.
344
.961
.765
.772
.679
.534
.622
9.2
12.3
7.3
0-2
28.
77.
85.
76.
68.
4-0
.369
.382
.582
.186
.191
.622
.3
XIII
- Car
aga
26.3
27.6
22.8
15-1
1.3
6362
.973
.782
194.
55.
81.
30
-4.5
5.4
3.7
2.2
3-2
.489
.390
.596
.597
7.7
ARM
M11
.615
.621
.512
.40.
830
.734
.225
.240
.49.
748
.245
.348
.911
.9-3
6.3
8.7
4.9
4.4
3526
.342
.349
.846
.752
.810
.5
Table
2. P
erce
ntage
of m
othe
rs re
ceivi
ng an
tenata
l car
e by t
ype o
f pro
vider
and
by re
gion.
Doct
orNu
rse/
Mid
wife
Trad
ition
al/H
ilot
No O
neSk
illed
Wor
ker
REGI
ONPE
RCEN
TAGE
OF W
OMEN
WITH
ACC
ESS T
O AN
TENA
TAL C
ARE B
Y TY
PE O
F PRO
VIDE
R
Asia Pacific Journal of Education, Arts and Sciences, Vol. 4 No. 1, January 2017 _________________________________________________________________________________________________________
7 P-ISSN 2362-8022 | E-ISSN 2362-8030 | www.apjeas.apjmr.com
The only exemption to this is the ARMM wherein
less than majority of the women have access to skilled
antenatal care (doctors and nurses/midwives) by 2008,
which improved to a little over 50% of the pregnant
population by 2013. Out of the 16 other regions which
experienced an increase in their percentages of women
receiving skilled antenatal care, Region IX-
Zamboanga Peninsula reported the biggest
improvement. However, the percentage of their
maternal population who receives antenatal care from
skilled workers is still below the national average
from 1988 to 2013. The smallest improvement is in
NCR, though it has the highest percentage of women
receiving antenatal care from a skilled worker.
Another fact which can be observed from Table 2
is when it comes to antenatal care provided by skilled
workers, only the National Capital Region (NCR) had
a population of women whose majority had access to
antenatal care from doctors during their last
pregnancies during the period of 1988 to 2013. Region
III-Central Luzon, the Cordillera Admin Region
(CAR) and Region IVA-CALABARZON had also
managed to provide majority of its maternal
population with antenatal care from doctors during
their last pregnancy but not for the whole 1988 to
2008 period. Region III-Central Luzon managed to do
it in the 1993, 2003 and 2008 DHS while the
Cordillera Admin Region managed it at the last three
DHS and Region IVA-CALABARZON at the last
DHS. Meanwhile, only one to three out of every ten
women in many of the other regions was able to avail
of antenatal care from doctors during the
aforementioned period.
It can also be observed that while the other
regions in Luzon do not have the same proportion of
their maternal population having access to antenatal
care from doctors during their last pregnancies as
NCR, their percentages are still higher than regions in
the Visayas and Mindanao. The only Luzon regions
which are suffering from the same situation as
Visayas and Mindanao are the two southernmost
regions of Luzon, IVB-MIMAROPA and V-Bicol.
Instead of receiving antenatal care from doctors,
regions in Visayas and Mindanao, save for ARMM,
have majority of their maternal population receiving
antenatal care from nurses or professional midwives,
though more frequently from the midwives than the
nurses. As for the ARMM, almost half of their
maternal population receives their antenatal care from
traditional midwives or ‗manhihilots‘. By the 2013
DHS, however, only 11.9% of the mothers in ARMM
reported that they received their antenatal care from
manhihilots. This decrease was accompanied not by a
dramatic increase of skilled antenatal care provision.
Instead, many of the women (35%) reported that they
did not receive any form of antenatal care.
Access to Skilled Delivery Care
A mother‘s access to skilled birth attendants
during her childbirth have also been found to have a
significant positive effect on stemming down rates of
maternal, neonatal, infant, and child mortality
[10],[14]. This is because skilled health workers have
been properly trained on how to deliver babies safely
and respond against complications that may be
encountered during childbirth. Evidence from various
countries have shown that mothers and newborns from
areas with higher access to delivery care from skilled
birth attendants tend to have lower probabilities of
dying than those who are from areas with little to no
access to skilled delivery care [9],[13]. In addition to
that, Begum, Nisa and Begum [15], Buor and Bream
[16], and Memon, Khowaja and Sohag [17] have
stated in their respective studies of maternal mortality
that a large proportion of maternal deaths are from
causes which can be prevented if mothers have access
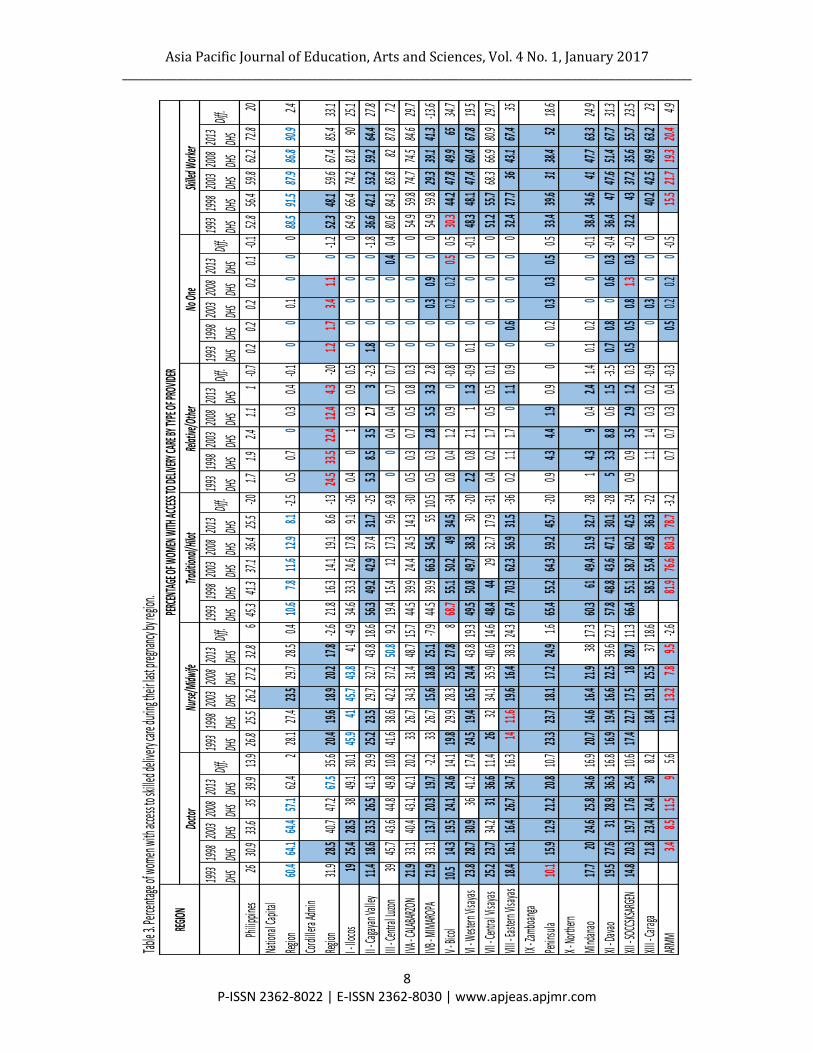
to skilled assistance during their childbirth. A tabular
summary of access to skilled delivery care by region
is provided in Table 3.
The first thing that is immediately observable
from the table is that almost half of the women in the
country did not receive assistance from doctors,
nurses or professional midwives during their last
pregnancies from 1988 to 2008. While it is observable
that there have been some improvements with the
percentage of women in the country receiving skilled
delivery care – from 52.8% of women receiving
skilled delivery care during their last pregnancy in the
period of 1988 to 1993 to 62.2% of women receiving
skilled delivery care during their last pregnancy in the
period of 2003 to 2008 – it is apparent that progress
with regard to improving access to skilled delivery
care has been slow. It should be noted, however, that
there was substantial progress by 2013.
It can be seen that only the National Capital
Region had majority of its maternal population give
birth with the assistance from skilled workers from
doctors though CAR was able to provide doctor‘s
assistance to its women during 2013 as well.
Asia Pacific Journal of Education, Arts and Sciences, Vol. 4 No. 1, January 2017 _________________________________________________________________________________________________________
8 P-ISSN 2362-8022 | E-ISSN 2362-8030 | www.apjeas.apjmr.com
1993
DHS
1998
DHS
2003
DHS
2008
DHS
2013
DHS
Diff.
1993
DHS
1998
DHS
2003
DHS
2008
DHS
2013
DHS
Diff.
1993
DHS
1998
DHS
2003
DHS
2008
DHS
2013
DHS
Diff.
1993
DHS
1998
DHS
2003
DHS
2008
DHS
2013
DHS
Diff.
1993
DHS
1998
DHS
2003
DHS
2008
DHS
2013
DHS
Diff.
1993
DHS
1998
DHS
2003
DHS
2008
DHS
2013
DHS
Diff.
Philip
pines
2630
.933
.635
39.9
13.9
26.8
25.5
26.2
27.2
32.8
645
.341
.337
.136
.425
.5-20
1.71.9
2.41.1
1-0.
70.2
0.20.2
0.20.1
-0.1
52.8
56.4
59.8
62.2
72.8
20
Natio
nal C
apita
l
Region
60.4
64.1
64.4
57.1
62.4
228
.127
.423
.529
.728
.50.4
10.6
7.811
.612
.98.1
-2.5
0.50.7
00.3
0.4-0.
10
00.1
00
088
.591
.587
.986
.890
.92.4
Cordi
llera
Admi
n
Region
31.9
28.5
40.7
47.2
67.5
35.6
20.4
19.6
18.9
20.2
17.8
-2.6
21.8
16.3
14.1
19.1
8.6-13
24.5
33.5
22.4
12.4
4.3-20
1.21.7
3.41.1
0-1.
252
.348
.159
.667
.485
.433
.1
I - Ilo
cos19
25.4
28.5
3849
.130
.145
.941
45.7
43.8
41-4.
934
.633
.324
.617
.89.1
-260.4
01
0.30.9
0.50
00
00
064
.966
.474
.281
.890
25.1
II - Ca
gayan
Valle
y11
.418
.623
.526
.541
.329
.925
.223
.529
.732
.743
.818
.656
.349
.242
.937
.431
.7-25
5.38.5
3.52.7
3-2.
31.8
00
00
-1.8
36.6
42.1
53.2
59.2
64.4
27.8
III - C
entral
Luzon
3945
.743
.644
.849
.810
.841
.638
.642
.237
.250
.89.2
19.4
15.4
1217
.39.6
-9.8
00
0.40.4
0.70.7
00
00
0.40.4
80.6
84.3
85.8
8287
.87.2
IVA - C
ALABA
RZON
21.9
33.1
40.4
43.1
42.1
20.2
3326
.734
.331
.448
.715
.744
.539
.924
.424
.514
.3-30
0.50.3
0.70.5
0.80.3
00
00
00
54.9
59.8
74.7
74.5
84.6
29.7
IVB - M
IMAR
OPA
21.9
33.1
13.7
20.3
19.7
-2.2
3326
.715
.618
.825
.1-7.
944
.539
.966
.354
.555
10.5
0.50.3
2.85.5
3.32.8
00
0.30.9
00
54.9
59.8
29.3
39.1
41.3
-13.6
V - Bi
col10
.514
.319
.524
.124
.614
.119
.829
.928
.325
.827
.88
68.7
55.1
50.2
4934
.5-34
0.80.4
1.20.9
0-0.
80
00.2
0.20.5
0.530
.344
.247
.849
.965
34.7
VI - W
estern
Visay
as23
.828
.730
.936
41.2
17.4
24.5
19.4
16.5
24.4
43.8
19.3
49.5
50.8
49.7
38.3
30-20
2.20.8
2.11
1.3-0.
90.1
00
00
-0.1
48.3
48.1
47.4
60.4
67.8
19.5
VII - C
entral
Visay
as25
.223
.734
.231
36.6
11.4
2632
34.1
35.9
40.6
14.6
48.4
4429
32.7
17.9
-310.4
0.21.7
0.50.5
0.10
00
00
051
.255
.768
.366
.980
.929
.7
VIII -
Easter
n Visa
yas18
.416
.116
.426
.734
.716
.314
11.6
19.6
16.4
38.3
24.3
67.4
70.3
62.3
56.9
31.5
-360.2
1.11.7
01.1
0.90
0.60
00
032
.427
.736
43.1
67.4
35
IX - Za
mboa
nga
Penins
ula10
.115
.912
.921
.220
.810
.723
.323
.718
.117
.224
.91.6
65.4
55.2
64.3
59.2
45.7
-200.9
4.34.4
1.90.9
00
0.20.3
0.30.5
0.533
.439
.631
38.4
5218
.6
X - No
rthern
Mind
anao
17.7
2024
.625
.834
.616
.920
.714
.616
.421
.938
17.3
60.3
6149
.451
.932
.7-28
14.3
90.4
2.41.4
0.10.2
00
0-0.
138
.434
.641
47.7
63.3
24.9
XI - D
avao
19.5
27.6
3128
.936
.316
.816
.919
.416
.622
.539
.622
.757
.848
.843
.647
.130
.1-28
53.3
8.80.6
1.5-3.
50.7
0.80
0.60.3
-0.4
36.4
4747
.651
.467
.731
.3
XII - S
OCCSK
SARGE
N14
.820
.319
.717
.625
.410
.617
.422
.717
.518
28.7
11.3
66.4
55.1
58.7
60.2
42.5
-240.9
0.93.5
2.91.2
0.30.5
0.50.8
1.30.3
-0.2
32.2
4337
.235
.655
.723
.5
XIII -
Carag
a21
.823
.424
.430
8.218
.419
.125
.537
18.6
58.5
55.4
49.8
36.3
-221.1
1.40.3
0.2-0.
90
0.30
00
40.2
42.5
49.9
63.2
23
ARMM
3.48.5
11.5
95.6
12.1
13.2
7.89.5
-2.6
81.9
76.6
80.3
78.7
-3.2
0.70.7
0.30.4
-0.3
0.50.2
0.20
-0.5
15.5
21.7
19.3
20.4
4.9
Table 3
. Perce
ntage
of wo
men w
ith ac
cess to
skille
d deli
very c
are du
ring th
eir las
t preg
nancy
by reg
ion.
PERCEN
TAGE
OF W
OMEN
WITH
ACCES
S TO D
ELIVE
RY CA
RE BY
TYPE
OF PR
OVIDE
RREG
IONSki
lled W
orker
No On
eRel
ative/
Other
Tradit
ional/
Hilot
Nurse
/Midw
ifeDo
ctor
Asia Pacific Journal of Education, Arts and Sciences, Vol. 4 No. 1, January 2017 _________________________________________________________________________________________________________
9 P-ISSN 2362-8022 | E-ISSN 2362-8030 | www.apjeas.apjmr.com
1993
DHS
1998
DHS
2003
DHS
2008
DHS
2013
DHSDiff.
1993
DHS
1998
DHS
2003
DHS
2008
DHS
2013
DHSDiff.
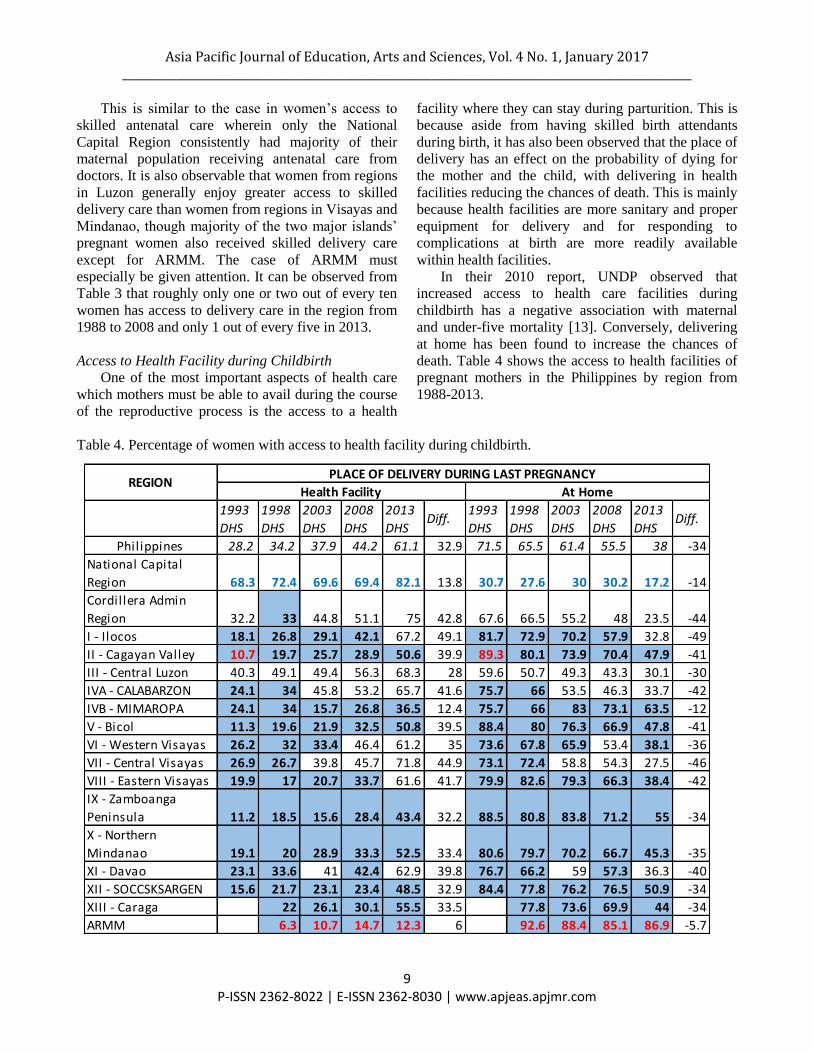
Philippines 28.2 34.2 37.9 44.2 61.1 32.9 71.5 65.5 61.4 55.5 38 -34
National Capital
Region 68.3 72.4 69.6 69.4 82.1 13.8 30.7 27.6 30 30.2 17.2 -14
Cordillera Admin
Region 32.2 33 44.8 51.1 75 42.8 67.6 66.5 55.2 48 23.5 -44
I - Ilocos 18.1 26.8 29.1 42.1 67.2 49.1 81.7 72.9 70.2 57.9 32.8 -49
II - Cagayan Valley 10.7 19.7 25.7 28.9 50.6 39.9 89.3 80.1 73.9 70.4 47.9 -41
III - Central Luzon 40.3 49.1 49.4 56.3 68.3 28 59.6 50.7 49.3 43.3 30.1 -30
IVA - CALABARZON 24.1 34 45.8 53.2 65.7 41.6 75.7 66 53.5 46.3 33.7 -42
IVB - MIMAROPA 24.1 34 15.7 26.8 36.5 12.4 75.7 66 83 73.1 63.5 -12
V - Bicol 11.3 19.6 21.9 32.5 50.8 39.5 88.4 80 76.3 66.9 47.8 -41
VI - Western Visayas 26.2 32 33.4 46.4 61.2 35 73.6 67.8 65.9 53.4 38.1 -36
VII - Central Visayas 26.9 26.7 39.8 45.7 71.8 44.9 73.1 72.4 58.8 54.3 27.5 -46
VIII - Eastern Visayas 19.9 17 20.7 33.7 61.6 41.7 79.9 82.6 79.3 66.3 38.4 -42
IX - Zamboanga
Peninsula 11.2 18.5 15.6 28.4 43.4 32.2 88.5 80.8 83.8 71.2 55 -34
X - Northern
Mindanao 19.1 20 28.9 33.3 52.5 33.4 80.6 79.7 70.2 66.7 45.3 -35
XI - Davao 23.1 33.6 41 42.4 62.9 39.8 76.7 66.2 59 57.3 36.3 -40
XII - SOCCSKSARGEN 15.6 21.7 23.1 23.4 48.5 32.9 84.4 77.8 76.2 76.5 50.9 -34
XIII - Caraga 22 26.1 30.1 55.5 33.5 77.8 73.6 69.9 44 -34
ARMM 6.3 10.7 14.7 12.3 6 92.6 88.4 85.1 86.9 -5.7
REGIONPLACE OF DELIVERY DURING LAST PREGNANCY
Health Facility At Home
This is similar to the case in women‘s access to
skilled antenatal care wherein only the National
Capital Region consistently had majority of their
maternal population receiving antenatal care from
doctors. It is also observable that women from regions
in Luzon generally enjoy greater access to skilled
delivery care than women from regions in Visayas and
Mindanao, though majority of the two major islands‘
pregnant women also received skilled delivery care
except for ARMM. The case of ARMM must
especially be given attention. It can be observed from
Table 3 that roughly only one or two out of every ten
women has access to delivery care in the region from
1988 to 2008 and only 1 out of every five in 2013.
Access to Health Facility during Childbirth
One of the most important aspects of health care
which mothers must be able to avail during the course
of the reproductive process is the access to a health
facility where they can stay during parturition. This is
because aside from having skilled birth attendants
during birth, it has also been observed that the place of
delivery has an effect on the probability of dying for
the mother and the child, with delivering in health
facilities reducing the chances of death. This is mainly
because health facilities are more sanitary and proper
equipment for delivery and for responding to
complications at birth are more readily available
within health facilities.
In their 2010 report, UNDP observed that
increased access to health care facilities during
childbirth has a negative association with maternal
and under-five mortality [13]. Conversely, delivering
at home has been found to increase the chances of
death. Table 4 shows the access to health facilities of
pregnant mothers in the Philippines by region from
1988-2013.
Table 4. Percentage of women with access to health facility during childbirth.
Asia Pacific Journal of Education, Arts and Sciences, Vol. 4 No. 1, January 2017 _________________________________________________________________________________________________________
10 P-ISSN 2362-8022 | E-ISSN 2362-8030 | www.apjeas.apjmr.com
Out of all the aspects of health care that is vital for
maternal and infant survival discussed in this paper,
the picture provided by the data regarding women‘s
access to health facilities during childbirth is the most
alarming. As can be observed from Table 4, less than
half of the population of women in the Philippines
from 1988 to 2008 was able to deliver their child
inside a health facility. A substantial improvement in
access to health facilities is observed in 2013, there
are still regions such as IVB-MIMAROPA, IX-
Zamboanga Peninsula, XII-SOCCSKSARGEN, and
especially ARMM where less than half delivered
inside a health facility. Many Filipino women had to
deliver their babies at home, away from sanitary
rooms and medical equipment. This is especially true
during the period of 1988 to 1993 wherein
approximately seven out of every ten women in the
Philippines had to deliver their child at home instead
of delivering them inside a health facility. Given the
fact that majority of these women had to deliver at
home, it stands to reason that most of them would also
have to rely for assistance from people who are not
properly trained in assisting childbirths since the
doctors, nurses and professional midwives are usually
found in health facilities. The low percentage of
women receiving skilled delivery care in the previous
subsection gives credence to this.
It can also be observed from Table 4 that there is a
large difference in the percentages of women giving
birth in a health facility during their last pregnancy
between NCR and the other regions, especially in the
first two DHSs conducted. NCR consistently had the
highest percentages of women giving birth in a health
facility during their last pregnancies. Consequently,
they also have the least percentage of women giving
birth at home during their last pregnancies.
Conversely, the ARMM region consistently had the
least proportion of their maternal population giving
birth in a health facility during their last pregnancy
and the highest percentage of women giving birth at
home. On the other hand, it can be observed that in
general, Visayan and Mindanao regions have lower
percentages of their maternal population having
access to a health facility during parturition. However,
even in Luzon, regions such as Region I-Ilocos,
Region II-Cagayan Valley, Region IVB-MIMAROPA
and Region V-Bicol have consistently low
percentages of women giving birth in a health facility
during their last pregnancy. All in all, the percentage
of women who were able to deliver their child inside a
health facility has increased for all regions from 1988
to 2013. However, the development in this aspect of
health care for childbearing women still demands
further improvement.
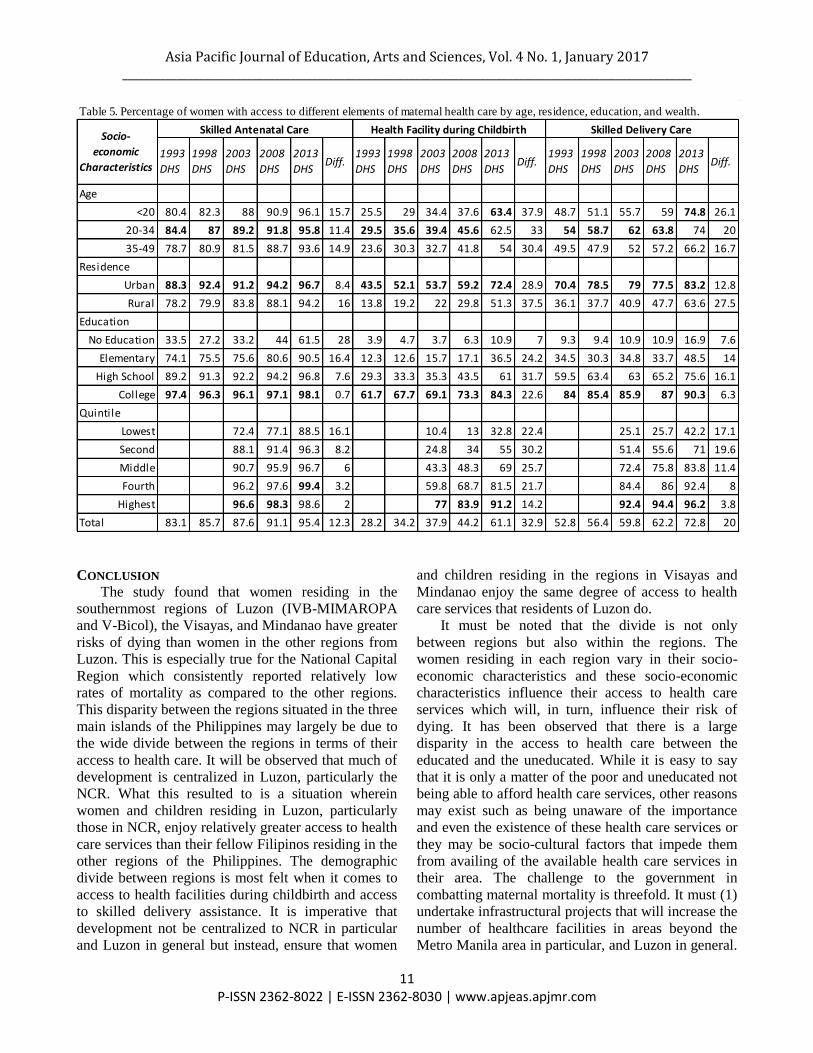
Socio-demographic Differences in Access to Health Care
There are also variations in the access to health
care and consequently, to the risk of dying for the
women among the regions of the Philippines. This is
because the women among each region differ in
certain socio-economic characteristics which may
influence their access to health care and their risk of
dying. Four socio-economic characteristics of the
mother were analyzed. These are the mother‘s age,
place of residence, their level of education, and their
wealth. The place of residence is categorized as either
living in a rural or an urban area. The level of
education is categorized into four levels – No
Education, Elementary Education, High School
Education, and College School Education or higher.
Finally, the wealth is categorized into five levels –
lowest, second, middle, fourth, and highest. This
wealth classification is based on the DHS wealth
index. This is based on the accumulated assets of the
household. These accumulated assets may range from
the ownership of items such as bicycles, radio and
television to the type of housing/housing composition
of the respondent‘s residence. A summary of the data
for the data on access to health care by varying socio-
economic characteristics is provided in Table 5.
Several patterns can be observed from Table 5.
First, it can be observed that in all aspects of health
care, women in urban areas consistently have higher
percentages that have access to different forms of
health care. The disparity between urban and rural
mothers is especially pronounced during childbirth,
while the difference is minimal when it comes to
skilled antenatal care. Second, women with tertiary
education tend to have greater access to health care
than those with lesser educational attainment. It is also
observable that there is a large difference in the access
to health care of the uneducated and the educated
(Elementary to Tertiary education). Furthermore, out
of all the socio-demographic characteristics observed,
it is clear that education has a well-defined association
with greater access to health care. Finally, while there
is limited data with regard to wealth differentials in
access to health care, it is observable from the data
obtained from the 2003 and 2013 DHS that those in
the upper wealth quantiles have greater access to
health care than those in the lower wealth quantiles,
particularly in skilled delivery care and delivery in
health facilities.
Asia Pacific Journal of Education, Arts and Sciences, Vol. 4 No. 1, January 2017 _________________________________________________________________________________________________________
11 P-ISSN 2362-8022 | E-ISSN 2362-8030 | www.apjeas.apjmr.com
CONCLUSION
The study found that women residing in the
southernmost regions of Luzon (IVB-MIMAROPA
and V-Bicol), the Visayas, and Mindanao have greater
risks of dying than women in the other regions from
Luzon. This is especially true for the National Capital
Region which consistently reported relatively low
rates of mortality as compared to the other regions.
This disparity between the regions situated in the three
main islands of the Philippines may largely be due to
the wide divide between the regions in terms of their
access to health care. It will be observed that much of
development is centralized in Luzon, particularly the
NCR. What this resulted to is a situation wherein
women and children residing in Luzon, particularly
those in NCR, enjoy relatively greater access to health
care services than their fellow Filipinos residing in the
other regions of the Philippines. The demographic
divide between regions is most felt when it comes to
access to health facilities during childbirth and access
to skilled delivery assistance. It is imperative that
development not be centralized to NCR in particular
and Luzon in general but instead, ensure that women
and children residing in the regions in Visayas and
Mindanao enjoy the same degree of access to health
care services that residents of Luzon do.
It must be noted that the divide is not only
between regions but also within the regions. The
women residing in each region vary in their socio-
economic characteristics and these socio-economic
characteristics influence their access to health care
services which will, in turn, influence their risk of
dying. It has been observed that there is a large
disparity in the access to health care between the
educated and the uneducated. While it is easy to say
that it is only a matter of the poor and uneducated not
being able to afford health care services, other reasons
may exist such as being unaware of the importance
and even the existence of these health care services or
they may be socio-cultural factors that impede them
from availing of the available health care services in
their area. The challenge to the government in
combatting maternal mortality is threefold. It must (1)
undertake infrastructural projects that will increase the
number of healthcare facilities in areas beyond the
Metro Manila area in particular, and Luzon in general.
1993
DHS
1998
DHS
2003
DHS
2008
DHS
2013
DHSDiff.
1993
DHS
1998
DHS
2003
DHS
2008
DHS
2013
DHSDiff.
1993
DHS
1998
DHS
2003
DHS
2008
DHS
2013
DHSDiff.
Age
<20 80.4 82.3 88 90.9 96.1 15.7 25.5 29 34.4 37.6 63.4 37.9 48.7 51.1 55.7 59 74.8 26.1
20-34 84.4 87 89.2 91.8 95.8 11.4 29.5 35.6 39.4 45.6 62.5 33 54 58.7 62 63.8 74 20
35-49 78.7 80.9 81.5 88.7 93.6 14.9 23.6 30.3 32.7 41.8 54 30.4 49.5 47.9 52 57.2 66.2 16.7
Residence
Urban 88.3 92.4 91.2 94.2 96.7 8.4 43.5 52.1 53.7 59.2 72.4 28.9 70.4 78.5 79 77.5 83.2 12.8
Rural 78.2 79.9 83.8 88.1 94.2 16 13.8 19.2 22 29.8 51.3 37.5 36.1 37.7 40.9 47.7 63.6 27.5
Education
No Education 33.5 27.2 33.2 44 61.5 28 3.9 4.7 3.7 6.3 10.9 7 9.3 9.4 10.9 10.9 16.9 7.6
Elementary 74.1 75.5 75.6 80.6 90.5 16.4 12.3 12.6 15.7 17.1 36.5 24.2 34.5 30.3 34.8 33.7 48.5 14
High School 89.2 91.3 92.2 94.2 96.8 7.6 29.3 33.3 35.3 43.5 61 31.7 59.5 63.4 63 65.2 75.6 16.1
College 97.4 96.3 96.1 97.1 98.1 0.7 61.7 67.7 69.1 73.3 84.3 22.6 84 85.4 85.9 87 90.3 6.3Wealth
Quintile
Lowest 72.4 77.1 88.5 16.1 10.4 13 32.8 22.4 25.1 25.7 42.2 17.1
Second 88.1 91.4 96.3 8.2 24.8 34 55 30.2 51.4 55.6 71 19.6
Middle 90.7 95.9 96.7 6 43.3 48.3 69 25.7 72.4 75.8 83.8 11.4
Fourth 96.2 97.6 99.4 3.2 59.8 68.7 81.5 21.7 84.4 86 92.4 8
Highest 96.6 98.3 98.6 2 77 83.9 91.2 14.2 92.4 94.4 96.2 3.8
Total 83.1 85.7 87.6 91.1 95.4 12.3 28.2 34.2 37.9 44.2 61.1 32.9 52.8 56.4 59.8 62.2 72.8 20
Table 5. Percentage of women with access to different elements of maternal health care by age, residence, education, and wealth.
Skilled Antenatal CareSocio-
economic
Characteristics
Health Facility during Childbirth Skilled Delivery Care
Asia Pacific Journal of Education, Arts and Sciences, Vol. 4 No. 1, January 2017 _________________________________________________________________________________________________________
12 P-ISSN 2362-8022 | E-ISSN 2362-8030 | www.apjeas.apjmr.com
Furthermore, it must strengthen up its awareness
campaigns on the necessity of obstetrical care during
pregnancy and childbirth and (3) ease the difficulties
of accessing health care, particularly for the
uneducated and the poor who are not empowered to
manifest health seeking behavior during pregnancy
and childbirth.
RECOMMENDATION FOR FUTURE STUDIES
The study made salient a number of issues which
can be potential research gaps that can be looked into
in future studies. First, the scientific inquiry into the
maternal mortality and health care relationship in the
Philippines will benefit from richer data on access to
health care that can be correlated with the annual
regional maternal mortality rates. As it stands, this
study had to make do with the limited data of the
Demographic Health Surveys which, while capable of
speaking for a sizable number of years, are inadequate
for correlational analyses. Future studies will also
benefit from taking into consideration other factors
related to health care such as mothers‘ health-seeking
behavior, knowledge of necessary pregnancy-related
health care, knowledge of location of health care
facilities, and distance of the mothers from the
appropriate health care facilities. The inclusion of
these factors will allow for a richer exploration of the
relevance of health care as a proximate factor to
maternal death. Second, it would be prudent to
conduct a more in-depth exploration of the situation of
maternal health in Eastern Visayas given the very
noticeable high rates of maternal death in the area
compared to the other regions of the Philippines.
Aside from the availability and accessibility of health
care, inquiry into the situation at the Eastern Visayas
region can look into the quality of health care in the
area as well as other possible proximate and distal
antecedents of maternal death such as environmental
exposure, gender relations, personal behaviors of
mothers, and cultural factors that may not be
conducive to optimal maternal health. And third, the
data on ARMM in the study, given the nature by
which PHS data are gathered and its vulnerability in
the face of political turmoil and cultural practices in
the region, cannot be wholly trusted. Future inquiries
on ARMM‘s maternal health should attempt to make
use either of other sources of secondary data or opt to
acquire their own primary data from the region in
order to avoid the data limitations that are inherent in
studies using secondary data analyses. The interplay
of maternal health and the region‘s culture that is
highly influenced by Islam should also be looked into.
REFERENCES [1] Atrash, H. Parents' Death and its Implications for
Child Survival. Journal of Human Growth and
Development, 21(3), pp. 759-770
[2] Beegle, K., De Weerdt, J., & S. Dercon. (2010).
Orphanhood and Human Capital Destruction: Is
There Persistence Into Adulthood?
Demography, 47(1), pp. 163-180
[3] Maternal Mortality Ratio. (n.d.). Measure
Evaluation. Retrieved January 27, 2017 from
https://goo.gl/LwIEhn.
[4] Maternal Death: The Avoidable Crisis. Medicis Sans
Frontieres. Retrieved January 27, 2017 from
https://goo.gl/RjtwIk.
[5] Cabal, L. and M. Stroffregen. (2009). Calling a
Spade a Spade: Maternal Mortality as a Human
Rights Violation. Retrieved January 27, 2017
from https://goo.gl/Kzfqmc
[6] Kao, S., Chen, L., Shi, L., & M. Weinrich. (1997).
Underreporting and misclassification of maternal
mortality in Taiwan. Acta obstetricia et gynecologica
Scandinavica, 76(7), pp. 629-36.
[7] Say, L. and D. Chou. (2011). Better understanding of
maternal deaths—the new WHO cause classification
system. International Journal of Obstetrics and
Gynaecology, 118(s2), pp. 15-17.
[8] Improve Maternal Health. United Nations
Department of Information. (2010). Retrieved
Septembder 12, 2011 from
https://goo.gl/Kfi4ZK.
[9] Bernis, L., Sherratt, D., AbouZahr, C. & W.
Lerbeghe. (2003). Skilled attendants for pregnancy,
childbirth and postnatal care. British Medical
Bulletin, 67, pp. 39-57.
[10] Dayaratna, V., Winfrey, W., McGreevey, W.,
Hardee, K., Smith, J., Mumford, E., Sine, J. & R.
Berg. (2000). Reproductive Health
Interventions: Which Ones Work and What Do They
Cost?.POLICY Project. Retrieved September 12,
2011 from https://goo.gl/CKJwEw.
[11] Iftikhar, R. (2009). A Study of Maternal Mortality.
Journal of Surgery Pakistan (International), 14(4),
pp. 176-178
[12] Midhet, F., Becker, S., & H.W. Berendes. (1998).
Contextual determinants of maternal mortality in
rural Pakistan. Journal of Social Science and
Medicine, 46(12), pp. 1587-1598.
[13] What will it take to achieve the Millennium
Development Goals? – An International Assessment.
(2010). United Nations Development Programme.
Retrieved September 12, 2011 from
https://goo.gl/3LMm3F.
Asia Pacific Journal of Education, Arts and Sciences, Vol. 4 No. 1, January 2017 _________________________________________________________________________________________________________
13 P-ISSN 2362-8022 | E-ISSN 2362-8030 | www.apjeas.apjmr.com
[14] Jain, A.K. (1985). Determinants of Regional
Variations in Infant Mortality in Rural India. Journal
of Population Studies, 39(3), pp. 407-424.
[15] Begum, S., Nisa, A., and I. Begum. (2003). Analysis
of maternal mortality in a tertiary care hospital to
determine causes and preventable factors. Journal of
Ayub Medical College, 15(2), pp. 49-52
[16] Buor, D. and K. Bream. (2004). An analysis of the
determinants of maternal mortality in sub-Saharan
Africa. Journal of Women‘s Health, 13(8), pp.
926-38.
[17] Memon, S., Khowaja, S., & A. Sohag. (2009).
Maternal Mortality at Liaquat University Hospital,
Hyderabad. Journal of Liaquat University Hospital,
Hyderabad, 8(1), pp. 65-67.

Asia Pacific Journal of Education, Arts and Sciences, Vol. 4 No. 1, January 2017 _________________________________________________________________________________________________________
14 P-ISSN 2362-8022 | E-ISSN 2362-8030 | www.apjeas.apjmr.com