Embed Size (px)
Citation preview
REGIONAL RESEARCH AND INNOVATION FOR CITY CLIMATE ACTION
GLOBAL SYNTHESIS REPORT JUNE 2021
REPORT AUTHORS
Paris Hadfield, Postdoctoral Research Fellow in Urban Innovation, Connected Cities Lab, the University of Melbourne
Cathy Oke, Melbourne Enterprise Senior Fellow in Informed Cities, Connected Cities Lab, the University of Melbourne
Jorn Verbeeck, Head of Research and Innovation, Global Covenant of Mayors for Climate and Energy
--
ACKNOWLEDGEMENTS
This research stems from a collaboration with Ironbark Sustainability (Matthew Sullivan and Alexi Lynch). Ironbark Sustainability’s preliminary city climate strategy assessment methodology was refined through its pilot application in this research project. The research team regularly consulted with Jorn Verbeeck, Head of Research and Innovation, Global Covenant of Mayors for Climate & Energy (GCoM) who we thank for his contributions throughout the research process.
The authors thank Rebecca Clements and Rewa Marathe for their contributions to refining the methodology and producing the city climate strategy action databases for the regions.
The authors acknowledge the contributions of the Global Covenant of Mayors for Climate & Energy (GCoM) Research and Innovation (R+I) Technical Working Group (TWG) in framing and refining the scope, methodology, and conclusions of the research documented in this report. The R+I TWG members involved in the research in 2020 include:
Paolo Bertoldi, European Commission, Joint Research Centre Edgardo Bilsky, United Cities and Local Governments Steven Bland, UN Habitat Anja Katalin De Cunto, EUROCITIES Rachel Huxley, C40 Cities Leadership Group Rodrigo Messias, United Cities and Local Governments Firdaous Oussidhoum, United Cities and Local Governments Pourya Salehi, ICLEI – Local Governments for Sustainability, World Secretariat Maryke van Staden, ICLEI, World Secretariat
The authors thank Amanda Eichel and Andy Deacon (GCoM) for their feedback in the preparation of the research findings.
Thanks to the following R+I TWG members for their comments on the final version of this report in 2021: Silvia Assalini (ICLEI Europe), Steven Bland, Eugenia Mansutti (EUROCITIES), Rodrigo Messias, and Pourya Salehi.
--
FOR FURTHER INFORMATION
If you would like further information on the research, please contact Paris Hadfield ([email protected]), Cathy Oke ([email protected]), or Jorn Verbeeck ([email protected]).
--
The Connected Cities Lab is a centre of excellence designed to address the challenges that city leadership faces, and the information it needs, in an interconnected and increasingly urbanised planet. The University of Melbourne’s School of Design (MSD) is the graduate school of the Faculty of Architecture, Building and Planning. The Faculty actively seeks to extend linkages between education, research and practice in the built environment, and aims to inspire learning through interdisciplinary reflection, and its integration of research teaching and practice around the implications of all forms of urbanisation.
For more information visit research.unimelb.edu.au/connected-cities
Ground Floor, Baldwin Spencer Building The University of Melbourne, Victoria 3010 Australia.
--
THIS REPORT HAS BEEN PRESENTED TO THE GLOBAL COVENANT OF MAYORS FOR CLIMATE & ENERGY
The Global Covenant of Mayors for Climate & Energy (GCoM) is a network of over 10,000 cities and local governments committed to voluntary action on climate change across six continents and 140 countries. Innovate4Cities is an initiative of GCoM aiming to define and address the knowledge and innovation priorities and needs of cities to meet their climate ambitions.

REGIONAL RESEARCH AND INNOVATION FOR CITY CLIMATE ACTION
GLOBAL SYNTHESIS REPORT
––
List of Figures iv
List of Tables v
Executive Summary 1
1. Introduction 2
2. City Climate Action Assessment Methodology 3
3. City Climate Action, Research, and Innovation Priorities 11
4. City Climate Change Mitigation Actions by Region 14
5. City Climate Change Adaptation Actions by Region 17
6. Additional Insights on Purposeful Innovation by Cities to Address Grand Challenges 20
7. Conclusions and Next Steps 23
References 24
Appendix A: City climate strategy sample by region 25
Appendix B: Aggregate data by region for global sample 28
Appendix C: City R+I Regional Snapshots 42
––
This research report has been developed by the Connected Cities Lab, a research group of the Melbourne School of Design, within the Faculty of Architecture, Building and Planning at the University of Melbourne. Research was undertaken in collaboration with Ironbark Sustainability. The authors have sought to ensure the accuracy of the material in this document, but they, the Lab, and the University of Melbourne will not be liable for any loss or damage incurred through the use of this report.
Published by the Connected Cities Lab, Faculty of Architecture, Building and Planning, the University of Melbourne, June 2021.
To cite this report: Hadfield, P., Oke, C., and Verbeeck, J. (2021). Regional Research and Innovation for City Climate Action: Global Synthesis Report. Connected Cities Lab, the University of Melbourne. https://doi.org/10.26188/14743125
This report is licenced under a Creative Commons Attribution 4.0 International Licence, which permits use, sharing, adaptation, distribution and reproduction in any medium or format, as long as you give appropriate credit to the original authors and the source, provide a link to the Creative Commons licence, and indicate if changes were made. The images or other third-party material in this report are included under the Creative Commons licence, unless indicated otherwise in a credit line to the material.
LIST OF FIGURES
Figure 1: Regional distribution of actions in the global sample (percentage). ....................................................................................................... 3
Figure 2: Key summary statistics based on the global city climate action sample. ............................................................................................ 11
Figure 3: Policy domain keyword categories referenced in the global climate action sample for mitigation and adaptation (non-exclusive).. .......................................................................................................................................................................................................................... 12
Figure 4: References to innovation keywords in the city climate strategy sample by region, globally (total count equal to or greater than 20).. ............................................................................................................................................................................................................................. 13
Figure 5: Number of city practitioners who completed GCoM’s Tools and Decision-making Survey in the first half of 2020. ................... 20
Figure 6: Priority insights most commonly identified by city practitioners in GCoM’s Tools and Decision-making Survey (2020). .......... 21
Figure 7: City emergency response types and examples identified in city network reporting on COVID-19 in the first half of 2020. ........ 22
Figure 8: Summary of common city climate action, research, and innovation priorities for the Africa (AFR) sample. ................................ 42
Figure 9: Summary of common city climate action, research, and innovation priorities for the East Asia (EA) sample. ............................. 43
Figure 10: Summary of common city climate action, research, and innovation priorities for the Eastern Europe and Central Asia (EECA) sample. .................................................................................................................................................................................................................. 44
Figure 11: Summary of common city climate action, research, and innovation priorities for the European Union and Western Europe (EUWE) sample. ................................................................................................................................................................................................................. 45
Figure 12: Summary of common city climate action, research, and innovation priorities for the Latin America and the Caribbean (LAC) sample. ............................................................................................................................................................................................................................... 46
Figure 13: Summary of common city climate action, research, and innovation priorities for the Middle East and West Asia (MEWA) sample. ............................................................................................................................................................................................................................... 47
Figure 14: Summary of common city climate action, research, and innovation priorities for the North America (NA) sample. ................ 48
Figure 15: Summary of common city climate action, research, and innovation priorities for the Oceania (OCE) sample. ........................ 49
Figure 16: Summary of common city climate action, research, and innovation priorities for the South Asia (SA) sample. ....................... 50
Figure 17: Summary of common city climate action, research, and innovation priorities for the Southeast Asia (SEA) sample. ............. 51
LIST OF TABLES
Table 1: City climate strategy sample. ............................................................................................................................................................................ 3
Table 2: Description of target emissions sector variables. ......................................................................................................................................... 4
Table 3: Description of climate hazard variables. ........................................................................................................................................................ 5
Table 4: Description of action stage variables. ............................................................................................................................................................. 6
Table 5: Description of intervention type variables. .................................................................................................................................................... 7
Table 6: Additional elements identified in the city climate action sample. ............................................................................................................ 8
Table 7: City climate action keywords searched in the city climate action database. ......................................................................................... 9
Table 8: Innovation keywords used in the strategy content analysis. ...................................................................................................................... 9
Table 9: Random sample of city climate strategies by region comprising city climate action database ....................................................... 25
Table 10: Summary statistics of city climate change mitigation action characteristics in the global strategy sample by region, including regional distributions of the data. ............................................................................................................................................................... 28
Table 11: Breakdown of (targeted) mitigation actions by target emissions sector, relative to global figures and regional distribution of the sample, part 1 (continued next page). ................................................................................................................................................................... 29
Table 12: Breakdown of (targeted) mitigation actions by target emissions sector, relative to global figures and regional distribution of the sample. ........................................................................................................................................................................................................................ 30
Table 13: Distribution of city mitigation actions by action stage for each region, relative to global figures and regional distribution of the sample. ........................................................................................................................................................................................................................ 31
Table 14: Distribution of city mitigation interventions by type for each region, relative to global figures and regional distribution of the sample, part 1 (continued next page). .......................................................................................................................................................................... 32
Table 15: Distribution of city mitigation interventions by type for each region, relative to global figures and regional distribution of the sample, part 2 (continued next page). .......................................................................................................................................................................... 33
Table 16: Distribution of city mitigation interventions by type for each region, relative to global figures and regional distribution of the sample, Part 3. ................................................................................................................................................................................................................... 34
Table 17: Summary statistics of city climate change adaptation action characteristics in the global strategy sample by region, including regional distributions of the data. ............................................................................................................................................................... 35
Table 18: Breakdown of (targeted) adaptation actions by target climate hazard, relative to global figures and regional distribution of the sample, part 1 (continued next page). ................................................................................................................................................................... 36
Table 19: Breakdown of (targeted) adaptation actions by target climate hazard, relative to global figures and regional distribution of the sample, part 2. ............................................................................................................................................................................................................ 37
Table 20: Distribution of city adaptation actions by action stage for each region, relative to global figures and regional distribution of the sample. ........................................................................................................................................................................................................................ 38
Table 21: Distribution of city adaptation interventions by type for each region, relative to global figures and regional distribution of the sample, part 1 (continued next page). ................................................................................................................................................................... 39
Table 22: Distribution of city adaptation interventions by type for each region, relative to global figures and regional distribution of the sample, part 2 (continued next page). ................................................................................................................................................................... 40
Table 23: Distribution of city adaptation interventions by type for each region, relative to global figures and regional distribution of the sample, Part 3. ............................................................................................................................................................................................................ 41
01
EXECUTIVE SUMMARY
––
As part of the Global Covenant of Mayors for Climate & Energy (GCoM) Innovate4Cities initiative, this report synthesizes research conducted by the Connected Cities Lab at the University of Melbourne to understand how cities integrate research and innovation (R+I) in climate change action planning and the common climate problems and responses identified by cities at a regional scale, globally. R+I drive social and technical systems change through the application of new ideas, knowledge, products, processes, and policies and is operationalised as a method of problem-solving to address ecological and social challenges in cities.
This research is based on a city climate action database drawn from a random sample of 98 city climate strategies (including mitigation, adaptation, and combined climate documents) of GCoM signatories across 10 regions, globally: Africa, East Asia, Eastern Europe and Central Asia, European Union and Western Europe, Latin America and the Caribbean, Middle East and West Asia, North America, Oceania, South Asia, and Southeast Asia.
Employing a novel methodology for documenting and assessing the characteristics of city climate actions developed in collaboration with Ironbark Sustainability, the research identifies common climate problems or local challenges (emissions sources or climate hazards) that city actions are seeking to address, the scope of proposed actions by city authorities, and the types of interventions undertaken by city authorities to drive change at scale in the wider community. The report includes additional insights drawn from GCoM’s Tools and Decision-making Survey on necessary insights and data identified by city practitioners to advance climate action, and a review of global city network reporting on city responses to the COVID-19 pandemic.
This work provides a foundation for cities and regional partners from which to consider:
– Where research and innovation are needed to support city action in high impact emissions sectors and significant climate hazards;
– Opportunities for peer-to-peer learning and collaboration within and between regions, including through improved documentation of prioritisation and anticipated and realised outcomes of actions; and
– Pathways to leverage multilevel governance coordination, international investment, and advocacy at a regional scale.
The research identifies priorities for city climate action globally, supported by disaggregated data at a regional scale. Key findings include:
– Cities in the global sample most often focus on mitigating residential emissions, followed by commercial and local government emissions sectors (non-exclusive). More broadly, mitigation actions are commonly associated with energy, buildings and construction, and mobility and transport.
– Cities in the global sample most often focus on adapting to extreme hot temperature, followed by flood and sea level rise and water scarcity and drought (climate hazards). More broadly, adaptation actions are commonly associated with water and marine environments, public health and welfare, and green space and habitat.
– City climate action planning identifies a role for data collection and research to understand problems and potential solutions, as well as feasibility studies and pilot projects. There is scope for cities to integrate R+I activities more substantially and explicitly in climate action planning, implementation, monitoring and evaluation.
– Whether and how mitigation and adaptation actions proposed in city climate strategy documents relate to understandings of emissions sources and climate hazards, emissions trajectories and climate risks, and mitigation and adaptation potential vary within and between regions in the sample.
– City practitioners globally identify innovative strategies for financing climate action, followed by generation of city scale data, as the most beneficial insights and data to progress climate action in their cities.
– The COVID-19 pandemic highlights the need for climate action to address public health and wellbeing and economic recovery where cities have played a role across governance, research and knowledge, infrastructure and technology, and economic development.
In the lead up to the Innovate4Cities Conference and the 26th UN Climate Change Conference (COP 26) in the second half of 2021, a key next step for this research is to engage with regional city network partners and member cities to validate the regional research findings and develop more refined regional agendas and pathways to accelerate implementation through advocacy, collaboration, and investment.
02
1. INTRODUCTION
––
Research and innovation (R+I) drive social and technical systems change through the application of new ideas, knowledge, products, processes, and policies (Edler and Fagerberg, 2017; Schot and Steinmueller, 2018; Howaldt et al., 2018). R+I is operationalised as a method of problem-solving to address ecological and social challenges in cities (OECD, 2019; Voytenko et al., 2016).
The Global Covenant of Mayors for Climate & Energy (GCoM) Innovate4Cities initiative (launched in 2018) aims to support city climate action implementation by identifying the knowledge and innovation needs of cities, creating partnerships across science, policy, and practice, and amplifying city voices. Cities of various sizes and capabilities need to be empowered to start or accelerate climate actions and to work collectively to achieve climate change objectives. The gap between national mitigation commitments and Paris Agreement goals to limit global warming to 1.5 degrees (UNFCCC, 2021) highlights the need for improved links between evidence and city climate action planning.
The Global Research and Action Agenda (GRAA) on Cities and Climate Change Science identified academic and practice-based knowledge and research gaps (World Climate Research Programme, 2019). This agenda comprises four cross-cutting issues (city-level models and data, systems approach, scale, and governance), six priority domains (built and green/blue infrastructure, sustainable consumption and production, finance, informality, uncertainty, and urban planning and design), and three suggested approaches to facilitate implementation (partnerships for long-term collaboration, co-production of knowledge, and empowering cities to act). Innovate4Cities, supported by GCoM’s R+I Technical Working Group of city network representatives, builds on this agenda by elevating city authority perspectives on locally-specific R+I needs and priorities.
This report synthesises desktop research undertaken by the Connected Cities Lab (the University of Melbourne) in collaboration with Ironbark Sustainability for GCoM in 2020 based on analysis of documented city climate actions by region, globally, as well as relevant findings from GCoM’s Tools and Decision-making Survey of city practitioners and public reporting by city networks on city responses to COVID-19 in the first half of 2020. The research followed preliminary scoping activities by GCoM’s R+I Technical Working Group, including the development of a Research and Innovation Strategy (2020 – 2022) and a review of current and future research projects being conducted by the respective city networks in 2019.
This work provides a foundation for cities, regional and global city networks, other public and private stakeholders, and the research community to consider 1) where research and innovation is needed to support city action in high impact emissions sectors and significant climate hazards, 2) opportunities for peer-to-peer learning and collaboration within and between regions, and 3) pathways to leverage multilevel governance coordination, international investment, and advocacy at a regional scale.
1.1 UNDERSTANDING CITY R+I BY REGION: RESEARCH APPROACH
–– The Regional R+I Snapshots provide a detailed region by region view of where and how research and innovation features in city climate action planning. The research asks:
– How do cities integrate R+I in climate change action planning? What kinds of R+I have been documented in city responses to COVID-19?
– What climate problems and responses are commonly identified by cities in the global sample?
The analysis draws on a database of actions from 98 city climate strategies across 10 regions, spanning a variety of GCoM signatory cities with a population of 50,000 or more. The random sample was limited to city climate change mitigation, adaptation, and combined strategies published from 2016 onwards in English, but includes a wide range of formats (including some English language summary documents, and strategies developed with and without support from peak bodies and consultants) to maximise geographical reach (see Appendix A). The research also incorporates public reporting by city networks on city responses to COVID-19 in the first half of 2020, in addition to GCoM’s 2020 Tools and Decision-making Survey.
The results provide new qualitative data and summary statistics detailing sectors of focus for city emissions reduction and climate adaptation and how cities are approaching R+I. These findings provide an opportunity to determine how current efforts align with major emissions sources and climate change impacts for each analysed region, and identify topics requiring further attention. This research allows GCoM’s Regional Covenants and partners across sectors to understand regional trends, identify common priorities, and advocate for city investment relevant to the local context.
03
2. CITY CLIMATE ACTION ASSESSMENT METHODOLOGY
––To define city research and innovation needs and knowledge gaps at a regional scale, globally, in lieu of speaking directly to city representatives during an intense 2020 period, we took a desktop approach involving analysis of city climate strategy actions, supplemented by a GCoM city practitioner survey and reporting on early city responses to the COVID-19 pandemic.
The Connected Cities Lab and Ironbark Sustainability team, in consultation with GCoM’s R+I Technical Working Group, developed a novel approach to analysing discrete actions proposed in city climate strategies. The strategy scan methodology sought to categorise proposed actions and capture their key components and qualities to develop a searchable mitigation and adaptation action database per region. The database highlights targeted climate change causes and impacts, governance mechanisms, topical areas, and anticipated outcomes based on descriptions in city climate strategy documents.
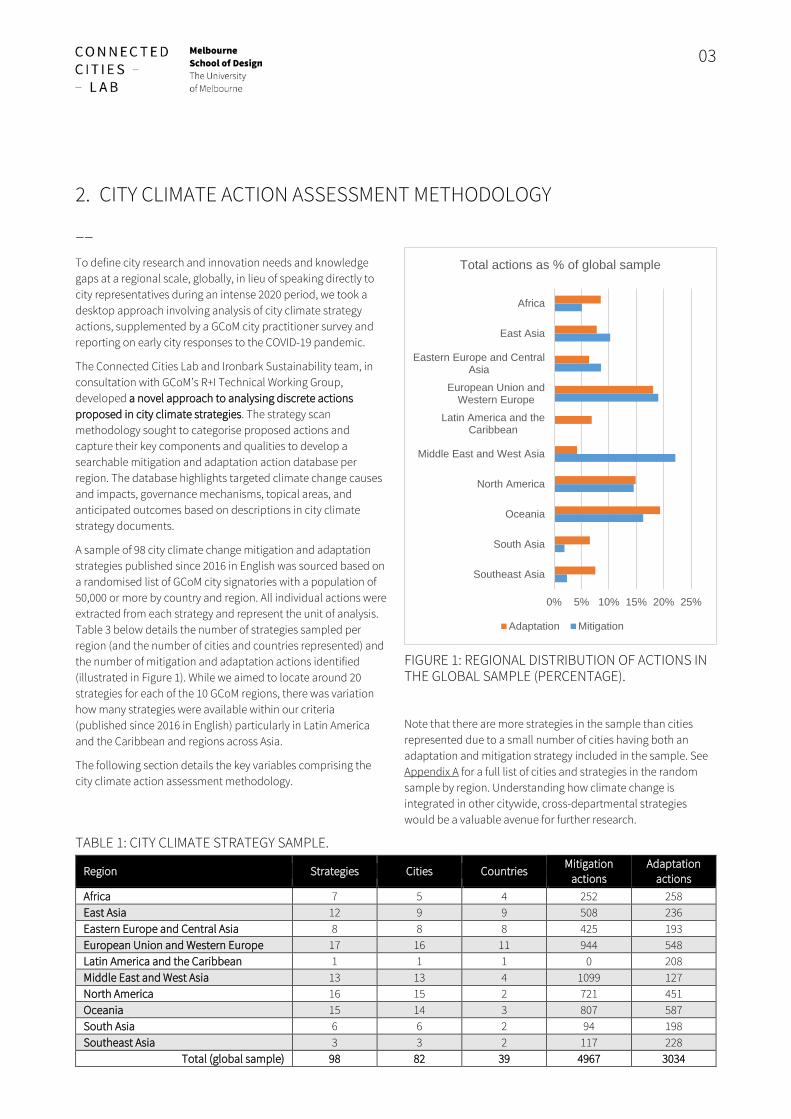
A sample of 98 city climate change mitigation and adaptation strategies published since 2016 in English was sourced based on a randomised list of GCoM city signatories with a population of 50,000 or more by country and region. All individual actions were extracted from each strategy and represent the unit of analysis. Table 3 below details the number of strategies sampled per region (and the number of cities and countries represented) and the number of mitigation and adaptation actions identified (illustrated in Figure 1). While we aimed to locate around 20 strategies for each of the 10 GCoM regions, there was variation how many strategies were available within our criteria (published since 2016 in English) particularly in Latin America and the Caribbean and regions across Asia.
The following section details the key variables comprising the city climate action assessment methodology.
FIGURE 1: REGIONAL DISTRIBUTION OF ACTIONS IN THE GLOBAL SAMPLE (PERCENTAGE).
Note that there are more strategies in the sample than cities represented due to a small number of cities having both an adaptation and mitigation strategy included in the sample. See Appendix A for a full list of cities and strategies in the random sample by region. Understanding how climate change is integrated in other citywide, cross-departmental strategies would be a valuable avenue for further research.
TABLE 1: CITY CLIMATE STRATEGY SAMPLE.
Region Strategies Cities Countries Mitigation
actions Adaptation
actions Africa 7 5 4 252 258 East Asia 12 9 9 508 236 Eastern Europe and Central Asia 8 8 8 425 193 European Union and Western Europe 17 16 11 944 548 Latin America and the Caribbean 1 1 1 0 208 Middle East and West Asia 13 13 4 1099 127 North America 16 15 2 721 451 Oceania 15 14 3 807 587 South Asia 6 6 2 94 198 Southeast Asia 3 3 2 117 228
Total (global sample) 98 82 39 4967 3034
0% 5% 10% 15% 20% 25%
Southeast Asia
South Asia
Oceania
North America
Middle East and West Asia
Latin America and theCaribbean
European Union andWestern Europe
Eastern Europe and CentralAsia
East Asia
Africa
Total actions as % of global sample
Adaptation Mitigation
04
2.1 CITY CLIMATE ACTION CATEGORISATIONS AND ANALYSIS
Key components of the assessment methodology as follows:
1. Categorisation of target emissions sector.
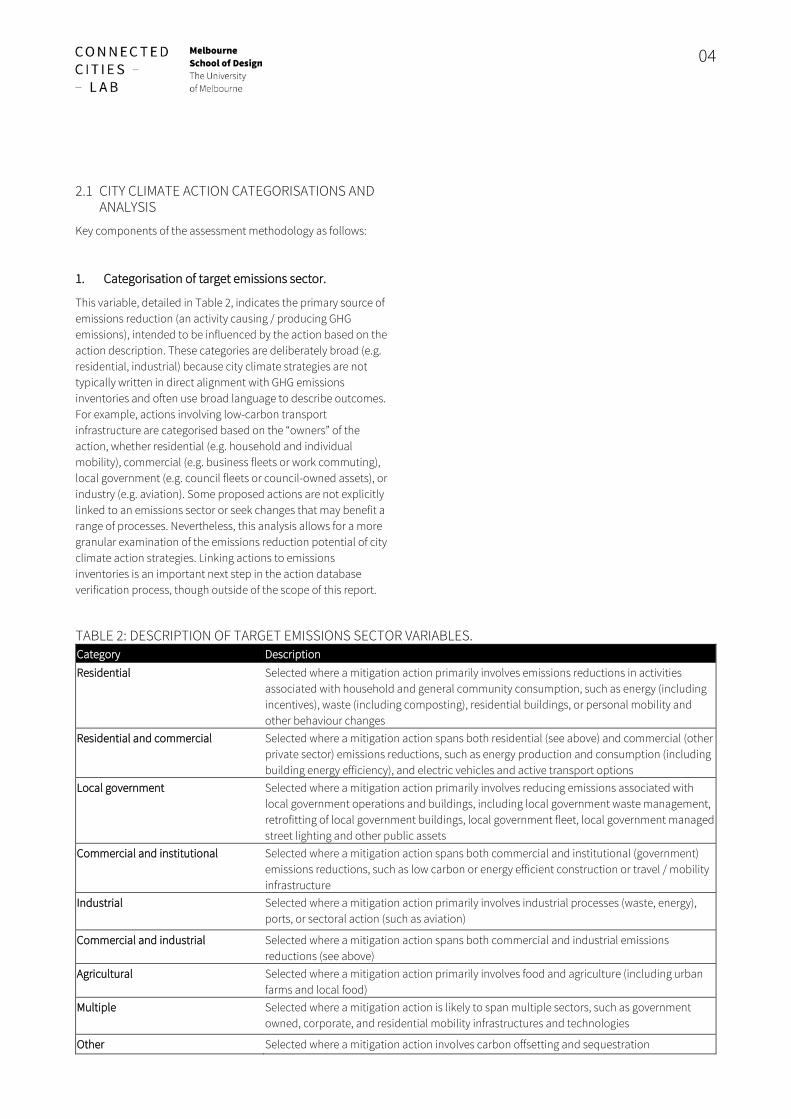
This variable, detailed in Table 2, indicates the primary source of emissions reduction (an activity causing / producing GHG emissions), intended to be influenced by the action based on the action description. These categories are deliberately broad (e.g. residential, industrial) because city climate strategies are not typically written in direct alignment with GHG emissions inventories and often use broad language to describe outcomes. For example, actions involving low-carbon transport infrastructure are categorised based on the “owners” of the action, whether residential (e.g. household and individual mobility), commercial (e.g. business fleets or work commuting), local government (e.g. council fleets or council-owned assets), or industry (e.g. aviation). Some proposed actions are not explicitly linked to an emissions sector or seek changes that may benefit a range of processes. Nevertheless, this analysis allows for a more granular examination of the emissions reduction potential of city climate action strategies. Linking actions to emissions inventories is an important next step in the action database verification process, though outside of the scope of this report.
TABLE 2: DESCRIPTION OF TARGET EMISSIONS SECTOR VARIABLES. Category Description
Residential Selected where a mitigation action primarily involves emissions reductions in activities associated with household and general community consumption, such as energy (including incentives), waste (including composting), residential buildings, or personal mobility and other behaviour changes
Residential and commercial Selected where a mitigation action spans both residential (see above) and commercial (other private sector) emissions reductions, such as energy production and consumption (including building energy efficiency), and electric vehicles and active transport options
Local government Selected where a mitigation action primarily involves reducing emissions associated with local government operations and buildings, including local government waste management, retrofitting of local government buildings, local government fleet, local government managed street lighting and other public assets
Commercial and institutional Selected where a mitigation action spans both commercial and institutional (government) emissions reductions, such as low carbon or energy efficient construction or travel / mobility infrastructure
Industrial Selected where a mitigation action primarily involves industrial processes (waste, energy), ports, or sectoral action (such as aviation)
Commercial and industrial Selected where a mitigation action spans both commercial and industrial emissions reductions (see above)
Agricultural Selected where a mitigation action primarily involves food and agriculture (including urban farms and local food)
Multiple Selected where a mitigation action is likely to span multiple sectors, such as government owned, corporate, and residential mobility infrastructures and technologies
Other Selected where a mitigation action involves carbon offsetting and sequestration
05
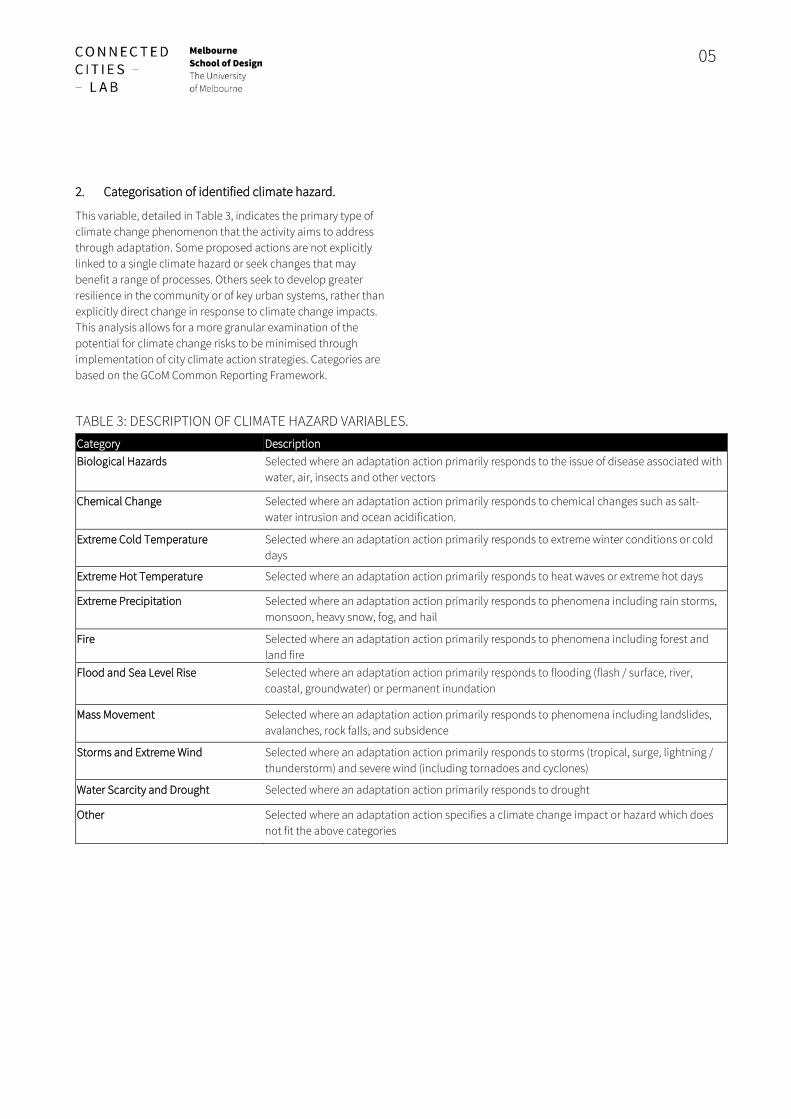
2. Categorisation of identified climate hazard.
This variable, detailed in Table 3, indicates the primary type of climate change phenomenon that the activity aims to address through adaptation. Some proposed actions are not explicitly linked to a single climate hazard or seek changes that may benefit a range of processes. Others seek to develop greater resilience in the community or of key urban systems, rather than explicitly direct change in response to climate change impacts. This analysis allows for a more granular examination of the potential for climate change risks to be minimised through implementation of city climate action strategies. Categories are based on the GCoM Common Reporting Framework.
TABLE 3: DESCRIPTION OF CLIMATE HAZARD VARIABLES. Category Description Biological Hazards Selected where an adaptation action primarily responds to the issue of disease associated with
water, air, insects and other vectors
Chemical Change Selected where an adaptation action primarily responds to chemical changes such as salt-water intrusion and ocean acidification.
Extreme Cold Temperature Selected where an adaptation action primarily responds to extreme winter conditions or cold days
Extreme Hot Temperature Selected where an adaptation action primarily responds to heat waves or extreme hot days
Extreme Precipitation Selected where an adaptation action primarily responds to phenomena including rain storms, monsoon, heavy snow, fog, and hail
Fire Selected where an adaptation action primarily responds to phenomena including forest and land fire
Flood and Sea Level Rise Selected where an adaptation action primarily responds to flooding (flash / surface, river, coastal, groundwater) or permanent inundation
Mass Movement Selected where an adaptation action primarily responds to phenomena including landslides, avalanches, rock falls, and subsidence
Storms and Extreme Wind Selected where an adaptation action primarily responds to storms (tropical, surge, lightning / thunderstorm) and severe wind (including tornadoes and cyclones)
Water Scarcity and Drought Selected where an adaptation action primarily responds to drought
Other Selected where an adaptation action specifies a climate change impact or hazard which does not fit the above categories
06
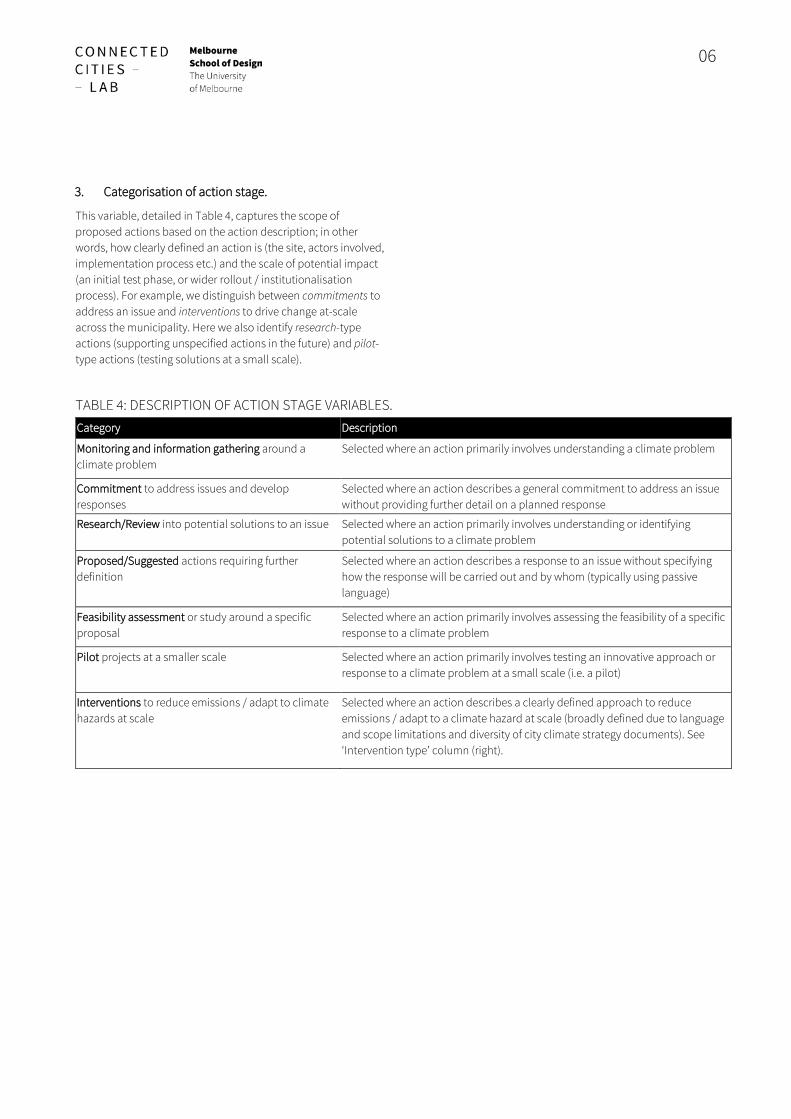
3. Categorisation of action stage.
This variable, detailed in Table 4, captures the scope of proposed actions based on the action description; in other words, how clearly defined an action is (the site, actors involved, implementation process etc.) and the scale of potential impact (an initial test phase, or wider rollout / institutionalisation process). For example, we distinguish between commitments to address an issue and interventions to drive change at-scale across the municipality. Here we also identify research-type actions (supporting unspecified actions in the future) and pilot-type actions (testing solutions at a small scale).
TABLE 4: DESCRIPTION OF ACTION STAGE VARIABLES. Category Description
Monitoring and information gathering around a climate problem
Selected where an action primarily involves understanding a climate problem
Commitment to address issues and develop responses
Selected where an action describes a general commitment to address an issue without providing further detail on a planned response
Research/Review into potential solutions to an issue Selected where an action primarily involves understanding or identifying potential solutions to a climate problem
Proposed/Suggested actions requiring further definition
Selected where an action describes a response to an issue without specifying how the response will be carried out and by whom (typically using passive language)
Feasibility assessment or study around a specific proposal
Selected where an action primarily involves assessing the feasibility of a specific response to a climate problem
Pilot projects at a smaller scale Selected where an action primarily involves testing an innovative approach or response to a climate problem at a small scale (i.e. a pilot)
Interventions to reduce emissions / adapt to climate hazards at scale
Selected where an action describes a clearly defined approach to reduce emissions / adapt to a climate hazard at scale (broadly defined due to language and scope limitations and diversity of city climate strategy documents). See ‘Intervention type’ column (right).
07
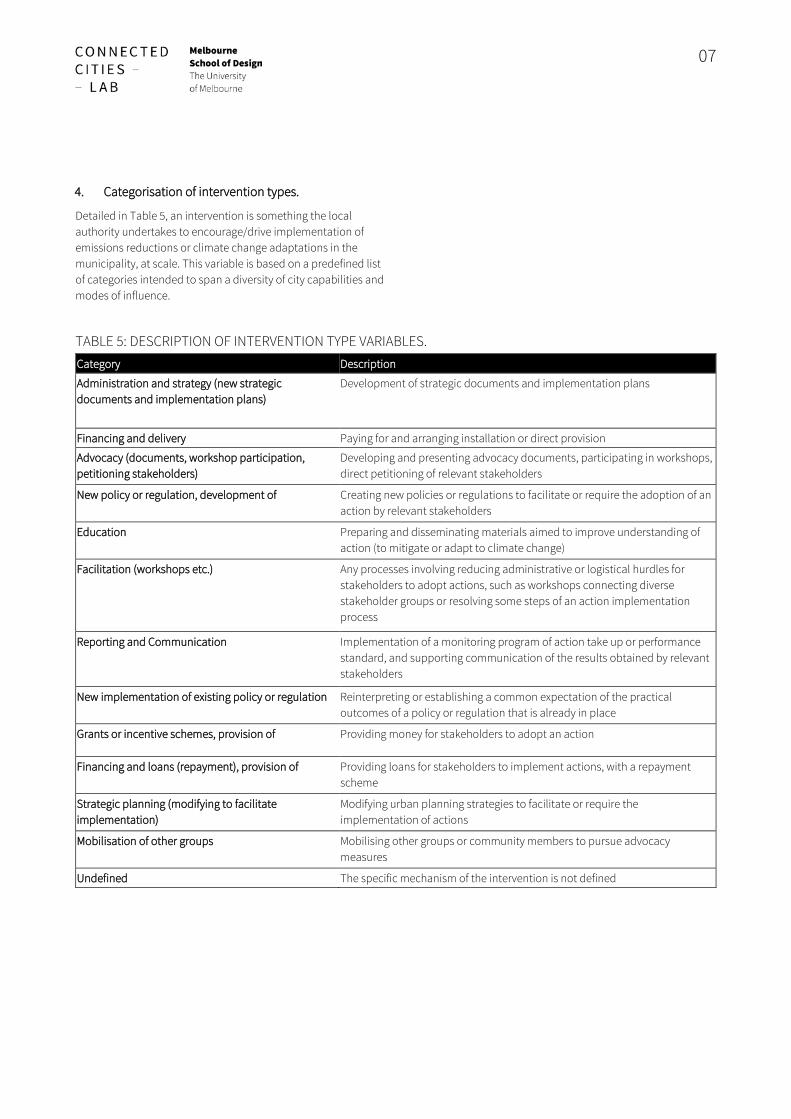
4. Categorisation of intervention types.
Detailed in Table 5, an intervention is something the local authority undertakes to encourage/drive implementation of emissions reductions or climate change adaptations in the municipality, at scale. This variable is based on a predefined list of categories intended to span a diversity of city capabilities and modes of influence.
TABLE 5: DESCRIPTION OF INTERVENTION TYPE VARIABLES. Category Description
Administration and strategy (new strategic documents and implementation plans)
Development of strategic documents and implementation plans
Financing and delivery Paying for and arranging installation or direct provision
Advocacy (documents, workshop participation, petitioning stakeholders)
Developing and presenting advocacy documents, participating in workshops, direct petitioning of relevant stakeholders
New policy or regulation, development of Creating new policies or regulations to facilitate or require the adoption of an action by relevant stakeholders
Education Preparing and disseminating materials aimed to improve understanding of action (to mitigate or adapt to climate change)
Facilitation (workshops etc.) Any processes involving reducing administrative or logistical hurdles for stakeholders to adopt actions, such as workshops connecting diverse stakeholder groups or resolving some steps of an action implementation process
Reporting and Communication Implementation of a monitoring program of action take up or performance standard, and supporting communication of the results obtained by relevant stakeholders
New implementation of existing policy or regulation Reinterpreting or establishing a common expectation of the practical outcomes of a policy or regulation that is already in place
Grants or incentive schemes, provision of Providing money for stakeholders to adopt an action
Financing and loans (repayment), provision of Providing loans for stakeholders to implement actions, with a repayment scheme
Strategic planning (modifying to facilitate implementation)
Modifying urban planning strategies to facilitate or require the implementation of actions
Mobilisation of other groups Mobilising other groups or community members to pursue advocacy measures
Undefined The specific mechanism of the intervention is not defined
08
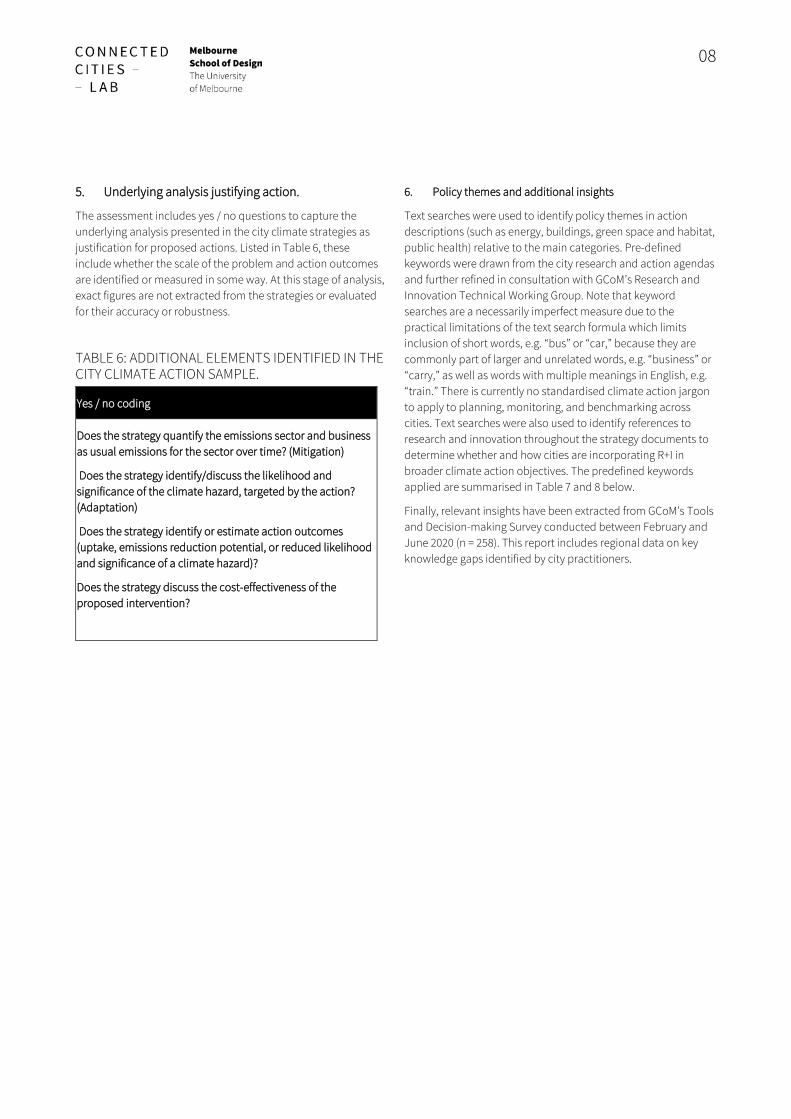
5. Underlying analysis justifying action.
The assessment includes yes / no questions to capture the underlying analysis presented in the city climate strategies as justification for proposed actions. Listed in Table 6, these include whether the scale of the problem and action outcomes are identified or measured in some way. At this stage of analysis, exact figures are not extracted from the strategies or evaluated for their accuracy or robustness.
TABLE 6: ADDITIONAL ELEMENTS IDENTIFIED IN THE CITY CLIMATE ACTION SAMPLE.
Yes / no coding
Does the strategy quantify the emissions sector and business as usual emissions for the sector over time? (Mitigation)
Does the strategy identify/discuss the likelihood and significance of the climate hazard, targeted by the action? (Adaptation)
Does the strategy identify or estimate action outcomes (uptake, emissions reduction potential, or reduced likelihood and significance of a climate hazard)?
Does the strategy discuss the cost-effectiveness of the proposed intervention?
6. Policy themes and additional insights
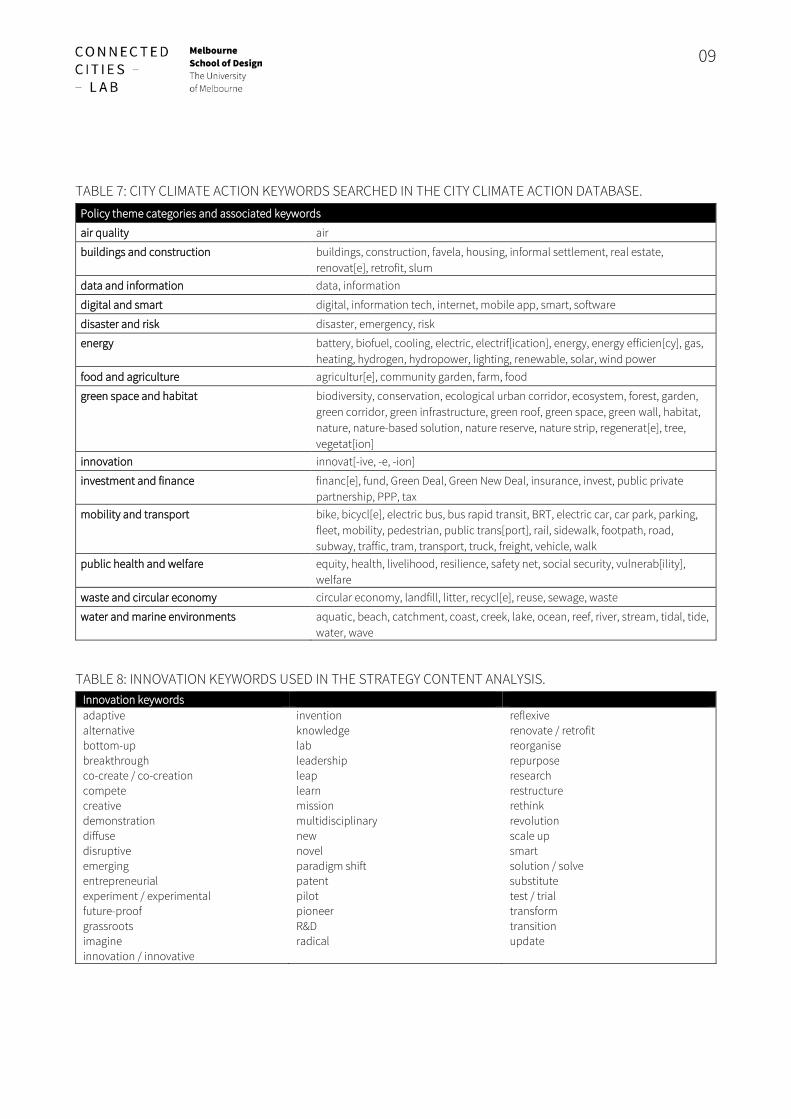
Text searches were used to identify policy themes in action descriptions (such as energy, buildings, green space and habitat, public health) relative to the main categories. Pre-defined keywords were drawn from the city research and action agendas and further refined in consultation with GCoM’s Research and Innovation Technical Working Group. Note that keyword searches are a necessarily imperfect measure due to the practical limitations of the text search formula which limits inclusion of short words, e.g. “bus” or “car,” because they are commonly part of larger and unrelated words, e.g. “business” or “carry,” as well as words with multiple meanings in English, e.g. “train.” There is currently no standardised climate action jargon to apply to planning, monitoring, and benchmarking across cities. Text searches were also used to identify references to research and innovation throughout the strategy documents to determine whether and how cities are incorporating R+I in broader climate action objectives. The predefined keywords applied are summarised in Table 7 and 8 below.
Finally, relevant insights have been extracted from GCoM’s Tools and Decision-making Survey conducted between February and June 2020 (n = 258). This report includes regional data on key knowledge gaps identified by city practitioners.
09
TABLE 7: CITY CLIMATE ACTION KEYWORDS SEARCHED IN THE CITY CLIMATE ACTION DATABASE. Policy theme categories and associated keywords
air quality air
buildings and construction buildings, construction, favela, housing, informal settlement, real estate, renovat[e], retrofit, slum
data and information data, information
digital and smart digital, information tech, internet, mobile app, smart, software
disaster and risk disaster, emergency, risk
energy battery, biofuel, cooling, electric, electrif[ication], energy, energy efficien[cy], gas, heating, hydrogen, hydropower, lighting, renewable, solar, wind power
food and agriculture agricultur[e], community garden, farm, food
green space and habitat biodiversity, conservation, ecological urban corridor, ecosystem, forest, garden, green corridor, green infrastructure, green roof, green space, green wall, habitat, nature, nature-based solution, nature reserve, nature strip, regenerat[e], tree, vegetat[ion]
innovation innovat[-ive, -e, -ion]
investment and finance financ[e], fund, Green Deal, Green New Deal, insurance, invest, public private partnership, PPP, tax
mobility and transport bike, bicycl[e], electric bus, bus rapid transit, BRT, electric car, car park, parking, fleet, mobility, pedestrian, public trans[port], rail, sidewalk, footpath, road, subway, traffic, tram, transport, truck, freight, vehicle, walk
public health and welfare equity, health, livelihood, resilience, safety net, social security, vulnerab[ility], welfare
waste and circular economy circular economy, landfill, litter, recycl[e], reuse, sewage, waste
water and marine environments aquatic, beach, catchment, coast, creek, lake, ocean, reef, river, stream, tidal, tide, water, wave
TABLE 8: INNOVATION KEYWORDS USED IN THE STRATEGY CONTENT ANALYSIS. Innovation keywords adaptive alternative bottom-up breakthrough co-create / co-creation compete creative demonstration diffuse disruptive emerging entrepreneurial experiment / experimental future-proof grassroots imagine innovation / innovative
invention knowledge lab leadership leap learn mission multidisciplinary new novel paradigm shift patent pilot pioneer R&D radical
reflexive renovate / retrofit reorganise repurpose research restructure rethink revolution scale up smart solution / solve substitute test / trial transform transition update

10
2.2 RESEARCH LIMITATIONS AND FUTURE REGIONAL DEEP DIVES
–– There are two key limitations of the city climate action database and analysis to bear in mind when reading this report.
First, the findings are not intended to be statistically representative of the regions. Rather, the research aims to examine the qualities of city climate actions and mechanisms through which cities propose to undertake research and innovation to meet climate goals. Low representation in some regions can be explained, in part, by the language limitations of the sampling. For example, very few strategies were identified in English for Latin America and the Caribbean and Southeast Asia. To ensure a broad sample, we have also included some English language summaries which are more likely to lack detail. Additional representation of cities in different regions may raise the profile of less common actions in the current sample. In aggregate, the findings provide an entry point for regional partners to deliberate on pathways to implementation as well as knowledge and innovation gaps to accelerate action. Detailed breakdowns of summary statistics relative to the proportion of the regional data in the overall sample are provided in the appendices.
Second, the analysis does not offer an evaluation of city progress or impact monitoring. A validation process is needed to assess the accuracy and robustness of claims made in city strategies, including the feasibility of interventions and predicted outcomes (such as emissions reduction potential). This process is also important for evaluating whether and how cities have identified the most urgent climate problems (e.g. local climate hazards or sources of high GHG emissions) to focus their resources. At a regional level, this work can inform national governments and regional and global city networks on what support and advocacy may be needed to strengthen these efforts in line with local and international climate targets, including multilevel coordination and investment.
To assess mitigation and adaptation activities and intended impacts in city climate strategies, the methodology treats mitigation and adaptation actions separately. Nevertheless, it is recognised that mitigation and adaptation mechanisms can overlap as well as providing valuable synergies. The city climate action databases include some actions that appear in both mitigation and adaptation datasets, such as tree planting with both carbon sequestration and cooling functions, however it is beyond the scope of this report to analyse these dual-functioning actions in detail.
The data summarised in this report thus provides an important baseline understanding of common focus areas and types of interventions employed by cities in different regions to evaluate their adequacy and facilitate deliberation on how to drive implementation. This knowledge provides a further incentive for cities to undertake R+I to meet existing commitments, establish more effective interventions, and scale up impacts by systematically addressing significant (local) climate problems, rather than focusing purely on immediate returns. The methodology also provides insights into the comprehensiveness of city climate strategies and highlights areas for improved strategy design and documentation. As key policy documents, city climate action plans can be strengthened by including more detailed analysis of prioritisation processes and anticipated outcomes at an action level to facilitate monitoring and evaluation. This context can also enable improved knowledge sharing and learning between cities with similar climate priorities regionally and globally.
Following publication of this report, a critical next step is to engage with regional city network partners and member cities to review and elaborate on the research and innovation needs for city climate action in the region, draft refined regional reports, and to identify pathways to accelerate implementation of the city research and action agenda. This process is important for refining and contextualising the desktop research findings, as well as developing further understanding of different forms of innovation applied in different contexts.
Key emerging questions for city decision-makers, city networks, other regional stakeholders and the research community:
– How can R+I support effective implementation of city climate plans in the focus areas identified for the region?
– Where is climate action lacking relative to major GHG emissions sources and climate change impacts in the region?
– How can cities in the region be supported to lead R+I to address climate problems (e.g. investment, partnerships)?
Following the 2018 Edmonton Cities and Climate Change Science Conference, the Innovate4Cities Conference will be held in October 2021 and represents a key milestone for advancing the city climate research and action agenda ahead of the 26th UN Climate Change Conference (COP 26) in November 2021.
The results presented in this report and developed in the subsequent regional deep dives are shaping understandings of city innovation as problem-solving or innovation with purpose. This framing is critical in the context of an ongoing global public health emergency where cities must act on climate change while addressing resident wellbeing and economic recovery. The Innovate4Cities Conference will convene key stakeholders across sectors and highlight regional city perspectives on policy, finance, technology, institutional, and grassroots innovations.
11
3. CITY CLIMATE ACTION, RESEARCH, AND INNOVATION PRIORITIES
––
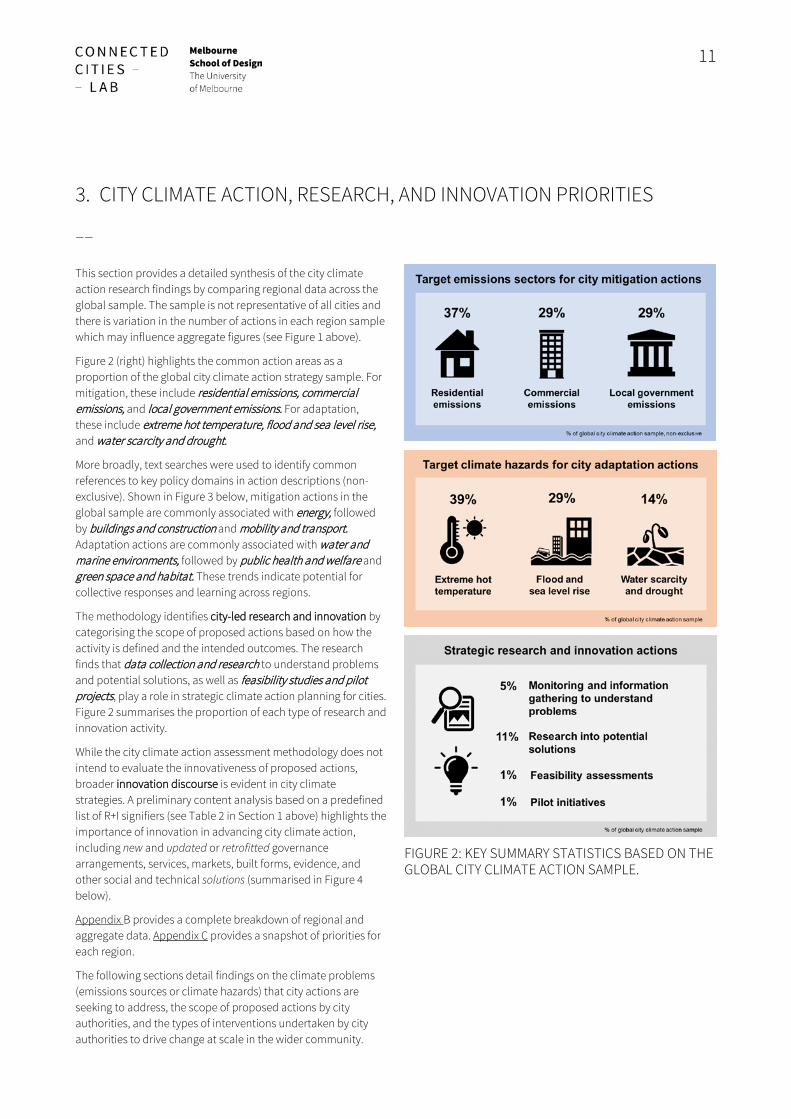
This section provides a detailed synthesis of the city climate action research findings by comparing regional data across the global sample. The sample is not representative of all cities and there is variation in the number of actions in each region sample which may influence aggregate figures (see Figure 1 above).
Figure 2 (right) highlights the common action areas as a proportion of the global city climate action strategy sample. For mitigation, these include residential emissions, commercial emissions, and local government emissions. For adaptation, these include extreme hot temperature, flood and sea level rise, and water scarcity and drought.
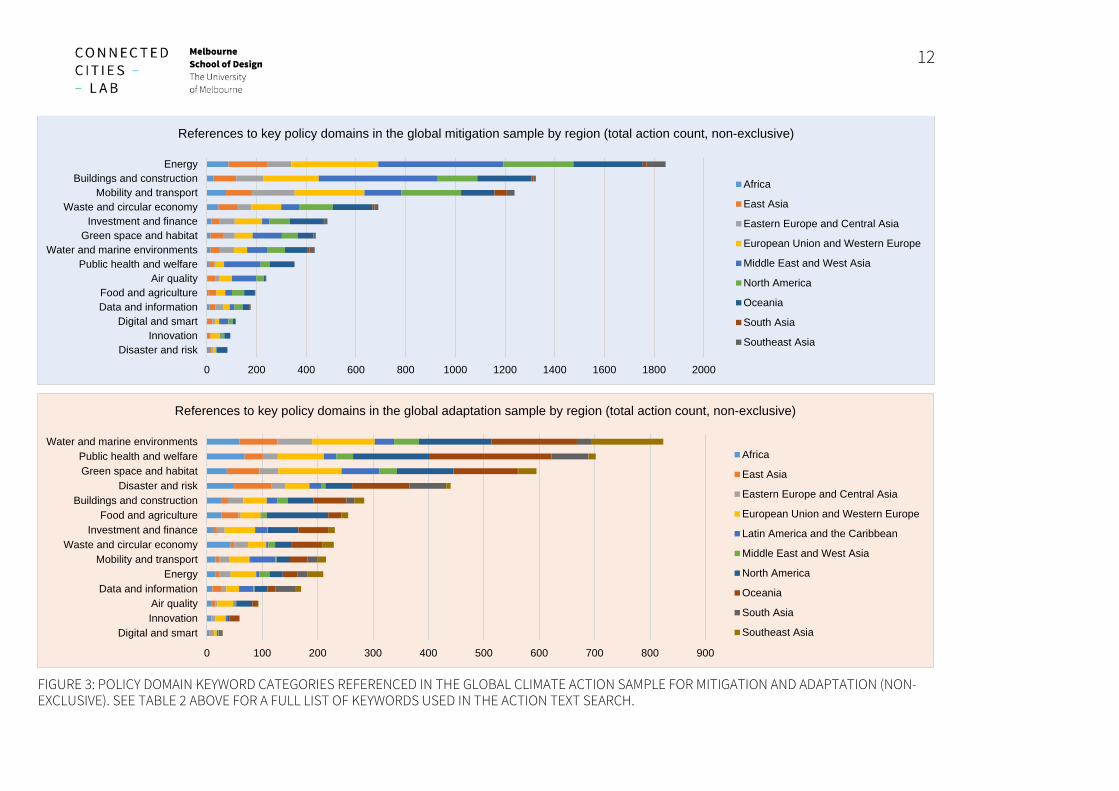
More broadly, text searches were used to identify common references to key policy domains in action descriptions (non-exclusive). Shown in Figure 3 below, mitigation actions in the global sample are commonly associated with energy, followed by buildings and construction and mobility and transport. Adaptation actions are commonly associated with water and marine environments, followed by public health and welfare and green space and habitat. These trends indicate potential for collective responses and learning across regions.
The methodology identifies city-led research and innovation by categorising the scope of proposed actions based on how the activity is defined and the intended outcomes. The research finds that data collection and research to understand problems and potential solutions, as well as feasibility studies and pilot projects, play a role in strategic climate action planning for cities. Figure 2 summarises the proportion of each type of research and innovation activity.
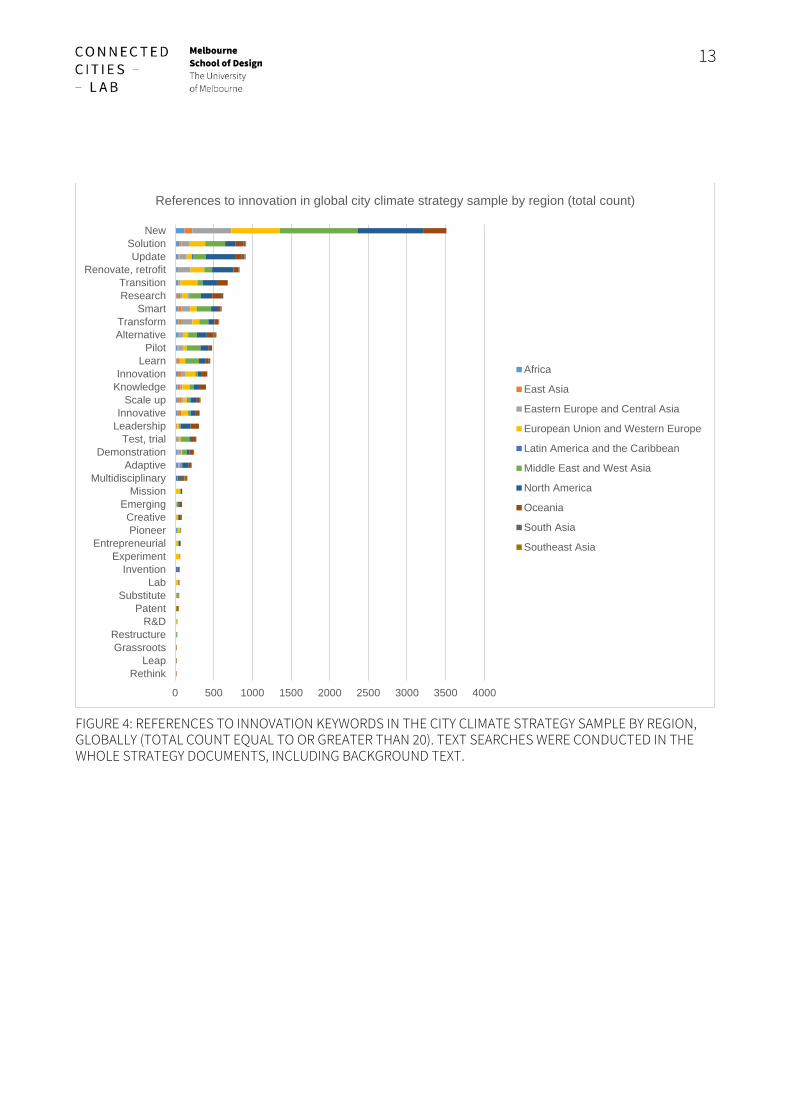
While the city climate action assessment methodology does not intend to evaluate the innovativeness of proposed actions, broader innovation discourse is evident in city climate strategies. A preliminary content analysis based on a predefined list of R+I signifiers (see Table 2 in Section 1 above) highlights the importance of innovation in advancing city climate action, including new and updated or retrofitted governance arrangements, services, markets, built forms, evidence, and other social and technical solutions (summarised in Figure 4 below).
Appendix B provides a complete breakdown of regional and aggregate data. Appendix C provides a snapshot of priorities for each region.
The following sections detail findings on the climate problems (emissions sources or climate hazards) that city actions are seeking to address, the scope of proposed actions by city authorities, and the types of interventions undertaken by city authorities to drive change at scale in the wider community.
FIGURE 2: KEY SUMMARY STATISTICS BASED ON THE GLOBAL CITY CLIMATE ACTION SAMPLE.
12
FIGURE 3: POLICY DOMAIN KEYWORD CATEGORIES REFERENCED IN THE GLOBAL CLIMATE ACTION SAMPLE FOR MITIGATION AND ADAPTATION (NON-EXCLUSIVE). SEE TABLE 2 ABOVE FOR A FULL LIST OF KEYWORDS USED IN THE ACTION TEXT SEARCH.
0 200 400 600 800 1000 1200 1400 1600 1800 2000
Disaster and riskInnovation
Digital and smartData and informationFood and agriculture
Air qualityPublic health and welfare
Water and marine environmentsGreen space and habitat
Investment and financeWaste and circular economy
Mobility and transportBuildings and construction
Energy
References to key policy domains in the global mitigation sample by region (total action count, non-exclusive)
Africa
East Asia
Eastern Europe and Central Asia
European Union and Western Europe
Middle East and West Asia
North America
Oceania
South Asia
Southeast Asia
0 100 200 300 400 500 600 700 800 900
Digital and smartInnovationAir quality
Data and informationEnergy
Mobility and transportWaste and circular economy
Investment and financeFood and agriculture
Buildings and constructionDisaster and risk
Green space and habitatPublic health and welfare
Water and marine environments
References to key policy domains in the global adaptation sample by region (total action count, non-exclusive)
Africa
East Asia
Eastern Europe and Central Asia
European Union and Western Europe
Latin America and the Caribbean
Middle East and West Asia
North America
Oceania
South Asia
Southeast Asia
13
FIGURE 4: REFERENCES TO INNOVATION KEYWORDS IN THE CITY CLIMATE STRATEGY SAMPLE BY REGION, GLOBALLY (TOTAL COUNT EQUAL TO OR GREATER THAN 20). TEXT SEARCHES WERE CONDUCTED IN THE WHOLE STRATEGY DOCUMENTS, INCLUDING BACKGROUND TEXT.
0 500 1000 1500 2000 2500 3000 3500 4000
RethinkLeap
GrassrootsRestructure
R&DPatent
SubstituteLab
InventionExperiment
EntrepreneurialPioneerCreative
EmergingMission
MultidisciplinaryAdaptive
DemonstrationTest, trial
LeadershipInnovative
Scale upKnowledgeInnovation
LearnPilot
AlternativeTransform
SmartResearchTransition
Renovate, retrofitUpdate
SolutionNew
References to innovation in global city climate strategy sample by region (total count)
Africa
East Asia
Eastern Europe and Central Asia
European Union and Western Europe
Latin America and the Caribbean
Middle East and West Asia
North America
Oceania
South Asia
Southeast Asia
14
4. CITY CLIMATE CHANGE MITIGATION ACTIONS BY REGION
––
4.1 UNDERSTANDING EMISSIONS AND IMPACTS
Our methodology identifies how climate change mitigation actions are defined relative to greenhouse gas emissions sources in the city by sector. This relationship indicates whether and how cities are targeting and prioritising emissions reductions. The research also identifies the analysis supporting proposed interventions as a baseline for monitoring and evaluation (as presented in the strategy documents).
Whether and how mitigation actions proposed in city climate strategy documents relate to understandings of emissions sources, trajectories, and mitigation potential vary within and between regions in the sample. These findings indicate potential for improved justification and transparency around mitigation actions in strategy documents to demonstrate effectiveness and monitor outcomes.
– Most mitigation actions in all regions target an emissions sector, ranging from 63 per cent (North America) to 99 per cent (Middle East and West Asia).
– The number of actions that quantify the target emissions sector range from zero (Southeast Asia), to 99 per cent (Middle East and West Asia).
– Similarly, actions that quantify the business as usual sector emissions trajectory range from zero (Southeast Asia) to 99 per cent (Middle East and West Asia).
– Fewer actions quantify the emissions reduction potential of the action, ranging from zero in some regions (European Union and Western Europe, North America, Southeast Asia), to 74 per cent (Middle East and West Asia).
– Likewise, actions that estimate action uptake (e.g. number of installations or purchases) range from less than one per cent (Africa, North America, Oceania) to 55 per cent (South Asia).
See Table 10 (Appendix B) for a complete breakdown of findings.
4.2 WHERE CITIES ARE PLANNING TO REDUCE GHG EMISSIONS
Across the global strategy sample, city mitigation actions most often target residential emissions (37 per cent), followed by commercial emissions (29 per cent) and local government emissions (29 per cent). Because some actions span multiple sectors, the figures for residential and commercial emissions are not exclusive. These trends are also evident at a regional level.
– Mitigation actions most commonly targeting residential emissions constitute between 37 per cent (European Union and Western Europe) and 71 per cent (South Asia) of actions in the strategy sample by region.
– For the Middle East and West Asia, mitigation actions most often target commercial emissions (38 per cent combined total).
– For North America, mitigation actions most often target local government emissions (34 per cent).
– Industrial and agricultural emissions sectors are the least represented in the strategy sample.
See Tables 11 and 12 (Appendix B) for a complete breakdown of findings.
15
4.4 STAGES OF CITY ACTION TO MITIGATE CLIMATE CHANGE
City mitigation actions are categorised by their scope of influence, or “action stage,” reflecting whether and how clearly an action is defined (location, stakeholders, implementation) and the scale of potential impact described (e.g. an initial test phase or wider rollout).
Most city mitigation actions in the global sample constitute interventions to drive emissions reductions at scale. This action stage category applies to actions that are clearly defined, have identifiable outcomes, and intend to create change in the wider community. This category is necessarily broad given the geographical variation in city capacities to act relative to institutional and cultural conditions (including regulatory authority and access to revenue). By region, interventions comprise 53 per cent (Africa) to 87 per cent (East Asia and South Asia) of all mitigation actions.
These actions differ from more general commitments to address an issue (six per cent of the global sample) or proposed or suggested actions requiring further definition (one per cent of the global sample). Likewise, R+I type actions constitute a smaller subset (17 per cent) of city mitigation actions. It is understandable that most actions fall under the “intervention” category as cities are evidently proposing clearly defined activities to mitigate/adapt to climate change. At the same time, commitments or proposed actions are important to document as they illuminate areas where cities may require further research and support or can experiment.
Explicit research and pilot type actions are less common which indicates that most strategies focus on direct action at scale. At the same time, cities clearly see a role in gathering new information, developing understanding, and testing new ideas as part of local climate change responses. Keyword searches indicate that few actions explicitly claim to be “innovative” (see Figure 3 above). While many interventions in the sample are likely to be considered innovative, it is outside of the scope of this research to evaluate the innovativeness of all actions in the database. This process would require a more in-depth analysis of the respective policy and socio-technical system conditions in the local context to identify technological, policy, and other social innovations underpinning city activities.
At a regional scale:
– Monitoring and information gathering actions range from two per cent (East Asia, European Union and Western Europe, Oceania) to nine per cent (Middle East and West Asia) of mitigation actions by region.
– Research and review actions range from zero (South Asia) to 19 per cent (Oceania) of mitigation actions by region. This category is the most common R+I action in the global sample (10 per cent).
– Feasibility assessment actions range from less than one per cent (Africa, Eastern Europe and Central Asia, South Asia) to seven per cent (Southeast Asia) of mitigation actions by region. This category is the least common R+I action in the global sample (one per cent).
– Pilot actions range from zero (South Asia, Southeast Asia) to two per cent (Eastern Europe and Central Asia, Middle East and West Asia, North America) of mitigation actions by region.
See Table 13 (Appendix B) for a breakdown of findings.
These findings suggest that there is scope for cities to integrate R+I activities more substantially in climate change mitigation action planning. Recognising calls for greater investment in urban innovations to support systems change, cities can consider how targeted research and pilot projects might address complex problems, facilitate reflexive governance, and inform pathways to wider implementation in collaboration with key stakeholders.
16
City mitigation interventions are categorised by the role undertaken by the city authority. While the intervention action stage includes very different mechanisms, this categorisation does not judge the effectiveness of respective activities undertaken by city authorities.
The most common type of city mitigation intervention in the global sample is financing and delivery (24 per cent). At a regional level, financing and delivery is the most common type of intervention for all bar two regions, ranging from 18 per cent (European Union and Western Europe) to 62 per cent (South Asia) of interventions by region. This category can be broadly understood as investment in development, including infrastructure projects and technology implementation, or direct provision of services.
Cities in the sample are less likely to be providing finance and loans (one per cent of the global mitigation sample), while provision of grants and incentives constitute five per cent of the global mitigation sample.
The next most common interventions include administration and strategy (16 per cent) and education (14 per cent). Education is most common among intervention type actions in the East Asia sample (18 per cent). Administration and strategy is most common for North America (27 per cent).
Advocacy (five per cent in the global mitigation sample) and facilitation (e.g. workshops) (three per cent in the global mitigation sample) indicate areas where collaboration and intervention are needed at higher levels of government and across sectors.
The least common types of city mitigation intervention in the global sample are financing and loans (provision of), mobilisation of other groups, and reporting and communication, each one per cent of interventions.
Only six per cent of actions in the global sample describe the cost-effectiveness of the intervention, ranging from zero (East Asia, European Union and Western Europe, Middle East and West Asia, Southeast Asia) to 34 per cent (Eastern Europe and Central Asia).
See Tables 14, 15, and 16 (Appendix B) for a breakdown of findings.
17
5. CITY CLIMATE CHANGE ADAPTATION ACTIONS BY REGION
––
5.1 UNDERSTANDING CLIMATE HAZARDS AND IMPACTS
Our methodology identifies how climate change adaptation actions are defined relative to (local) climate hazards. This relationship indicates whether and how cities are targeting and prioritising adaptation measures. The research also identifies the analysis supporting proposed interventions as a baseline for monitoring and evaluation (as presented in the strategy documents).
Whether and how adaptation actions proposed in city climate strategy documents relate to understandings of climate hazards, risk, and adaptation potential vary within and between regions in the sample. These findings highlight knowledge gaps around the potential effectiveness of adaptation measures relative to the likelihood and significance of climate change impacts.
– Adaptation actions linked to a climate hazard range from 21 per cent (European Union and Western Europe) to 100 per cent (South Asia). Note: in the case of South Asia, all adaptation plans in the sample were heatwave management plans.
– The number of actions that identify the likelihood of the climate hazard range from zero (Eastern Europe and Central Asia and Southeast Asia), to 100 per cent (South Asia).
– Similarly, actions that identify the significance of the climate hazard range from zero (Eastern Europe and Central Asia) to 100 per cent (South Asia).
– Few actions estimate the revised likelihood of the climate hazard resulting from the action: two per cent (four actions) in the Africa sample, and nine per cent (49 actions) in the European Union and Western Europe sample.
– Likewise, few actions estimate the revised significance of the climate hazard resulting from the action: seven per cent (41 actions) in the Oceania sample, and nine per cent (49 actions) in the European Union and Western Europe sample.
See Table 17 (Appendix B) for a complete breakdown of findings.
5.2 CLIMATE HAZARDS IDENTIFIED IN CITIES ADAPTATION MEASURES
Across the global strategy sample, city adaptation actions most often target extreme hot temperature (39 per cent), followed by flood and sea level rise (29 per cent) and water scarcity and drought (14 per cent). These trends are also evident at a regional level.
– Adaptation actions most commonly targeting extreme hot temperature constitute between 47 per cent (European Union and Western Europe) and 100 per cent (South Asia) of actions in the strategy sample by region.
– Adaptation actions most commonly targeting flood and sea level rise constitute between 30 per cent (Africa) and 58 per cent (Southeast Asia) of actions in the strategy sample by region.
– For the Middle East and West Asia, adaptation actions most often target water scarcity and drought (48 per cent).
– Extreme cold temperature, chemical change, mass movement, fire, and extreme precipitation are the least represented in the strategy sample.
See Tables 18 and 19 (Appendix B) for a complete breakdown of findings.

18
5.3 STAGES OF CITY ACTION TO ADAPT TO CLIMATE CHANGE
City adaptation actions are categorised by their scope of influence, or “action stage,” reflecting whether and how clearly an action is defined (location, stakeholders, implementation) and the scale of potential impact described (e.g. an initial test phase or wider rollout).
Most city adaptation actions in the global sample constitute interventions to adapt to climate hazards at scale. This action stage category applies to actions that are clearly defined and have identifiable outcomes. This action stage category applies to actions that are clearly defined, have identifiable outcomes, and intend to create change in the wider community. This category is necessarily broad given the geographical variation in city capacities to act relative to institutional and cultural conditions (including regulatory authority and access to revenue). By region, interventions comprise 43 per cent (Africa) to 86 per cent (Middle East and West Asia) of all adaptation actions.
These actions differ from more general commitments to address an issue (nine per cent of the global sample) or proposed or suggested actions requiring further definition (two per cent of the global sample). Likewise, R+I type actions constitute a smaller subset (20 per cent) of city mitigation actions. It is understandable that most actions fall under the “intervention” category as cities are evidently proposing clearly defined activities to mitigate/adapt to climate change. At the same time, commitments or proposed actions are important to document as they illuminate areas where cities may require further research and support or can experiment.
Explicit research and pilot type actions are less common which indicates that most strategies focus on direct action at scale. At the same time, cities clearly see a role in gathering new information, developing understanding, and testing new ideas as part of local climate change responses. Keyword searches indicate that few actions explicitly claim to be “innovative” (see Figure 3 above). While many interventions in the sample are likely to be considered innovative, it is outside of the scope of this research to evaluate the innovativeness of all actions in the database. This process would require a more in-depth analysis of the respective policy and socio-technical system conditions in the local context to identify technological, policy, and other social innovations underpinning city activities.
At a regional scale:
– Monitoring and information gathering actions range from three per cent (Middle East and West Asia) to 15 per cent (Eastern Europe and Central Asia) of adaptation actions by region.
– Research and review actions range from five per cent (East Asia) to 24 per cent (Latin America and the Caribbean) of adaptation actions by region. This category is the most common R+I action in the global sample (12 per cent).
– Feasibility assessment actions range from zero (Eastern Europe and Central Asia, Middle East and West Asia) to two per cent (South Asia) of adaptation actions by region. This category is the least common R+I action in the global sample (one per cent).
– Pilot actions range from zero (Middle East and West Asia) to five per cent (Eastern Europe and Central Asia) of mitigation actions by region.
See Table 20 (Appendix B) for a breakdown of findings.
These findings suggest that there is scope for cities to integrate R+I activities more substantially in climate adaptation action planning. Recognising calls for greater investment in urban innovations to support systems change, cities can consider how targeted research and pilot projects might address complex problems, facilitate reflexive governance, and inform pathways to wider implementation in collaboration with key stakeholders.
19
City adaptation interventions are categorised by the role undertaken by the city authority. While the intervention action stage includes very different mechanisms, this categorisation does not judge the effectiveness of respective activities undertaken by city authorities.
The most common type of city adaptation intervention in the global sample is administration and strategy (20 per cent), understood as the development of strategies and implementation plans. At a regional level, administration and strategy is the most common type of intervention for East Asia (20 per cent), North America (28 per cent), Oceania (31 per cent), and Southeast Asia (29 per cent).
The next most common interventions include financing and delivery (15 per cent), understood as investment in development or direct provision of services, and strategic planning (15 per cent), understood as the modification of urban planning strategies for implementation. Financing and delivery is the most common type of intervention for Africa (21 per cent), Eastern Europe and Central Asia (43 per cent), and Middle East and West Asia (23 per cent). Strategic planning is the most common type of intervention for European Union and Western Europe (21 per cent) and Latin America and the Caribbean (32 per cent).
Cities in the sample are less likely to be providing finance and loans (one per cent of the global adaptation sample), while provision of grants and incentives constitute three per cent of the global adaptation sample.
Reporting and communication is the most common type of intervention for South Asia (34 per cent).
Advocacy (four per cent in the global mitigation sample) and facilitation (e.g. workshops) (five per cent in the global mitigation sample) indicate areas where collaboration and intervention are needed at higher levels of government and across sectors.
The least common types of interventions in the global city adaptation sample are provision of financing and loans (one per cent) and mobilisation of other groups (two per cent).
Few actions in the global sample describe the cost-effectiveness of the intervention: six per cent of actions in the Africa sample, 15 per cent of actions in the Eastern Europe and Central Asia sample, and 59 per cent of actions in the Southeast Asia sample.
See Tables 21, 22, and 23 (Appendix B) for a breakdown of findings.
20
6. ADDITIONAL INSIGHTS ON PURPOSEFUL INNOVATION BY CITIES TO ADDRESS GRAND CHALLENGES
––
6.1 PRIORITY INSIGHTS FOR FUTURE CITY CLIMATE ACTION
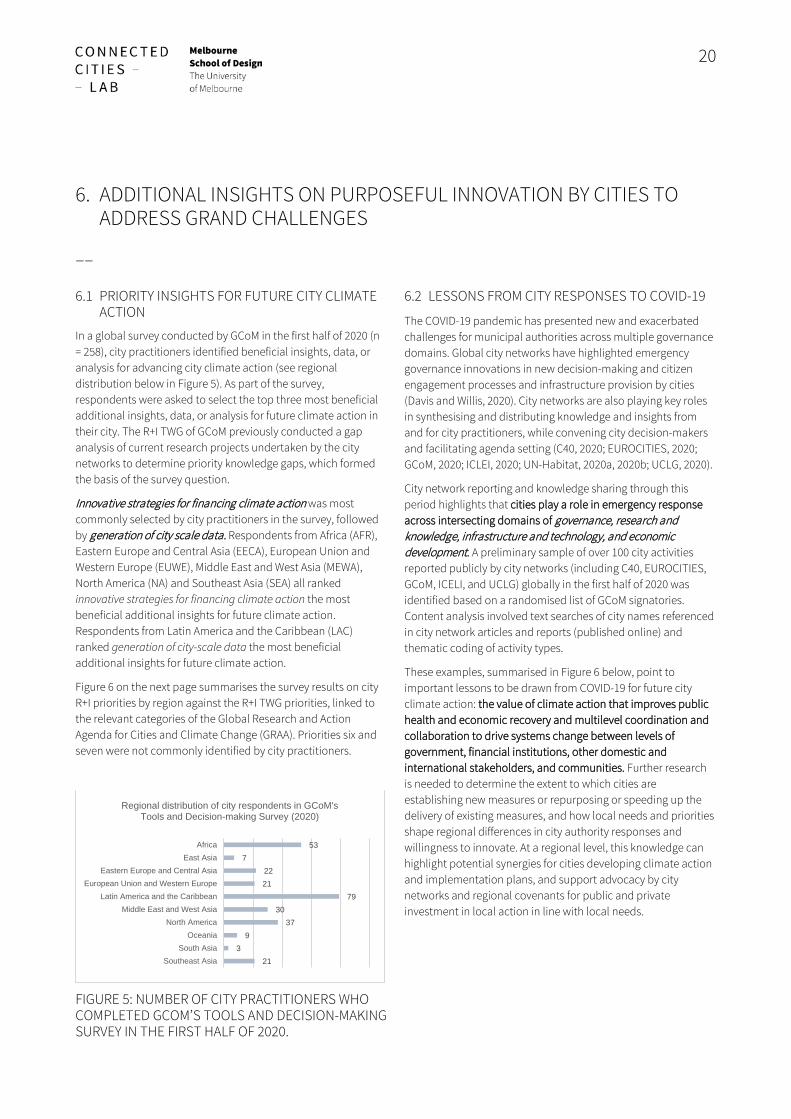
In a global survey conducted by GCoM in the first half of 2020 (n = 258), city practitioners identified beneficial insights, data, or analysis for advancing city climate action (see regional distribution below in Figure 5). As part of the survey, respondents were asked to select the top three most beneficial additional insights, data, or analysis for future climate action in their city. The R+I TWG of GCoM previously conducted a gap analysis of current research projects undertaken by the city networks to determine priority knowledge gaps, which formed the basis of the survey question.
Innovative strategies for financing climate action was most commonly selected by city practitioners in the survey, followed by generation of city scale data. Respondents from Africa (AFR), Eastern Europe and Central Asia (EECA), European Union and Western Europe (EUWE), Middle East and West Asia (MEWA), North America (NA) and Southeast Asia (SEA) all ranked innovative strategies for financing climate action the most beneficial additional insights for future climate action. Respondents from Latin America and the Caribbean (LAC) ranked generation of city-scale data the most beneficial additional insights for future climate action.
Figure 6 on the next page summarises the survey results on city R+I priorities by region against the R+I TWG priorities, linked to the relevant categories of the Global Research and Action Agenda for Cities and Climate Change (GRAA). Priorities six and seven were not commonly identified by city practitioners.
6.2 LESSONS FROM CITY RESPONSES TO COVID-19
The COVID-19 pandemic has presented new and exacerbated challenges for municipal authorities across multiple governance domains. Global city networks have highlighted emergency governance innovations in new decision-making and citizen engagement processes and infrastructure provision by cities (Davis and Willis, 2020). City networks are also playing key roles in synthesising and distributing knowledge and insights from and for city practitioners, while convening city decision-makers and facilitating agenda setting (C40, 2020; EUROCITIES, 2020; GCoM, 2020; ICLEI, 2020; UN-Habitat, 2020a, 2020b; UCLG, 2020).
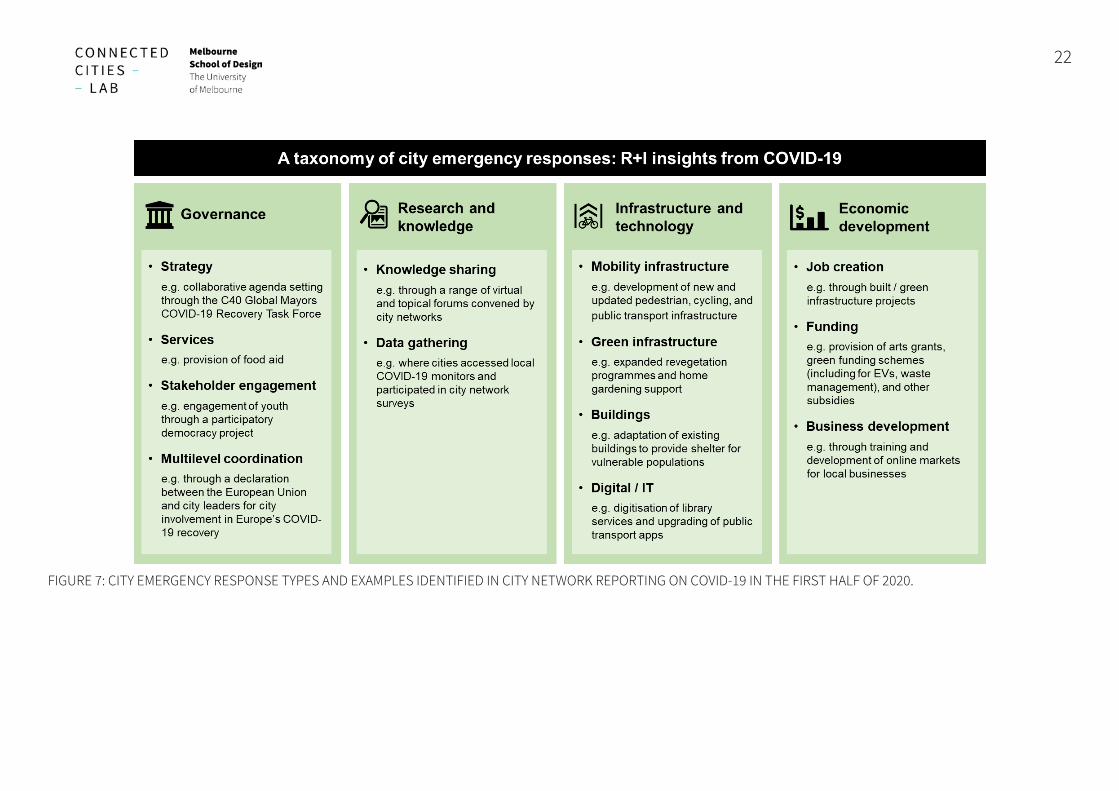
City network reporting and knowledge sharing through this period highlights that cities play a role in emergency response across intersecting domains of governance, research and knowledge, infrastructure and technology, and economic development. A preliminary sample of over 100 city activities reported publicly by city networks (including C40, EUROCITIES, GCoM, ICELI, and UCLG) globally in the first half of 2020 was identified based on a randomised list of GCoM signatories. Content analysis involved text searches of city names referenced in city network articles and reports (published online) and thematic coding of activity types.
These examples, summarised in Figure 6 below, point to important lessons to be drawn from COVID-19 for future city climate action: the value of climate action that improves public health and economic recovery and multilevel coordination and collaboration to drive systems change between levels of government, financial institutions, other domestic and international stakeholders, and communities. Further research is needed to determine the extent to which cities are establishing new measures or repurposing or speeding up the delivery of existing measures, and how local needs and priorities shape regional differences in city authority responses and willingness to innovate. At a regional level, this knowledge can highlight potential synergies for cities developing climate action and implementation plans, and support advocacy by city networks and regional covenants for public and private investment in local action in line with local needs.
FIGURE 5: NUMBER OF CITY PRACTITIONERS WHO COMPLETED GCOM’S TOOLS AND DECISION-MAKING SURVEY IN THE FIRST HALF OF 2020.
213
937
3079
2122
753
Southeast AsiaSouth Asia
OceaniaNorth America
Middle East and West AsiaLatin America and the Caribbean
European Union and Western EuropeEastern Europe and Central Asia
East AsiaAfrica
Regional distribution of city respondents in GCoM's Tools and Decision-making Survey (2020)

21
FIGURE 6: PRIORITY INSIGHTS MOST COMMONLY IDENTIFIED BY CITY PRACTITIONERS IN GCOM’S TOOLS AND DECISION-MAKING SURVEY (2020). THESE INSIGHTS WERE PREVIOUSLY IDENTIFIED AND RANKED BY GCOM’S R+I TWG IN 2019 AND RELATE TO THE GLOBAL RESEARCH AND ACTION AGENDA (GRAA) TOPICAL AREAS, CROSS-CUTTING THEMES, AND DELIVERY APPROACHES. FIGURES IN BRACKETS INDICATE TOTAL SELECTIONS BY SURVEY RESPONDENTS. REGIONS INCLUDE AFRICA (AFR), EAST ASIA (EA), EASTERN EUROPE AND CENTRAL ASIA (EECA), EUROPEAN UNION AND WESTERN EUROPE (EUWE), LATIN AMERICA AND THE CARIBBEAN (LAC), MIDDLE EAST AND WEST ASIA (MEWA), NORTH AMERICA (NA), OCEANIA (OCE), SOUTH ASIA (SA), AND SOUTHEAST ASIA (SEA).
22
FIGURE 7: CITY EMERGENCY RESPONSE TYPES AND EXAMPLES IDENTIFIED IN CITY NETWORK REPORTING ON COVID-19 IN THE FIRST HALF OF 2020.
23
7. CONCLUSIONS AND NEXT STEPS
––
Research and innovation (R+I) drive social and technical systems change through the application of new ideas, knowledge, products, processes, and policies (Edler and Fagerberg, 2017; Schot and Steinmueller, 2018; Howaldt et al., 2018). R+I is operationalised as a method of problem-solving to address ecological and social challenges in cities (OECD, 2019; Voytenko et al., 2016).
Our research sought to understand, at a regional scale, how cities approach research and innovation as part of their climate change action strategies. Building on the Global City Research and Action Agenda and the Innovate4Cities Research and Innovation Strategy, the findings represent a regional overview of trends in city climate action planning as well as knowledge gaps identified and R+I activities undertaken by municipalities in 2020. Aggregating city climate action data by region can support multi-scalar coordination between cities and other levels of government as well as improved advocacy for investment, policy change, and partnerships with private and civil sectors.
The research findings presented in this report elevate city perspectives at a regional scale, globally, to inform the work of city networks in supporting cities to implement climate actions. This research recognises the need for cities of various sizes and capabilities to work collectively to achieve climate change objectives, while attending to institutional, social, and environmental differences across regions.
The findings also provide a valuable knowledge base for researchers and practitioners to identify, understand, and advocate for research and innovation as problem-solving – or purposeful innovation – in the context of city climate action. This evidence aligns with emerging agendas on mission-oriented innovation policy (e.g. Mazzucato, 2021) and Mission Innovation, a global initiative of national governments to advance energy transitions. Our research demonstrates the role of cities as key implementation partners to achieve national and global commitments, testbeds for novel approaches to systemic challenges, and key authorities in setting the agenda for research and action in line with local needs and priorities.
This work ultimately provides a foundation for cities and regional partners from which to consider:
– Where research and innovation is needed to support city action in high impact emissions sectors and significant climate hazards;
– Opportunities for peer-to-peer learning and collaboration within and between regions, reflecting common focuses on climate problems, and
– Pathways to leverage multilevel governance coordination, international investment, and advocacy at a regional scale.
City authority and capacity to influence systems change will vary across regions due to institutional and cultural differences, including legislative authority and access to resources. City climate action must also address intersecting socio-economic challenges, highlighted and exacerbated by the ongoing COVID-19 pandemic. Identifying synergies between climate action and public health and wellbeing, social equity, and economic recovery is firmly on the policy agenda for cities (C40, 2020; GCoM, 2020). It is critical that cities are supported to address the scale and scope of climate change drivers and impacts and to develop effective interventions relevant to the local context, bridging the gap between ambition and implementation.
Further research is needed to better understand the scale of impact of existing city climate actions relative to the accuracy and robustness of climate change modelling and prioritisation. Contextualised analysis and documentation will strengthen knowledge sharing between cities and through city networks to meet global commitments and climate imperatives over the next decade. Further work is also needed to understand multilevel governance linkages, how climate action plans align with long-term municipal visions, budgeting, and urban development, and how co-benefits are defined and achieved as valuable drivers and outcomes for integrated policy-making, accounting for the cost of inaction and shared values.
A key next step is to engage with regional city network partners and member cities to review and elaborate on the research and innovation needs for city climate action in the region and to identify pathways to accelerate implementation of the city research and action agenda. Regional deep dive workshops will seek to better understand how R+I can support climate action implementation, where action is lacking relative to urgent climate problems, and how cities can be supported to lead R+I, in line with regional priorities and needs. This work will contribute to the upcoming Innovate4Cities Conference in October 2021 as a key milestone ahead of the 26th UN Climate Change Conference (COP 26) in November 2021.

24
REFERENCES
––
C40 Cities (2020) C40 Mayors’ Agenda for a Green and Just Recovery. https://www.c40knowledgehub.org/s/article/C40-Mayors-Agenda-for-a-Green-and-Just-Recovery
Davis, D. E. and Willis, G. D. (2020). Emergency Governance for Cities and Regions. Retrieved from: https://www.uclg.org/en/media/news/within-framework-emergency-governance-initiative-uclg-metropolis-and-lse-cities-publish
Edler, J. and Fagerberg, J. (2017). Innovation policy: What, why, and how. Oxford Review of Economic Policy, 33(1), 2-23. https://doi.org/10.1093/oxrep/grx001
EUROCITIES. (2020). Live updates COVID-19. https://covidnews.eurocities.eu/
Global Covenant of Mayors for Climate & Energy. (2020). Over 10,000 Cities Worldwide Call on all Governments for a Global Green Recovery. https://www.globalcovenantofmayors.org/press/statement-global-covenant-of-mayors-mayoral-board-on-covid-19-green-recovery/
Howaldt et al. (eds.) (2018). Atlas of Social Innovation: New Practices for a Better Future. Sozialforschungsstelle, TU Dortmund University: Dortmund. Available at: https://www.socialinnovationatlas.net/articles/
Local Governments for Sustainability (ICLEI). (2020). COVID-19 Resources. https://iclei.org/en/covid19_resources.html
Mazzucato, M. (2021). Mission Economy: A Moonshot Guide to Changing Capitalism. Allen Lane, Penguin Random House, UK.
OECD. (2019). Enhancing Innovation Capacity in City Government. OECD Publishing, Paris. Available at: https://doi.org/10.1787/f10c96e5-en.
Schot, J. & Steinmueller, E. (2018). Three frames for innovation policy: R&D, systems of innovation and transformative change. Research Policy, 47:9. https://linkinghub.elsevier.com/retrieve/pii/S0048733318301987
UNFCCC (2021) Nationally determined contributions under the Paris Agreement. https://unfccc.int/process-and-meetings/the-paris-agreement/nationally-determined-contributions-ndcs/nationally-determined-contributions-ndcs/ndc-synthesis-report
UN-Habitat. (2020a). City Index. https://unhabitat.citiiq.com/
UN-Habitat. (2020b). UN-Habitat COVID-19 Response Plan. Retrieved from: https://unhabitat.org/sites/default/files/2020/04/final_un-habitat_covid-19_response_plan.pdf
United Cities and Local Government (UCLG). (2020). Live Learning Experience #BeyondTheOutbreak. https://www.uclg.org/en/issues/live-learning-experience-beyondtheoutbreak
Voytekno, Y., McCormick, K., Evans, J., & Schliwa, G. (2016). Urban living labs for sustainability and low carbon cities in Europe: towards a research agenda. Journal of Cleaner Production, 123. https://doi.org/10.1016/j.jclepro.2015.08.053
World Climate Research Programme. (2019). Global Research and Action Agenda on Cities and Climate Change Science - Full Version. Prieur-Richard, A.H., B. Walsh, M. Craig, M.L. Melamed, M. Colbert, M. Pathak, S. Connors, X. Bai, A. Barau, H. Bulkeley, H. Cleugh, M. Cohen, S. Colenbrander, D. Dodman, S. Dhakal, R. Dawson, J. Espey, J. Greenwalt, P. Kurian, B. Lee, L. Leonardsen, V. Masson-Delmotte, D. Munshi, A. Okem, G.C. Delgado Ramos, R. Sanchez Rodriguez, D. Roberts, C. Rosenzweig, S. Schultz, K. Seto, W. Solecki, M. van Staden, and D. Ürge-Vorsatz (Eds.). Available at: https://www.wcrp-climate.org/WCRP-publications/2019/GRAA-Cities-and-Climate-Change-Science-Full.pdf
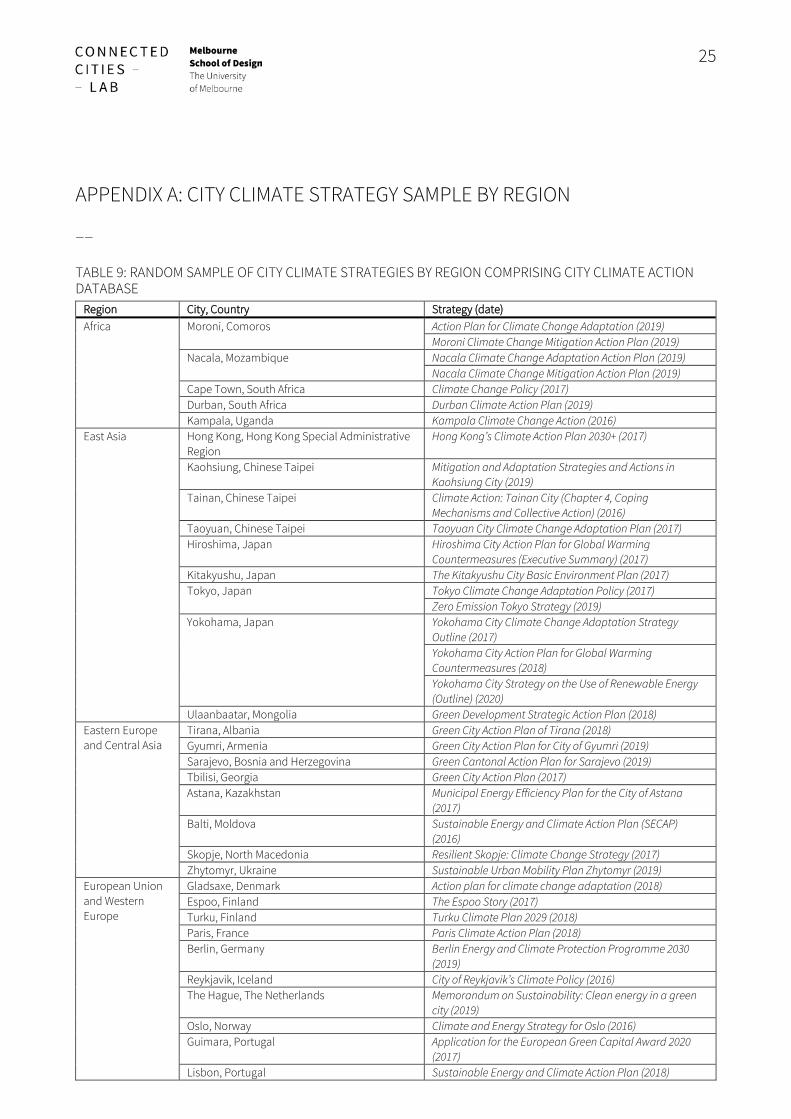
25
APPENDIX A: CITY CLIMATE STRATEGY SAMPLE BY REGION
––
TABLE 9: RANDOM SAMPLE OF CITY CLIMATE STRATEGIES BY REGION COMPRISING CITY CLIMATE ACTION DATABASE
Region City, Country Strategy (date) Africa Moroni, Comoros Action Plan for Climate Change Adaptation (2019)
Moroni Climate Change Mitigation Action Plan (2019) Nacala, Mozambique Nacala Climate Change Adaptation Action Plan (2019)
Nacala Climate Change Mitigation Action Plan (2019) Cape Town, South Africa Climate Change Policy (2017) Durban, South Africa Durban Climate Action Plan (2019) Kampala, Uganda Kampala Climate Change Action (2016)
East Asia Hong Kong, Hong Kong Special Administrative Region
Hong Kong’s Climate Action Plan 2030+ (2017)
Kaohsiung, Chinese Taipei Mitigation and Adaptation Strategies and Actions in Kaohsiung City (2019)
Tainan, Chinese Taipei Climate Action: Tainan City (Chapter 4, Coping Mechanisms and Collective Action) (2016)
Taoyuan, Chinese Taipei Taoyuan City Climate Change Adaptation Plan (2017) Hiroshima, Japan Hiroshima City Action Plan for Global Warming
Countermeasures (Executive Summary) (2017) Kitakyushu, Japan The Kitakyushu City Basic Environment Plan (2017) Tokyo, Japan Tokyo Climate Change Adaptation Policy (2017)
Zero Emission Tokyo Strategy (2019) Yokohama, Japan Yokohama City Climate Change Adaptation Strategy
Outline (2017) Yokohama City Action Plan for Global Warming Countermeasures (2018) Yokohama City Strategy on the Use of Renewable Energy (Outline) (2020)
Ulaanbaatar, Mongolia Green Development Strategic Action Plan (2018) Eastern Europe and Central Asia
Tirana, Albania Green City Action Plan of Tirana (2018) Gyumri, Armenia Green City Action Plan for City of Gyumri (2019) Sarajevo, Bosnia and Herzegovina Green Cantonal Action Plan for Sarajevo (2019) Tbilisi, Georgia Green City Action Plan (2017) Astana, Kazakhstan Municipal Energy Efficiency Plan for the City of Astana
(2017) Balti, Moldova Sustainable Energy and Climate Action Plan (SECAP)
(2016) Skopje, North Macedonia Resilient Skopje: Climate Change Strategy (2017) Zhytomyr, Ukraine Sustainable Urban Mobility Plan Zhytomyr (2019)
European Union and Western Europe
Gladsaxe, Denmark Action plan for climate change adaptation (2018) Espoo, Finland The Espoo Story (2017) Turku, Finland Turku Climate Plan 2029 (2018) Paris, France Paris Climate Action Plan (2018) Berlin, Germany Berlin Energy and Climate Protection Programme 2030
(2019) Reykjavik, Iceland City of Reykjavik’s Climate Policy (2016) The Hague, The Netherlands Memorandum on Sustainability: Clean energy in a green
city (2019) Oslo, Norway Climate and Energy Strategy for Oslo (2016) Guimara, Portugal Application for the European Green Capital Award 2020
(2017) Lisbon, Portugal Sustainable Energy and Climate Action Plan (2018)
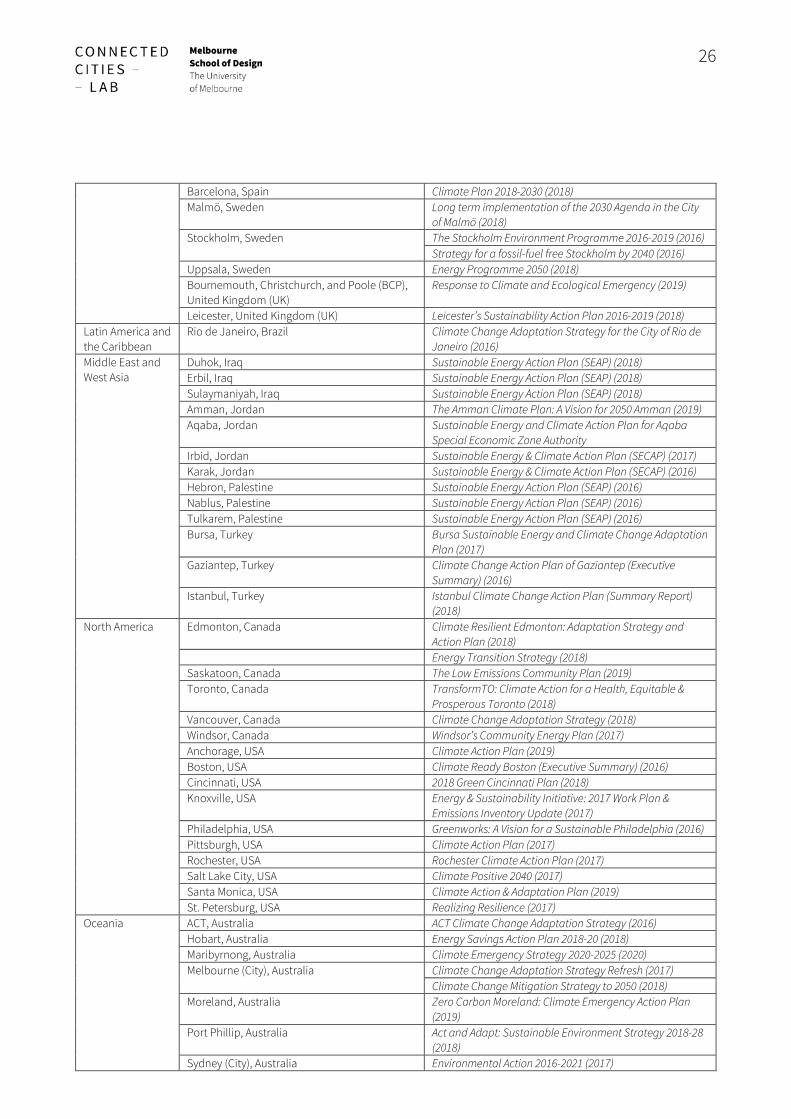
26
Barcelona, Spain Climate Plan 2018-2030 (2018) Malmö, Sweden Long term implementation of the 2030 Agenda in the City
of Malmö (2018) Stockholm, Sweden The Stockholm Environment Programme 2016-2019 (2016)
Strategy for a fossil-fuel free Stockholm by 2040 (2016) Uppsala, Sweden Energy Programme 2050 (2018) Bournemouth, Christchurch, and Poole (BCP), United Kingdom (UK)
Response to Climate and Ecological Emergency (2019)
Leicester, United Kingdom (UK) Leicester’s Sustainability Action Plan 2016-2019 (2018) Latin America and the Caribbean
Rio de Janeiro, Brazil Climate Change Adaptation Strategy for the City of Rio de Janeiro (2016)
Middle East and West Asia
Duhok, Iraq Sustainable Energy Action Plan (SEAP) (2018) Erbil, Iraq Sustainable Energy Action Plan (SEAP) (2018) Sulaymaniyah, Iraq Sustainable Energy Action Plan (SEAP) (2018) Amman, Jordan The Amman Climate Plan: A Vision for 2050 Amman (2019) Aqaba, Jordan Sustainable Energy and Climate Action Plan for Aqaba
Special Economic Zone Authority Irbid, Jordan Sustainable Energy & Climate Action Plan (SECAP) (2017) Karak, Jordan Sustainable Energy & Climate Action Plan (SECAP) (2016) Hebron, Palestine Sustainable Energy Action Plan (SEAP) (2016) Nablus, Palestine Sustainable Energy Action Plan (SEAP) (2016) Tulkarem, Palestine Sustainable Energy Action Plan (SEAP) (2016) Bursa, Turkey Bursa Sustainable Energy and Climate Change Adaptation
Plan (2017) Gaziantep, Turkey Climate Change Action Plan of Gaziantep (Executive
Summary) (2016) Istanbul, Turkey Istanbul Climate Change Action Plan (Summary Report)
(2018) North America Edmonton, Canada Climate Resilient Edmonton: Adaptation Strategy and
Action Plan (2018) Energy Transition Strategy (2018) Saskatoon, Canada The Low Emissions Community Plan (2019) Toronto, Canada TransformTO: Climate Action for a Health, Equitable &
Prosperous Toronto (2018) Vancouver, Canada Climate Change Adaptation Strategy (2018) Windsor, Canada Windsor’s Community Energy Plan (2017) Anchorage, USA Climate Action Plan (2019) Boston, USA Climate Ready Boston (Executive Summary) (2016) Cincinnati, USA 2018 Green Cincinnati Plan (2018) Knoxville, USA Energy & Sustainability Initiative: 2017 Work Plan &
Emissions Inventory Update (2017) Philadelphia, USA Greenworks: A Vision for a Sustainable Philadelphia (2016) Pittsburgh, USA Climate Action Plan (2017) Rochester, USA Rochester Climate Action Plan (2017) Salt Lake City, USA Climate Positive 2040 (2017) Santa Monica, USA Climate Action & Adaptation Plan (2019) St. Petersburg, USA Realizing Resilience (2017)
Oceania ACT, Australia ACT Climate Change Adaptation Strategy (2016) Hobart, Australia Energy Savings Action Plan 2018-20 (2018) Maribyrnong, Australia Climate Emergency Strategy 2020-2025 (2020) Melbourne (City), Australia Climate Change Adaptation Strategy Refresh (2017)
Climate Change Mitigation Strategy to 2050 (2018) Moreland, Australia Zero Carbon Moreland: Climate Emergency Action Plan
(2019) Port Phillip, Australia Act and Adapt: Sustainable Environment Strategy 2018-28
(2018) Sydney (City), Australia Environmental Action 2016-2021 (2017)
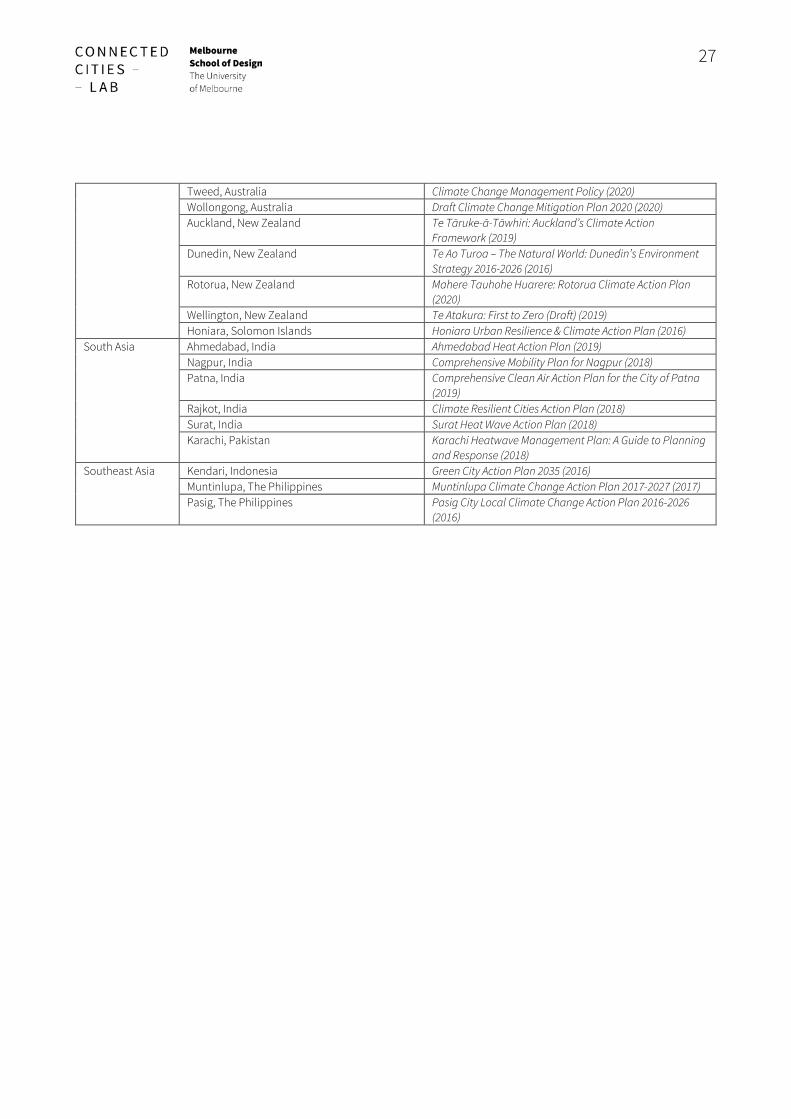
27
Tweed, Australia Climate Change Management Policy (2020) Wollongong, Australia Draft Climate Change Mitigation Plan 2020 (2020) Auckland, New Zealand Te Tāruke-ā-Tāwhiri: Auckland’s Climate Action
Framework (2019) Dunedin, New Zealand Te Ao Turoa – The Natural World: Dunedin’s Environment
Strategy 2016-2026 (2016) Rotorua, New Zealand Mahere Tauhohe Huarere: Rotorua Climate Action Plan
(2020) Wellington, New Zealand Te Atakura: First to Zero (Draft) (2019) Honiara, Solomon Islands Honiara Urban Resilience & Climate Action Plan (2016)
South Asia Ahmedabad, India Ahmedabad Heat Action Plan (2019) Nagpur, India Comprehensive Mobility Plan for Nagpur (2018) Patna, India Comprehensive Clean Air Action Plan for the City of Patna
(2019) Rajkot, India Climate Resilient Cities Action Plan (2018) Surat, India Surat Heat Wave Action Plan (2018) Karachi, Pakistan Karachi Heatwave Management Plan: A Guide to Planning
and Response (2018) Southeast Asia Kendari, Indonesia Green City Action Plan 2035 (2016)
Muntinlupa, The Philippines Muntinlupa Climate Change Action Plan 2017-2027 (2017) Pasig, The Philippines Pasig City Local Climate Change Action Plan 2016-2026
(2016)
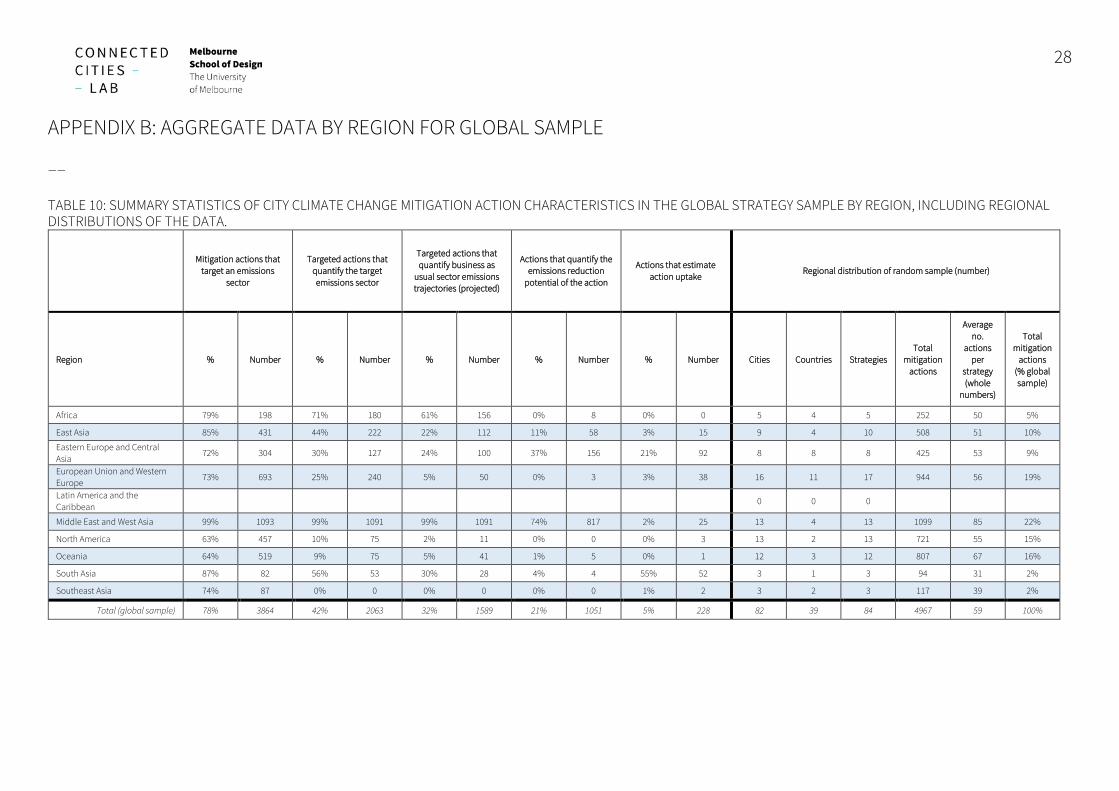
28
APPENDIX B: AGGREGATE DATA BY REGION FOR GLOBAL SAMPLE
––
TABLE 10: SUMMARY STATISTICS OF CITY CLIMATE CHANGE MITIGATION ACTION CHARACTERISTICS IN THE GLOBAL STRATEGY SAMPLE BY REGION, INCLUDING REGIONAL DISTRIBUTIONS OF THE DATA.
Mitigation actions that
target an emissions sector
Targeted actions that quantify the target emissions sector
Targeted actions that quantify business as
usual sector emissions trajectories (projected)
Actions that quantify the emissions reduction
potential of the action
Actions that estimate action uptake
Regional distribution of random sample (number)
Region % Number % Number % Number % Number % Number Cities Countries Strategies Total
mitigation actions
Average no.
actions per
strategy (whole
numbers)
Total mitigation
actions (% global sample)
Africa 79% 198 71% 180 61% 156 0% 8 0% 0 5 4 5 252 50 5%
East Asia 85% 431 44% 222 22% 112 11% 58 3% 15 9 4 10 508 51 10%
Eastern Europe and Central Asia
72% 304 30% 127 24% 100 37% 156 21% 92 8 8 8 425 53 9%
European Union and Western Europe
73% 693 25% 240 5% 50 0% 3 3% 38 16 11 17 944 56 19%
Latin America and the Caribbean
0 0 0
Middle East and West Asia 99% 1093 99% 1091 99% 1091 74% 817 2% 25 13 4 13 1099 85 22%
North America 63% 457 10% 75 2% 11 0% 0 0% 3 13 2 13 721 55 15%
Oceania 64% 519 9% 75 5% 41 1% 5 0% 1 12 3 12 807 67 16%
South Asia 87% 82 56% 53 30% 28 4% 4 55% 52 3 1 3 94 31 2%
Southeast Asia 74% 87 0% 0 0% 0 0% 0 1% 2 3 2 3 117 39 2%
Total (global sample) 78% 3864 42% 2063 32% 1589 21% 1051 5% 228 82 39 84 4967 59 100%
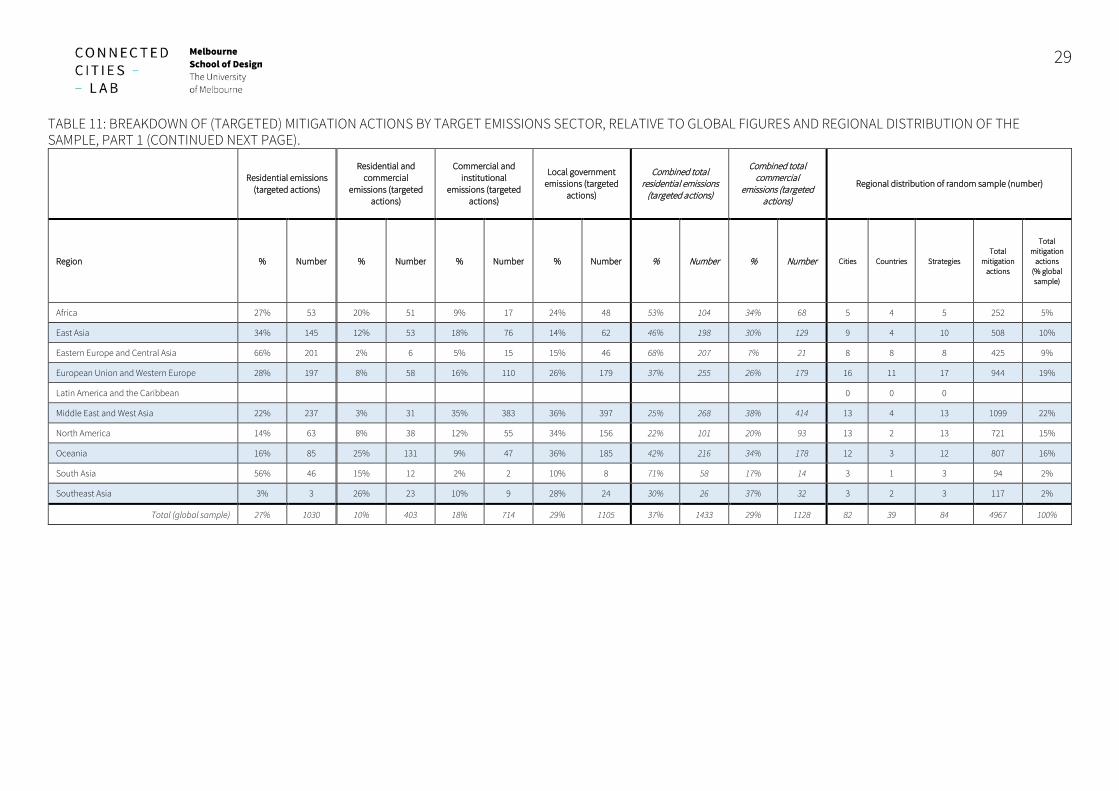
29
TABLE 11: BREAKDOWN OF (TARGETED) MITIGATION ACTIONS BY TARGET EMISSIONS SECTOR, RELATIVE TO GLOBAL FIGURES AND REGIONAL DISTRIBUTION OF THE SAMPLE, PART 1 (CONTINUED NEXT PAGE).
Residential emissions (targeted actions)
Residential and
commercial emissions (targeted
actions)
Commercial and institutional
emissions (targeted actions)
Local government emissions (targeted
actions)
Combined total residential emissions
(targeted actions)
Combined total commercial
emissions (targeted actions)
Regional distribution of random sample (number)
Region % Number
% Number % Number % Number % Number % Number Cities Countries Strategies Total
mitigation actions
Total mitigation
actions (% global sample)
Africa 27% 53 20% 51 9% 17 24% 48 53% 104 34% 68 5 4 5 252 5%
East Asia 34% 145 12% 53 18% 76 14% 62 46% 198 30% 129 9 4 10 508 10%
Eastern Europe and Central Asia 66% 201 2% 6 5% 15 15% 46 68% 207 7% 21 8 8 8 425 9%
European Union and Western Europe 28% 197 8% 58 16% 110 26% 179 37% 255 26% 179 16 11 17 944 19%
Latin America and the Caribbean 0 0 0
Middle East and West Asia 22% 237 3% 31 35% 383 36% 397 25% 268 38% 414 13 4 13 1099 22%
North America 14% 63 8% 38 12% 55 34% 156 22% 101 20% 93 13 2 13 721 15%
Oceania 16% 85 25% 131 9% 47 36% 185 42% 216 34% 178 12 3 12 807 16%
South Asia 56% 46 15% 12 2% 2 10% 8 71% 58 17% 14 3 1 3 94 2%
Southeast Asia 3% 3 26% 23 10% 9 28% 24 30% 26 37% 32 3 2 3 117 2%
Total (global sample) 27% 1030 10% 403 18% 714 29% 1105 37% 1433 29% 1128 82 39 84 4967 100%
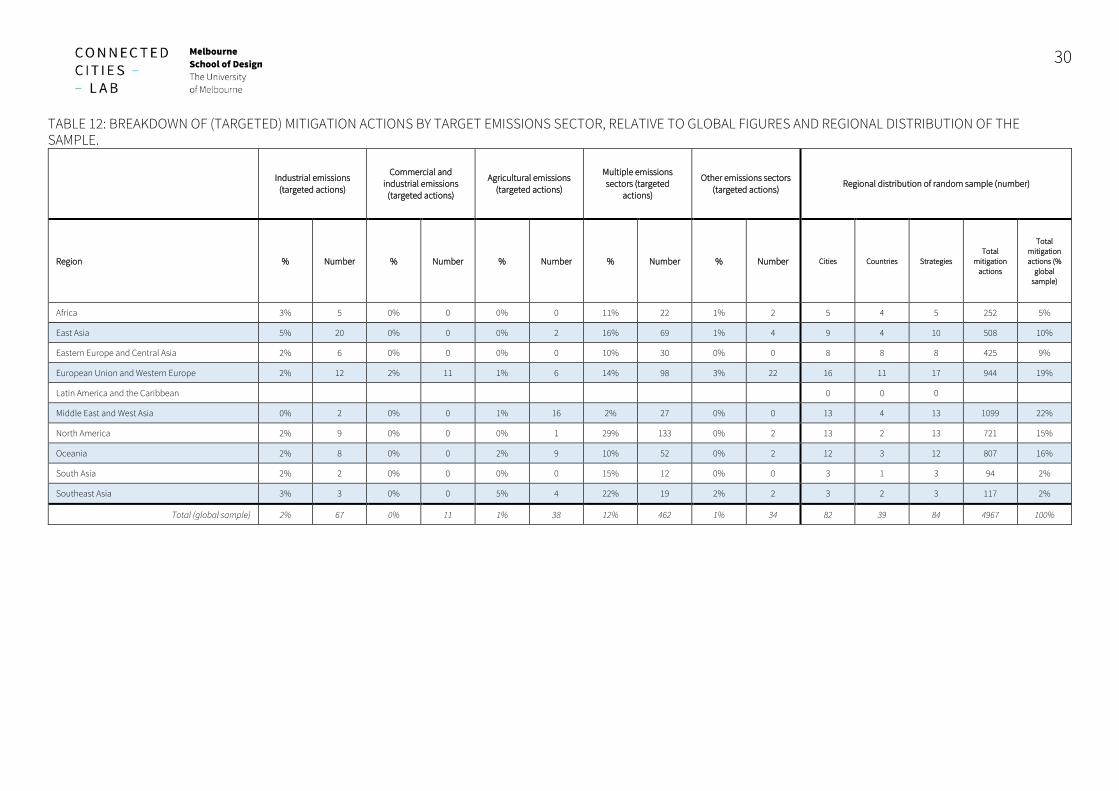
30
TABLE 12: BREAKDOWN OF (TARGETED) MITIGATION ACTIONS BY TARGET EMISSIONS SECTOR, RELATIVE TO GLOBAL FIGURES AND REGIONAL DISTRIBUTION OF THE SAMPLE.
Industrial emissions (targeted actions)
Commercial and industrial emissions
(targeted actions)
Agricultural emissions (targeted actions)
Multiple emissions sectors (targeted
actions)
Other emissions sectors (targeted actions)
Regional distribution of random sample (number)
Region % Number % Number % Number % Number % Number Cities Countries Strategies Total
mitigation actions
Total mitigation actions (%
global sample)
Africa 3% 5 0% 0 0% 0 11% 22 1% 2 5 4 5 252 5%
East Asia 5% 20 0% 0 0% 2 16% 69 1% 4 9 4 10 508 10%
Eastern Europe and Central Asia 2% 6 0% 0 0% 0 10% 30 0% 0 8 8 8 425 9%
European Union and Western Europe 2% 12 2% 11 1% 6 14% 98 3% 22 16 11 17 944 19%
Latin America and the Caribbean 0 0 0
Middle East and West Asia 0% 2 0% 0 1% 16 2% 27 0% 0 13 4 13 1099 22%
North America 2% 9 0% 0 0% 1 29% 133 0% 2 13 2 13 721 15%
Oceania 2% 8 0% 0 2% 9 10% 52 0% 2 12 3 12 807 16%
South Asia 2% 2 0% 0 0% 0 15% 12 0% 0 3 1 3 94 2%
Southeast Asia 3% 3 0% 0 5% 4 22% 19 2% 2 3 2 3 117 2%
Total (global sample) 2% 67 0% 11 1% 38 12% 462 1% 34 82 39 84 4967 100%
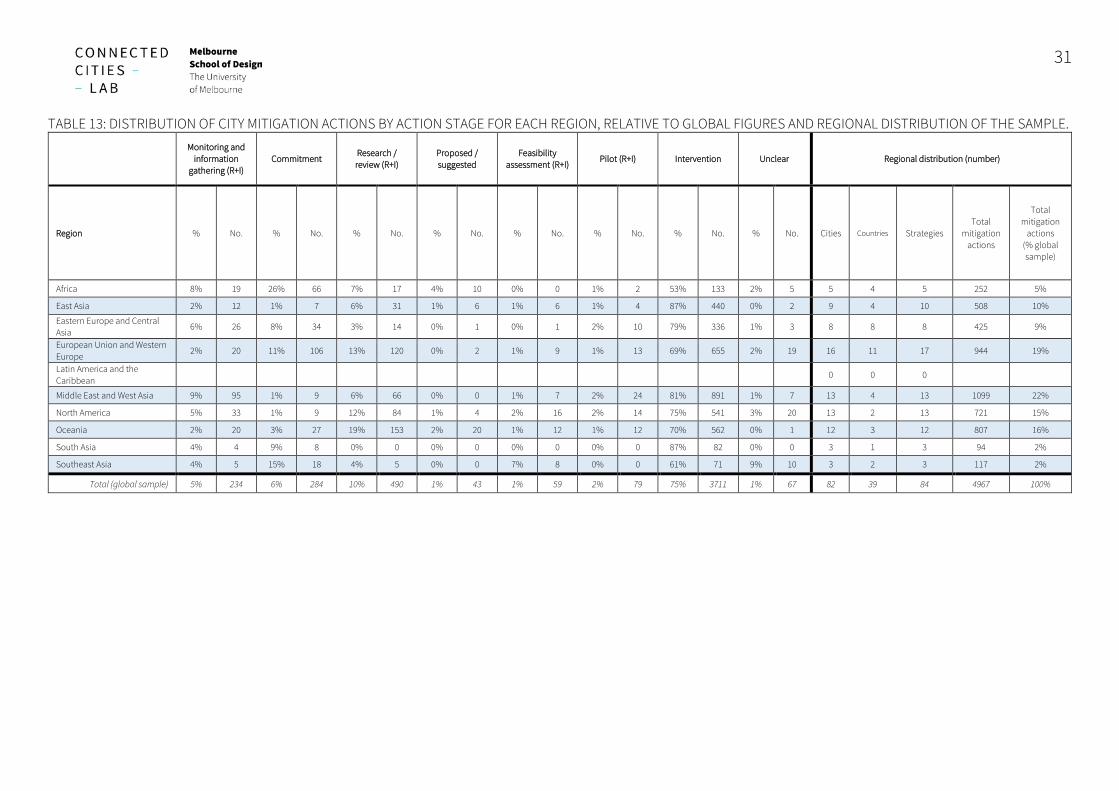
31
TABLE 13: DISTRIBUTION OF CITY MITIGATION ACTIONS BY ACTION STAGE FOR EACH REGION, RELATIVE TO GLOBAL FIGURES AND REGIONAL DISTRIBUTION OF THE SAMPLE.
Monitoring and
information gathering (R+I)
Commitment Research / review (R+I)
Proposed / suggested
Feasibility assessment (R+I)
Pilot (R+I) Intervention Unclear Regional distribution (number)
Region % No. % No. % No. % No. % No. % No. % No. % No. Cities Countries Strategies Total
mitigation actions
Total mitigation
actions (% global sample)
Africa 8% 19 26% 66 7% 17 4% 10 0% 0 1% 2 53% 133 2% 5 5 4 5 252 5%
East Asia 2% 12 1% 7 6% 31 1% 6 1% 6 1% 4 87% 440 0% 2 9 4 10 508 10%
Eastern Europe and Central Asia
6% 26 8% 34 3% 14 0% 1 0% 1 2% 10 79% 336 1% 3 8 8 8 425 9%
European Union and Western Europe
2% 20 11% 106 13% 120 0% 2 1% 9 1% 13 69% 655 2% 19 16 11 17 944 19%
Latin America and the Caribbean
0 0 0
Middle East and West Asia 9% 95 1% 9 6% 66 0% 0 1% 7 2% 24 81% 891 1% 7 13 4 13 1099 22%
North America 5% 33 1% 9 12% 84 1% 4 2% 16 2% 14 75% 541 3% 20 13 2 13 721 15%
Oceania 2% 20 3% 27 19% 153 2% 20 1% 12 1% 12 70% 562 0% 1 12 3 12 807 16%
South Asia 4% 4 9% 8 0% 0 0% 0 0% 0 0% 0 87% 82 0% 0 3 1 3 94 2%
Southeast Asia 4% 5 15% 18 4% 5 0% 0 7% 8 0% 0 61% 71 9% 10 3 2 3 117 2%
Total (global sample) 5% 234 6% 284 10% 490 1% 43 1% 59 2% 79 75% 3711 1% 67 82 39 84 4967 100%
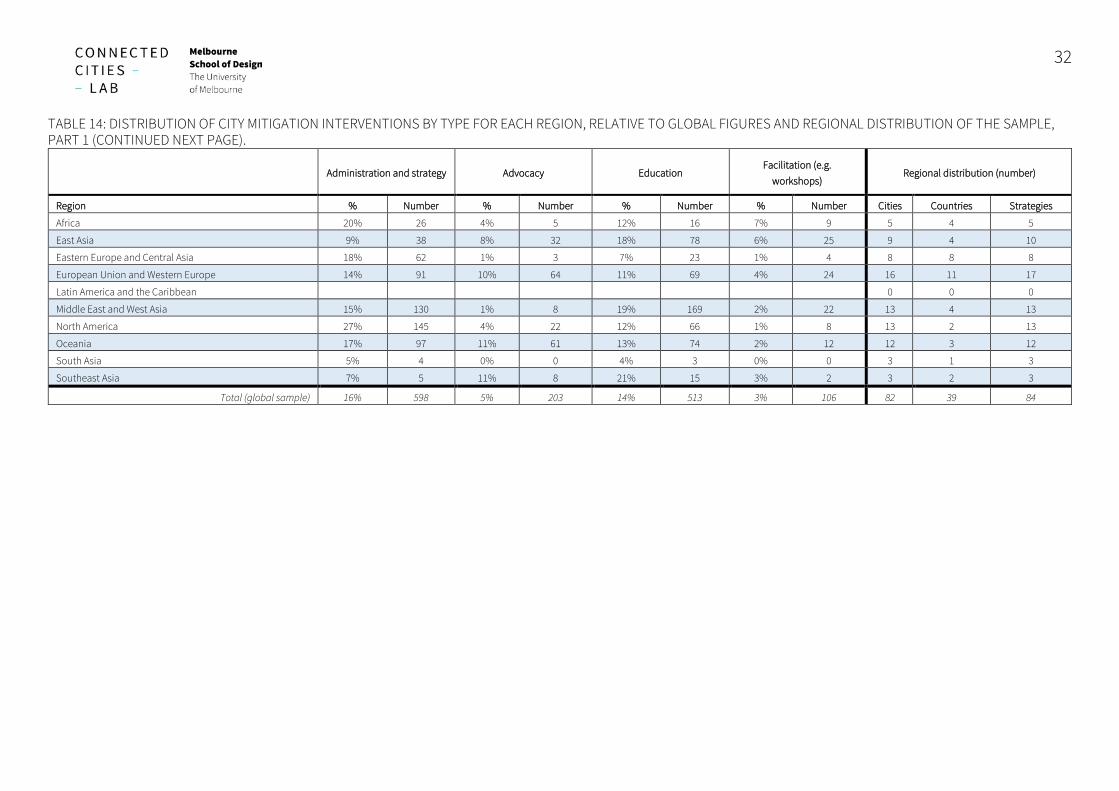
32
TABLE 14: DISTRIBUTION OF CITY MITIGATION INTERVENTIONS BY TYPE FOR EACH REGION, RELATIVE TO GLOBAL FIGURES AND REGIONAL DISTRIBUTION OF THE SAMPLE, PART 1 (CONTINUED NEXT PAGE).
Administration and strategy Advocacy Education Facilitation (e.g.
workshops) Regional distribution (number)
Region % Number % Number % Number % Number Cities Countries Strategies
Africa 20% 26 4% 5 12% 16 7% 9 5 4 5
East Asia 9% 38 8% 32 18% 78 6% 25 9 4 10
Eastern Europe and Central Asia 18% 62 1% 3 7% 23 1% 4 8 8 8
European Union and Western Europe 14% 91 10% 64 11% 69 4% 24 16 11 17
Latin America and the Caribbean 0 0 0
Middle East and West Asia 15% 130 1% 8 19% 169 2% 22 13 4 13
North America 27% 145 4% 22 12% 66 1% 8 13 2 13
Oceania 17% 97 11% 61 13% 74 2% 12 12 3 12
South Asia 5% 4 0% 0 4% 3 0% 0 3 1 3
Southeast Asia 7% 5 11% 8 21% 15 3% 2 3 2 3
Total (global sample) 16% 598 5% 203 14% 513 3% 106 82 39 84
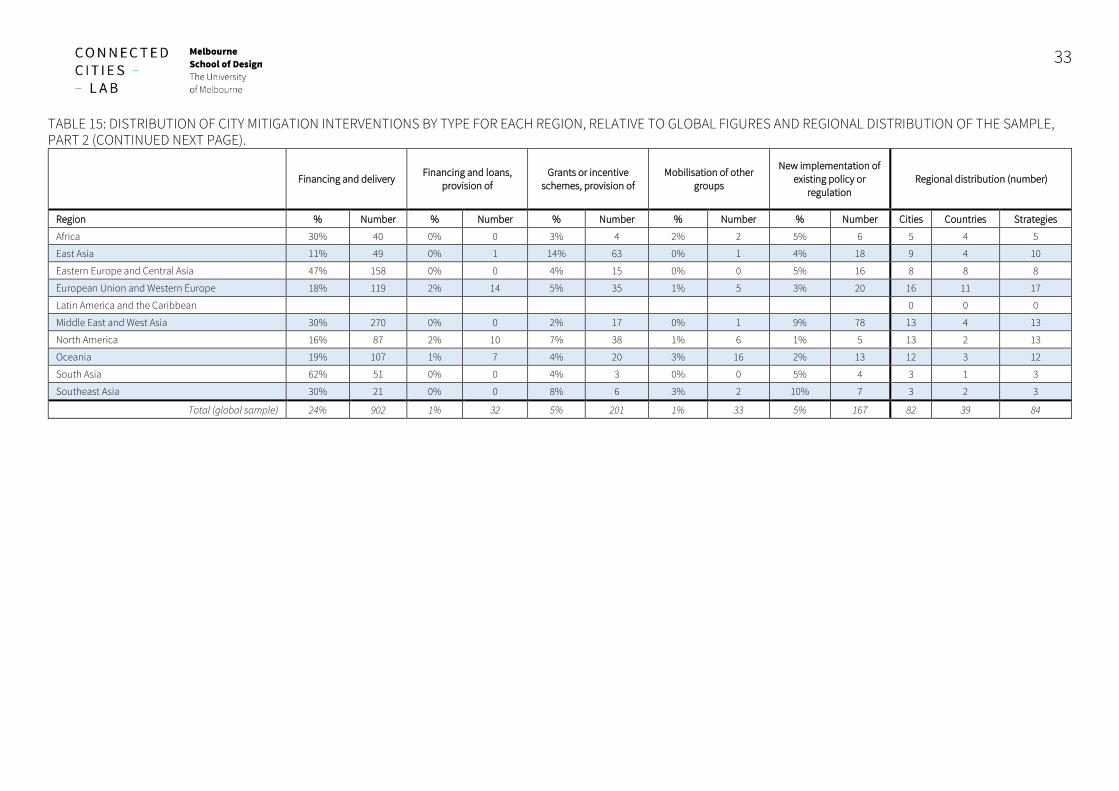
33
TABLE 15: DISTRIBUTION OF CITY MITIGATION INTERVENTIONS BY TYPE FOR EACH REGION, RELATIVE TO GLOBAL FIGURES AND REGIONAL DISTRIBUTION OF THE SAMPLE, PART 2 (CONTINUED NEXT PAGE).
Financing and delivery Financing and loans,
provision of Grants or incentive
schemes, provision of Mobilisation of other
groups
New implementation of existing policy or
regulation Regional distribution (number)
Region % Number % Number % Number % Number % Number Cities Countries Strategies
Africa 30% 40 0% 0 3% 4 2% 2 5% 6 5 4 5
East Asia 11% 49 0% 1 14% 63 0% 1 4% 18 9 4 10
Eastern Europe and Central Asia 47% 158 0% 0 4% 15 0% 0 5% 16 8 8 8
European Union and Western Europe 18% 119 2% 14 5% 35 1% 5 3% 20 16 11 17
Latin America and the Caribbean 0 0 0
Middle East and West Asia 30% 270 0% 0 2% 17 0% 1 9% 78 13 4 13
North America 16% 87 2% 10 7% 38 1% 6 1% 5 13 2 13
Oceania 19% 107 1% 7 4% 20 3% 16 2% 13 12 3 12
South Asia 62% 51 0% 0 4% 3 0% 0 5% 4 3 1 3
Southeast Asia 30% 21 0% 0 8% 6 3% 2 10% 7 3 2 3
Total (global sample) 24% 902 1% 32 5% 201 1% 33 5% 167 82 39 84
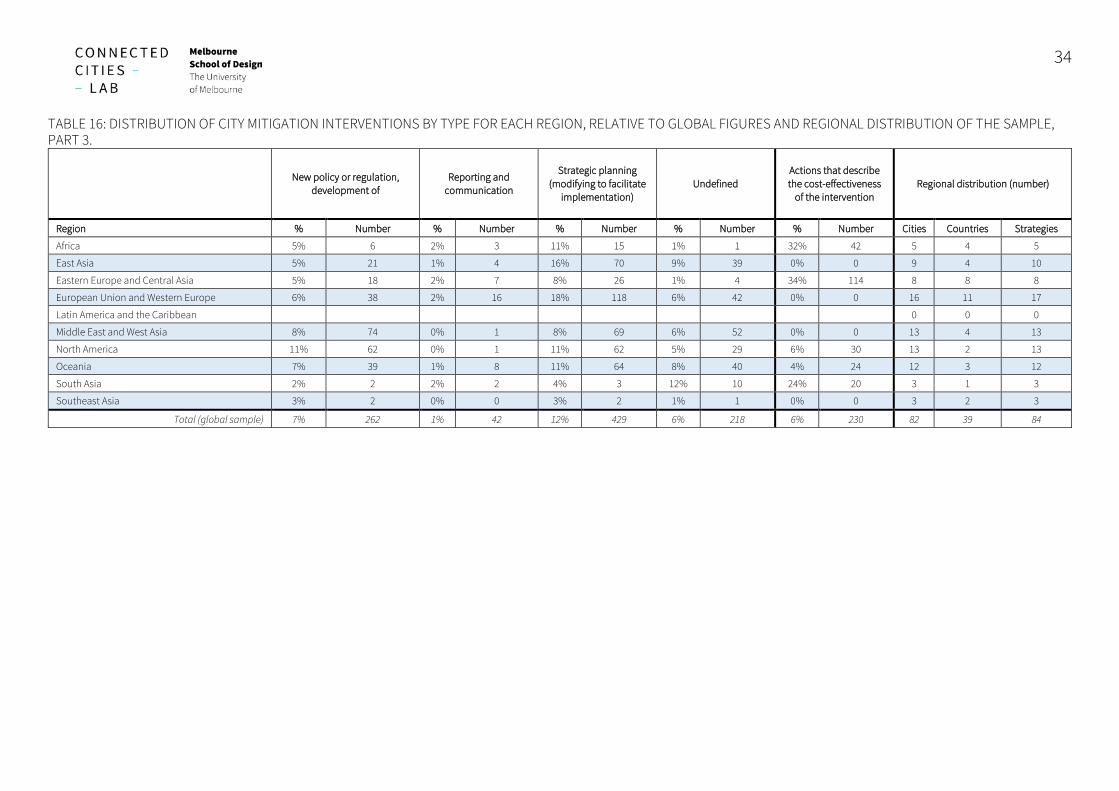
34
TABLE 16: DISTRIBUTION OF CITY MITIGATION INTERVENTIONS BY TYPE FOR EACH REGION, RELATIVE TO GLOBAL FIGURES AND REGIONAL DISTRIBUTION OF THE SAMPLE, PART 3.
New policy or regulation, development of
Reporting and communication
Strategic planning (modifying to facilitate
implementation) Undefined
Actions that describe the cost-effectiveness
of the intervention Regional distribution (number)
Region % Number % Number % Number % Number % Number Cities Countries Strategies
Africa 5% 6 2% 3 11% 15 1% 1 32% 42 5 4 5
East Asia 5% 21 1% 4 16% 70 9% 39 0% 0 9 4 10
Eastern Europe and Central Asia 5% 18 2% 7 8% 26 1% 4 34% 114 8 8 8
European Union and Western Europe 6% 38 2% 16 18% 118 6% 42 0% 0 16 11 17
Latin America and the Caribbean 0 0 0
Middle East and West Asia 8% 74 0% 1 8% 69 6% 52 0% 0 13 4 13
North America 11% 62 0% 1 11% 62 5% 29 6% 30 13 2 13
Oceania 7% 39 1% 8 11% 64 8% 40 4% 24 12 3 12
South Asia 2% 2 2% 2 4% 3 12% 10 24% 20 3 1 3
Southeast Asia 3% 2 0% 0 3% 2 1% 1 0% 0 3 2 3
Total (global sample) 7% 262 1% 42 12% 429 6% 218 6% 230 82 39 84
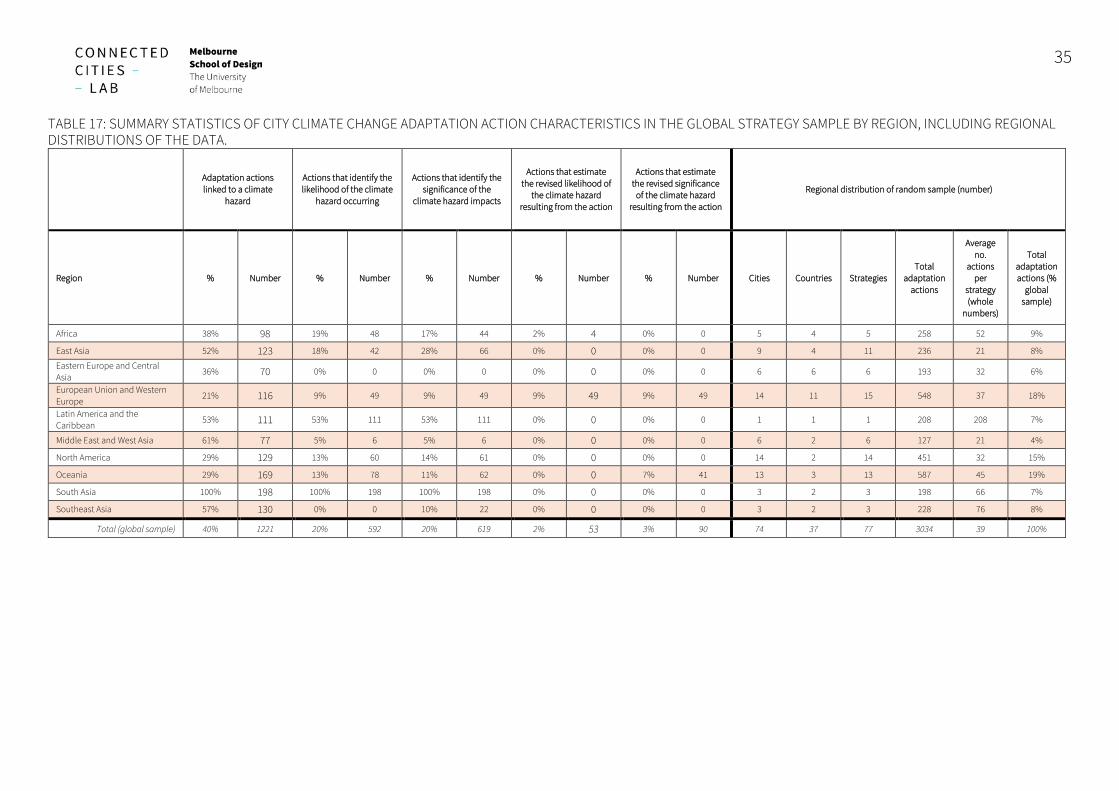
35
TABLE 17: SUMMARY STATISTICS OF CITY CLIMATE CHANGE ADAPTATION ACTION CHARACTERISTICS IN THE GLOBAL STRATEGY SAMPLE BY REGION, INCLUDING REGIONAL DISTRIBUTIONS OF THE DATA.
Adaptation actions linked to a climate
hazard
Actions that identify the likelihood of the climate
hazard occurring
Actions that identify the significance of the
climate hazard impacts
Actions that estimate the revised likelihood of
the climate hazard resulting from the action
Actions that estimate the revised significance
of the climate hazard resulting from the action
Regional distribution of random sample (number)
Region % Number % Number % Number % Number % Number Cities Countries Strategies Total
adaptation actions
Average no.
actions per
strategy (whole
numbers)
Total adaptation actions (%
global sample)
Africa 38% 98 19% 48 17% 44 2% 4 0% 0 5 4 5 258 52 9%
East Asia 52% 123 18% 42 28% 66 0% 0 0% 0 9 4 11 236 21 8%
Eastern Europe and Central Asia
36% 70 0% 0 0% 0 0% 0 0% 0 6 6 6 193 32 6%
European Union and Western Europe
21% 116 9% 49 9% 49 9% 49 9% 49 14 11 15 548 37 18%
Latin America and the Caribbean
53% 111 53% 111 53% 111 0% 0 0% 0 1 1 1 208 208 7%
Middle East and West Asia 61% 77 5% 6 5% 6 0% 0 0% 0 6 2 6 127 21 4%
North America 29% 129 13% 60 14% 61 0% 0 0% 0 14 2 14 451 32 15%
Oceania 29% 169 13% 78 11% 62 0% 0 7% 41 13 3 13 587 45 19%
South Asia 100% 198 100% 198 100% 198 0% 0 0% 0 3 2 3 198 66 7%
Southeast Asia 57% 130 0% 0 10% 22 0% 0 0% 0 3 2 3 228 76 8%
Total (global sample) 40% 1221 20% 592 20% 619 2% 53 3% 90 74 37 77 3034 39 100%
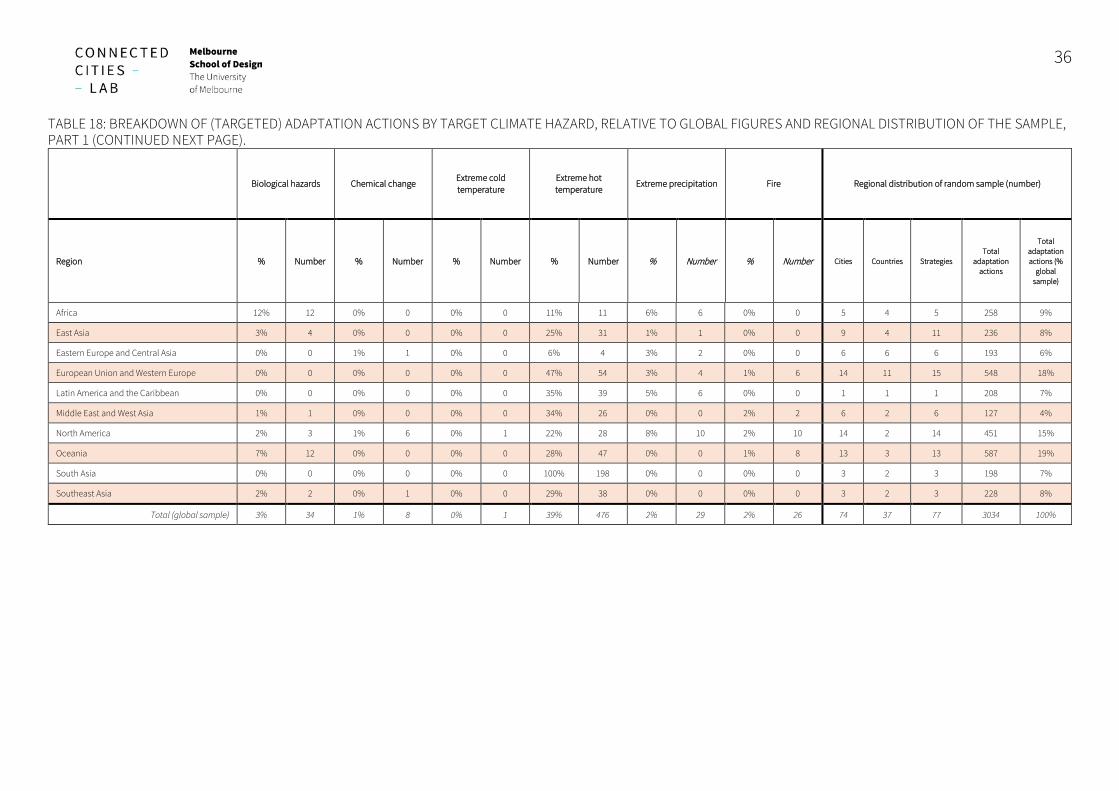
36
TABLE 18: BREAKDOWN OF (TARGETED) ADAPTATION ACTIONS BY TARGET CLIMATE HAZARD, RELATIVE TO GLOBAL FIGURES AND REGIONAL DISTRIBUTION OF THE SAMPLE, PART 1 (CONTINUED NEXT PAGE).
Biological hazards Chemical change Extreme cold temperature
Extreme hot temperature
Extreme precipitation Fire Regional distribution of random sample (number)
Region % Number % Number % Number % Number % Number % Number Cities Countries Strategies Total
adaptation actions
Total adaptation actions (%
global sample)
Africa 12% 12 0% 0 0% 0 11% 11 6% 6 0% 0 5 4 5 258 9%
East Asia 3% 4 0% 0 0% 0 25% 31 1% 1 0% 0 9 4 11 236 8%
Eastern Europe and Central Asia 0% 0 1% 1 0% 0 6% 4 3% 2 0% 0 6 6 6 193 6%
European Union and Western Europe 0% 0 0% 0 0% 0 47% 54 3% 4 1% 6 14 11 15 548 18%
Latin America and the Caribbean 0% 0 0% 0 0% 0 35% 39 5% 6 0% 0 1 1 1 208 7%
Middle East and West Asia 1% 1 0% 0 0% 0 34% 26 0% 0 2% 2 6 2 6 127 4%
North America 2% 3 1% 6 0% 1 22% 28 8% 10 2% 10 14 2 14 451 15%
Oceania 7% 12 0% 0 0% 0 28% 47 0% 0 1% 8 13 3 13 587 19%
South Asia 0% 0 0% 0 0% 0 100% 198 0% 0 0% 0 3 2 3 198 7%
Southeast Asia 2% 2 0% 1 0% 0 29% 38 0% 0 0% 0 3 2 3 228 8%
Total (global sample) 3% 34 1% 8 0% 1 39% 476 2% 29 2% 26 74 37 77 3034 100%
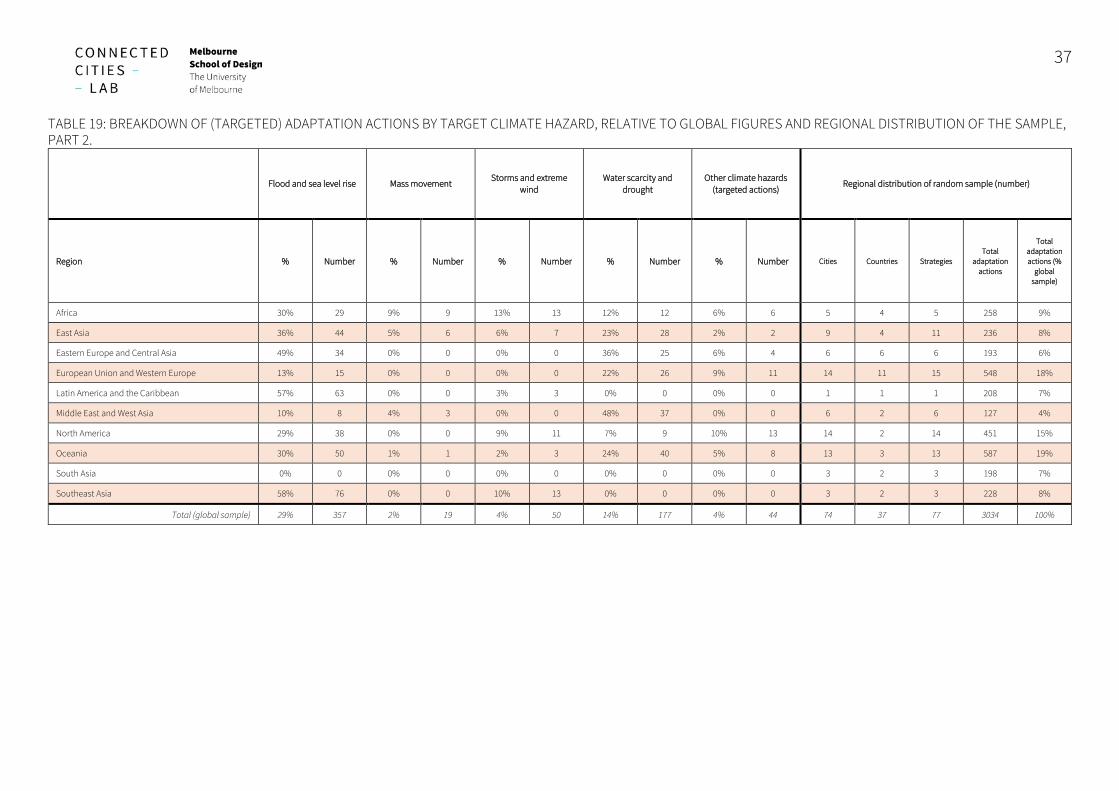
37
TABLE 19: BREAKDOWN OF (TARGETED) ADAPTATION ACTIONS BY TARGET CLIMATE HAZARD, RELATIVE TO GLOBAL FIGURES AND REGIONAL DISTRIBUTION OF THE SAMPLE, PART 2.
Flood and sea level rise Mass movement Storms and extreme
wind Water scarcity and
drought Other climate hazards
(targeted actions) Regional distribution of random sample (number)
Region % Number % Number % Number % Number % Number Cities Countries Strategies Total
adaptation actions
Total adaptation actions (%
global sample)
Africa 30% 29 9% 9 13% 13 12% 12 6% 6 5 4 5 258 9%
East Asia 36% 44 5% 6 6% 7 23% 28 2% 2 9 4 11 236 8%
Eastern Europe and Central Asia 49% 34 0% 0 0% 0 36% 25 6% 4 6 6 6 193 6%
European Union and Western Europe 13% 15 0% 0 0% 0 22% 26 9% 11 14 11 15 548 18%
Latin America and the Caribbean 57% 63 0% 0 3% 3 0% 0 0% 0 1 1 1 208 7%
Middle East and West Asia 10% 8 4% 3 0% 0 48% 37 0% 0 6 2 6 127 4%
North America 29% 38 0% 0 9% 11 7% 9 10% 13 14 2 14 451 15%
Oceania 30% 50 1% 1 2% 3 24% 40 5% 8 13 3 13 587 19%
South Asia 0% 0 0% 0 0% 0 0% 0 0% 0 3 2 3 198 7%
Southeast Asia 58% 76 0% 0 10% 13 0% 0 0% 0 3 2 3 228 8%
Total (global sample) 29% 357 2% 19 4% 50 14% 177 4% 44 74 37 77 3034 100%
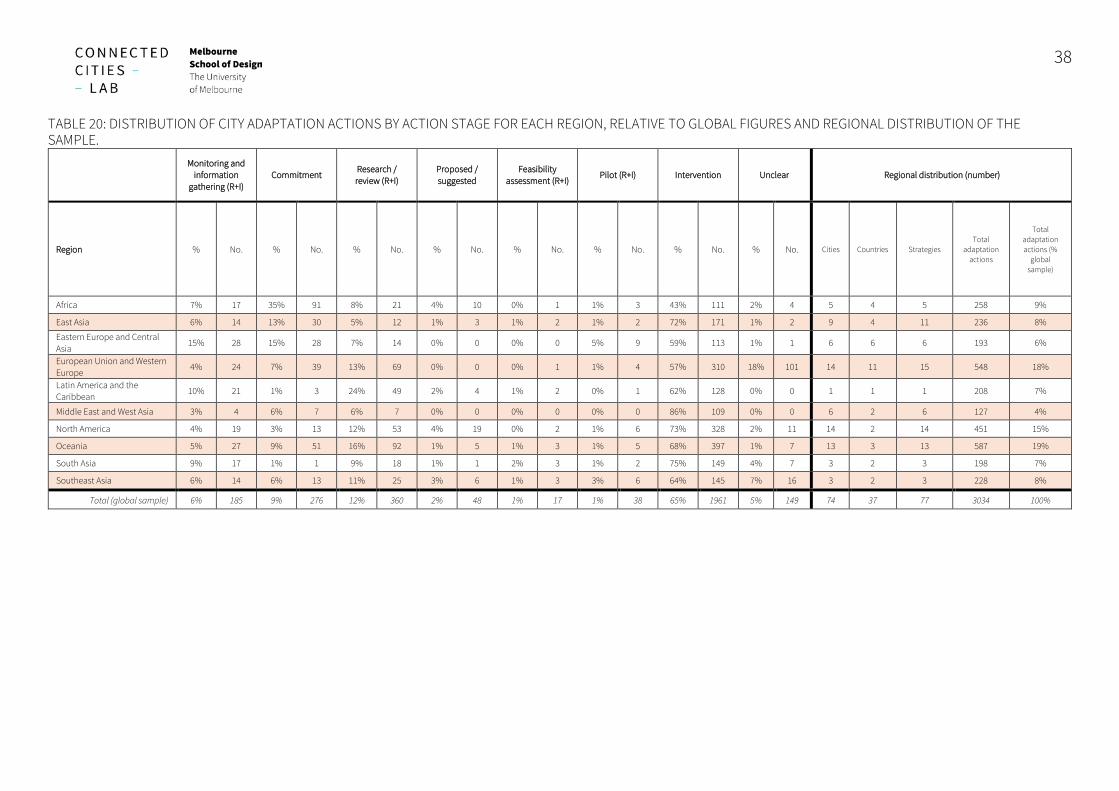
38
TABLE 20: DISTRIBUTION OF CITY ADAPTATION ACTIONS BY ACTION STAGE FOR EACH REGION, RELATIVE TO GLOBAL FIGURES AND REGIONAL DISTRIBUTION OF THE SAMPLE.
Monitoring and
information gathering (R+I)
Commitment Research / review (R+I)
Proposed / suggested
Feasibility assessment (R+I)
Pilot (R+I) Intervention Unclear Regional distribution (number)
Region % No. % No. % No. % No. % No. % No. % No. % No. Cities Countries Strategies Total
adaptation actions
Total adaptation actions (%
global sample)
Africa 7% 17 35% 91 8% 21 4% 10 0% 1 1% 3 43% 111 2% 4 5 4 5 258 9%
East Asia 6% 14 13% 30 5% 12 1% 3 1% 2 1% 2 72% 171 1% 2 9 4 11 236 8%
Eastern Europe and Central Asia
15% 28 15% 28 7% 14 0% 0 0% 0 5% 9 59% 113 1% 1 6 6 6 193 6%
European Union and Western Europe
4% 24 7% 39 13% 69 0% 0 0% 1 1% 4 57% 310 18% 101 14 11 15 548 18%
Latin America and the Caribbean
10% 21 1% 3 24% 49 2% 4 1% 2 0% 1 62% 128 0% 0 1 1 1 208 7%
Middle East and West Asia 3% 4 6% 7 6% 7 0% 0 0% 0 0% 0 86% 109 0% 0 6 2 6 127 4%
North America 4% 19 3% 13 12% 53 4% 19 0% 2 1% 6 73% 328 2% 11 14 2 14 451 15%
Oceania 5% 27 9% 51 16% 92 1% 5 1% 3 1% 5 68% 397 1% 7 13 3 13 587 19%
South Asia 9% 17 1% 1 9% 18 1% 1 2% 3 1% 2 75% 149 4% 7 3 2 3 198 7%
Southeast Asia 6% 14 6% 13 11% 25 3% 6 1% 3 3% 6 64% 145 7% 16 3 2 3 228 8%
Total (global sample) 6% 185 9% 276 12% 360 2% 48 1% 17 1% 38 65% 1961 5% 149 74 37 77 3034 100%
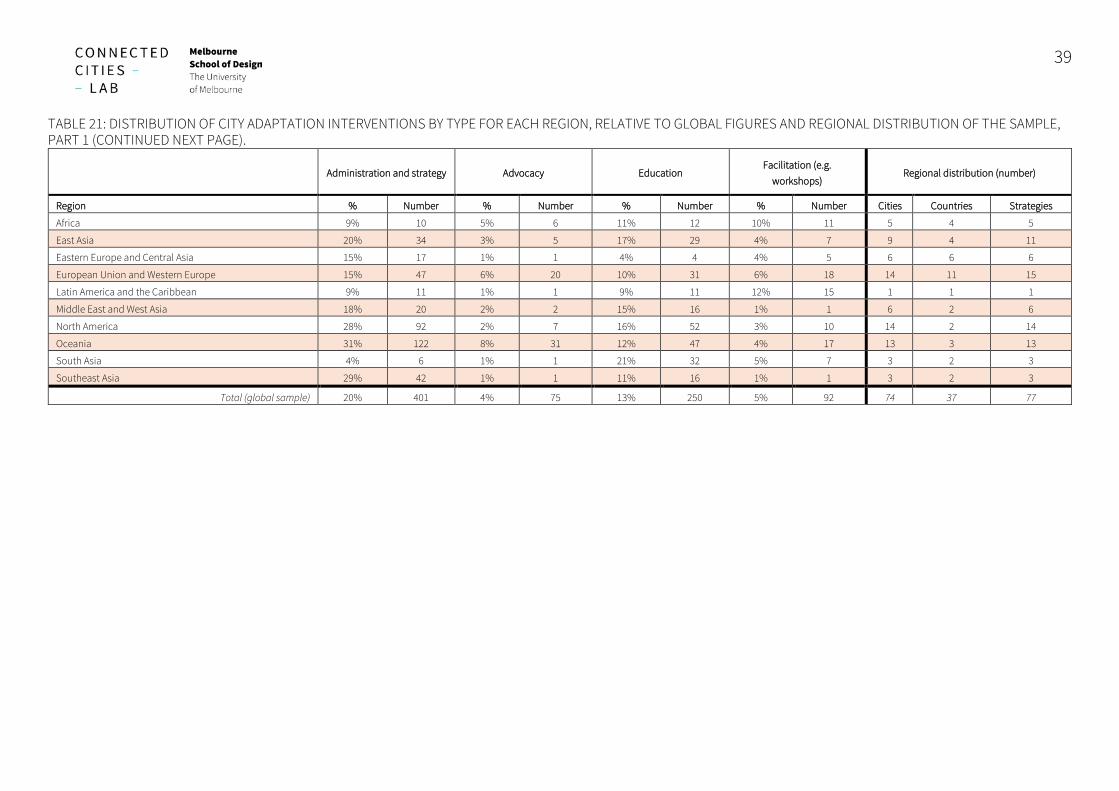
39
TABLE 21: DISTRIBUTION OF CITY ADAPTATION INTERVENTIONS BY TYPE FOR EACH REGION, RELATIVE TO GLOBAL FIGURES AND REGIONAL DISTRIBUTION OF THE SAMPLE, PART 1 (CONTINUED NEXT PAGE).
Administration and strategy Advocacy Education Facilitation (e.g.
workshops) Regional distribution (number)
Region % Number % Number % Number % Number Cities Countries Strategies
Africa 9% 10 5% 6 11% 12 10% 11 5 4 5
East Asia 20% 34 3% 5 17% 29 4% 7 9 4 11
Eastern Europe and Central Asia 15% 17 1% 1 4% 4 4% 5 6 6 6
European Union and Western Europe 15% 47 6% 20 10% 31 6% 18 14 11 15
Latin America and the Caribbean 9% 11 1% 1 9% 11 12% 15 1 1 1
Middle East and West Asia 18% 20 2% 2 15% 16 1% 1 6 2 6
North America 28% 92 2% 7 16% 52 3% 10 14 2 14
Oceania 31% 122 8% 31 12% 47 4% 17 13 3 13
South Asia 4% 6 1% 1 21% 32 5% 7 3 2 3
Southeast Asia 29% 42 1% 1 11% 16 1% 1 3 2 3
Total (global sample) 20% 401 4% 75 13% 250 5% 92 74 37 77
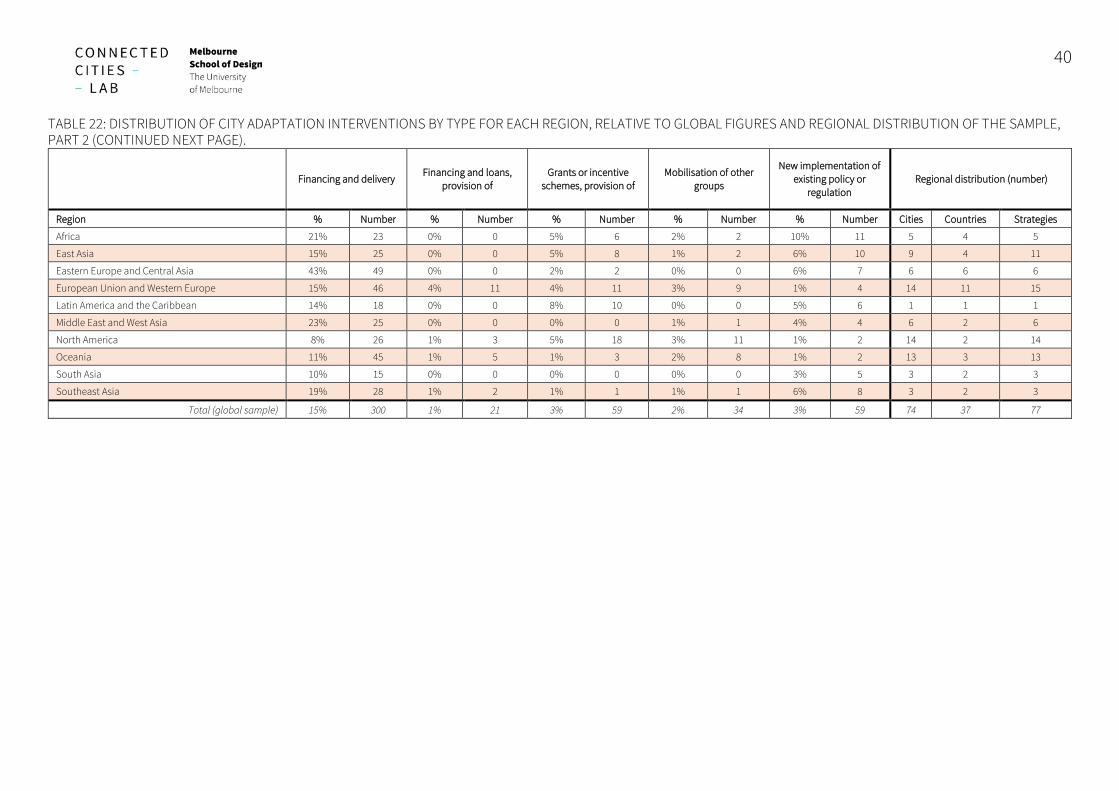
40
TABLE 22: DISTRIBUTION OF CITY ADAPTATION INTERVENTIONS BY TYPE FOR EACH REGION, RELATIVE TO GLOBAL FIGURES AND REGIONAL DISTRIBUTION OF THE SAMPLE, PART 2 (CONTINUED NEXT PAGE).
Financing and delivery Financing and loans,
provision of Grants or incentive
schemes, provision of Mobilisation of other
groups
New implementation of existing policy or
regulation Regional distribution (number)
Region % Number % Number % Number % Number % Number Cities Countries Strategies
Africa 21% 23 0% 0 5% 6 2% 2 10% 11 5 4 5
East Asia 15% 25 0% 0 5% 8 1% 2 6% 10 9 4 11
Eastern Europe and Central Asia 43% 49 0% 0 2% 2 0% 0 6% 7 6 6 6
European Union and Western Europe 15% 46 4% 11 4% 11 3% 9 1% 4 14 11 15
Latin America and the Caribbean 14% 18 0% 0 8% 10 0% 0 5% 6 1 1 1
Middle East and West Asia 23% 25 0% 0 0% 0 1% 1 4% 4 6 2 6
North America 8% 26 1% 3 5% 18 3% 11 1% 2 14 2 14
Oceania 11% 45 1% 5 1% 3 2% 8 1% 2 13 3 13
South Asia 10% 15 0% 0 0% 0 0% 0 3% 5 3 2 3
Southeast Asia 19% 28 1% 2 1% 1 1% 1 6% 8 3 2 3
Total (global sample) 15% 300 1% 21 3% 59 2% 34 3% 59 74 37 77
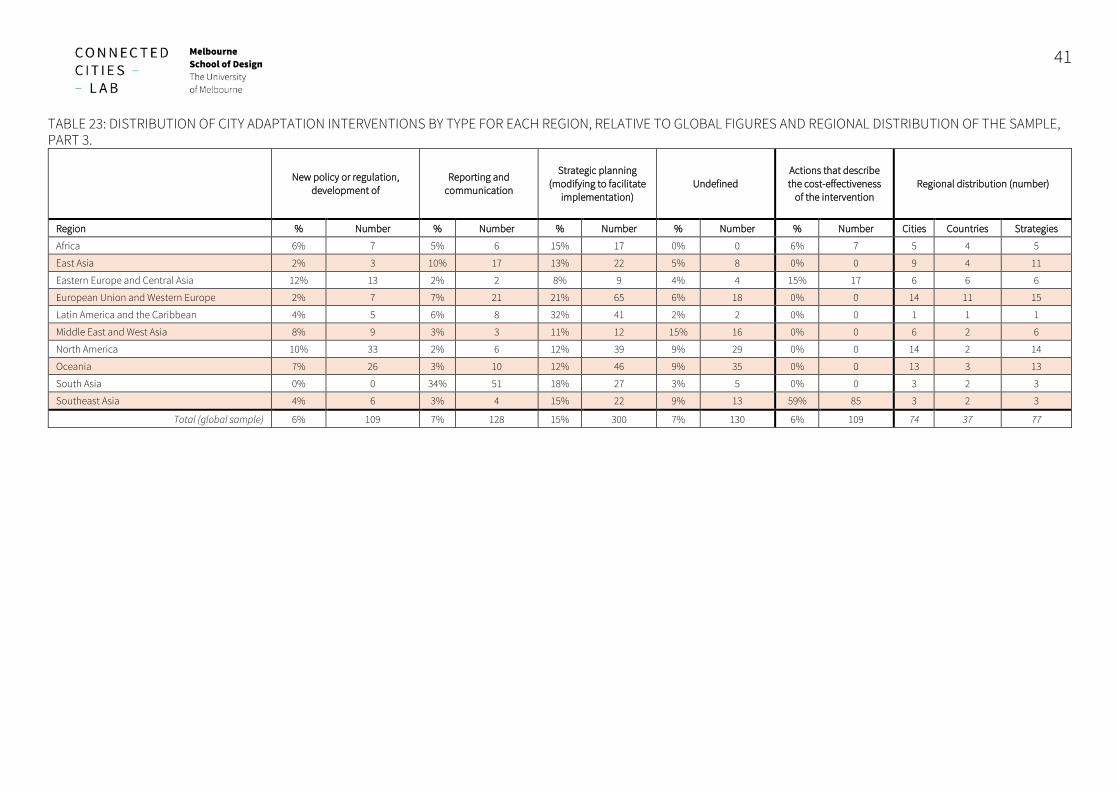
41
TABLE 23: DISTRIBUTION OF CITY ADAPTATION INTERVENTIONS BY TYPE FOR EACH REGION, RELATIVE TO GLOBAL FIGURES AND REGIONAL DISTRIBUTION OF THE SAMPLE, PART 3.
New policy or regulation, development of
Reporting and communication
Strategic planning (modifying to facilitate
implementation) Undefined
Actions that describe the cost-effectiveness
of the intervention Regional distribution (number)
Region % Number % Number % Number % Number % Number Cities Countries Strategies
Africa 6% 7 5% 6 15% 17 0% 0 6% 7 5 4 5
East Asia 2% 3 10% 17 13% 22 5% 8 0% 0 9 4 11
Eastern Europe and Central Asia 12% 13 2% 2 8% 9 4% 4 15% 17 6 6 6
European Union and Western Europe 2% 7 7% 21 21% 65 6% 18 0% 0 14 11 15
Latin America and the Caribbean 4% 5 6% 8 32% 41 2% 2 0% 0 1 1 1
Middle East and West Asia 8% 9 3% 3 11% 12 15% 16 0% 0 6 2 6
North America 10% 33 2% 6 12% 39 9% 29 0% 0 14 2 14
Oceania 7% 26 3% 10 12% 46 9% 35 0% 0 13 3 13
South Asia 0% 0 34% 51 18% 27 3% 5 0% 0 3 2 3
Southeast Asia 4% 6 3% 4 15% 22 9% 13 59% 85 3 2 3
Total (global sample) 6% 109 7% 128 15% 300 7% 130 6% 109 74 37 77
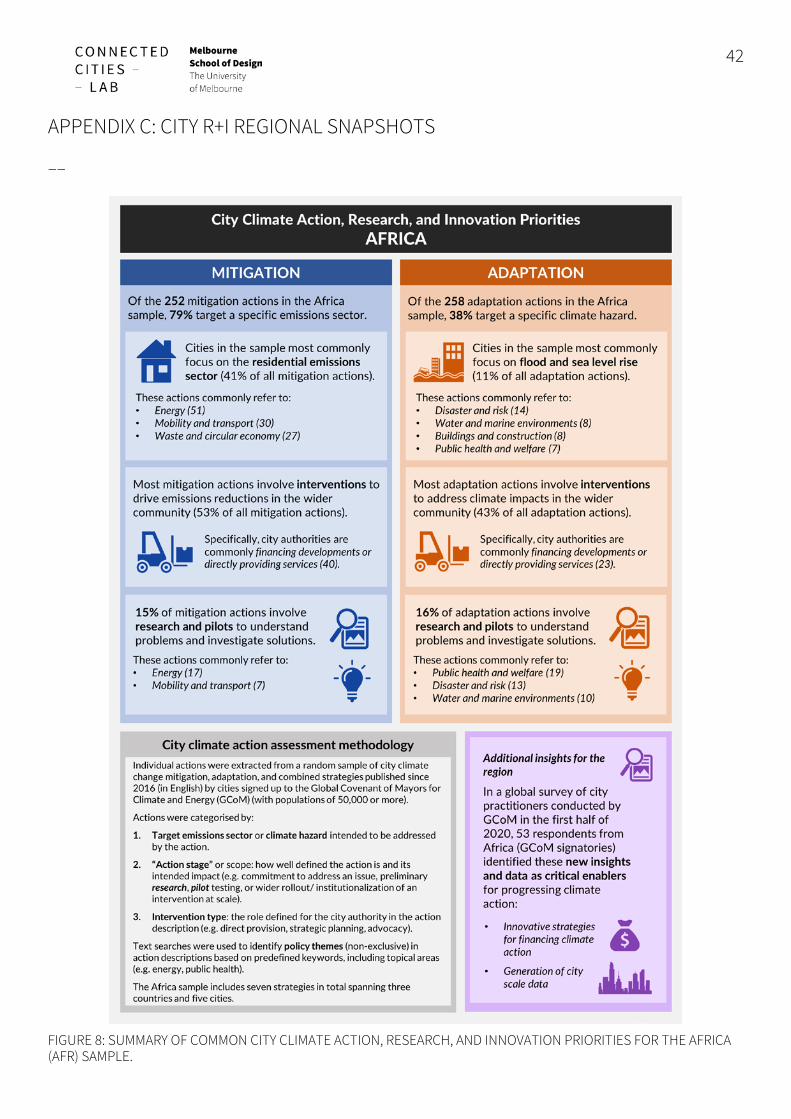
42
APPENDIX C: CITY R+I REGIONAL SNAPSHOTS
––
FIGURE 8: SUMMARY OF COMMON CITY CLIMATE ACTION, RESEARCH, AND INNOVATION PRIORITIES FOR THE AFRICA (AFR) SAMPLE.

43
FIGURE 9: SUMMARY OF COMMON CITY CLIMATE ACTION, RESEARCH, AND INNOVATION PRIORITIES FOR THE EAST ASIA (EA) SAMPLE.
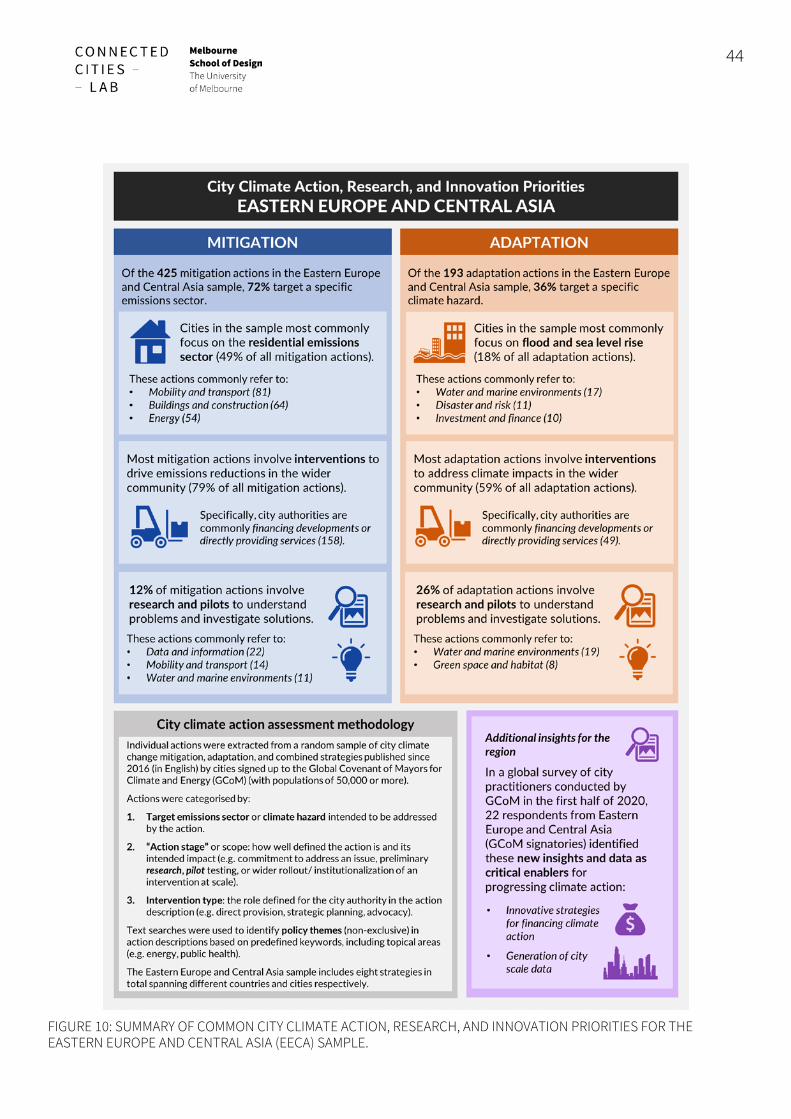
44
FIGURE 10: SUMMARY OF COMMON CITY CLIMATE ACTION, RESEARCH, AND INNOVATION PRIORITIES FOR THE EASTERN EUROPE AND CENTRAL ASIA (EECA) SAMPLE.

45
FIGURE 11: SUMMARY OF COMMON CITY CLIMATE ACTION, RESEARCH, AND INNOVATION PRIORITIES FOR THE EUROPEAN UNION AND WESTERN EUROPE (EUWE) SAMPLE.
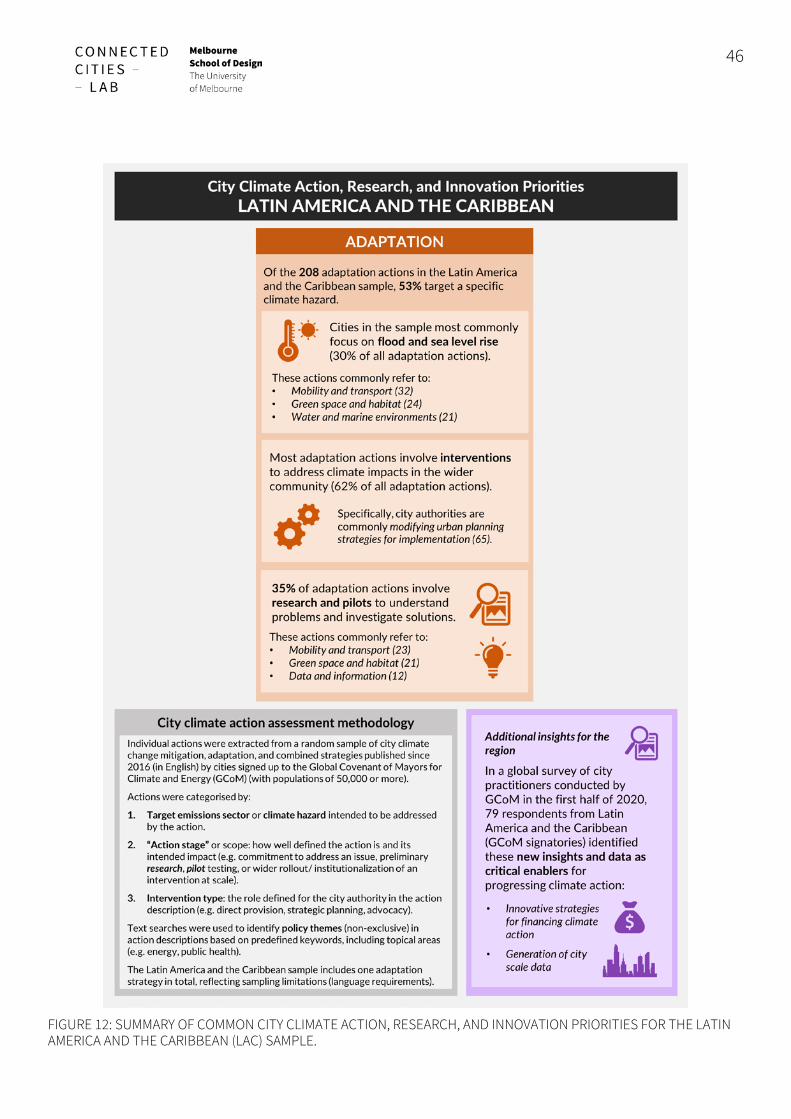
46
FIGURE 12: SUMMARY OF COMMON CITY CLIMATE ACTION, RESEARCH, AND INNOVATION PRIORITIES FOR THE LATIN AMERICA AND THE CARIBBEAN (LAC) SAMPLE.
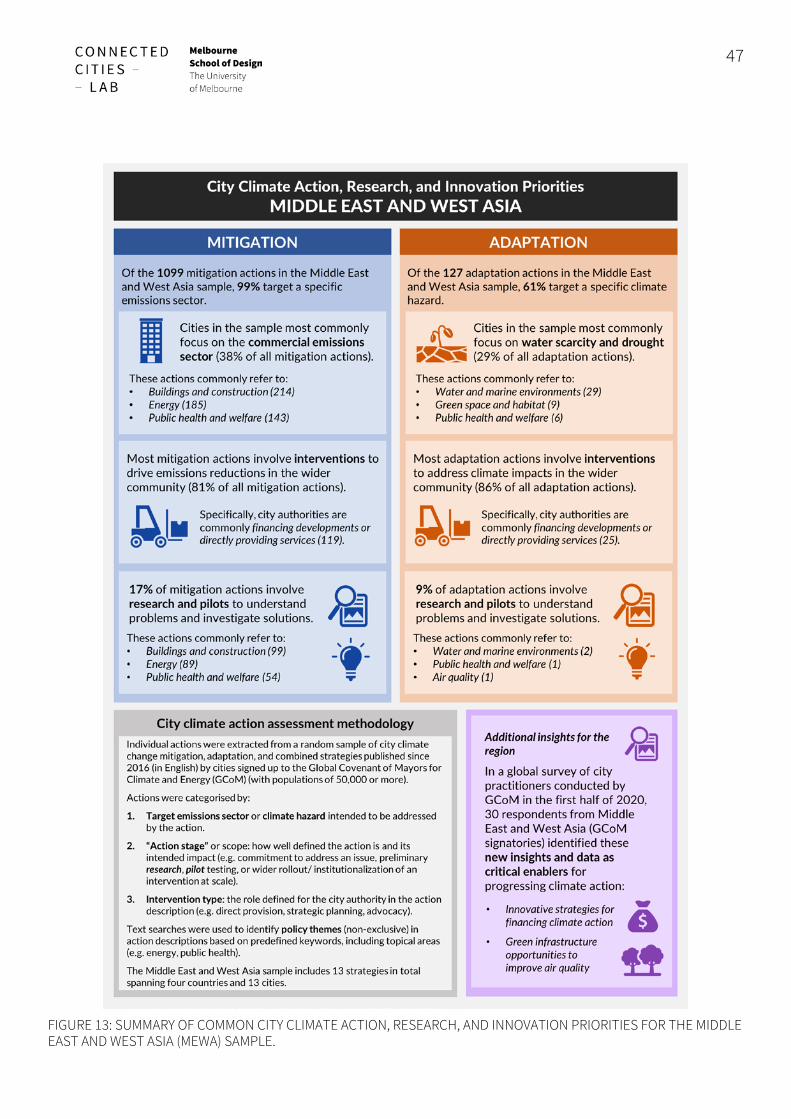
47
FIGURE 13: SUMMARY OF COMMON CITY CLIMATE ACTION, RESEARCH, AND INNOVATION PRIORITIES FOR THE MIDDLE EAST AND WEST ASIA (MEWA) SAMPLE.
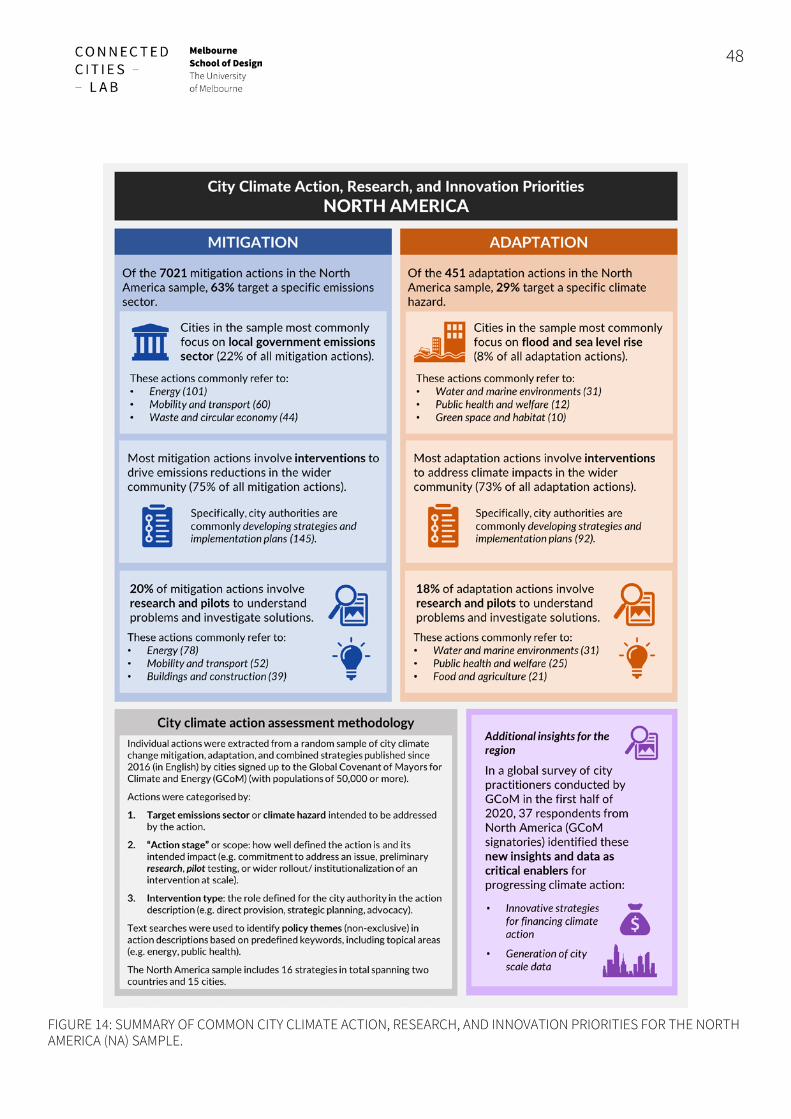
48
FIGURE 14: SUMMARY OF COMMON CITY CLIMATE ACTION, RESEARCH, AND INNOVATION PRIORITIES FOR THE NORTH AMERICA (NA) SAMPLE.
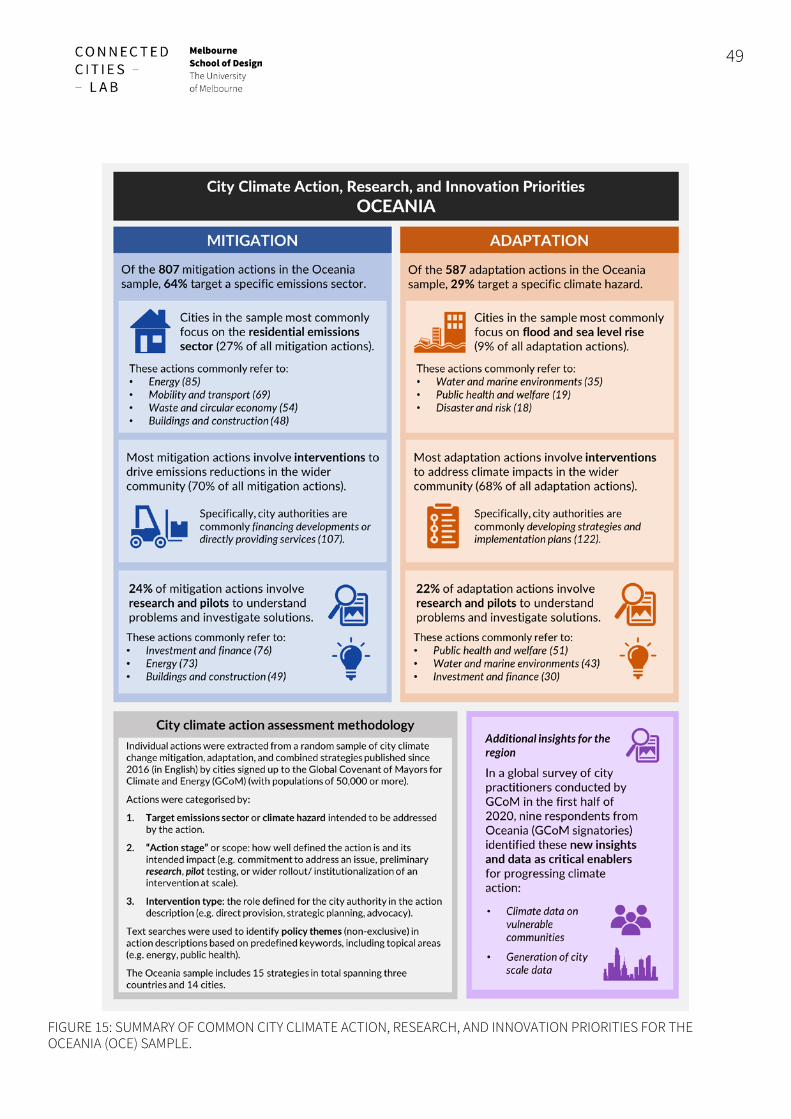
49
FIGURE 15: SUMMARY OF COMMON CITY CLIMATE ACTION, RESEARCH, AND INNOVATION PRIORITIES FOR THE OCEANIA (OCE) SAMPLE.
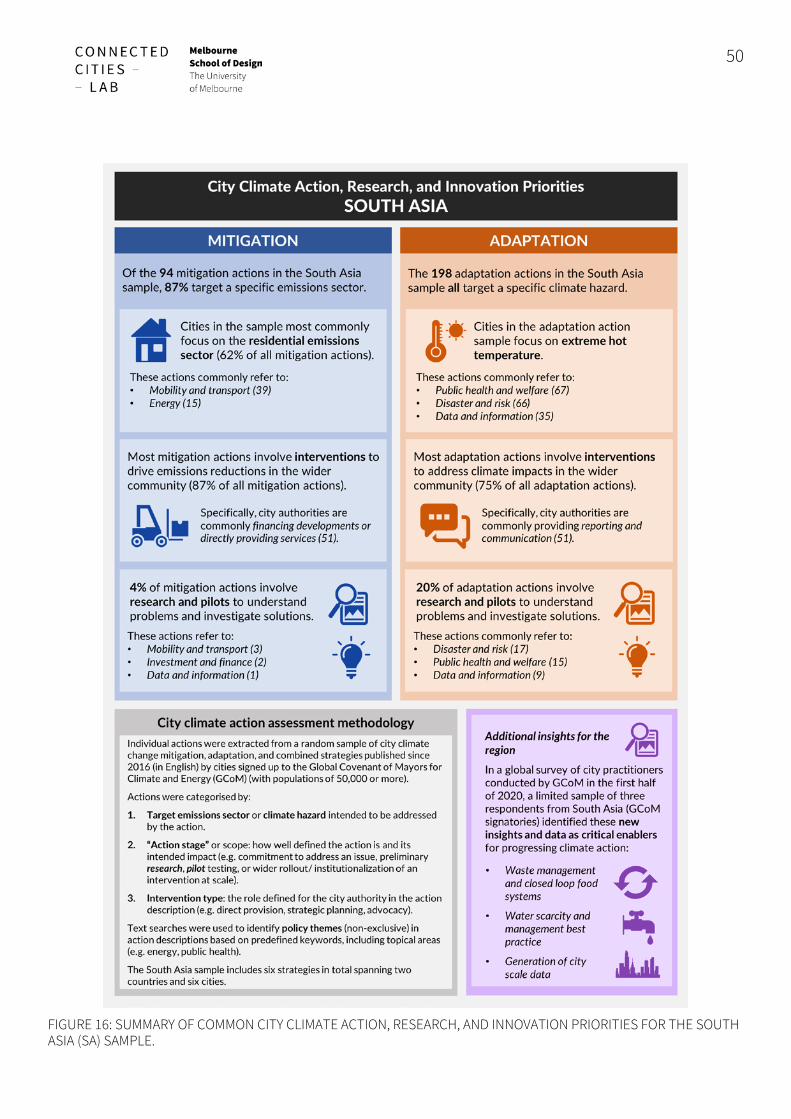
50
FIGURE 16: SUMMARY OF COMMON CITY CLIMATE ACTION, RESEARCH, AND INNOVATION PRIORITIES FOR THE SOUTH ASIA (SA) SAMPLE.

51
FIGURE 17: SUMMARY OF COMMON CITY CLIMATE ACTION, RESEARCH, AND INNOVATION PRIORITIES FOR THE SOUTHEAST ASIA (SEA) SAMPLE.