Embed Size (px)
Citation preview
INTERNATIONAL JOURNAL OF CLIMATOLOGY, VOL. 16, 135-1 53 (1 996)
REGIONAL TELECONNECTION PATTERNS ASSOCIATED WITH SUMMER RAINFALL OVER SOUTH AFRICA, NAMIBIA AND
ZIMBABWE
MARK R. JURY Oceanogmphy Department, University of Cape Town, Rondebosch, South Africa
Received 22 May 1994 Accepted I5 May 1995
ABSTRACT
Climatic determinants of southern African summer rainfall are analysed using statistical techniques. Summer rainfall time series are formulated for South Africa, Namibia and Zimbabwe areas and correlated with global indices and with field variables: sea- surface temperature (SST), outgoing longwave radiation (OLR), and tropospheric winds at 200 and 700 hPa levels. Linear regression correlations are performed using monthly standardized departures at various lags before and during the summer season.
The SSTs in the central equatorial Indian Ocean (CEI) are identified as significant predictors/modulators of southern African rainfall. The SSTs at the CEI are best correlated with South Africa rainfall at r < -0.6 at lags - 2 and 0 months and are associated with the El Nifio. The SSTs of the CEI modulate the overlying monsoon trough, as indicated by the OLR correlation maps. A centre of convective action alternates between southern Africa and the south-west Indian Ocean from year-to-year.
A useful circulation index that emerges in the statistical analysis is spring-time zonal upper wind anomalies over the equatorial central Atlantic. This index is correlated with South Africa rainfall at r < -0.8 at lags - 4 and - 2 months. Westerly (easterly) 200 hPa anomalies in spring are followed by a summer of below (above) normal rainfall. Other patterns that have a bearing on summer rainfall include a circulation gyre identified in 700 hPa wind correlations off the coast of south-east Africa. This circulation feature controls the flux of moisture between southern Africa and the northern Mozambique Channel.
The correlation patterns offer statistical guidance in long-range forecasts and insights to climatic processes that govern the interannual variability of summer rainfall over southern Africa.
KEY WORDS: inter-annual climatic fluctuations; statistical teleconnections; Southern Afnica; summer rainfall; predictability; linear regression; rainfall index; circulation index; correlation patterns
INTRODUCTION
Summer (November to March) rains over the plateau of southern Africa (18-3OoS, 18-32"E, Figure 1) average about 500 mm and rarely offset potential evaporation (Jury et al., 1993a; Levey, 1993). The imbalance means that climatic variations from year-to-year have critical impacts on crop yields and the sustainability of water resources. Since the 197Os, fluctuations in rainfall over southern Africa have become more extreme (Jury et al., 1993b). The last period of South African summer rainfall within 0.5 of the standard deviation for three consecutive years was 1958-1960 (Figure 2(a)). Area-averaged rainfall exceeded + 0.9 times the standard deviation in 1974, 1976, and 1988 and declined to below - 0.7 times the standard deviation in 1983 and 1992. Maize production in central southern Africa (25"-26"S, 25"-26"E) has fluctuated from 292 M ton per planted km2 in the 1989 La Niiia to 19 M ton per planted km2 during the devastating 1992 El Niiio, which is an order of magnitude decline in crop yield.
Repeated drought in recent years has given impetus to statistical studies of the precursor role of sea-surface temperature (SST) anomalies, particularly in the tropical band, in upsetting the balance of continental and marine rainfall. Coherent spectral peaks in the 2-5 year range in both southern African rainfall and SST over the surrounding subtropical oceans have been uncovered (Nicholson, 1989). Tyson (1986), Nicholson and Entekhabi
CCC 0899-841 8/96/020135-19 0 1996 by the Royal Meteorological Society

136 M. R. JURY
LOCATION OF INDICES
w
4
i --
I
I .-
I
I I 20 40 60
4 0 1 0
LONGITUDE
Figure 1. Location map of southem Africa showing index locations used in the statistical analysis.
(1987) and Lindesay (1 988) have linked these to regional circulation adjustments that involve the El Niiio- Southern Oscillation (ENSO) phenomenon.
Walker (1 989) utilized monthly gridded ship observations of SST, surface wind, and weather parameters over the south-east Atlantic and south-west Indian Oceans in statistical associations with South African plateau rainfall. In non-El Niiio years reliable correlations with the adjacent Agulhas and Benguela SST were noted, in agreement with Nicholson and Entekhabi (1 987). Rainfall increased when SSTs in the subtropical band of the eastern Agulhas Current were above normal (r > + 0.4) both during and prior to the season. Surface wind composites indicated increased easterly flow in wet summers in the subtropical band, particularly to the east of Madagascar. Walker (1989) identified the Agulhas Current retroflection region to the south of Cape Town as an important region. Differences between composite wet and dry summers highlighted that SST and heat fluxes in the retroflection were 10 per cent above the mean in wet years.
Mason (1 992) considered SST in the south-west Indian Ocean and South Atlantic using principal component analysis. Areas explaining changes in SST in the region included the south-east tropical Atlantic (17 per cent), the southern Mozambique Channel (13 per cent), the western tropical Atlantic (1 1 per cent), and the western Indian Ocean (7 per cent). Key areas of variability in the west Indian Ocean and Agulhas region were found through correlation analysis in respect of summer rainfall. A coherence of rainfall and SST cycles, particularly for the 18 year period in the South Atlantic, was identified.
Mason (1 992) considered the phase of the stratospheric quasi-biennial oscillation (QBO), equatorial zonal wind anomaly on southern African rainfall. Stratospheric QBO-troposphere interactions have interesting associations with the El Niiio-Southern Oscillation which make it an integral part of long-range forecast scenarios. Mason (1992) found that the correlation between the SO1 and summer rainfall is above + 0.6 in a wide axis between 23" and 29"E when the QBO is in west phase. The relationship may be unstable as in the 1991/1992 summer, when drought corresponded with an east phase QBO. Relationships between western Indian Ocean SST and the QBO were also identified.
Jury et al. (1994) found a correlation pattern between the QBO and tropospheric winds, which corresponds with upper anticyclonic, Walker Cell uplift over southern Africa and descent over Madagascar in west phase summers. This circulation mechanism is consistent with opposing outgoing long wave radiation (OLR) correlation values between southern Afrrca and the south-west Indian Ocean. Given the quasi-regular period of the QBO (2.3 years), this global indicator offers additional levels of predictability for southern African rainfall.
A number of researchers have looked beyond statistical associations between SST and rainfall; and have analysed 'intervening' variables to reveal some of the dynamical mechanisms underlying dry and wet summers. A number of atmospheric 'signals' which anticipate southern African summer rainfall are found over the surrounding oceans.

SOUTHERN AFRICA SUMMER RAINFALL
SOUTH AFRICAN PLATEAU M A L L W D M (a)
" T r - I I I I
137
.I so .IS .'ji,, , , , . , , ,: , . . , , , , , , : , . , , , _ , ,
Figure 2. Summer season areal rainfall index time series for the three areas. Bold line is smoothed with 1-2-1 filter.
Rocha (1992) studied regional teleconnections driving rainfall variability over south-east Africa. He utilized the Comprehensive Ocean Atmosphere Data Set (COADS), including the central Indian Ocean in the analysis. The correlation results and subsequent general circulation model (GCM) experiments demonstrated the critical impact of central Indian Ocean SST on south-east Africa summer rainfall. The PC1 SST variance was identified as the ENS0 signal in the central equatorial Indian (CEI) and eastern equatorial Pacific oceans. In dry years the CEI (0- lo's, 60-80"E) warms in sympathy with the eastern Pacific. Similar field correlations were performed with surface pressure. Negative values over an axis from Zimbabwe to Marion Island contrasted with positive values near Mauritius and near Gough Island on the South Atlantic in the preceding spring. These patterns shifted northward during summer such that a H-L-H pattern emerged in the 0-20"s band over the Atlantic-Africa-Lndian areas, respectively, in wet phases. Similar correlations were analysed with winds, temperatures, and humidity at various tropospheric levels. Rocha (1 992) identified the direction of moisture transport anomalies in the Indian Ocean as an important climatic determinant of south-east Africa rainfall. Vertical heat flux anomalies were investigated but only incoherent patterns were noted.
D'Abreton's research (1 992) suggested that daily-seasonal convective variability was governed by responses to SST anomalies in the west Indian Ocean. He also confirmed the findings of Rocha (1992) on water vapour flux

138 M. R. JURY
transport anomalies in wet and dry years. D' Abreton (1992) also advanced our knowledge of energy conversions in tropical-temperate troughs contributed via ocean-atmosphere forcing.
Pathack (1993) used the COADS 2" SST data set and established the central equatorial Indian Ocean region as a key determinant of late summer rainfall variability over the plateau of South Africa. He analysed OLR, which is well correlated with interannual departures of summer rainfall, and tropospheric winds, and revealed the structure and extent of thermodynamic modulation of the atmosphere by the ocean. A major contribution of Pathack (1 993) was in distinguishing the varying seasonal contributions from the Atlantic and Indian Oceans. He found that wanning of the central South Atlantic enhances November rains over southern Africa, whereas cooling in the CEI stimulates February rains. February rainfall versus previous October OLR correlations were + 0.9 over the CEI at O"S, 70"E.
Numerical model simulations of the global ENS0 signal and its regional impacts have afforded an improved understanding of the dynamics of ocean-atmosphere interaction with regard to wet and dry summers over southern Africa. Prescribed changes in the SST field and analysis of the circulation and rainfall response patterns were conducted by Jury and Pathack (1993) and Mason et al. (1994). In the former study, SSTs in the CEI were increased by 2°C for an extended period consistent with an ENSO wann phase. Following a 3-year model run with the CSIRO4 GCM, late summer rainfall was halved. These numerical analyses provide insight to seasonal processes underlying fluctuations in regional rainfall.
An accurate forecast of southern African summer rainfall 2 4 months in advance would be of considerable strategic economic value. Understanding the kinematic and thermodynamic mechanisms and regional teleconnection patterns precursor to, and associated with, wet and dry years could benefit environmental and agricultural management practices.
To assess climatic determinants governing interannual fluctuations of convection over southern Africa and the adjacent oceans, a statistical study was conducted. Spatial correlation patterns for various meteorological variables were analysed for the austral spring and summer period. In this paper the regional teleconnection patterns associated with seasonal rainfall variability over three distinct areas of southern Africa are investigated.
DATA AND METHODS
Area-averaged summer rainfall indices are constructed from station data for three areas, namely north-central South Africa (24"-28"S, 24"-29"E), north-east Namibia (19-20"S, 18-19"E) and Zimbabwe (1 8"-2O"S, 28"- 3 1 "E) as shown in Figure 1. These are computed from the time series of rainfall standardized departures for the months November to March, for each station within a prescribed, climatically homogeneous area. The rainfall index represents the overall seasonal departure of relevance to agricultural productivity. The index time series are shown in Figure 2(a-c).
The reference rainfall index time series for the three areas were cross-correlated with each other and with global indices, such as the Southern Oscillation Index (SOI) and the Quasi-Biennial Oscillation (QBO), of stratospheric zonal winds. The amplitude of temporal cycles was determined using a periodogram analysis of fast Fourier transforms in the Statgraphics software package. To establish spatial correlation patterns, gridded fields of sea-surface temperature, outgoing longwave radiation, and tropospheric winds at 200 hPa and 700 hPa levels were utilized. The field data derive fiom the Climate Analysis Center (CAC), Washington, DC and from the Comprehensive Ocean Atmosphere Data Set (Slutz ef al., 1985) at 5" and 4" resolution, respectively. The sources of data, interpolation schemes, and data quality provide adequate confidence in statistical analysis (Pathack, 1993), although conventional observations are relatively sparse in the tropical and oceanic regions around southern Africa. Global indices were computed fiom CAC data in the usual form: SO1 is the Tahiti-Darwin pressure anomaly, and the QBO is the Singapore 30 hPa zonal wind departure. Here the SO1 and QBO are averaged for the months January and February, when southern Africa rainfall reaches the seasonal peak.
All index and gridded data were converted to standardized departures using the historical mean and standard deviation at each grid-point, in preparation for correlation analysis. Point-to-field maps were computed using the Pearson's product-moment linear regression technique (Jury et al., 1992; Pathack, 1993) at lags - 4, - 2, 0, and

SOUTHERN AFRICA SUMMER RAMFALL 139
+ 2 months, which refer to September, November, January, and March. For brevity, lags - 4 and + 2 are omitted. In addition, for selected index areas, namely the central equatorial Indian Ocean in respect of SST and the equatorial central Atlantic (ECAU) in respect of the upper zonal wind, the temporal lag correlation statistics are analysed at various lags from - 5 to - 1 month.
The data are of varying lengths, so statistical significance is reached at different r values. The rainfall, global indices, and SSTextend from 1955 to 1988, hence the number of degrees of freedom (DF) is 34 and [r] > 0.28 are significant at the 95 per cent confidence limit. The CAC wind data at 200 hpa and 700 hPa extend from 1968 to 1987 and statistical significance is reached with [r] > 0.38. The OLR data series is rather short, with only 11 DF, and [r] > 0.48 are statistically significant. Meaning is attached to the correlation pattern if four adjacent grid-points have [r] values in excess of the above-mentioned criteria. Some degree of subjectivity is inherent in these statistical assessments, in part contributed by spatial autocorrelation in the field data. The correlation maps are constructed from individual r values, following linear regression of the reference rainfall index with the field variable at each grid-point. Because most of the field data span less than three decades, it is expected that 2-5-year signals are better represented in the statistical analyses than the 18-year cycle.
The regional teleconnection maps are illustrated by contouring the r values at intervals of 0-1 from 0.2 for SST and 0.3 for OLR. The wind correlations are represented as vectors by recombining the r values for the U and V components at each grid point using simple trigonometry. Positive values refer to rain- fall above normal when the field variable is above normal in the location indicated by high r isopleth values or large correlation vectors on the maps. For OLR, the inverse relationship with cloud depth should be borne in mind. The maps for South Africa, Namibia, and Zimbabwe are compared and contrasted to highlight similarities and differences. Two key indices are then temporally evaluated for the various rainfall areas.
RESULTS
Statistical results are presented for the indices and their regional climatic determinants. The variability in Figure 2(a-c) and spectral analysis of the rainfall time series suggest a large random component. Both Zimbabwe and South African rainfall display a weak spectral peak in the 17-20 year range, which coincides with the 18.6-year luni-solar tide (Currie, 1993), whereas the Namibia index has a rather flat spectrum, characteristic of a more chaotic interannual cycle. All three area-rainfall series demonstrate above normal rainfall in the mid-1950s and mid-1970s and relatively dry conditions in the early 1980s. Spectral peaks in the 2.3 and 3.5-5.0 year range are notable and highlight possible QBO and SO1 associations, as suggested previously by Nicholson (1989).
Cross-correlation of rainfall and global indices
Table I lists the 0 lag correlation values and significance levels with 34 DF for QBO, Sol, South Africa, Namibia, and Zimbabwe rainfall. The cross-correlation results are significant at the 99 per cent confidence limit for Zimbabwe and South African rainfall with r = +0-62, South African rainfall and the SOI: r = +0.57, and Zimbabwe and Namibia rainfall and the SO1 both at r = + 0.44. Correlations significant above the 95 per cent limit include Namibia and Zimbabwe rainfall: r = + 0.39, and Namibia and South African rainfall: r = + 0.33. Correlations significant above the 90 per cent limit, are noted for Zimbabwe rainfall and the QBO: r = + 0.28. Correlations computed using the 6-month trend of the SO1 from July to January did not offer any better results. Lag correlations were also performed for SO1 and QBO, r values increased by 10 per cent at lags of - 4 and + 2 months, respectively. Hence the spring SO1 and late summer QBO (at 30 hPa) are slightly better predictors than the mid-summer values. Another important point is that correlation values are 10 per cent better for seasonal indices (3-month means) than for individual months, owing to the influences of transient intra-seasonal oscillations.
Regional SST teleconnection patterns
Figures 3 and 4 illustrate the SST- rainfall correlation patterns for the three indices at lags - 2 and 0 which refer to November and January. For November, the South Africa correlation map has positive values in the central

140 M. R. JURY
Table I. Correlation between the indices: 1955-1990
QBO so1 SAFR ZIM NAMIB
QBO Coefficient 1~0000 - 0.02 15 0.1623 0.2766 0.0337
Significance level 0.0000 0.9008 0.3443 0.1025 0.8452 so1 -0.0215 1 .oooo 0.5719 0.4385 0.4356
0.9008 0~0000 0.0003 0.0075 0.0079 SAFR 0.1623 0.5719 1 .oooo 0.6242 0.3256
0.3443 0.0003 0~0000 0~0000 0.0526 ZIM 0.2766 0.4385 0.6242 1 .oooo 0.39 13
0.1025 0.0075 0~0000 0~0000 0.01 83 NAMIB 0.0337 0.4356 0.3256 0.3913 1 .om0
36 36 36 36 36 0.8452 0.0079 0.0526 0.01 83 0~0000
Sample size 36 36 36 36 36
36 36 36 36 36
36 36 36 36 36
36 36 36 36 36
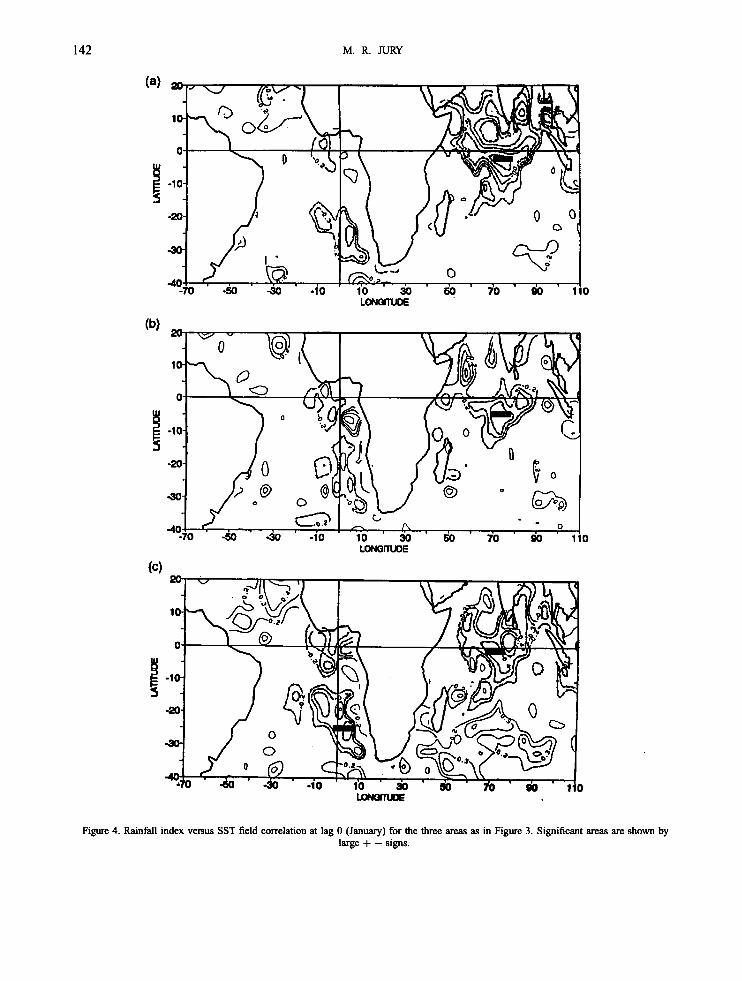
Atlantic Ocean and a small negatively correlated area off equatorial east Africa. The Zimbabwe and Namibia maps both show negative correlations south of India in the central ocean basin and off the east African coast. Strongest correlations (r= -0-4) occur in the region 70"-85"E, 5"N-5"S. Both South Africa and Zimbabwe display positive correlations in the south Indian Ocean in the area 25"-35"S, 60"-90"E.
The rainfall-SST correlation maps for Januaq (0 lag) all show a large area of negative values in the central Indian Ocean, extending from 10°N-15"S, 50"-90"E. The correlation values are strongest for South Afiica, exceeding - 0.6 from O"-lO"S, 60"-80"E. Jury et al. (1994) have shown that this pattern is consistent with an ENSO response. Central equatorial Indian Ocean SST closely follow SST in the eastern Pacific and the SOI. A composite for the years 1973, 1983, and 1987 illustrates the close correspondence between these indicators of El Niiio (Figure 5). Composite SSTs for the CEI appear to lag the global ENSO during the Indian monsoon transitions before ( - 6 months) and after the event (+ 6 to + 12 months). The finding suggests that SSTs of CEI could mislead during the year following a strong El Niiio.
The SST-rainfall correlations are negative in the central South Atlantic in the area 10"-30"S, 10"W-10"E. The values in the Atlantic are weaker than in the Indian Ocean and spatially less extensive at lag 0. In the case of South Africa, and to a lesser extent Zimbabwe, a small positive region is noted in the vicinity of 40"S, 10"E to the south of Africa where the warm Agulhas Current splits and returns to the Indian Ocean (Lutjeharms et al., 1988). The area of positive correlation in the south Indian Ocean increases for the Zimbabwe index (at - 2 lag), but not for the others. Using the UKMO SST data set, Walker (1 989) and Mason (1 992) have identified the region influenced by the Agulhas Current in the southern Mozambique Channel to be positively correlated with summer rainfall variability over southern Africa, particularly when the El Niiio-Southern Oscillation is weak. However, the COADS-based results here, for an assumed mixed mode of climatic variability, suggest that correlations in the area 28"-36"S, 32'4O"E lack statistical significance, particularly in the early summer (lags -4 to 0 months).
In summary, SSTs in the central equatorial Indian Ocean basin are linked with summer rainfall over southern Africa, particularly for Zimbabwe. Changes in SST over the CEI are consistent with those associated with the ENSO signal (Jury et al., 1994). These SSTs affect overlying convection, as noted in the following correlation maps.
Regional OLR teleconnection patterns
Figures 6 and 7 illustrate the OLR - rainfall correlation patterns for the three indices at the prescribed lags - 2 and 0 months. It should be noted from the outset that OLR is well correlated with summer rainfall departures over southern Afiica (r = - 0.93; Jury et al., 1993) and to a lesser extent elsewhere. All three indices display a positive

SOUTHERN AFRICA SUMMER RAINFALL 141
Figure 3. Rainfall index versus SST field correlation at lag -2 (November) for the three areas; South Africa, Namibia, and Zimbabwe (top to bottom). Solid (dashed) lines refer to positive (negative) correlations. Isopleth interval is 0.1 starting at an absolute value of 0.2 [r] > 0.28
significant at 95 per cent.
M. R. JURY
Figure 4. Rainfall index vems SST field correlation at lag 0 (January) for the three areas as in Figure 3. Significant areas are shown by large + - signs.

SOUTHERN AFRICA SUMMER RAINFALL 143
3
2
1 1 b
0
-1
COMPOSITE EL NlNO
X f \ .I -
-1-:0 % ' 4 ' -2 ' b 2 ' 4 ' 6 ' b 10 12 MOMns
X CEMRALlNOUN + EASTERN PACIFIC x .Sol 7 3 . ~ 4 ~ 8 7
Figure 5. Comparison between composite El Ni~io signals for CEI and eastern equatorial Pacific SST and the SO1 (inverted), averaged for three cases 1973, 1983, 1987 for the period - 12 to + 12 months
correlation in the central and western Indian Ocean during November. The relationship means that reduced (increased) convection in the spring time monsoon transition corresponds with above (below) normal rainfall in the following summer over southern Africa. Convection in the monsoon trough is modulated by the underlying SST (according to Figure 4), which drives an anomalous Walker Cell llnked to Southern Africa (Jury and Lutjehms, 1993). The positively correlated area is over the western equatorial Indian Ocean in the case of the South Africa index, weaker and located to the north of Madagascar in the Namibia index map, and aligned along 70"E in the Zimbabwe index. The r values are in the range + 0.4 to + 0.5.
The January rainfall-OLR correlation maps show the expected negative (sympathetic) area over southern Africa for all indices, with a distinct W - S E alignment consistent with subtropically forced cloud bands (Harrison, 1986). The band of negative correlations is located over southern Africa in the case of the South Africa index, but shows sympathy with the south-east Atlantic in the case of Namibia and Zimbabwe. In the case of South Africa, opposing correlations are noted over the South Atlantic (30"W) and the south-west Indian Ocean (60"E) in the latitude band 20"-30"s. This correlation pattern has a zonal wavelength of 90" longitude and may refer to a subtropical hemispheric wave four pattern that modulates convective variability at the interannual scale. In the case of Namibia a strong positive correlation is located in the South Atlantic mid-latitudes. Ferrel cell overturning is implied by this correlation pattern.
For Zimbabwe the OLR correlations are negative over a large area, extending into the south-east Atlantic and south-west Indian Ocean mid-latitudes. The pattern implicates standing troughs as described by Lyons (1991). A sympathetic response is noted over the bulge of west Africa. An opposing correlation is found over Madagascar, and is a pattern consistent with the influence of the QBO (Jury el al., 1994).
In summary, the OLR correlations reveal that convection in the spring-time monsoon trough over the central and western Indian Ocean is an important determinant of summer rainfall over southern Africa. As the monsoon trough migrates southward during the season, it sets up a 'dipole' which modulates southern Africa rainfall through east- west overturning (Jury, 1993). The circulation anomalies are demonstrated in the teleconnection maps with respect to tropospheric wind correlation patterns.
Regional wind teleconnection patterns
Figures 8-1 1 illustrate the wind-rainfall correlation patterns at the 200 hPa and 700 hPa levels respectively for lags - 2 and 0. At - 2 the 200 hPa vectors (Figure 8) are directed westward over the equatorial Atlantic Ocean in all cases between 5"N and 10°S, 4O"W-O". A cyclonic correlation gyre is located over southern Africa with

144 M. R. JURY
Figure 6. Rainfall index versus OLR field correlation at lag - 2 (November) for the three areas as in Figure 3. Isopleths start at an absolute value of 0.3. [r] > 0.48 significant at 95 per cent

SOUTHERN AFRICA SUMMER RAINFALL 145
s 5
ulMIITu#
Figure 7. Rainfall index versus OLR field correlation at lag 0 (January) for the three areas as in Figure 3

146 M. R. JURY
Figure 8. Rainfall index versus 200 Wa wind field correlation at lag - 2 (november) for the three areas as in Figure 3. Correlations are expressed as vectors by re-constituting the zonal and meridional correlation values. Vector key is for 95 per cent where [r] = 0.38

SOUTHERN AFRICA SUMMER RAINFALL 147
Figure 9. Rainfall index versus 200 hPa wind field correlation at lag 0 (January) for the three areas as in Figure 3

148 M. R. JURY
Figure 10. Rainfall index verus 700 hPa wind field correlation at lag - 2 (November) for the three areas as in Figure 3

SOUTHERN AFRICA SUMMER RAINFALL 149
Figure 1 I . Rainfall index versus 700 hPa wind field correlation at lag 0 (January) for the three areas as in Figure 3

150 M. R. JURY
Figure 12. Area-rainfall indices correlated with (top) the CEI SST seasonal index at lags from - 5 to - 1 months; and (bottom) the ECAU Atlantic 200 hPa zonal wind index from - 5 to - 2 months. Peak correlations (negative) are listed. The South African rainfall index is divided
into north-east (TVL) and south-west (Cape) areas
southward directed flow anomalies over the Mozambique Channel. All three indices display northward directed correlation vectors at 200 hPa over the central South Indian Ocean between 60" and 90"E, 0-20°S, in conjunction with the area of significant - SST and + OLR correlations (Figures 3 and 6). This may be a southern Hadley cell response to tropical forcing. The wind vector correlations at 700 hPa (Figure 10) display a similar response, implying that Hadley anomalies may be confined near the surface.
In January the upper wind correlations are dominated by an anticyclonic feature to the south of Afiica (Figure 9), with westward directed vectors across the rainfall index areas. The anticyclonic centre shifts longitude in conjunction with the rainfall area, being further west in the case of Namibia, and further east in the case of Zimbabwe. Northward vectors are found to the south of Madagascar, and southward vectors occur over the Benguela region of the south-east Atlantic, a pattern consistent with Hadley and Ferrel cell overturning (Tyson, 1986).
In the case of the 700 hPa level ( - 2 lag) correlation vectors, the patterns are more incoherent (Fig. 10). It should be noted that this level corresponds with the level of maximum water vapor flux (D'Abreton, 1992). A

SOUTHERN AFRICA SUMMER RAINFALL 151
common feature is the northward directed vectors in the south-west Indian Ocean in the vicinity of Mauritius 10"- 30"S, 50"-70"E. Strong westward directed vectors are found in the South African index map across the trade wind zone of the South Indian Ocean. Eastward directed vectors occur over the equatorial Atlantic, except for the Namibia index.
At 0 lag (January) the 700 hPa correlation vector fields reflect an anticyclonic presence over the Agulhas Current region to the south-east of southern Africa, particularly for the South Africa and Zimbabwe index maps (Fig. 11). This feature is relatively large, covering an area from 20"-50°E in the latitude band 20"-35"s. On its equatorward edge, flow anomalies indicate south-westward advection of moist unstable air in wet summers, from a source region over the northern Mozambique Channel. Northward vectors over the south-west Indian Ocean extend from 15" to 35"S, 55"-80"E and imply the advection of cold dry air into the tropical cyclone zone. Convective systems over the tropical south-west Indian Ocean are suppressed when rainfall over southern Africa is enhanced. Another feature of the 700-Ha correlation vector maps is a cyclonic tendency in the South Atlantic.
In summary, the most useful circulation index is zonal upper winds over the equatorial Atlantic. This is a signal associated with the SO1 (Jury et al., 1994), and may refer to a retreat (advance) of the South Atlantic standing westerly wave in La Niiia (El Niiio) years, through the upstream effect of meridional SST gradients on the thermal wind. Harrison (1 986) identified the central South Atlantic upper winds as an important modulator of southern Afiican climate, through downstream adjustment of subtropical westerly waves and associated poleward fluxes. The Atlantic wind index is investigated at various lags and compared with the Indian SST index in Figure 12.
Temporal correlation of ECAU wind and CEI SST indices
By extracting and averaging 200 hPa zonal winds and SST departures over identified key areas, temporal relationships with various summer rainfall indices can be examined more closely. The SST of CEI is extracted using the guidance of Pathack (1993) as 0"-10°S, 60"-80"E, and the ECAU wind index is extracted over the domain of highest correlation (in Figure 8) as 35"-5"W, 5"N-10"s. The standardized departures are computed for each month and season for comparison with the rainfall indices over the period 1968-1987. Additionally, the South African rainfall index used earlier is split into a north-east region (Transvaal, TVL), and a south-west region
Initially monthly lags of these indices were tested, however, a high degree of intraseasonal 'noise' was found in the tropical indices in association with the Madden-Julian Oscillation (Levey, 1993). To reduce this, 3-month running means of the CEI and ECAU indices were computed and cross-correlated (Figure 12).
For the CEI seasonal index of SST, correlations grow from r of - 0.3 at lag - 5 for most rainfall areas, to a peak of - 0.8 1 at lag - 1 month for north-east South Africa (TVL). Correlations are poor for Namibia and south- west South Africa (Cape) at lags - 5 to - 3 months and generally do not exceed - 0.6 for any lag and area except at lag - 1, which for operational forecasting and management purposes is too late. On the other hand, the ECAU wind seasonal index correlations exceed - 0.4 at lag - 5 months for all areas. In addition, the equatorial central Atlantic zonal wind correlations peak earlier at - 0.83 at lag - 3 months for south-west South Africa (Cape) and for other areas. The indices are best correlated with rainfall areas in closest proximity: with Zimbabwe and north- east South African rainfall in the case of the CEI; and with Namibia and south-west South African rainfall in the case of the ECAU.
Evidence of precursor wind correlations being as robust as those for SST suggests that upper kinematic processes may play an equivalent role to that of surface forcing. In an assumed mixed mode scenario, interannual variance owes as much to subtropical westerly shear, mid-level vorticity and standing wave disposition over the south-east Atlantic, as to tropical SST and monsoon convective influences from the Indian Ocean.
(Cape).
CONCLUSIONS
A number of climatic predictors offer useful guidance in long-range forecasting of summer rainfall over southern Africa, including the spring season value of the SO1 and the late summer value of the QBO. The SST changes in the central ocean basins, particularly the central equatorial Indian ocean, are implicated in interannual fluctuations, through the correlation analyses presented at lags of - 2 and 0 months. Changes in SST over the CEI are consistent

152 M. R. JURY
with those associated with the ENS0 and affect overlying convection and the southern Hadley cell, as noted in the OLR and 200-hPa wind correlation maps. These show that convection in the spring-time monsoon trough over the central Indian Ocean is a reliable climatic determinant of teleconnections governing summer rainfall over southern Africa. As the monsoon advances southward from spring to summer, it establishes a convective ‘dipole’, which modulates regional convection through east-west differences in Hadley cell mass overturning.
A circulation feature that emerges from this correlation analysis is zonal upper wind anomalies in the equatorial Atlantic, which influence the downstream disposition of westerly waves off the south-west coast of southern Africa. During El Niiio (La Nifia) conditions the resultant horizontal shear may enhance (disrupt) highs over southern Africa. At lower levels, a large gyre that develops over the southern Mozambique Channel in summer modulates the moisture flux. South-westward advection of moist tropical air from a source area over the northern Mozambique Channel is implicated in wet years, whereas a reversal to north-eastward advection of dry subtropical air from the South Atlantic is a limiting factor in dry years.
Statistical guidance in long-range forecasts and an improved understanding of the climatic determinants of southern African summer rainfall have been gained in this study. Having identified a number of predictors in various parameter fields, the time has come to go beyond simple pair-wise linear regression techniques. The performance of long-range forecasts will likely improve through the use of a variety of identified precursor indices in multivariate models. These models could incorporate non-linear responses and critical thresholds, to better define links between global and regional climate. It is likely that further derived meteorological products and longer time series for the field variables will improve the statistics. This will be particularly important for consideration of the 18-year cycle, whereas factors underlying 2-5-year cycles are relatively well exposed here. It should be borne in mind that high-frequency climate variability is embedded in low-frequency climatic dnft, which could place limits on the reliability of statistical models.
On the basis of the above precursor indices and patterns, summer rainfall forecasts have been issued every spring to a network of organizations including Southern African Development Countries (SADC) national weather services, drought monitoring centres, and farmers co-operatives. Seasonally averaged forecast errors were contained in the range f 15% in the period 1991-1994. In 1995 forecast skill was lower because an El Nino event developed in the tropical south-east Atlantic and ‘upstaged’ a favourable ECAU index. This suggests a need for the separation of climate modes through principle components analysis and real-time tracking thereof.
With seasonal forecasts offering skill better than chance, informed management procedures can be implemented to obtain more efficient use of the agricultural and hydrological resources in southern Africa. In this way a degree of food security can be afforded to communities resident on land that is fast approaching its carrying capacity.
ACKNOWLEDGEMENTS
This work was jointly sponsored by the Water Research Commission project on short-term rainfall variability, the Foundation for Research Development programme on South African climate variability and the Namibian Agronomic Board. Professor €? D. Tyson of the University of Witwatersrand is thanked for criticism of the initial manuscript. Data processing in support of this study was performed by C. McQueen and K. Levey of the Climate and Weather Research Laboratory, University of Cape Town.
REFERENCES
Currie, G. R. 1993. ‘Luni-solar 18.6- and 10-1 I-year solar cycle signals in South African rainfall’, Int. J Climrol, 13, 237-256. D’Abreton, P. C. 1992. The dynamics and energetics of tropical-tempemte troughs over southern Afkca, PhD thesis, University of
Harrison, M. S. J. 1986. A synoptic climatology ofsouth Ahcan rainfall variations, PhD thesis, University of Witwatersrand, Johannesburg, 341
Jury, M. R. 1993. ‘A climatic dipole governing the interannual variability of convection over the SW Indian Ocean and SE Africa region’, Trends
Jury, M. R. and Lutjehms, J. R. E. 1993. ‘The structure and possible forcing mechanisms of the 1991-1992 drought over southern Africa’, S.
Jury, M. R. and Pathack, B. 1995. ‘Climatic patterns associated with the 1992 drought over southern Africa: observations and GCM results’, 1
Witwatersrand, Johannesburg, 231 pp.
PP.
Geophys. Res., 1, 165-172.
Af. ljdskz Nar. Tech, 12, 8-16.
Af. Meteoml. Soc., 2, (in press).

SOUTHERN AFRICA SUMMER RAINFALL 153
Jury, M. R., Levey, K. M., McQueen, C., Parker, B. A,, Lee-Thorp, A., Makarau, A. and Pathack, B. 1992. Correlation Atlas of Climatic Determinants for Sub-tropical Southern Afiica and the SWIndian Ocean, Technical Report, Department Oceanography, University of Cape Town.
Jury, M. R., Pathack, B. and Waliser, D. 1993a. ‘Satellite OLR and microwave data as a proxy for summer rainfall over subequatorial Africa and adjacent oceans’, Int. 1 Climatol, 13, 257-269.
Jury, M. R., Lindesay, J. A. and Wittmeyer, 1. 1993b. ‘Flood episodes in central South Africa from satellite and ECMWF data’, S. Af . J: Sci., 89,
Jury, M. R., McQueen, C. and Levey, K. 1994. ‘SO1 and QBO signals in the African region’, Theoretical Appl. Climatol., 50, 103-1 15. Levey, K. M. 1993. Intm-seasonal oscillations of convection over southern Afnca, MSc thesis, University of Cape Town, 236 pp. Lindesay, J. A. 1988. The southern oscillation and atmospheric circulation changes over southern Afica, PhD thesis, Univ Witwatersrand,
Lutjeharms, J. R. E. and Van Ballegooyen, R. C. 1988. ‘The Agulhas Current retroflection’, J: Phys. Oceanogr., 18, 1570-1583. Lyons, S. W. 1991. ‘Origins of convective Variability over equatorial southern Africa during austral summer’, 1 Climate, 4, 23-59. Mason, S. J. 1992. Sea surface tempemfures and South Afncan rainfall variability, PhD thesis, Geogr Dept, Univ Wits, Johannesburg, 235 pp. Mason S. J., Lindesay, J. A. and Tyson, F! D. 1994. ‘Simulating drought in southern Africa using sea surface temperature variations’, Water S. A,,
Nicholson, S. E. and Entekhabi, D. 1987. ‘Rainfall variability in equatorial and southern Africa: relationships with sea surface temperatures
Nicholson, S. E. 1989. ‘African drought: characteristics, causal theories and global teleconnections’, in Understanding Climate Change,
Pathack, B. M. R. 1993. Modulation of South Afncan summer minfall by global climaticpmcesses, PhD thesis, University of Cape Town, 214
Rocha, A. M. C. 1992. The influence of global sea surface tempemfures on southern Afican summer climate, PhD thesis, University of
Slutz, R. J. Lubker, S. J. Hiscox, J. D., Woodruff, S. D., Jeanne, R. L. Joseph, D. H., Steurer, F! M. and Elms, J. D. 1985. COADS: Comprehensive
Tyson, P. D. 1986. Climatic Change and Yariability in Southern Afnca, Oxford University Press, Cape Town, 220 pp. Walker, N. D. 1989. Sea surface temperature-minfall relationships and associated ocean-atmosphere coupling mechanisms in the southern
263-269.
Johannesburg, 284 pp.
20, 15-22.
along the SW coast of Africa’, J: Clim. Appl. Meteoml., 26, 561-578.
American Geophysical Union, Washington DC, pp. 79-101.
PP.
Melbourne, 248 pp.
Ocean-Atmosphere Data Set, Release 1, Climate Research Program, Environmental Research Laboratory, Boulder, CO, 262 pp.
Afncan region, PhD thesis, University of Cape Town, 171 pp.


![1 LEGAL PRACTICE BILL [B20 – 2012] Comparative Perspectives: Australia, Ireland, India, Namibia, Nigeria, United States of America and Zimbabwe (5 June](https://img.pdfslide.net/doc/110x75/56649dcf5503460f94ac3ffa/1-legal-practice-bill-b20-2012-comparative-perspectives-australia-ireland.jpg)