Embed Size (px)
Citation preview

In the last four decades, developing countrieshave burst onto the global marketplace. Theirshare of global trade increased from aboutone-fifth in 1960 to about one-third in 2004—at a time when global trade as whole wasincreasing to unprecedented levels. In everyregion, exports have outpaced the growth ofoutput and increased as a share of GDP. Threerounds of multilateral trade negotiations com-bined with structural economic reforms un-dertaken throughout the world ushered in thesustained reduction in border protection thatmade this growth possible. The World TradeOrganization (WTO), formed in 1994, con-solidated an evolving system of rules based onnondiscrimination among trading partners—a cornerstone of the multilateral system.
Today a second trend in the trading systemis rapidly gaining momentum and establishinga very different set of rules. This new trend isthe proliferation of regional and bilateraltrade agreements (RTAs)—agreements amonga group of countries that reduce barriers totrade on a reciprocal and preferential basis forthose in the group. The number of these agree-ments has more than quadrupled since 1990,rising to around 230 by late 2004.1 Trade be-tween RTA partners now makes up nearly 40percent of total global trade, and new agree-ments increasingly address issues beyondtrade. The value of preferences has steadilyfallen, however, as most countries have beenreducing tariffs across the board to all
partners on a most favored nation, or nondis-criminatory (MFN) basis, at the same time asthey have been eliminating barriers preferen-tially through RTAs. In fact, roughly 66 per-cent of the decline in average tariffs in devel-oping countries during the last two decadeshas come from unilateral reductions, as dis-tinct from 25 percent coming out of theUruguay Round and around 10 percent fromRTAs. Moreover, product exclusions and re-strictive rules of origin further limit the trade-expanding effects of preferences. Nonetheless,the result of this proliferation is an increas-ingly complex global trading system wheredifferent countries’ access to a given marketare often governed by very different sets ofrules.
This chapter charts the rise of RTAs, exam-ines the different motivations countries havefor pursuing RTAs, and draws attention tothe complexity they generate. It then describesthe evolution of regional trading patterns andshows how the major developing regions dif-fered strikingly in their timing of integration,their pace of export growth, their policiestoward import competition and foreign in-vestment, and the impact of regional tradingarrangements. It concludes that those regionsthat aspired to trade most with the globaleconomy became the most regionally inte-grated as well. Further, regional trade tends toprecede preferential trade agreements ratherthan the other way around.
27
Regional Trade and PreferentialTrading Agreements:A Global Perspective
2
The Proliferation of RegionalPreference Systems
More agreements are being signed. Since1990, the number of RTAs in force rose
from 50 to nearly 230 (figure 2.1). The WTO
estimates that another 60 agreements are invarious stages of negotiation. The boom inRTAs reflects changes in certain countries’trade policy objectives, the changingperceptions of the multilateral liberalization
G L O B A L E C O N O M I C P R O S P E C T S 2 0 0 5
28
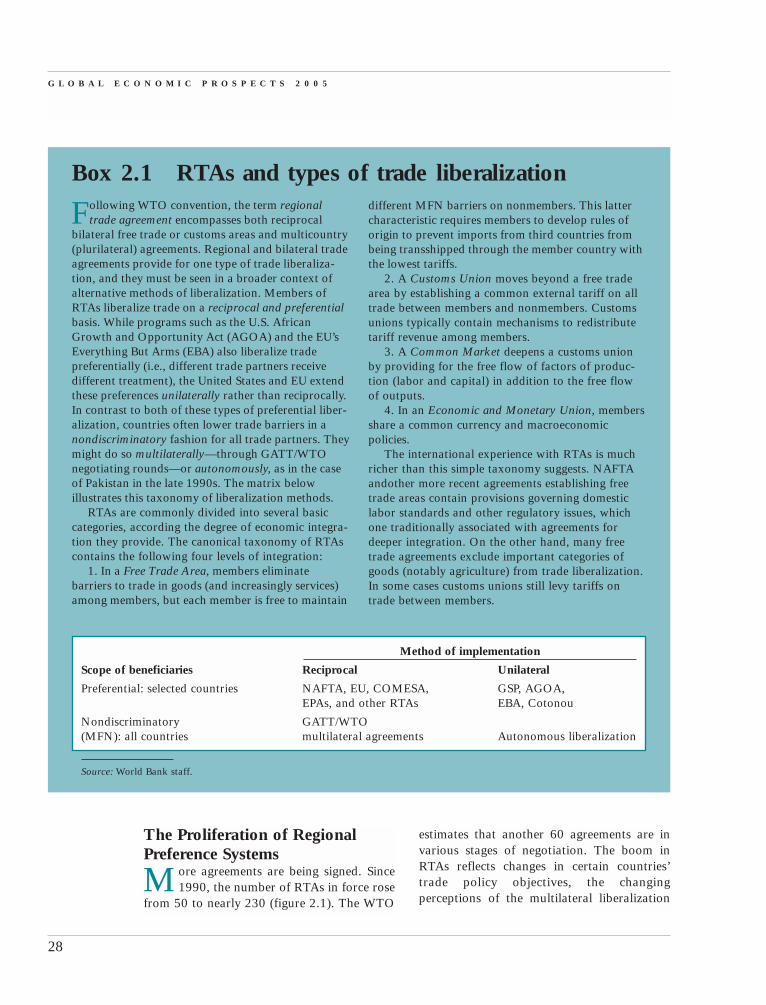
Following WTO convention, the term regionaltrade agreement encompasses both reciprocal
bilateral free trade or customs areas and multicountry(plurilateral) agreements. Regional and bilateral tradeagreements provide for one type of trade liberaliza-tion, and they must be seen in a broader context ofalternative methods of liberalization. Members ofRTAs liberalize trade on a reciprocal and preferentialbasis. While programs such as the U.S. AfricanGrowth and Opportunity Act (AGOA) and the EU’sEverything But Arms (EBA) also liberalize tradepreferentially (i.e., different trade partners receivedifferent treatment), the United States and EU extendthese preferences unilaterally rather than reciprocally.In contrast to both of these types of preferential liber-alization, countries often lower trade barriers in anondiscriminatory fashion for all trade partners. Theymight do so multilaterally—through GATT/WTOnegotiating rounds—or autonomously, as in the caseof Pakistan in the late 1990s. The matrix belowillustrates this taxonomy of liberalization methods.
RTAs are commonly divided into several basiccategories, according the degree of economic integra-tion they provide. The canonical taxonomy of RTAscontains the following four levels of integration:
1. In a Free Trade Area, members eliminatebarriers to trade in goods (and increasingly services)among members, but each member is free to maintain
Box 2.1 RTAs and types of trade liberalizationdifferent MFN barriers on nonmembers. This lattercharacteristic requires members to develop rules oforigin to prevent imports from third countries frombeing transshipped through the member country withthe lowest tariffs.
2. A Customs Union moves beyond a free tradearea by establishing a common external tariff on alltrade between members and nonmembers. Customsunions typically contain mechanisms to redistributetariff revenue among members.
3. A Common Market deepens a customs unionby providing for the free flow of factors of produc-tion (labor and capital) in addition to the free flowof outputs.
4. In an Economic and Monetary Union, membersshare a common currency and macroeconomicpolicies.
The international experience with RTAs is muchricher than this simple taxonomy suggests. NAFTAandother more recent agreements establishing freetrade areas contain provisions governing domesticlabor standards and other regulatory issues, whichone traditionally associated with agreements fordeeper integration. On the other hand, many freetrade agreements exclude important categories ofgoods (notably agriculture) from trade liberalization.In some cases customs unions still levy tariffs ontrade between members.
Source: World Bank staff.
Method of implementation
Scope of beneficiaries Reciprocal Unilateral
Preferential: selected countries NAFTA, EU, COMESA, GSP, AGOA, EPAs, and other RTAs EBA, Cotonou
Nondiscriminatory GATT/WTO (MFN): all countries multilateral agreements Autonomous liberalization

process, and the reintegration into the globaleconomy of countries in transition from social-ism. This last category accounts for many of thenew agreements signed in the early 1990s, whencountries in Eastern Europe and the formerSoviet Union negotiated RTAs with WesternEurope [both the EU and the European FreeTrade Association (EFTA)] and with each other.
Some of the RTAs included in figure 2.1have never been reported to the WTO, for anyof several reasons. One reason is that theWTO does not enforce notification (the sameis true of notification requirements in otherWTO agreements). Another is that severalcountries that have yet to join the WTO havebeen quite active in forming RTAs. Russia, forexample, is in the process of joining the WTOand has signed bilateral free trade agreements(FTAs) with other members of the Common-wealth of Independent States (CIS). It is also
pursuing two regional arrangements that aredesignated to become customs unions: theEuroasian Economic Community and theSingle Economic Space. Because a consistentdata source covering all RTAs is lacking, dataare based on the information contained in theWTO database, supplemented by data fromthe major unreported agreements.
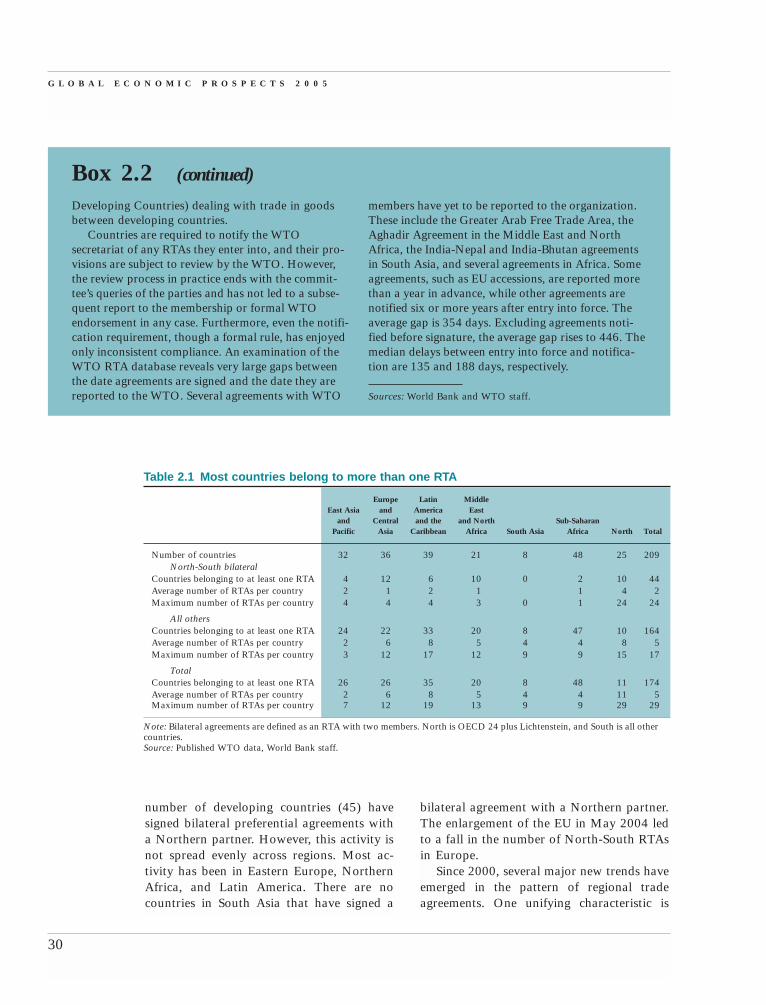
Most countries are participatingNearly all countries belong to at least oneRTA,2 and some are party to numerousagreements (table 2.1). On average, eachcountry belongs to six RTAs, though there isconsiderable variation across regions andlevels of development. East Asian countriessign fewer agreements than countries inother regions. Northern countries have par-ticipated to the greatest extent, each signing,on average, 13 agreements. A substantial
R E G I O N A L T R A D E A N D P R E F E R E N T I A L T R A D I N G A G R E E M E N T S
29
Sources: WTO data and WTO staff.
Figure 2.1 Number of RTAs exploded in the 1990s
300
250
200
150
100
50
01958 1989198419761969 1994 20041999
0
5
10
15
20
25
30
Cumulative number of agreements(EU-15 counted as single country)
Agreements notnotified to the WTO
Agreements notifiedto the WTO
Cumulative number of agreements(EU-25 counted as single country)
RTAs represent a fundamental departure from thecore WTO principle of nondiscrimination.
Nonetheless, the WTO affords its members a largedegree of flexibility in entering new RTAs. Withinthe WTO mandate, countries may join agreementsby meeting the requirements of the General Agree-ment on Tariffs and Trade (GATT) Article XXIV
Box 2.2 Reporting RTAs to the WTOcovering the formation of customs unions and freetrade areas in merchandise trade; the General Agree-ment on Trade in Services (GATS) Article V onagreements in services; or the Enabling Clause (the1979 Decision on Differential and More FavorableTreatment, Reciprocity, and Fuller Participation of
(Box continues on next page)
G L O B A L E C O N O M I C P R O S P E C T S 2 0 0 5
30
Developing Countries) dealing with trade in goodsbetween developing countries.
Countries are required to notify the WTOsecretariat of any RTAs they enter into, and their pro-visions are subject to review by the WTO. However,the review process in practice ends with the commit-tee’s queries of the parties and has not led to a subse-quent report to the membership or formal WTOendorsement in any case. Furthermore, even the notifi-cation requirement, though a formal rule, has enjoyedonly inconsistent compliance. An examination of theWTO RTA database reveals very large gaps betweenthe date agreements are signed and the date they arereported to the WTO. Several agreements with WTO
Box 2.2 (continued)
members have yet to be reported to the organization.These include the Greater Arab Free Trade Area, theAghadir Agreement in the Middle East and NorthAfrica, the India-Nepal and India-Bhutan agreementsin South Asia, and several agreements in Africa. Someagreements, such as EU accessions, are reported morethan a year in advance, while other agreements arenotified six or more years after entry into force. Theaverage gap is 354 days. Excluding agreements noti-fied before signature, the average gap rises to 446. Themedian delays between entry into force and notifica-tion are 135 and 188 days, respectively.
Sources: World Bank and WTO staff.
Table 2.1 Most countries belong to more than one RTA
Europe Latin Middle East Asia and America East
and Central and the and North Sub-Saharan Pacific Asia Caribbean Africa South Asia Africa North Total
Number of countries 32 36 39 21 8 48 25 209North-South bilateral
Countries belonging to at least one RTA 4 12 6 10 0 2 10 44Average number of RTAs per country 2 1 2 1 1 4 2Maximum number of RTAs per country 4 4 4 3 0 1 24 24
All othersCountries belonging to at least one RTA 24 22 33 20 8 47 10 164Average number of RTAs per country 2 6 8 5 4 4 8 5Maximum number of RTAs per country 3 12 17 12 9 9 15 17
TotalCountries belonging to at least one RTA 26 26 35 20 8 48 11 174Average number of RTAs per country 2 6 8 5 4 4 11 5Maximum number of RTAs per country 7 12 19 13 9 9 29 29
Note: Bilateral agreements are defined as an RTA with two members. North is OECD 24 plus Lichtenstein, and South is all othercountries.Source: Published WTO data, World Bank staff.
number of developing countries (45) havesigned bilateral preferential agreements witha Northern partner. However, this activity isnot spread evenly across regions. Most ac-tivity has been in Eastern Europe, NorthernAfrica, and Latin America. There are nocountries in South Asia that have signed a
bilateral agreement with a Northern partner.The enlargement of the EU in May 2004 ledto a fall in the number of North-South RTAsin Europe.
Since 2000, several major new trends haveemerged in the pattern of regional tradeagreements. One unifying characteristic is

that these take RTAs well beyond agreementsbetween adjacent countries. For example,
• The EU’s move toward bilateral marketaccess FTAs and Economic PartnershipAgreements (EPAs) with the ACPcountries;
• The shift in the U.S. position towardbilateral preferential agreements; and
• The effort of a handful of developingcountries to open markets through RTAs.
We turn now to a more in-depth investiga-tion of these trends.
EU Preferential Trade ArrangementsDuring the 1990s, the EU was an active spon-sor of bilateral arrangements with individualcountries and groups of countries and was themajor player in the RTA game. Prior to therecent accession of 10 new members, the EUhad bilateral or regional agreements with 111countries. Trade agreements became an inte-gral instrument of European foreign policy,particularly in the aftermath of the collapse ofthe Soviet Union.3
Three types of agreements were intended tostabilize the region after 1989. Europe Agree-ments were intended to prepare borderingEastern European countries for eventual acces-sion into the EU. They involved bilateral agree-ments between each other and with the EU toreduce tariffs, develop uniform rules of origin,EU-consistent regulatory approaches to ser-vices, and common treatment of standards aswell as transition rules in sectors such as agri-culture. These efforts culminated with the fulladmission of 10 new countries into the EU in2004—which is why the number of RTAs reg-istered with the WTO fell for the first time ever.
Euro-Mediterranean Agreements were in-tended to build bilateral trade relations be-tween neighbors, with the objective of form-ing a NAFTA-like free trade area by 2010.Launched in 1995, the EU and 12 countrieshave been involved in talks on “associationagreements” that would subsume some exist-ing bilateral arrangements. To date, bilateralagreements have been signed with Tunisia
(1995), Israel (1995), Morocco (1996),Jordan (1997), the Palestinian Authority(1997), Algeria (2001), Egypt (2001), andLebanon (2002). In general, services liberal-ization provisions are limited to the restate-ment of WTO GATS commitments with nonew liberalization or with preferential accessreserved for suppliers based in member coun-tries. Dispute settlement is state-to-state basedon ad hoc arbitration.
Partnership and Cooperation Agreements(PCAs) with the Western Balkans, Russia, andthe CIS were designed to help promote stabil-ity on the border of the EU, and in the case ofRussia, expand trade. The EU has been pro-viding technical assistance to these govern-ments to help implement the institutional re-forms that are part of the PCAs.
Two new agreements have been added tothis list since 2000.
• Economic Partnership Agreements(EPAs) are designed to replace the pref-erential systems embodied in the Conto-nou Agreement (the successor to theLomé Convention), which had received awaiver under the enabling clause fromGATT Article XXIV, a waiver thatexpires in 2007. EPAs are designed topromote trade and development in theACP 77 countries in a WTO-consistentfashion by establishing agreements be-tween large groups of countries formingcustoms unions (box 2.3).
• Free Trade Agreements with SouthAfrica (which entered into force in2000), Mexico (2000), and Chile (2003)are designed to open markets and securetrade. Agreements with the Gulf Cooper-ation Council (GCC) and the CommonMarket for the South (MERCOSUR) areunder active negotiation. These embodyfree trade provisions for a range of prod-ucts as well as provisions to liberalize atleast some services (Ullrich 2004).
The EU agreements govern services trade inaddition to trade in goods. The agreements
R E G I O N A L T R A D E A N D P R E F E R E N T I A L T R A D I N G A G R E E M E N T S
31
with Mexico and Chile provide for specificliberalization commitments in the financialsector over and above those included inGATS, with the Chilean agreement addingtelecommunications and maritime services(see Ullrich 2004). The South African agree-ment alludes to possible services liberaliza-tion, but without commitment. The EU agree-ments differ in important respects from theU.S. agreements in that they are generally lesscomprehensive, provide less market access inagriculture, and do not provide for investor-state dispute resolution (see chapter 5).
The U.S. embraces bilateralismPrior to the present administration, the U.S. hadgenerally eschewed reciprocal preferentialtrade agreements, whether regional or bilateral.
Exceptions included only Canada and Israel inthe 1980s and NAFTA in the early 1990s. In-deed, many U.S. trade observers contend thatopening NAFTA talks was designed primarilyto support multilateral trade negotiations—tospur the Europeans and others into acting ontheUruguayRound.Twoyears later, theClintonadministration announced its desire to form aFree Trade Area of the Americas (FTAA), and itsigned an FTA with Jordan in 2000.
Since the approval of trade promotion au-thority in 2002, however, the United States hasgiven much greater emphasis to securing bilat-eral FTAs in tandem with its efforts to achievemultilateral liberalization through the WTO.Since 2002 the United States has signed bilat-eral accords with Australia, Bahrain, CentralAmerica plus the Dominican Republic, Chile,
G L O B A L E C O N O M I C P R O S P E C T S 2 0 0 5
32
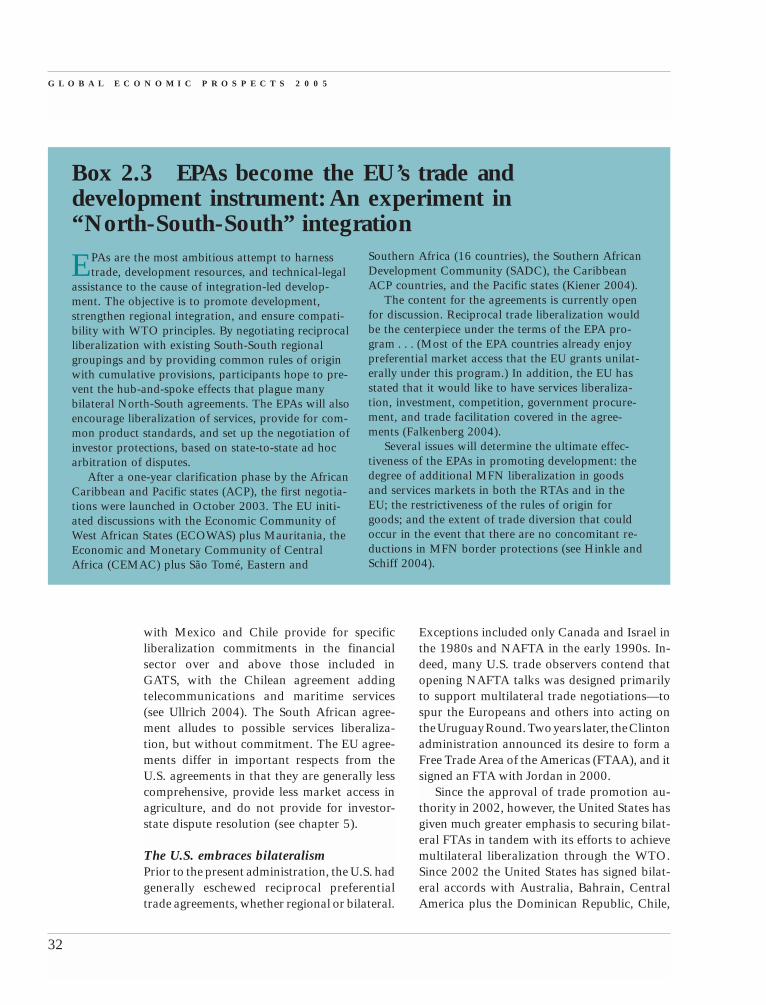
EPAs are the most ambitious attempt to harnesstrade, development resources, and technical-legal
assistance to the cause of integration-led develop-ment. The objective is to promote development,strengthen regional integration, and ensure compati-bility with WTO principles. By negotiating reciprocalliberalization with existing South-South regionalgroupings and by providing common rules of originwith cumulative provisions, participants hope to pre-vent the hub-and-spoke effects that plague manybilateral North-South agreements. The EPAs will alsoencourage liberalization of services, provide for com-mon product standards, and set up the negotiation ofinvestor protections, based on state-to-state ad hocarbitration of disputes.
After a one-year clarification phase by the AfricanCaribbean and Pacific states (ACP), the first negotia-tions were launched in October 2003. The EU initi-ated discussions with the Economic Community ofWest African States (ECOWAS) plus Mauritania, theEconomic and Monetary Community of CentralAfrica (CEMAC) plus São Tomé, Eastern and
Box 2.3 EPAs become the EU’s trade anddevelopment instrument: An experiment in “North-South-South” integration
Southern Africa (16 countries), the Southern AfricanDevelopment Community (SADC), the CaribbeanACP countries, and the Pacific states (Kiener 2004).
The content for the agreements is currently openfor discussion. Reciprocal trade liberalization wouldbe the centerpiece under the terms of the EPA pro-gram . . . (Most of the EPA countries already enjoypreferential market access that the EU grants unilat-erally under this program.) In addition, the EU hasstated that it would like to have services liberaliza-tion, investment, competition, government procure-ment, and trade facilitation covered in the agree-ments (Falkenberg 2004).
Several issues will determine the ultimate effec-tiveness of the EPAs in promoting development: thedegree of additional MFN liberalization in goodsand services markets in both the RTAs and in theEU; the restrictiveness of the rules of origin forgoods; and the extent of trade diversion that couldoccur in the event that there are no concomitant re-ductions in MFN border protections (see Hinkle andSchiff 2004).

Morocco, and Singapore. The United Statesappears to have intensified its pursuit of RTAssince the Cancun WTO Ministerial (September2003). Negotiations are officially4 under waywith Colombia, Ecuador, Panama, Peru,SACU, and Thailand. Other economies deemedto be in the queue are Bolivia, Egypt, NewZealand, Pakistan, the Philippines, SouthKorea, Sri Lanka, and Taiwan (China), andUruguay (Schott 2004). This intensified pacemay reflect the intention to prod both the mul-tilateral negotiations and the FTAA, as well asto respond to U.S. businesses that fear beingshut out of export markets by a growing num-ber of RTAs in which the United States is not amember.
In the broadest of terms, developing coun-tries seek to provide access to their servicesmarkets and guarantees in many nontradeareas in exchange for assured access to U.S.goods markets. Key facets of these agreementsinclude:5
• Tariff rates on most nonagriculturalproducts are bound at zero; for example,the U.S.-Chile FTA will bind duties atzero for 85 percent of trade.
• Exclusion or delayed liberalization ofsensitive products, commonly includingagricultural products such as dairy prod-ucts, cotton, ethyl alcohol, peanuts and
peanut butter, sugar, and tobacco for theUnited States. Some exclusions are dueto be phased out according to lengthytimetables; in the Chile-U.S. FTA, for ex-ample, all duties will be phased out in12 years (USTR 2004).
• Intellectual property rights are conven-tionally accorded stronger protectionsthan under the WTO’s TRIPS agreement,with investor-state suits permitted in theevent of disputes.
• Investment protections, with provisionsfor national treatment and nondiscrimi-nation in pre-establishment provisionsfor companies based in each othersmarkets (though liberal rules of originindicate foreign subsidiaries located inmember countries qualify for eligibility).
• Services trade are to be open except forthose excluded in a negative list; notablyexcluded are labor service providers, ex-cept for the provisional visas held by pro-fessionals associated with investing firms.
• Labor and environment issues are in-cluded in recent agreements, with signa-tory countries undertaking commitmentsto enforce their own environmental andlabor laws. Dispute settlement panels areempowered to impose monetary finesrather than using trade sanctions to forcecompliance (box 2.4.)
R E G I O N A L T R A D E A N D P R E F E R E N T I A L T R A D I N G A G R E E M E N T S
33
Until NAFTA, the United States did not attemptto include provisions on labor in trade agree-
ments that it negotiated. As a presidential candidate,Bill Clinton promised to negotiate new side agree-ments to NAFTA on labor in order to secure suffi-cient political support for NAFTA. Since then laborissues have featured prominently in Congressionaldebates on granting the president negotiatingauthority and the resulting trade agreements.
All recent FTAs negotiated with the United Statescontain provisions requiring parties to enforce theirown labor laws. These are premised on the assump-
Box 2.4 Labor in U.S. FTAstion that each member’s existing laws are satisfactoryand therefore any trade distortions that might ariseare caused by a lack of enforcement. The agreementsenumerate five core standards: the right of associa-tion; the right to organize and bargain collectively;prohibitions on forced labor; a minimum age for em-ployment of children; and acceptable working condi-tions. The FTAs establish a procedure for makingcomplaints, encouraging resolution first through con-sultation and, if this fails, by establishing a panel ofexperts to hear the dispute.
(Box continues on next page)

The United States indicated it would not nego-tiate changes in its antidumping statutes or onits agricultural subsidies, insisting on address-ing both through the WTO’s multilateral nego-tiations. In chapter 5, we return to a deeper dis-cussion of provision for services, investment,and intellectual property rights (IPR).
Developing countries actively pursuemajor marketsThe launching of NAFTA spawned a newflurry of interest among developing countrieseager to use RTAs to secure market access.Mexico and Chile have been at the forefront ofthese developments. Mexico, having created aworld-class trade negotiating team for NAFTA,turned its attention to Central America andother countries in Latin America. It establishedarrangements with Costa Rica (1995), Bolivia(1995), Nicaragua (1998), the EU (2000),EFTA (2001), and Japan (2004). After NAFTAwas signed, Chile immediately solicited entryinto the accord. Rebuffed initially, the countryembarked on a wider strategy. Chile estab-lished agreements with MERCOSUR (1996),Canada (1997), Peru (1998), Mexico (1999),Central America (2002), the United States andEU (2003), and EFTA (2004). By 2004, Chilehad signed free trade agreements that provided
over 60 percent of its exports with duty-freeaccess to markets around the world (see Devlinand Estevadeordal 2004).
Many existing regional organizations inAfrica also moved aggressively to intensifypreferential trade liberalization during the1990s. For example, the treaty establishingthe Common Market for Eastern and South-ern Africa (COMESA), which was signed in1993 to replace the Preferential Trade Area,called for a free trade area by 2000 and acustoms union by 2004. The East AfricanCommunity was formed in the mid-1990s toaccelerate economic integration among threeCOMESA members (Kenya, Tanzania, andUganda). The SADC Trade Cooperation Pro-tocol was signed in 1996 as part of an effort toreintegrate South Africa into the regional econ-omy after the end of apartheid.
Asian countries have launched similar nego-tiations since 2001. India has concluded or isnegotiating limited arrangements with MER-COSUR and Thailand; MERCOSUR is negoti-ating with the Andean countries; China haslaunched bilateral accords with members of theAssociation of Southeast Asian Nations(ASEAN), to mention a few. In 2004, India,Pakistan, and other South Asian countries an-nounced the South Asian Free Trade Agreement
G L O B A L E C O N O M I C P R O S P E C T S 2 0 0 5
34
The labor provisions break new ground in how adispute settlement panel’s decisions are enforced.Rather than using trade remedies (i.e., granting theinjured party the right to withhold trade conces-sions), a panel can impose a monetary fine of up to$15 million per year (adjusted for inflation). Pay-ments of the fines would go into a fund to supportappropriate labor initiatives, which may includeefforts to improve enforcement of labor laws. Thismechanism appears in the agreements that theUnited States has signed with Australia, Bahrain,Chile, Central America and Dominican Republic,Morocco, and Singapore.
Box 2.4 (continued)
Using fines rather than trade sanctions has severaladvantages: while trade sanctions penalize both pol-luting and clean exporters, fines target the polluters;increased trade sanctions hurt all workers in exportindustries, but fines help restructure plants andmaintain employment; and fines build in targetedsolutions to the problem rather than present pro-tracted trade disputes.
Sources: Destler and Balint 1999, texts of FTAs on the USTRweb site (www.ustr.gov), and Weintraub 2004.
(SAFTA), which is intended to encompass all ofthe countries of the region (see Baysan 2004;Newfarmer 2004).
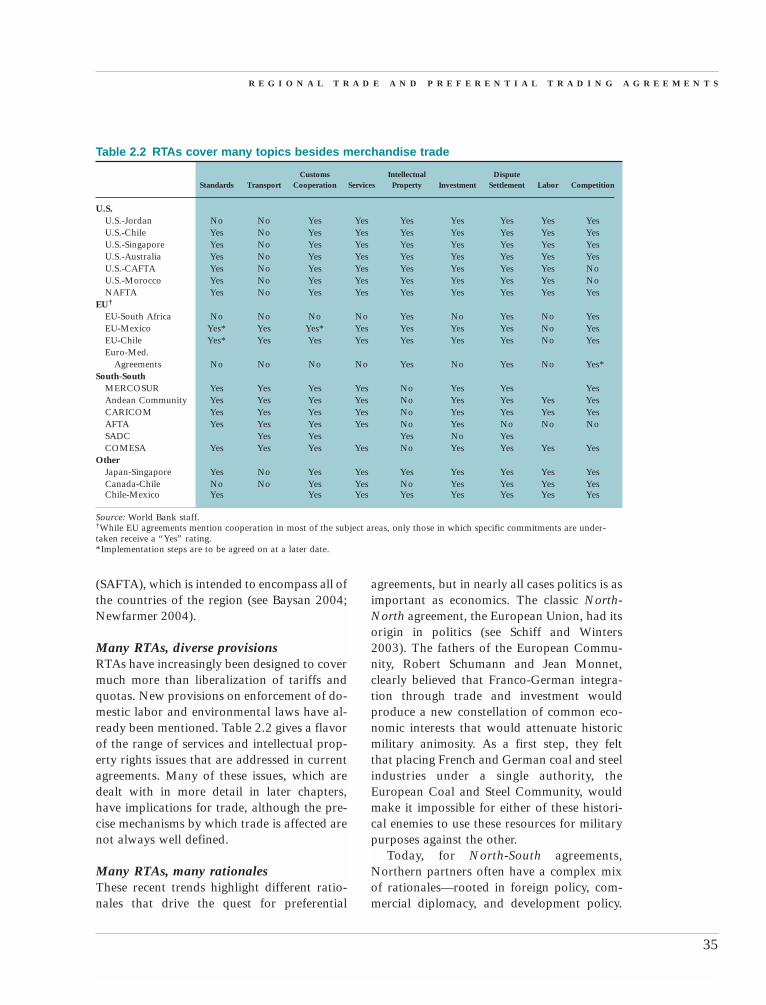
Many RTAs, diverse provisionsRTAs have increasingly been designed to covermuch more than liberalization of tariffs andquotas. New provisions on enforcement of do-mestic labor and environmental laws have al-ready been mentioned. Table 2.2 gives a flavorof the range of services and intellectual prop-erty rights issues that are addressed in currentagreements. Many of these issues, which aredealt with in more detail in later chapters,have implications for trade, although the pre-cise mechanisms by which trade is affected arenot always well defined.
Many RTAs, many rationalesThese recent trends highlight different ratio-nales that drive the quest for preferential
agreements, but in nearly all cases politics is asimportant as economics. The classic North-North agreement, the European Union, had itsorigin in politics (see Schiff and Winters2003). The fathers of the European Commu-nity, Robert Schumann and Jean Monnet,clearly believed that Franco-German integra-tion through trade and investment wouldproduce a new constellation of common eco-nomic interests that would attenuate historicmilitary animosity. As a first step, they feltthat placing French and German coal and steelindustries under a single authority, theEuropean Coal and Steel Community, wouldmake it impossible for either of these histori-cal enemies to use these resources for militarypurposes against the other.
Today, for North-South agreements,Northern partners often have a complex mixof rationales—rooted in foreign policy, com-mercial diplomacy, and development policy.
R E G I O N A L T R A D E A N D P R E F E R E N T I A L T R A D I N G A G R E E M E N T S
35
Table 2.2 RTAs cover many topics besides merchandise trade
Customs Intellectual DisputeStandards Transport Cooperation Services Property Investment Settlement Labor Competition
U.S.U.S.-Jordan No No Yes Yes Yes Yes Yes Yes YesU.S.-Chile Yes No Yes Yes Yes Yes Yes Yes YesU.S.-Singapore Yes No Yes Yes Yes Yes Yes Yes YesU.S.-Australia Yes No Yes Yes Yes Yes Yes Yes YesU.S.-CAFTA Yes No Yes Yes Yes Yes Yes Yes NoU.S.-Morocco Yes No Yes Yes Yes Yes Yes Yes NoNAFTA Yes No Yes Yes Yes Yes Yes Yes Yes
EU†
EU-South Africa No No No No Yes No Yes No YesEU-Mexico Yes* Yes Yes* Yes Yes Yes Yes No YesEU-Chile Yes* Yes Yes Yes Yes Yes Yes No YesEuro-Med.
Agreements No No No No Yes No Yes No Yes*South-South
MERCOSUR Yes Yes Yes Yes No Yes Yes YesAndean Community Yes Yes Yes Yes No Yes Yes Yes YesCARICOM Yes Yes Yes Yes No Yes Yes Yes YesAFTA Yes Yes Yes Yes No Yes No No NoSADC Yes Yes Yes No YesCOMESA Yes Yes Yes Yes No Yes Yes Yes Yes
OtherJapan-Singapore Yes No Yes Yes Yes Yes Yes Yes YesCanada-Chile No No Yes Yes No Yes Yes Yes YesChile-Mexico Yes Yes Yes Yes Yes Yes Yes Yes
Source: World Bank staff.†While EU agreements mention cooperation in most of the subject areas, only those in which specific commitments are under-taken receive a “Yes” rating.*Implementation steps are to be agreed on at a later date.
G L O B A L E C O N O M I C P R O S P E C T S 2 0 0 5
36
It is important to establish coherent relationshipsbetween environmental policies and the trade
obligations set out in various RTAs. The followingexamples illustrate the various ways that environ-mental issues are handled in these trade agreements.
WTO. Within the WTO, environmental provisionsare limited to the adoption of product-related mea-sures as “necessary to protect human, animal or plantlife or health,” or “relating to the conservation of ex-haustible natural resources.” Process-related require-ments continue to remain outside the scope of the
Box 2.5 Trade agreements and the environmentWTO. However, in the absence of agreed-on interna-tional standards (e.g., fisheries), the risk of disguisedprotectionism has prevented further consensus on theway forward. Long-standing disputes between theUnited States and other countries on tuna fishing anddolphin or turtle protection are cases in point.
NAFTA. The environmental agreement underNAFTA created the Commission for EnvironmentalCooperation to promote environmental cooperationamong the three members. The commission itself does
“Trade policy has always been the principalinstrument of foreign policy for the EuropeanUnion” (Sapir 1998). The United States nowappears to be using preferential agreementsfor reasons that are similarly broad. Both theEU and the United States seek trade agree-ments that go beyond simple tariff removal toinclude rules governing services, protection ofintellectual property, and adherence to health,labor, and environmental standards.
One goal of developing countries seekingan RTA with a large market, such as the EU6
or the United States, is simply to secure marketaccess. One should note, however, that mostdeveloping countries, especially the least de-veloped countries (LDCs), already enjoy con-siderable access to these markets for mostmanufactured products (whether through uni-lateral preference programs or because MFNtariffs are already quite low), and RTAs withthese countries often exclude agriculture andother politically sensitive products. Neverthe-less, RTAs provide some insurance againstfuture protectionist policies, and by reachingan agreement “preemptively,” they seek toavoid being left out of a future agreement.
A second objective is to reinforce internalregulatory reforms through external treatyobligations and visible political commitments.Locking in domestic reforms through a for-eign trade agreement with the EU clearly
motivated countries making the transitionfrom socialism in the 1990s. Mexico underNAFTA was motivated by a similar objective.Guaranteed market access combined withcredible domestic reforms can attract foreigndirect investment (see chapter 5).
South-South agreements often reflect a po-litical desire to form or join a broadly basedregional initiative, such as ASEAN, COMESA,or MERCOSUR. The drive for economicintegration often begins with political objec-tives. Like France and Germany in the 1950s,the newly established democracies of theSouthern Cone formed MERCOSUR in themid-1980s in the hopes of damping the tradi-tional military hostility between major re-gional powers—Argentina and Brazil. SADCoriginated in the 1980s as a coalition opposedto apartheid in South Africa and has morerecently turned to creating a free trade area.Some observers note that African customsunions and free trade areas are as active inareas such as conflict resolution as in tradeliberalization. Finally, many see relaxed ten-sions between India and Pakistan as the realpayoff from the proposed SAFTA agreement,regardless of what happens to trade barriersin the region. The tentative conclusion of ex-isting studies is that RTAs that expand tradeflows appear to have a substantial dampeningimpact on conflict (box 2.6).
(Box continues on next page)

Not all political objectives involve war andpeace issues; some South-South agreementsare designed to pool resources for trade nego-tiations and trade policymaking. Much as theEuropean Union established a common tradepolicy with a common commissioner in chargeof trade (in part to negotiate more forcefullywith the United States in the GATT), so too adriving force for MERCOSUR was to estab-lish a common trade policy relative to the mul-tilateral and hemispheric system.
Entering into a regional agreement may alsoreflect a desire to deal with region-specific is-sues—such as transit, water, energy, migration,
movement of labor, customs, and standards—that are difficult to broach at the global level.RTAs among CIS countries are arguably anattempt to reconstruct some of the economiclinkages that were severed with the disintegra-tion of the Soviet Union and the disorganiza-tion caused by the collapse of central planning.Although many of these regional externalitiescan be handled without a trade agreement,RTAs may provide institutions and a frame-work through which to make progress on theseissues (see chapter 4).
The wide variation in RTAs flows from thevery different motivations countries have for
R E G I O N A L T R A D E A N D P R E F E R E N T I A L T R A D I N G A G R E E M E N T S
37
not set standards in the various countries, though partof its mandate is to help harmonize them upward. If acountry persistently fails to enforce environmentallaws that have conferred a trade benefit, dispute settle-ment provisions can be invoked. The commission’srole in the disputes is to see that enforcement of exist-ing laws takes place. In addition, it is charged withmonitoring the environmental effects of NAFTA. Arti-cles of agreement also dictate that countries will nottry to attract investment by relaxing or ignoring do-mestic health, safety, or environmental regulations. In-ternational environmental agreements recognized bythe three parties take precedence over national rules.
MERCOSUR. Environmental concerns are cur-rently being dealt with in MERCOSUR by a workinggroup. This group has discussed issues such as theenvironment, competitiveness, non-tariff barriers totrade, and common systems of environmentalinformation. A draft agreement from this workinggroup provides for upward harmonization of envi-ronmental management systems and increased coop-eration on shared ecosystems, in addition to mecha-nisms for social participation. It also includesprovisions on instruments for environmental man-agement, including quality standards, environmentalimpact assessment methods, environmental monitor-ing and costing, environmental information systemsand certification processes, provisions for protectinghealth and quality of life, and other general
Box 2.5 (continued)
mechanisms for implementing the protocol. Theregime is still evolving, and the challenge at hand isto ensure that the promise of the protocol leads toeffective regional cooperation and action.
Bilateral agreements. A number of recently con-cluded bilateral FTAs, including the U.S.–SingaporeFTA and the Japan–Singapore Economic Agreementfor a New Age Partnership, contain environmentalprovisions. The U.S.–Singapore FTA establishes animportant precedent for dealing with environmentalissues by including a chapter specifically on the envi-ronment. As discussed in box 2.4 on labor laws, thisagreement ensures that countries effectively enforcetheir environmental laws, and it provides for en-forcement mechanisms, including fines.
Even in the absence of such special provisions,however, trade agreements can contribute to acleaner environment simply by making trade moreresponsive to market forces. In general, countriesthat are more open to trade adopt cleaner technolo-gies more quickly, and increases in real income areoften associated with greater demand for environ-mental quality (WTO 1999). Opening up domesticmarkets also encourages cleaner manufacturing,because protectionist countries tend to shelterpollution-intensive heavy industries. The incentivesto over-exploit or deplete resources are more directlyrelated to policies and institutions within the sectorthan to trade openness per se (World Bank 1999).
G L O B A L E C O N O M I C P R O S P E C T S 2 0 0 5
38
Does trade inhibit or increase hostilities betweenstates? Greater contact among traders and con-
sumers across borders may stimulate mutual respectand more harmonious relations, and high levels oftrade can create economic interdependence, which, inturn, raises the cost of political disputes and militaryconflict.
In 1889, Wilfred Pareto suggested that “customsunions and other systems of closer commercial rela-tions [could serve] as means to the improvement ofpolitical relations and the maintenance of peace.” In1919, John Maynard Keynes wrote that “a FreeTrade Union, comprising the whole of Central,Eastern and South-Eastern Europe, Siberia, Turkey,and (I should hope) the United Kingdom, Egyptand India, might do as much for the peace and pros-perity of the world as the League of Nations itself.”
RTAs also can provide institutions and a forumfor bargaining and negotiation—to address tensionsbefore they erupt in conflict. European integration,ASEAN, and MERCOSUR are often cited as venuesfor improving political-military relations. Regionaltrade agreements do not ensure positive political out-comes, however. The U.S. civil war (1861–65) wasfought—at least in part—over high protection ofnorthern manufactures and trade restrictions on cot-ton. Similarly, the Central American soccer war of1969 emerged out of lingering hostility over tradearrangements that created advantages for El Salvadorat the expense of Honduras. And one reasonBangladesh seceded from Pakistan was the common
Box 2.6 Can RTAs prevent conflict?external tariff structure that deprived it of access tocheaper inputs from the global market and divertedtrade to Pakistan (Schiff and Winters 2003).
Mansfield and Pevehouse (2000) attempt to iden-tify empirically the role of RTAs in amelioratingconflict. They find that, on average, the likelihoodthat a pair of states will see the outbreak of a mili-tarized interstate dispute declines by around 50 per-cent if both belong to the same RTA. However,only RTAs that expand trade flows appear to havea substantial impact on conflict. When evaluated atthe lowest level of trade between partners, it ap-pears that membership in a RTA reduces the chanceof dispute by just 15 percent. Other studies havesuggested that RTAs that have little impact on trademay actually exacerbate conflict (see Powers 2003).If the gains from trade are not distributed evenly,for example, then the subsequent change in inter-state power relations can be a source of increasedtension. Also, rising interdependence may be seen asa source of increasing vulnerability, making expan-sion through military force appear more attractive.
These results, which suggest that RTAs could con-tribute to a reduced risk of military conflict, should betreated with a high degree of caution, due to problemsof causality and omitted factors, such as the broaderinstitutional framework governing relations betweenparticular pairs of countries. In Africa, for example,RTAs that address the management of cross-borderresource issues (such as water) are more effective inreducing military conflict than other RTAs.
entering into the arrangements. As we will seein subsequent sections, these motivationscontribute to greater complexity in rulesgoverning world trade.
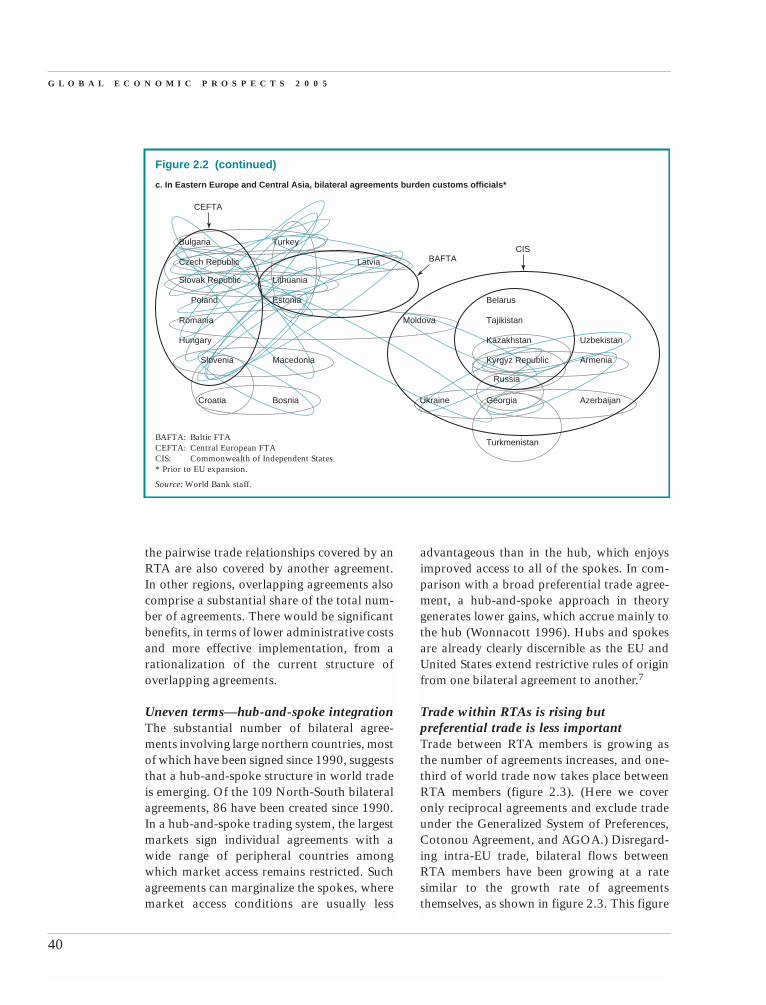
Many RTAs can complicateadministrative proceduresAn important feature of the rise in the num-ber of RTAs is the growing number of over-lapping agreements and the so-called“spaghetti bowl” that has emerged from theproliferation of bilateral agreements (fig-ure 2.2). The associated myriad of rules
strains institutions charged with administer-ing trade agreements. A web of differing tradearrangements can tangle administrative pro-cedures—customs procedures, technical stan-dards, rules of origin, and so on—and therebyraises the costs for both enterprises and gov-ernments. This complexity undermines worktoward greater trade facilitation in developingcountries.
Many agreements between country pairsare duplicated by other agreements to whichthe same two countries are parties. In Sub-Saharan Africa, for example, about one-half of

R E G I O N A L T R A D E A N D P R E F E R E N T I A L T R A D I N G A G R E E M E N T S
39
AMU:CBI:CEMAC:CILSS:COMESA:EAC:ECOWAS:IGAD:IOC:SACU:
Arab Maghreb UnionCross Border InitiativeEconomic and Monetary Community of Central AfricaPermanent Interstate Committee on Drought Control in the SahelCommon Market for Eastern and Southern AfricaEast African CooperationEconomic Community of Western African StudiesInter-Governmental Authority for GovernmentIndian Ocean CommissionSouthern African Customs Union
Figure 2.2 Spaghetti and rigatoni: Multiple, overlapping RTAs, 2004a. African agreements are overlapping
AlgeriaLibyaMoroccoMauritaniaTunisia
AMU
GhanaNigeria
Cape VerdeGambia
ECOWAS
BeninTogoCôte d’Ivoire
NigerBurkina Faso
Conseil deL’Entente
Guinea-Bissau MaliSenegal
WAEMU
LiberiaSierra Leone
Guinea
Mano River Union
CILSS
CameroonCentral African Rep.GabonEquat. GuineaRep. Congo
Chad
São Tomé & Principe
ECCAS CEMAC
Angola
Burundi*Rwanda*
Egypt
DR Congo
DjiboutiEthiopiaEritreaSudan
Kenya*Uganda*
Somalia
Tanzania*
EAC
South AfricaBotswanaLesotho
Namibia*Swaziland*
Mozambique
SACU
Malawi*Zambia*Zimbabwe*
Mauritius*Syechelles*
Comoros*Madagascar*
Reunion
IOC*CBI
SADC
COMESA
Nile River Basin IGAD
b. “Spaghetti Bowl” of RTAs in the Americas and Asia-Pacific (Agreements signed and in force in Latin America as ofMay 2004)
Source: Devlin and Estevadeordal 2004.
Source: Schiff and Winters 2003.
FTAA Trans-Pacific signedIntra-Asia-Pacific signedIntra-Asia-Pacific in force Intra-Americas in forceAPEC
Canada
USA
Mexico
Chile
Uruguay
Paraguay
BrazilArgentina
MERCOSUR
Bolivia
Colombia
Venezuela
Peru
Ecuador
CostaRica
Nicaragua
El Salvador
HondurasGuatemala
CACM
Dominica Trinidad and Tobago
Guyana Antigua and BarbudaJamaica St. Vincent and Grenadines
Suriname Grenada Barbados
St. Kitts and Nevis Belize
CARICOM
Panama
DominicanRepublic
AndeanCommunity
Bahamas
Haiti St. Lucia
Brunei
Cambodia
Thailand
Laos
Malaysia
Philippines
Myanmar
Singapore
Indonesia
Vietnam
Japan
New Zealand
Australia
ASEAN
Korea
PR China
Hong Kong
Taiwan
Russia
Papua New Guinea APEC
FTAA
SADC:WAEMU:* Indicates membership in CBI regional grouping
Southern African Development CommunityWest African Economic and Monetary Union
G L O B A L E C O N O M I C P R O S P E C T S 2 0 0 5
40
BAFTA:CEFTA:CIS:* Prior to EU expansion.
Baltic FTACentral European FTACommonwealth of Independent States
Figure 2.2 (continued)
c. In Eastern Europe and Central Asia, bilateral agreements burden customs officials*
Ukraine
Moldova
Latvia BAFTA
Turkmenistan
Georgia
Russia
Kyrgyz Republic
Kazakhstan
Tajikistan
Belarus
CIS
CEFTA
AzerbaijanBosniaCroatia
ArmeniaMacedoniaSlovenia
UzbekistanHungary
Romania
EstoniaPoland
LithuaniaSlovak Republic
Czech Republic
TurkeyBulgaria
Source: World Bank staff.
the pairwise trade relationships covered by anRTA are also covered by another agreement.In other regions, overlapping agreements alsocomprise a substantial share of the total num-ber of agreements. There would be significantbenefits, in terms of lower administrative costsand more effective implementation, from arationalization of the current structure ofoverlapping agreements.
Uneven terms—hub-and-spoke integrationThe substantial number of bilateral agree-ments involving large northern countries, mostof which have been signed since 1990, suggeststhat a hub-and-spoke structure in world tradeis emerging. Of the 109 North-South bilateralagreements, 86 have been created since 1990.In a hub-and-spoke trading system, the largestmarkets sign individual agreements with awide range of peripheral countries amongwhich market access remains restricted. Suchagreements can marginalize the spokes, wheremarket access conditions are usually less
advantageous than in the hub, which enjoysimproved access to all of the spokes. In com-parison with a broad preferential trade agree-ment, a hub-and-spoke approach in theorygenerates lower gains, which accrue mainly tothe hub (Wonnacott 1996). Hubs and spokesare already clearly discernible as the EU andUnited States extend restrictive rules of originfrom one bilateral agreement to another.7
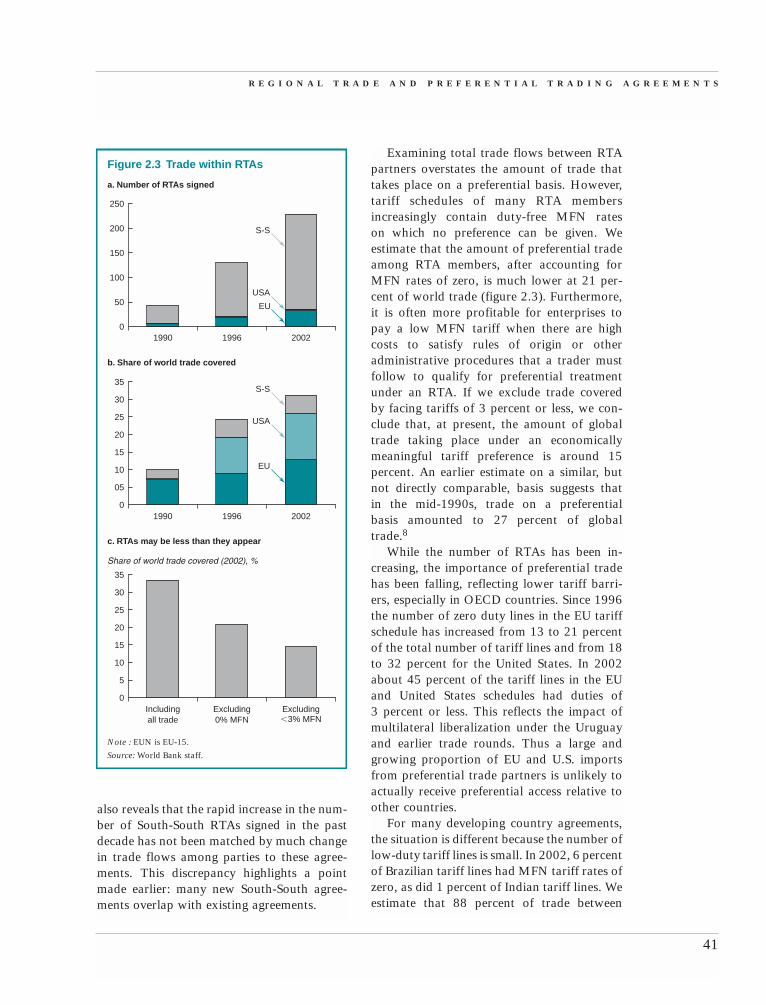
Trade within RTAs is rising butpreferential trade is less importantTrade between RTA members is growing asthe number of agreements increases, and one-third of world trade now takes place betweenRTA members (figure 2.3). (Here we coveronly reciprocal agreements and exclude tradeunder the Generalized System of Preferences,Cotonou Agreement, and AGOA.) Disregard-ing intra-EU trade, bilateral flows betweenRTA members have been growing at a ratesimilar to the growth rate of agreementsthemselves, as shown in figure 2.3. This figure
R E G I O N A L T R A D E A N D P R E F E R E N T I A L T R A D I N G A G R E E M E N T S
41
Examining total trade flows between RTApartners overstates the amount of trade thattakes place on a preferential basis. However,tariff schedules of many RTA membersincreasingly contain duty-free MFN rateson which no preference can be given. Weestimate that the amount of preferential tradeamong RTA members, after accounting forMFN rates of zero, is much lower at 21 per-cent of world trade (figure 2.3). Furthermore,it is often more profitable for enterprises topay a low MFN tariff when there are highcosts to satisfy rules of origin or otheradministrative procedures that a trader mustfollow to qualify for preferential treatmentunder an RTA. If we exclude trade coveredby facing tariffs of 3 percent or less, we con-clude that, at present, the amount of globaltrade taking place under an economicallymeaningful tariff preference is around 15percent. An earlier estimate on a similar, butnot directly comparable, basis suggests thatin the mid-1990s, trade on a preferentialbasis amounted to 27 percent of globaltrade.8
While the number of RTAs has been in-creasing, the importance of preferential tradehas been falling, reflecting lower tariff barri-ers, especially in OECD countries. Since 1996the number of zero duty lines in the EU tariffschedule has increased from 13 to 21 percentof the total number of tariff lines and from 18to 32 percent for the United States. In 2002about 45 percent of the tariff lines in the EUand United States schedules had duties of3 percent or less. This reflects the impact ofmultilateral liberalization under the Uruguayand earlier trade rounds. Thus a large andgrowing proportion of EU and U.S. importsfrom preferential trade partners is unlikely toactually receive preferential access relative toother countries.
For many developing country agreements,the situation is different because the number oflow-duty tariff lines is small. In 2002, 6 percentof Brazilian tariff lines had MFN tariff rates ofzero, as did 1 percent of Indian tariff lines. Weestimate that 88 percent of trade between
1990 1996 20020
15
10
05
25
20
30
35
1990
a. Number of RTAs signed
b. Share of world trade covered
c. RTAs may be less than they appear
1996 2002
Figure 2.3 Trade within RTAs
0
100
50
150
200
250
USA
S-S
EU
USA
S-S
EU
Includingall trade
Note : EUN is EU-15.
Share of world trade covered (2002), %
Excluding0% MFN
Excluding�3% MFN
0
5
10
15
20
25
30
35
Source: World Bank staff.
also reveals that the rapid increase in the num-ber of South-South RTAs signed in the pastdecade has not been matched by much changein trade flows among parties to these agree-ments. This discrepancy highlights a pointmade earlier: many new South-South agree-ments overlap with existing agreements.

G L O B A L E C O N O M I C P R O S P E C T S 2 0 0 5
42
countries in Latin America is potentially eligi-ble for preferential treatment under an RTA.9
For the Middle East and North African coun-tries it is 83 percent of the total. The newSAFTA will lead to three-quarters of the tradebetween members taking place on a preferen-tial basis (assuming all products are included).East Asia is an exception, where, for example,22 percent of Indonesian and 59 percent ofMalaysian tariffs are zero. Thus the amount oftrade between East Asian countries receivingtariff preferences is very small. Like OECDcountries, however, developing countries havetaken great strides to reduce MFN tariffs dur-ing the past two decades. Most of this liberal-ization has come from autonomous reductionsand not through trade agreements—eitherRTAs or multilateral trade negotiations (seebox 2.7).
Trends in Trade and Growthby Region
These agreements were superimposed in acontext of deep changes in global trading
patterns.10 The postwar period has seen majorglobal shocks and changes in the economicenvironment, including oil crises in the 1970sand financial crises in the 1980s and 1990s. Inthe past 20 years there have also been majorchanges in policy regimes. Socialist countriesacross the world restructured their economicsystems and started the process of reorientingtheir trade to the world economy. In the formerSoviet Union, this meant collapse and recon-struction; in East Asia it meant progressive,sustained, and profound institutional change.Latin America went through its own, if lessdramatic, transition from import-substitution
How does liberalization in RTAs compare to au-tonomous and multilateral liberalization? The
rapid expansion of RTAs has occurred during a pe-riod when developing countries were undertakingautonomous liberalization and also fulfilling commit-ments made during the Uruguay Round of theGATT. An examination of tariff reductions by devel-oping countries finds that neither RTAs nor multilat-eral negotiations represent the largest driver of liber-alization. Autonomous liberalization accounts for thelion’s share of trade liberalization since the 1980s.The trade-weighted average MFN tariff rate leviedby the 33 largest developing country importers(which collectively account for 90 percent of all de-veloping country imports) was 29.9 percent in the1980s. By 2003 the average MFN rate had droppedto 11.3 percent. Based on tariff concessions grantedduring the Uruguay Round, multilateral negotiationsaccount for 5.1 percentage points of the total declinein MFN tariffs, and the remaining 13.5 percentagepoints resulted from autonomous liberalization. Ifthe RTAs that these 33 countries have signed werefully implemented, the trade-weighted average ap-plied tariff would fall further to 9.3 percent. The
Box 2.7 Regional versus multilateral and unilateral liberalization:What’s more important?
chart below shows how trade liberalization is allo-cated according to these different sources.
Autonomous Liberalization66%
MultilateralAgreements
25%
Regional Agreements
10%
Share of total tariff reduction, by type of liberalization, 1983–2003
Source: Martin and Ng 2004.
R E G I O N A L T R A D E A N D P R E F E R E N T I A L T R A D I N G A G R E E M E N T S
43
1980
1990
2000
Non-oil export share of GDP (percent)
b. Exports became the driving force of growth everywhere
15
10
5
0
20
25
30
35
40
1990–2000
1961–1970
1970–1980
1980–1990
East A
sia
and
Pacific
Europ
e an
d
Centra
l Asia
Latin
Am
erica
and
Caribb
ean
Midd
le Eas
t and
North
Afri
ca
South
Asia
Sub-S
ahar
an
Africa
East A
sia
and P
acific
Europ
e and
Centra
l Asia
Latin
Amer
ica
and C
aribb
ean
Middle
East a
nd
North
Africa
South
Asia
Sub-S
ahar
an
Africa
GDP growth rates by region (percent)
a. East Asia and South Asia grew rapidly in 1980–2000,but other regions slowed
Figure 2.4 Trade performance has differed across regions
1
0
�1
�2
2
3
4
5
6
7
8
Source: World Bank staff using WITS for non-oil/total exports ratio.
Source: World Bank staff.
Note: Data obtained from GTAP release 5.4 up to 1998, thefollowing years are projected from 1998 using regional growthrates calculated from COMTRADE.
Sources: GTAP 5.4 and COMTRADE.
1980
Regional exports as share of world exports (percent)(oilexcluded)
0
2
4
6
8
10
12
14
1982
1984
1986
1988
1990
1992
1994
1996
1998
2000
2002
c. East Asian exports grew fastest, and all but South Asiaand Africa increased their share of the global market
East Asiaand Pacific
Sub-Saharan Africa
South Asia
Europe andCentral Asia
Latin Americaand Caribbean
Middle Eastand North Africa
Intra-regional trade as a share of GDP (percent), 2002
d. Integration with the world proceeded hand in handwith regional integration
15
10
5
0
20
25
26.5
15.3
6.4
3.5
0.8
5.3
30
Source: COMTRADE.
East A
sia
and
Pacific
Europ
e an
d
Centra
l Asia
Latin
Am
erica
and
Caribb
ean
Midd
le Eas
t and
North
Afri
ca
South
Asia
Sub-S
ahar
an
Africa
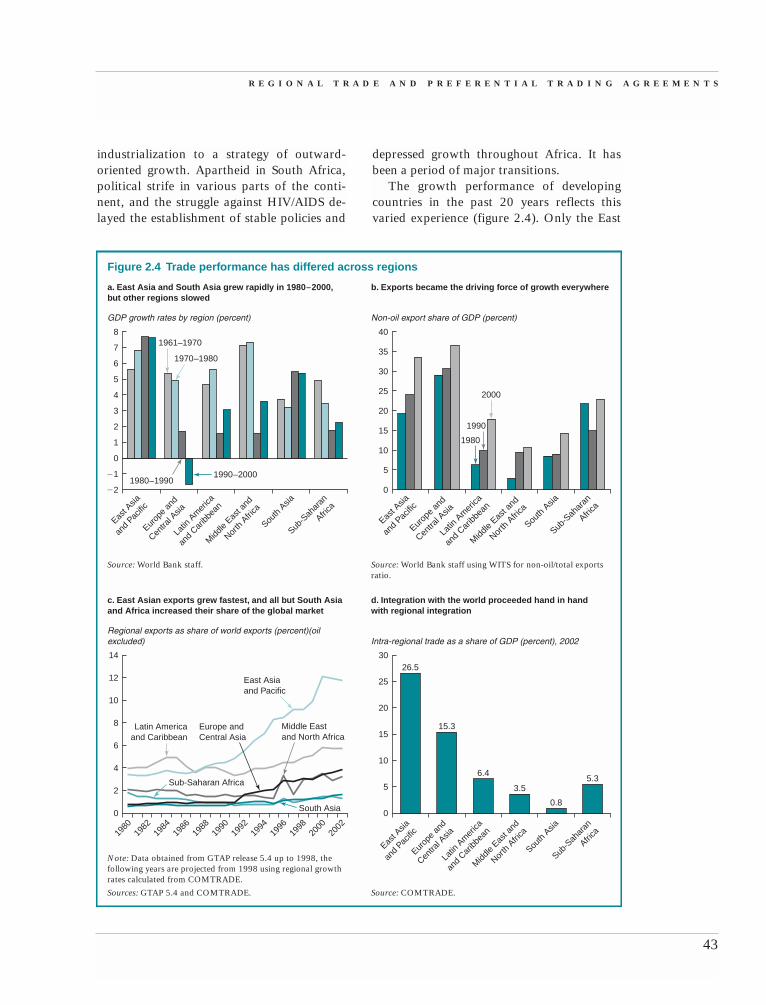
industrialization to a strategy of outward-oriented growth. Apartheid in South Africa,political strife in various parts of the conti-nent, and the struggle against HIV/AIDS de-layed the establishment of stable policies and
depressed growth throughout Africa. It hasbeen a period of major transitions.
The growth performance of developingcountries in the past 20 years reflects thisvaried experience (figure 2.4). Only the East
G L O B A L E C O N O M I C P R O S P E C T S 2 0 0 5
44
Asia and Pacific and South Asia regions expe-rienced higher GDP growth rates in the1980–2000 period than during 1960–1980.The other four regions fared worse in the lasttwo decades, with GDP growth rates thatwere one-half to two-thirds smaller thanbetween 1960 and 1980.
Nonetheless, trade grew. The share of tradein GDP grew in all regions in the 1990s. EastAsian exports grew faster than the other re-gions, and the region increased its share oftotal world exports throughout the 1980s and1990s. Latin American exports also grew con-sistently as a share of the world market duringthe 1990s, but not as steeply as for East Asia.In South Asia, however, although GDP growthincreased in the 1980–2000 period and the ex-port share of GDP rose in the latter part ofthat period, the trade growth is from a muchsmaller base. South Asia still has the lowesttrade shares of any region. Sub-SaharanAfrica has also had disappointing growth
performance. These trends reflect different ini-tial conditions and external shocks, changes indevelopment strategies, and policies towardtrade liberalization.
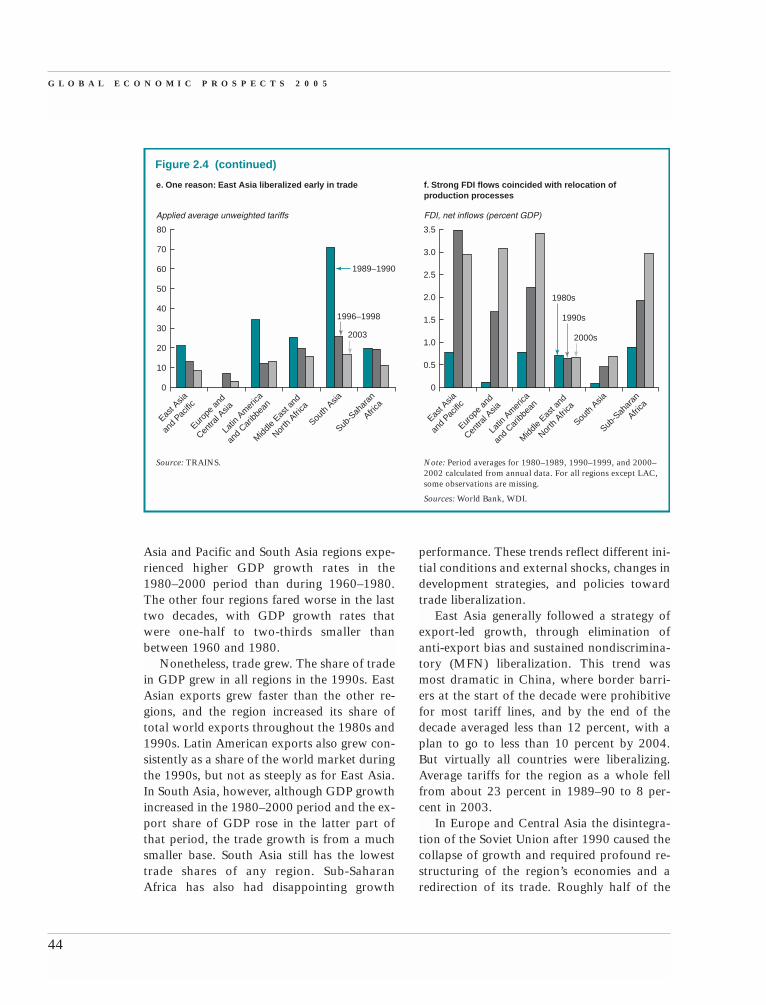
East Asia generally followed a strategy ofexport-led growth, through elimination ofanti-export bias and sustained nondiscrimina-tory (MFN) liberalization. This trend wasmost dramatic in China, where border barri-ers at the start of the decade were prohibitivefor most tariff lines, and by the end of thedecade averaged less than 12 percent, with aplan to go to less than 10 percent by 2004.But virtually all countries were liberalizing.Average tariffs for the region as a whole fellfrom about 23 percent in 1989–90 to 8 per-cent in 2003.
In Europe and Central Asia the disintegra-tion of the Soviet Union after 1990 caused thecollapse of growth and required profound re-structuring of the region’s economies and aredirection of its trade. Roughly half of the
Figure 2.4 (continued)
1989–1990
2003
1996–1998
Applied average unweighted tariffs
e. One reason: East Asia liberalized early in trade
30
20
10
0
40
50
60
70
80
Source: TRAINS.
East A
sia
and
Pacific
Europ
e an
d
Centra
l Asia
Latin
Am
erica
and
Caribb
ean
Midd
le Eas
t and
North
Afri
ca
South
Asia
Sub-S
ahar
an
Africa
1980s
1990s
2000s
FDI, net inflows (percent GDP)
f. Strong FDI flows coincided with relocation ofproduction processes
1.0
0.5
0
1.5
2.0
2.5
3.0
3.5
Note: Period averages for 1980–1989, 1990–1999, and 2000–2002 calculated from annual data. For all regions except LAC,some observations are missing.
East A
sia
and
Pacific
Europ
e an
d
Centra
l Asia
Latin
Am
erica
and
Caribb
ean
Midd
le Eas
t and
North
Afri
ca
South
Asia
Sub-S
ahar
an
Africa
Sources: World Bank, WDI.
R E G I O N A L T R A D E A N D P R E F E R E N T I A L T R A D I N G A G R E E M E N T S
45
region was drawn to the magnet of the EU’slarge and stable market. The EU respondedwith technical assistance and a political will-ingness to admit its Eastern European neigh-bors as full members. The combination of apolitical framework, trade, investment, andtechnical assistance led to an unprecedentedpace of reforms and economic integration thatculminated with 10 states joining the EU onMay 1, 2004. With their eyes turned towardmarkets in the EU, the Central European andBaltic countries achieved more extensive inte-gration and higher trade and FDI flows, whichis evident in the rapid export growth of theregion as a whole.
The CIS has moved much more slowly inits process of reform and reorientation, partic-ularly in Central Asia and the Caucasus.Under the CIS-7 initiative, trade regimes havebeen generally liberalized, but have been lim-ited by regional trade and transit barriers.
Latin America reversed its trade policystance, and during the 1990s average tariffs inthe region declined from over 30 percent to12 percent. The region’s share of the worldmarkets increased and net inflows of foreigndirect investment (FDI) as a percent of GDPsteadily climbed, reaching 5 percent of GDP in1999—higher than East Asia. Overall, FDI netinflows in the latter half of the decade morethan doubled from an average of 1.4 percentof GDP in the first half to an average of 3.6percent in the second half.
In the Middle East, policy and economicbarriers, together with a reliance on oil forseveral countries, prevented rapid growth intrade. High tariff rates, restrictions on servicesentry, and controls on agriculture interactedwith poor investment climates to impede tradeand keep transactions costs high. A largestate-led sector also shaped a noncompetitiveindustrial policy that discouraged trade. Aver-age tariff rates were almost 30 percent in thelate 1990s, mirroring the import substitutionpolicies early in Latin America and morerecently in India. Flows of foreign direct in-vestment as a percent of GDP have recovered
in the last decade, but still remain quite low atless than one percent.
South Asian countries other than Sri Lankaneither liberalized trade rules nor the rules gov-erning inflows of foreign direct investmentuntil the 1990s. Removal of the most egregiousforms of anti-export bias and gradual domesticreforms, together with textile preferences,produced a rapid expansion in garment/textileexports, and led to high growth rates for ex-ports in the 1990–2000 period and an increas-ing share of exports in GDP. Since growth wasfrom a low base, South Asian exports as ashare of world trade have remained lowthroughout the 1980–2000 period. South Asiamaintained the highest levels of average ap-plied tariffs, even compared to the import-sub-stitution industrialization period of other re-gions. However, this is changing. Nepallaunched trade liberalization in the early1990s. Sri Lanka and then Pakistan in 1997began to reduce their border barriers and in-crease their trade with the world economy.India began to reduce border protection fromvery high levels in the early 1990s and has con-tinued doing so; in early 2004, India an-nounced tariff cuts of roughly one-third,reducing the average tariff rate to about 22 per-cent. Bangladeshi border protections are stillamong the highest in the world, but they tooannounced reductions in 2004.11 The regionremains only minimally integrated in worldcapital markets. Net inflows of FDI, althoughhigher than in the early 1980s, are less than 0.8percent of GDP—the lowest of all the regions.
As with the Middle East and North Africaand South Asia regions, Sub-Saharan Africaremains weakly integrated into the globalmarket. Although exports as a share of GDPin Sub-Saharan Africa increased in 2000, ex-ports as a share of world exports have re-mained flat throughout the last decade and arelower than in the early 1980s. GDP growthhas also been worse than in the earlierdecades. Many countries in Sub-SaharanAfrica are dependent on only a handful ofcommodities with highly volatile prices; most
G L O B A L E C O N O M I C P R O S P E C T S 2 0 0 5
46
face very high transport costs and have weakinstitutions to facilitate trade. These countrieshave also experienced a number of armedconflicts throughout the previous decades andare plagued by endemic diseases such asmalaria and HIV/AIDS, which have majorimpacts on their economies and societies. Allthese factors hobble trade performance.
Changing Export Compositionand the Rise of Global Production Networks
The differential in trade and growth per-formance reflects the fact that certain re-
gions have been better placed—in partthrough the policies they adopted—to takeadvantage of new technologies and changesin the nature of world trade. Not only has thevolume of international trade expanded in thepostwar period, but also its structure haschanged in three fundamental ways. First, ex-ports of manufactured products from devel-oping countries, and trade in manufacturesamong them, have become increasingly im-portant for all regions. Second, trade integra-tion has allowed developing countries to spe-cialize (most evident in the emergence ofproduction chains), with trade in intermedi-ates becoming more important. This trend isalso evident in the role that new productsplay in production. Finally, foreign direct in-vestment is playing an ever-increasing role inthe integration process. These developmentshave facilitated the integration of countriesthat have adopted relatively open trade poli-cies, and have increased the disadvantagesfacing countries that have segmented them-selves from global markets.
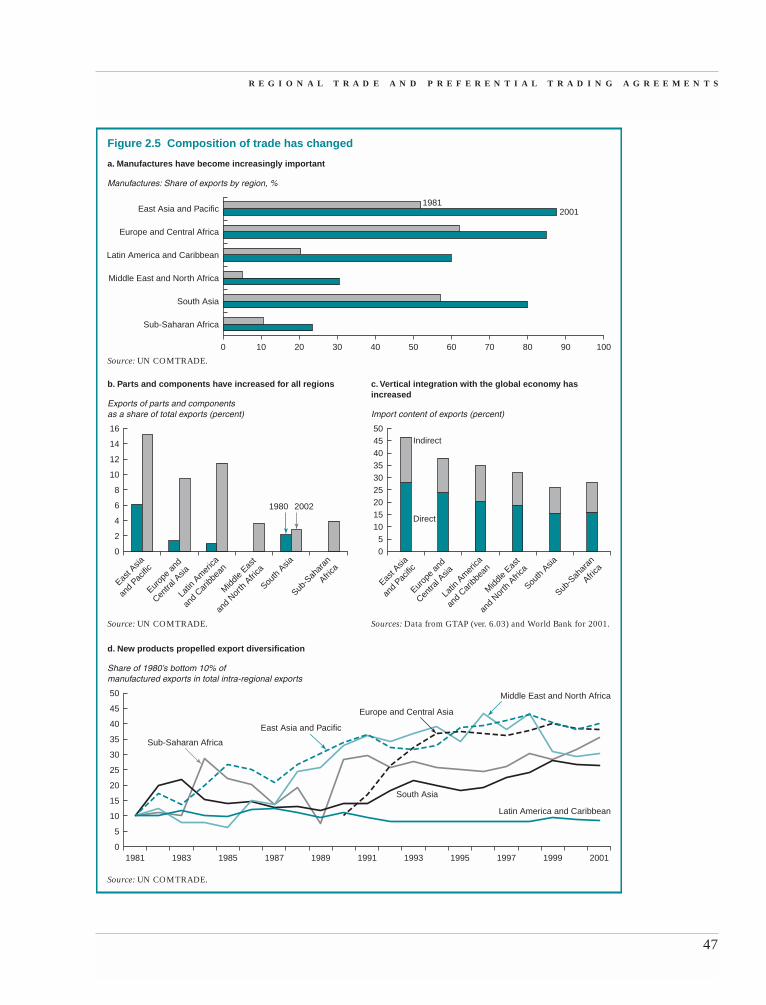
Specialization in manufacturesManufactured products as a share of exportsincreased strongly between 1981 and 2001 forall regions (figure 2.5). Countries in East Asiaand later, Latin America and Eastern and Cen-tral Europe, have followed open development
strategies that have led to increasing exports,especially of manufactures. The share of man-ufacturing in exports from East Asia, for ex-ample, increased from about 52 percent in1981 to 88 percent in 2001, while the share inLatin America tripled from about 20 percentto 60 percent.
Trade has allowed manufacturers to ex-ploit economies of scale, specialization, andscope. This is reflected in the growing shareof parts and components in total exports. Inthe three more open regions—East Asia andPacific, Europe and Central Asia, and LatinAmerica and the Caribbean—parts andcomponents trade has surged. This interna-tional segmentation of production—“pro-duction chains” in which intermediate in-puts are traded and transformed into moreprocessed intermediate inputs, which arethen moved across borders to the next stagein production—has been a major factor dri-ving the surges in intra-regional trade inthose areas.
One indicator of specialization is the im-port content of exports. To measure the roleof imported intermediates in trade, we calcu-lated an index of vertical specialization,which measures the share of the value addedof an export accounted for by imported inter-mediate inputs, either directly as imported in-puts in the exporting sector or indirectlythrough the use of imported inputs in the do-mestic production of intermediate goods usedby the exporting sector.12 Vertical specializa-tion is most important in East Asia, and leastimportant in South Asia and Sub-SaharanAfrica (figure 2.5c).
The evolution of production chains andfiner division of the production processesacross countries, including developing coun-tries, allows producers to exploit potentialefficiency gains from: (1) local increasingreturns to scale in the production of interme-diate inputs, (2) regional differences in factorcosts for different parts of the productionprocess, (3) increased competition from awider market, and (4) technology transfer
R E G I O N A L T R A D E A N D P R E F E R E N T I A L T R A D I N G A G R E E M E N T S
47
0
Manufactures: Share of exports by region, %
a. Manufactures have become increasingly important
10 20 30 40 50 60 70 90 100
Figure 2.5 Composition of trade has changed
80
Sub-Saharan Africa
Middle East and North Africa
South Asia
Latin America and Caribbean
Europe and Central Africa
East Asia and Pacific1981
2001
East A
sia
and
Pacific
Exports of parts and componentsas a share of total exports (percent)
Sources: Data from GTAP (ver. 6.03) and World Bank for 2001.
b. Parts and components have increased for all regions
0
4
2
6
8
10
12
14
16
Europ
e an
d
Centra
l Asia
Latin
Am
erica
and
Caribb
ean
Midd
le Eas
t
and
North
Afri
ca
South
Asia
Sub-S
ahar
an
Africa
1980 2002
Indirect
Direct
Share of 1980’s bottom 10% ofmanufactured exports in total intra-regional exports
d. New products propelled export diversification
10
5
01981 1983 1985 1987 1989 1991 1993 1995 1997 1999 2001
Europe and Central Asia
Middle East and North Africa
Latin America and Caribbean
Sub-Saharan Africa
South Asia20
15
25
30
35
40
45
50
East A
sia
and
Pacific
Import content of exports (percent)
c. Vertical integration with the global economy hasincreased
0
105
1520253035404550
Europ
e an
d
Centra
l Asia
Latin
Am
erica
and
Caribb
ean
Midd
le Eas
t
and
North
Afri
ca
South
Asia
Sub-S
ahar
an
Africa
East Asia and Pacific
Source: UN COMTRADE.
Source: UN COMTRADE.
Source: UN COMTRADE.

from developed countries embodied in im-ported intermediate inputs and backwardlinkages through exports. The magnitude ofthese links between increased trade in inter-mediates and productivity growth in develop-ing countries has been studied in both cross-country analysis and country case studies.13
While causation is difficult to establish, theevidence indicates that such links are impor-tant, and productivity growth associated withincreased trade in intermediates is a poten-tially important source of growth.
Trade in new productsA large part of the expansion in exports incountries undergoing liberalization and suc-cessful trade expansion comes from productsthat were not traded—or minimally traded—prior to liberalization (see Kehoe and Ruhl2002).14 Growth in trade in new products
may have the important advantage of allow-ing countries to escape the deterioration in theterms of trade that would come from trying toincrease market share in existing products.15
To assess this phenomenon, we reviewed thetrade performance of the least traded decile ofproduct categories. In East Asia and Pacific,those products that figured in the lowest 10percent of all EAP manufactured exports to theworld in 1981 grew to almost 40 percent by2001 (figure 2.5). For the other five regions,the performance of products among their low-est initial 10 percent was also noteworthy.Countries are building dynamic new marketsfor their existing exports and developing newvariations of old products to replenish theproduct cycle. This trend is also associatedwith increased trade in intermediates; detailedanalysis indicates that many of the new exportgoods are intermediate inputs. Increased trade
G L O B A L E C O N O M I C P R O S P E C T S 2 0 0 5
48
Figure 2.5 (continued)
East A
sia
and
Pacific
Share of region’s net FDI inflowsin the region’s total investment (percent)
Note: Period averages for 1980–1989, 1990–1999, and2000–2002 calculated from annual data. Both net FDI (BoP)and gross fixed capital formation are in current US dollars. For1980–1989 in ECA, GFCF was estimated using a three-yearaverage share of GFCF in GDP over the 1990–1992 time periodand back-calculating GFCF from GDP for the entire 1980–1989period. GDP time series (for 1980–1989 ECA only) obtainedfrom UN national accounts.
e. FDI flowed mostly into East Asia and Latin America
0
4
2
6
8
10
12
16
14
18
Europ
e an
d
Centra
l Asia
Latin
Am
erica
and
Caribb
ean
Midd
le Eas
t
and
North
Afri
ca
South
Asia
Sub-S
ahar
an
Africa
Parts and components, FDI, GDP: 2000FDI, percent of GDP
f. A positive trend between FDI and parts exports for theregions
0
0.5
0 2 4 6 8 10
Parts and components, percent of exports
12 14 16
1.0
1.5
2.0
2.5
3.0
3.5
4.0
SSA
MNASAS
ECA
Y � 0.2333x � 0.3067R2 � 0.6801
EAP
LAC4.5
Sources: World Bank, WDI, and UN COMTRADE.Sources: World Bank, WDI.
R E G I O N A L T R A D E A N D P R E F E R E N T I A L T R A D I N G A G R E E M E N T S
49
in new products is thus part of the virtuous cir-cle linking trade and growth.
Investment, handmaiden of tradeForeign investment has been a driver ofintegration, increased trade in manufactures,and vertical specialization. As tariff barriershave come down in manufactures, market-seeking, horizontal FDI that once led the way inthe import-substitution process has faded in im-portance relative to efficiency-seeking, verticalFDI that looks to locate segments of productionin the lowest-cost site. This form of investmentis associated with the rise in production chainsand trade in components and parts.
FDI has increased as a share of GDP in all re-gions. This trend abated somewhat since theEast Asia crisis in 1997–98 and the global re-cession of 2001–02, but FDI growth is likely toresume with the recovery of the global econ-omy in 2004. East Asia and Latin America—the largest markets—have had and haveretained by far the largest shares of FDIthroughout the period (figure 2.5).
In East Asia and Pacific, the increase in FDIsupported the pattern of segmentation and re-location of production processes within the re-gion. In the 1990s, a large part of the FDI intoLatin America was due to the privatizationprocess the region underwent during this pe-riod. There is broad correspondence betweenFDI trends by region and the share of parts andcomponents intermediates in regional exports.
Technology transfer from developed to de-veloping countries is linked to trade, especiallythrough trade in manufactures and intermedi-ates, and also through foreign direct invest-ment.16 The better economic performance ofEast Asia and Pacific can be seen as resultingfrom the emergence of a “virtuous circle” orsynergy between increased specialization inproduction, increased trade in intermediates,increased foreign investment, increased factorproductivity, and increased growth. Thisregion started earlier and appears more suc-cessful than other regions in achieving and sus-taining this virtuous circle.
Preferential Trade and Regional Outcomes
Many historical factors, not just preferen-tial trading arrangements, contributed
to these trends. In the next chapter we providea more detailed analysis of the impact of RTAson trade. Here we simply highlight that the na-ture of RTAs and the context in which theyhave been applied have varied enormouslyacross regions and that regional agreementsoften follow, rather than determine, changes inregional trade patterns. This suggests that pref-erential trade agreements are just one of manyfactors affecting trade outcomes and that whenimplemented in a highly restrictive economicenvironment, they are usually inconsequential.
History shapes trading patternsDiffering regional performances in trade andgrowth have roots that go deeper than justboundaries on a map. Trade patterns—whotrades with whom—have grown out of longpolitical and economic histories that precededthe trends evident in the last two decades. Theclusters of trading partners often bear little re-lationship to arbitrary definitions of regions(see Anderson and Blackhurst 1993, for an ear-lier analysis). Major trading blocs—that is,those countries that trade more with each otherthan with those outside their group—emergefrom a cluster analysis. These blocs are not de-fined as traditional geographic political re-gions, but rather by statistical patterns in tradeflows over decades.
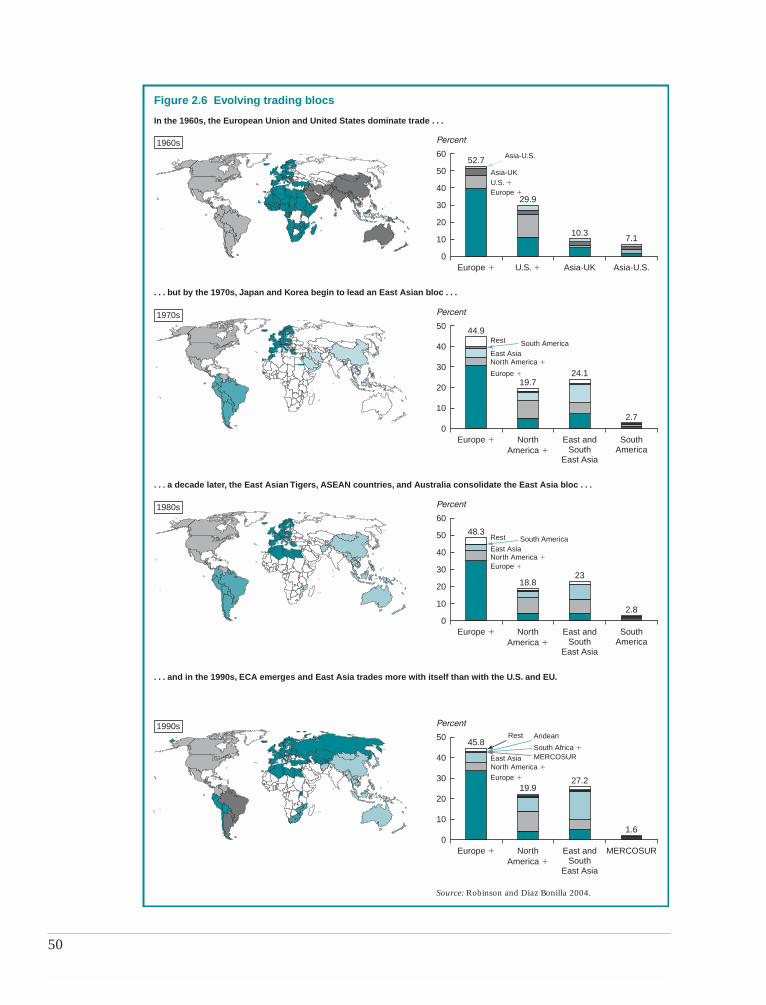
The bipolar world of the 1960sComing out of the postwar period, the struc-ture of world trade by the 1960s reflected abipolar world, in which Europe and theUnited States had effectively formed blocswith some of their close neighbors, formercolonies, and/or cold war partners; and withhub-and-spoke links to most of the developingcountries. The two leading world trade blocseffectively accounted for 80 percent of globaltrade (figure 2.6). The European bloc was
50
In the 1960s, the European Union and United States dominate trade . . .
. . . but by the 1970s, Japan and Korea begin to lead an East Asian bloc . . .
. . . a decade later, the East Asian Tigers, ASEAN countries, and Australia consolidate the East Asia bloc . . .
. . . and in the 1990s, ECA emerges and East Asia trades more with itself than with the U.S. and EU.
Figure 2.6 Evolving trading blocs
Europe �
Percent
U.S. � Asia-U.S.Asia-UK
52.7
29.9
7.110.3
44.9
19.7
2.7
24.1
48.3
18.8
2.8
23
45.8
19.9
1.6
27.2
0
30
20
10
40
50
60
Europe �
Percent
NorthAmerica �
SouthAmerica
East andSouth
East Asia
0
20
10
30
40
50
Europe �
Percent
NorthAmerica �
MERCOSUREast andSouth
East Asia
0
20
10
30
40
50
Europe �
Percent
NorthAmerica �
SouthAmerica
East andSouth
East Asia
0
20
10
30
40
60
50
Source: Robinson and Diaz Bonilla 2004.
Asia-U.S.
Rest
Rest
1960s
1970s
1980s
1990s
Europe �U.S. �Asia-UK
Europe �
North America �East Asia
South America
Rest
Europe �North America �East Asia
South America
Europe �North America �
MERCOSURSouth Africa �
Andean
East Asia
R E G I O N A L T R A D E A N D P R E F E R E N T I A L T R A D I N G A G R E E M E N T S
51
closely linked with countries in Africa and for-mer colonies. The United States was closelylinked to Latin America.17 Britain still re-tained leadership in a small Asian cluster con-sisting of former colonies, China, and the restof the Middle East, much as the United Statesled a cluster of countries closely linked to thepost-WWII political order in the Pacific—Indonesia, Japan, Korea, and Taiwan. The de-pendent developing countries traded muchmore with Europe or the United States, andnot as much among themselves.
The realignment and the emergence of East Asia in the 1970s and 1980sIn the 1970s and the 1980s, a realignment ofworld trade began. The European and U.S.blocs fragmented in the 1970s, and their dom-inance dissipated to 65 percent of global trade.The East and Southeast Asian countries left theEuropean bloc and effectively formed a newbloc (East Asia).18 This bloc consolidated inthe 1980s, increasing the share of within-bloctrade and expanded membership to includeAustralia and New Zealand. Its export shareshifted toward the United States (36.2 percentin the 1980s compared to 26.4 percent in the1970s). It also represented a growing share oftotal world trade—23 percent in the 1980scompared to 16 percent in the 1970s.
Consolidation and diversification in the 1990sBy the 1990s, earlier trends blossomed into atri-polar world. One new element was thebreakup of the Soviet Union and Moscow’scentral management of trade in EasternEurope. Trading patterns began gravitatingtoward the EU. A second new element wasthe emergence of a new grouping: Argentina,Brazil, Paraguay, and Uruguay (i.e., MERCO-SUR).19 Finally, detailed analysis indicates anascent bloc forming around South Africa,including the SACU countries.
These global trading patterns are revealing:First, today’s tri-polar world of global com-merce does not signify that the world is evolv-ing into three disparate, autarchic trading
blocs. To the contrary, trade among these blocsis intensifying, becoming more diversified, andlinked with a web of business ties acrossoceans that bind the world market together.Second, in the 1990s, the emergence of newpoles of commerce—MERCOSUR and SouthAfrica—indicates that the process of segmenta-tion and new bloc formation in world trade isstill evolving. Third, it is clear that many of theemerging preferential arrangements have deeproots in historical trading patterns, but thatsome of the more recent bilateral FTAs aregoing beyond these historical patterns.
RTAs in different regions have different impactsPatterns of regional integration tend to confirmthe view that usually trade has preceded tradeagreements. For East Asia, integration with theglobal economy was a strong impetus for re-gional integration. Exports to the world pro-duced demand for imports from neighboringcountries. As Korea matured and Chinaopened, internal regional growth assumed itsown dynamic. As a share of GDP, intra-regionaltrade in 2002 was 26.5 percent, twice as high asin the next highest region, yet regional tradepreferences were very modest at best.
In fact, regional preferential tradingarrangements followed rather than precededthis regional integration. The ASEAN FreeTrade Area (AFTA), established in 1992, ac-celerated these tendencies and contributed toSoutheast Asia’s integration, but much of thetariff reduction has accompanied rather thanpreceded these patterns of regional integra-tion. However, ASEAN leaders accepted inthe Bali Declaration the need to pursue deeperintegration and to create a single market toenhance the competitiveness of the region.The importance of preferential trade in the re-gion was dramatically increased by the sign-ing of a FTA between ASEAN countries andChina.
Regional arrangements were critical for thesuccessful integration of Eastern Europe intothe world economy, but have not been assuccessful in the CIS countries. With the
assistance of the EU in its Europe Agreementsand with the aspiration of WTO membership,the Eastern European countries have movedswiftly toward integration. The CIS has beenburdened with incomplete reforms, a poor in-vestment climate, and a plethora of tradingarrangements that have been implementedonly partially. The combination has weigheddown the subregion’s performance.
In Latin America, the intra-regional shareof exports in GDP in 2002 remains only one-fourth of East Asia’s share. Since the 1960s,with the formation of the Latin America FreeTrade Area (LAFTA), the region has struggledto expand trade. This proved futile as long asimport substitution policies were in place andstate enterprises were used as instruments ofindustrial policy. Early attempts in CentralAmerica and the Andean countries failed be-cause of the inherent difficulty in managingpotential trade diversion and location of in-dustries within the regions behind high exter-nal protection barriers.20
This situation changed with the wave ofunilateral reforms in the 1985–95 period.Mexico’s reforms paved the way for the latercreation of NAFTA in 1994, and reforms inBrazil and Argentina led to the creation ofMERCOSUR in the same year. Similarly, theCentral American countries, with a second go,managed to put in place a successful commonmarket in the 1990s. As a result, intraregionalregional trade has proceeded pari pasu withgrowth in the external markets.
In the Middle East, intra-regional trade hasfailed to gain dynamism. Because countriesbegin with broadly similar production andexport structures, the scope for using regionaltrade to establish patterns of specializationand diversification in manufacturing produc-tion is limited. Intra-regional trade cannot bea substitute for extra-regional trade.
Several countries signed bilateral tradeagreements with the EU as part of the Euro-Mediterranean agreements. Jordan andMorocco also signed agreements with theUnited States. All countries in the region
entered into the Pan-Arab Free Trade Agree-ment and most participated in the sub-re-gional customs union, the Gulf CooperationCouncil. Even so, these agreements have notbeen sufficient to overcome the effects of highborder barriers and restrictions on services.The Euro-Med agreements with the EU havefallen short in their aspirations because of re-strictions on trade in agriculture, services, andlabor; lack of harmonization of standards;and stringent rules of origin.21
Regional agreements in South Asia, as withLatin America in the 1960s and 1970s, floun-dered on the shoals of high protection. The1993 South Asia Preferential Trade Agreement(SAPTA) was stillborn, given continuing highlevels of protection, a lack of meaningful con-cessions, domestic political problems, hostilitybetween India and Pakistan, India’s ban onimports of all consumer goods (from SAPTAcountries until 1998 and from the rest of theworld until 2001), and India’s control overmajor primary goods (Baysan 2004).
Recently, however, unilateral trade reformsin India and Pakistan, political rapprochement,as well as concerns about rising preferentialtariff arrangements in other parts of the world,led to the formation of the SAFTA Agreementin January 2004 (Newfarmer 2004).
In Sub-Saharan Africa, regional tradeagreements are common and reflect an aspi-ration to overcome the limits that small sov-ereign states impose. These include SACU—one of the oldest customs unions in theworld—CEMAC, COMESA, ECOWAS, andthe East African Community. Although aver-age applied MFN tariffs were cut by half be-tween the 1990s and 2003, non-border barri-ers restrict internal trade. The recent regionaltrade agreements have had more impact onoutward-looking MFN trade liberalization,and thus on external trade, than on intra-regional trade. The economic impact of theseagreements appears to have been small, espe-cially compared to pre-independence arrange-ments that essentially validated existing eco-nomic links (SACU, the West African
G L O B A L E C O N O M I C P R O S P E C T S 2 0 0 5
52
R E G I O N A L T R A D E A N D P R E F E R E N T I A L T R A D I N G A G R E E M E N T S
53
Economic and Monetary Union, andCEMAC). The EPAs under negotiation withthe EU may reinforce this outward-lookingpattern of trade integration, but the hope isthat they will also aid Africa’s own regionalintegration if they succeed in fostering eco-nomic reform and performance.22
The situation is different for agricultureand food products. Here margins of prefer-ence are more substantial in all regions exceptSouth Asia. The average margin of preferencein the high-income region is similar to that inEast Asia, Eastern Europe, and Latin America.Again, preferences are greatest in those re-gions showing the lowest degree of regionalintegration—the Middle East, and Sub-Saharan Africa.
Trade preferences have had very little im-pact on the high levels of intra-regional tradein manufactures in East Asia and EasternEurope. Regions that offer substantial tradepreferences behind high external barriers havenot fared well in stimulating the growth ofintra-regional trade.
Conclusion
Developing countries have increased theirshare of global trade as multilateral trade
negotiations have led to sustained reductionsin border protection for manufactured prod-ucts. At the same time, and for a variety of rea-sons, the preferential trade agreements haveproliferated. While the number of preferentialagreements has increased rapidly, their tradecoverage is substantially less than their officialspan of influence. Because many tariffs havecome down close to zero, rules of origin re-strict preferential access, and many productswithin agreements are excluded. Nonetheless,RTAs are leading to a more complex tradingsystem and inefficiencies in customs adminis-tration; high tariffs in certain regions still risksignificant trade diversion.
Notable differences are emerging betweenNorth-South bilateral agreements and South-South arrangements. North-South agreements
are considerably more ambitious in contentand coverage than South-South arrangementsand reach deep behind the border to includeservices, protection of investment rules, andintellectual property rights.
In general, the wave of preferential tradingarrangements followed—rather than preceded—an intensification of regional trade. Regionswith the lowest external (MFN) border barri-ers ironically have developed the deepestintra-regional links and have been best posi-tioned to diversify and exploit the emergenceof global production chains in the manufac-turing sector. East Asia is the starkest exam-ple, but Eastern Europe, in the wake of thedissolution of the Soviet Union, and LatinAmerica, with the end of import-substitutionindustrialization, are not far behind.
What are the economic consequences ofthese arrangements? That is the subject of thenext three chapters.
Notes1. The recent accession of 10 new members to the
European Union reduced the total number of RTAs inforce from 285 to 229.
2. In fact there are only 12 countries that are notrecorded as being party to a RTA, and many of theseare small islands and principalities. The 12 are Ameri-can Samoa, Bermuda, Channel Islands, Guam, Isle ofMan, Monaco, Mongolia, N. Mariana Islands, Palau,Puerto Rico, Timor-Leste, and the Virgin Islands.
3. We are indebted to Gaspar Fontini of the Euro-pean Commission’s Directorate General for Trade forthis formulation.
4. The U.S. Trade Representative is required to of-ficially notify the U.S. Congress of its intent to negoti-ate FTAs.
5. See Weintraub (2004) and Schott (2004) for amore detailed discussion.
6. In the course of this discussion, the EU is treatedas a single entity. For example, an EU-Mexico agree-ment is classified as bilateral.
7. The provision for regional cumulation in therules of origin, particularly full cumulation, will tendto offset the hub-and-spoke system. See Brenton andImagawa (2004). The EU, following substantial criti-cism of the hub-and-spoke system that emerged inEurope in the late 1990s, moved to create pan-European cumulation, although in terms of the morelimited partial cumulation.

8. See Grether and Olarreaga (1999), who includeGSP preferences but a smaller sample of countries.
9. In other words, 88 percent of intra-regionaltrade takes place among RTA partners.
10. This section benefited from the World Bank’sregional chief economists at a workshop titled Region-alism, Trade and Development, May 5, 2004. SadiqAhmed, Harry Broadman, Alan Gelb, Homi Kharas,Mustafa Nabli, and Guillermo Perry made presenta-tions that became the basis of this discussion.
11. The announced reforms were to reduce “sup-plementary duties” that were, in legal terms, additionalto ad valorem tariffs; the economic effect is to reduceeffective tariffs.
12. Hummels, Ishii, and Yi (2001) define an indexof vertical specialization (VS). For direct effects forcountry k:
VSk � �uA
X
M
k
X�
where u is a 1 x n vector of 1’s, Am is the n x n im-ported coefficient matrix, X is an n x 1 vector of exports,n is the number of sectors, and Xk is the sum of exportsacross the n sectors. When indirect effects are added,
VSk��uAM[I�
XA
k
D]�1X�
the index becomes: , where I is the identity matrix andAD is the n x n domestic coefficient matrix. Typically,given data limitations, measures of vertical specializa-tion are imperfect. For example, a sector which pro-duces both for exports and domestic markets, which iscommon given the aggregation available for sectoraldata, is assumed to have the same production technol-ogy, particularly use of imported intermediates, forgoods sold in either market. Even with these limita-tions, the measures provide a good picture of thechanging role of trade in intermediates.
13. Winters (2004, 10–11) reviews the literatureon links between trade in intermediates and productiv-ity growth.
14. See Kehoe and Ruhl (2002). They present lim-ited empirical evidence and then suggest a theoreticalmodel that captures the phenomenon. Increased tradein new products is difficult to capture in standard mod-els of world trade, so such models will tend to over-state terms-of-trade effects from changes in trade.
15. See Hummels and Klenow (2002). 16. Winters (2004) surveys work on the links be-
tween trade, productivity, and growth in developingcountries. See also Nishimizu and Robinson (1984),and Esfahani (1991) who consider the links in semi-industrial countries. Schiff and Wang (2004) considerthe link between TFP growth and regional tradelinks. Keller (2002) considers the mechanismsinvolved.
17. The definition of “closely linked” is countriesthat have such large trade shares with their bloc part-ners, particularly the United States and Europe, thatadding them to the bloc increases the average within-bloc trade share.
18. Plus one region, “rest of Middle East and NorthAfrica” (MENA), which is closely linked to Europe, buthas significant trade with East and Southeast Asia.
19. The within-bloc trade share for MERCOSURof 23 percent is lower than its trade share with Eu-rope (27 percent), but given the increasing trend of itswithin-cluster trade share and the legal formation ofMERCOSUR in 1995, it makes sense to designate itas a bloc. Latin American countries fall into threegroups. One group is linked closely with North Amer-ica, including RB de Venezuela, Colombia, and rest ofCentral America. The MERCOSUR countries define asecond group, a trade bloc with diversified exports(a slightly higher share to the EU than to the UnitedStates). Finally, the third group is a heterogeneous col-lection of countries (Peru, Chile, and Other AndeanPact) with exports largely to the EU, partly to Eastand Southeast Asia, and with little trade amongthemselves.
20. IDB, Beyond Borders, 2002. 21. Chief Economist, MENA, 2004. 22. Chief Economist, Africa, 2004.
ReferencesAcemoglu, D., S. Johnson, and J. A. Robinson. 2001.
The Colonial Origins of Comparative Develop-ment: An Empirical Investigation. AmericanEconomic Review 91, no. 5: 1369–1401.
Anderson, Kym, and Richard Blackhurst, eds. 1993.Regional integration and the global trading sys-tem. New York: St. Martin’s Press.
Baldwin, R. 2003. Openness and Growth: What’s theEmpirical Relationship? National Bureau of Eco-nomic Research, Working Paper no. w9578.
Baldwin, R., and A. Venables. 1995. Regional Eco-nomic Integration. In Handbook of InternationalEconomics, vol. 3, eds. Grossman and Rogoff,Amsterdam: North Holland Press.
Baysan, T. 2004. South Asia: Lessons and the WayForward. Mimeo, World Bank, Washington, DC.
Bhagwati, J., and A. Panagariya, eds. 1996. TheEconomics of Preferential Trade Agreements.Washington, DC: American Enterprise InstitutePress.
Brenton, Paul, and Hiroshi Imagawa. 2004. Rules ofOrigin, Trade, and Customs. In Customs Mod-ernization Handbook, Conference edition, eds.Luc De Wulf and Jose Sokol. Washington, DC:World Bank.
G L O B A L E C O N O M I C P R O S P E C T S 2 0 0 5
54
Burfisher, Mary, Sherman Robinson, and KarenThierfelder. 2004. Forthcoming. Regionalism:Old and New, Theory and Practice. In Agricul-tural Policy Reform and the WTO: Where AreWe Heading? Eds. G. Anania, M. E. Bohman,C. A. Carter, and A. F. McCalla. Cheltenham,UK & Northampton MA, US: Edward Elgar.
Destler, I. M., and Peter J. Balint. 1999. The New Poli-tics of American Trade: Trade, Labor, and theEnvironment. Washington, DC: Institute for In-ternational Economics.
Esfahani, H. S. 1991. Exports, Imports, and EconomicGrowth in Semi-Industrialized Countries. Journalof Development Economics 35.
Falkenberg, Karl F. 2004. EPAs and Doha Develop-ment Agenda—Parallelism or CrossroadsTrade Negotiations Insights 3, (July) (4).www.ictsd.org.
Frankel, J. A., E. Stein, and S-J. Wei. 1996. RegionalTrading Arrangements: Natural or Supernatural?American Economic Review 86, (2): 52–56.
Grether, Jean-Marie, and Marcelo Olarreaga. 1999.Preferential and Nonpreferential Trade Flows inWorld Trade. In Trade rules in the making:Challenges in regional and multilateral negotia-tions, 159–79. Washington, DC: BrookingsInstitution Press and Organization of AmericanStates.
Hinkle L., and M. Schiff. 2004. Economic PartnershipAgreements between Subsaharan Africa andthe EU: A Development Perspective on the TradeComponents, Africa Region Working Paper(draft). February, World Bank, Washington, DC.
Hummels, David, Jun Ishi, and Kei-Mu Yi. 2001.The nature and growth of vertical specializationin world trade. Journal of InternationalEconomics (Netherlands) 54 (June) (1): 75–96.
Hummels, David, and Peter J. Klenow. 2002. Thevariety and quality of a nation’s trade. NationalBureau of Economic Research, Working PaperSeries 8712, January.
IDB. (Inter-American Development Bank). 2002. Be-yond Borders: The New Regionalism in LatinAmerica. Economic and Social Progress in LatinAmerica. Inter-American Development Bank,Washington, DC.
Kehoe, Timothy J., and Kim J. Ruhl. 2002. HowImportant is the New Goods Margin in Interna-tional Trade? University of Minnesota.
Keller, Wolfgang. 2002. Trade and the Transmission ofTechnology. Journal of Economic Growth 7, (1):5–24.
Kiener, Christophe. 2004. Economic PartnershipAgreements: A New Approach to ACP-EU Eco-nomic and Trade Cooperation. Paper presented to
the EU-World Bank Retreat on Preferential TradeAgreements, July.
Mansfield, Edward D., and Jon C. Pevehouse. 2000.Trade Blocs, Trade Flows, and InternationalConflict. International Organization 54 (Au-tumn) (4): 775–808.
Martin, W., and F. Ng. 2004. Sources of Tariff Reduc-tions. Background paper.
Melo, J. de, and A. Panagariya, eds. 1993. NewDimensions in Regional Integration. Cambridge:Cambridge University Press.
Newfarmer, R. 2004. SAFTA: Promise and Pitfalls ofPreferential Trade Arrangements. Backgroundpaper for Global Economic Prospects 2005, May,World Bank, Washington, DC.
Nishimizu, Mieko, and Sherman Robinson. 1984.Trade Policies and Productivity Change in Semi-Industrialized Countries. Journal of DevelopmentEconomics 16, (1–2): 177–206.
OECD. 2003. Regionalism and the MultilateralSystem. OECD, Paris.
Robinson S., and C. Diaz-Bonilla. 2004. The evolutionof global trading blocs in the past forty years:Who trades what with whom, and why. Back-ground paper.
Robinson, S., and K. Thierfelder. 2002. Trade liberal-ization and regional integration: the search forlarge numbers. Australian Journal of Agriculturaland Resource Economics. 46, (4) 585–604.
Sapir, Andre. 1998. The Political Economy of EC Re-gionalism. European Economic Review. 42,(3–5): 717–32.
Schiff, M., and L. A. Winters. 2003. Regional Integra-tion and Development. Washington, DC: WorldBank.
Schiff, M., and Y. Wang. 2004. North-South Technol-ogy Diffusion, Regional Integration, and theDynamics of the ‘Natural Trading Partners’Hypothesis. World Bank, June, Washington, DC.
Schott, Jeffrey J. 2004. Free Trade Agreements: Boonor Bane of the World Trading System. In FreeTrade Agreements: US Strategies and Priorities,ed. J.J. Schott. Washington: Institute for Interna-tional Economics; Song and Xu. 2000.
Ullrich, Heidi. 2004. Comparing EU Free TradeAgreements–Services. European Centre for Devel-opment Policy Management. July.
USTR. 2004. Free Trade with Chile, Trade Facts.www.USTR.gov.
Weintraub, Sidney. 2004. Lessons from the Chile andSingapore Free Trade Agreements. In Free TradeAgreements: US Strategies and Priorities, ed. J. J.Schott. Washington: Institute for InternationalEconomics.
R E G I O N A L T R A D E A N D P R E F E R E N T I A L T R A D I N G A G R E E M E N T S
55
Winters, L. Alan. 2004. Trade Liberalization andEconomic Performance: An Overview. The Eco-nomic Journal, 114 (February): F4–F21.
Winters, L. Alan, Neil McCulloch, and AndrewMcKay. 2004. Trade Liberalization and Poverty:The Evidence So Far. Journal of EconomicLiterature, XLII (March): 72–115.
Wonnacott, Paul. 1996. Beyond NAFTA—The Designof a Free Trade Agreement of the Americas. InThe economics of preferential trade agreements,79–107. College Park: University of Maryland,Center for International Economics; Washington,DC: AEI Press.
World Bank. 1999. Trade, Global Policy, and theEnvironment. World Bank Discussion Paper No.402. Washington, DC: World Bank.
World Bank. 2003. Trade, Investment, and Develop-ment in the Middle East and North Africa: En-gaging the World. Washington DC: World Bank.
. 2004. East Asia Integrates: A Trade PolicyAgenda for Shared Growth. East Asia and PacificWorld Bank Region, World Bank, Washington,DC.
WTO (World Trade Organization). 1999. Trade andEnvironment. Geneva: WTO.
G L O B A L E C O N O M I C P R O S P E C T S 2 0 0 5
56