Embed Size (px)
Citation preview
Registered Nurses Education in Canada Statistics
2013-2014
Registered Nurse Workforce, Canadian Production: Potential New Supply
November 2015
casn.ca
ST
AT
IST
ICS

This report has been prepared by CASN
to provide information on a particular topic or topics.
The views and opinions expressed in this report do not necessarily reflect the views of the
CASN board of directors.
All rights reserved. No part of this document may be reproduced, stored in a retrieval system,
or transcribed, in any form or by any means, electronic, mechanical, photocopying, recording, or
posted on any web, ftp or similar site, or otherwise, without written permission of the publisher.
© Canadian Association of Schools of Nursing
Canadian Association of Schools of Nursing
1145 Hunt Club Road, Suite 450
Ottawa, ON K1V 0Y3
Tel.: 613-235-3150
Fax: 613-235-4476
Website: www.casn.ca
November 2015

Nursing Education Statistics 2013-2014
Message from the Executive Director
The Canadian Association of Schools of Nursing (CASN) is pleased to present Registered
Nurses Education in Canada Statistics, 2013-2014 — Registered Nurse Workforce, Canadian
Production: Potential New Supply.
This annual report supports health human resources planning in both the nursing service and
nursing education sectors. It represents the fruit of a strong partnership among national and
provincial/territorial bodies and effective collaborative relationships with multiple
stakeholders.
The report provides data and statistical analysis of:
the number of pre-licensure graduates eligible to apply for initial licensure/registration
and enter the registered nurse (RN) workforce;
the number of RNs obtaining graduate qualifications;
the number of nurse practitioner (NP) graduates;
innovations in nursing education program access and delivery;
the composition of faculty delivering nursing education; and
faculty retention and recruitment.
We extend our sincere thanks to the contributing faculty and staff of the schools of nursing for their effort, commitment and collaboration. Without their annual support, this collection could not exist. We would also like to thank CASN members and the College of Nurses of Ontario who contributed to question testing and the Ordre des infirmières et infirmiers du Québec who provide additional data for Québec.
We look forward to hearing your comments about the report.
Yours sincerely,
Cynthia Baker, RN, PhD
Executive Director
Canadian Association of Schools of Nursing
2
Nursing Education Statistics 2013-2014
Contents
INTRODUCTION ................................................................................................................................................. 3
2013-2014 KEY PROGRAM FINDINGS ............................................................................................................. 5
2014 KEY RN FACULTY FINDINGS ............................................................................................................... 15
SUMMARY OF KEY PROGRAM AND RN FACULTY FINDINGS .............................................................. 20
2013-2014 RESULTS .......................................................................................................................................... 21
METHODOLOGICAL NOTES — SURVEY TABLES ..................................................................................... 53
APPENDIX A: NATIONAL STUDENT AND FACULTY SURVEY OF CANADIAN SCHOOLS OF NURSING
2013-2014 SURVEY METHODOLOGY ........................................................................................................... 56
ENDNOTES ....................................................................................................................................................... 63
3 Nursing Education Statistics 2013-2014
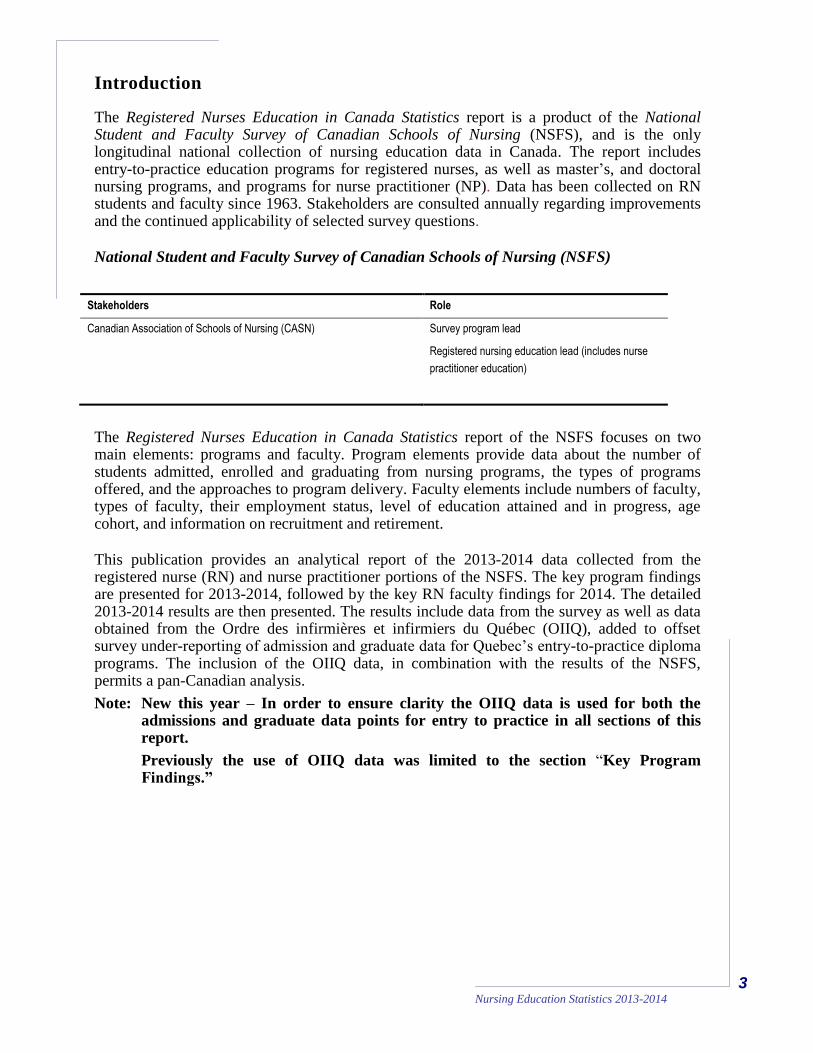
Introduction
The Registered Nurses Education in Canada Statistics report is a product of the National Student and Faculty Survey of Canadian Schools of Nursing (NSFS), and is the only longitudinal national collection of nursing education data in Canada. The report includes entry-to-practice education programs for registered nurses, as well as master’s, and doctoral nursing programs, and programs for nurse practitioner (NP). Data has been collected on RN students and faculty since 1963. Stakeholders are consulted annually regarding improvements and the continued applicability of selected survey questions.
National Student and Faculty Survey of Canadian Schools of Nursing (NSFS)
Stakeholders Role
Canadian Association of Schools of Nursing (CASN) Survey program lead
Registered nursing education lead (includes nurse
practitioner education)
The Registered Nurses Education in Canada Statistics report of the NSFS focuses on two main elements: programs and faculty. Program elements provide data about the number of students admitted, enrolled and graduating from nursing programs, the types of programs offered, and the approaches to program delivery. Faculty elements include numbers of faculty, types of faculty, their employment status, level of education attained and in progress, age cohort, and information on recruitment and retirement.
This publication provides an analytical report of the 2013-2014 data collected from the registered nurse (RN) and nurse practitioner portions of the NSFS. The key program findings are presented for 2013-2014, followed by the key RN faculty findings for 2014. The detailed 2013-2014 results are then presented. The results include data from the survey as well as data obtained from the Ordre des infirmières et infirmiers du Québec (OIIQ), added to offset survey under-reporting of admission and graduate data for Quebec’s entry-to-practice diploma programs. The inclusion of the OIIQ data, in combination with the results of the NSFS, permits a pan-Canadian analysis.
Note: New this year – In order to ensure clarity the OIIQ data is used for both the admissions and graduate data points for entry to practice in all sections of this report.
Previously the use of OIIQ data was limited to the section “Key Program Findings.”
4
Nursing Education Statistics 2013-2014
Survey Distribution and Response
The 2013-2014 NSFS survey was issued to all 134 schools of nursing in Canada offering entry-to-practice (ETP) pre-licensure education entitling successful graduates to apply for initial licensure/registration as an RN, and/or post-RN baccalaureate programs for nurses, NP, and/or graduate RN education.
Of the 134 schools, 114 schools completed the survey, including 88 of a possible 93 CASN members. Of the 114 schools, 41 were Cégeps. The overall survey response rate was 85.1%; the CASN member response rate was 94.6%. See the tables starting on page 22 for more detailed information about omitted or unusable data. On average, 72.0% of schools responded to the faculty questions.
Data Comparison Timeframes
Program inventory, admission and enrolment data were collected for the 2013-2014 academic year. Unless otherwise stated, increases or decreases noted in the report are in relation to 2012-2013 data.
Graduate data were collected for calendar year 2014. Unless otherwise stated, increases or decreased noted in the 2014 data are in relation to the 2013 survey data.
Faculty data were also collected for calendar year 2014. Unless otherwise stated, comparisons of faculty data with previous results are in relation to 2013 data.
Survey Methodology
See Appendix A for methodological information.
5 Nursing Education Statistics 2013-2014
2013-2014 Key Program Findings
This section of the report highlights key findings regarding education programs in
2013-2014. It reveals trends related to the numbers of new graduates being prepared to
enter the workforce as well as the modalities and educational level of the program they
are taking across the country.
Entry-to-Practice Programs
Entry-to-practice (ETP) programs entitle the successful graduate to apply for initial licensure/ registration as an RN.
114 schools offered an ETP program.
88 of the 114 schools (77.2%) offered ETP baccalaureate programs.
ETP baccalaureate programs were offered in every province and territory, except for the Yukon, where no registered nurse education programs exist.
41 colleges partnered with a university to deliver ETP baccalaureate programs; two colleges in British Columbia and one college in Alberta granted ETP baccalaureate degrees autonomously.
ETP Admissions
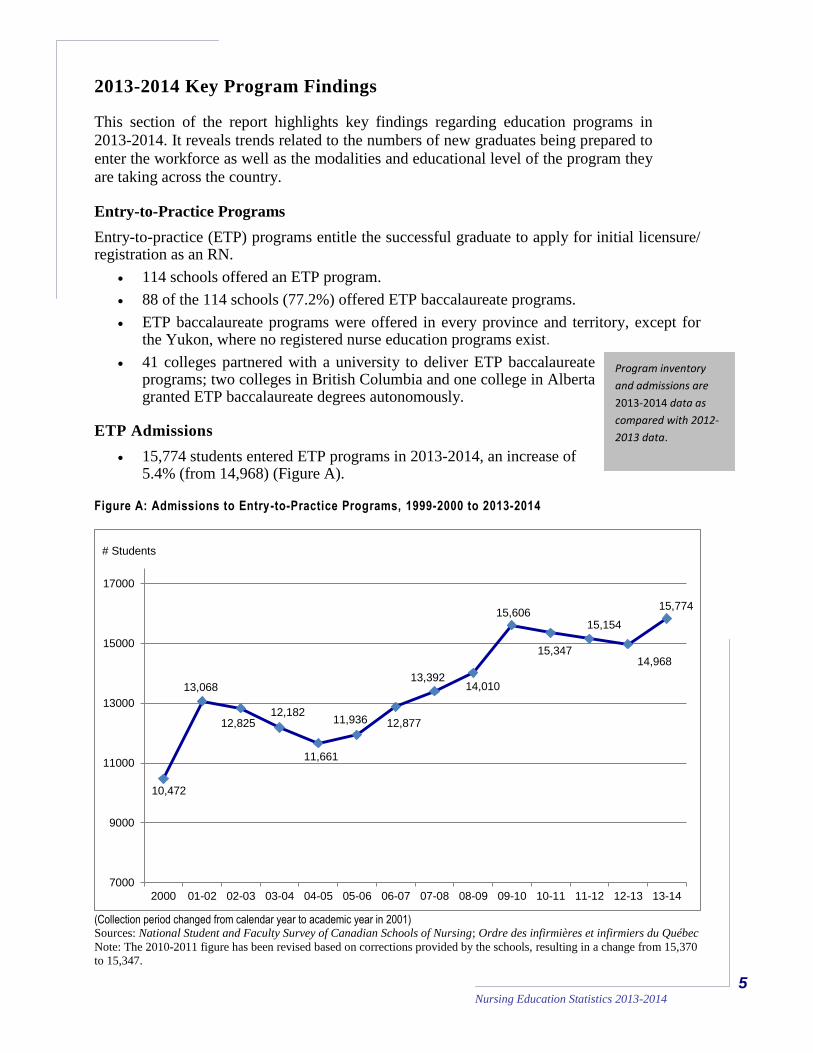
15,774 students entered ETP programs in 2013-2014, an increase of 5.4% (from 14,968) (Figure A).
Figure A: Admissions to Entry-to-Practice Programs, 1999-2000 to 2013-2014
(Collection period changed from calendar year to academic year in 2001) Sources: National Student and Faculty Survey of Canadian Schools of Nursing; Ordre des infirmières et infirmiers du Québec
Note: The 2010-2011 figure has been revised based on corrections provided by the schools, resulting in a change from 15,370
to 15,347.
10,472
13,068
12,825 12,182
11,661
11,936 12,877
13,392 14,010
15,606
15,347
15,154
14,968
15,774
7000
9000
11000
13000
15000
17000
2000 01-02 02-03 03-04 04-05 05-06 06-07 07-08 08-09 09-10 10-11 11-12 12-13 13-14
# Students
Program inventory
and admissions are
2013-2014 data as
compared with 2012-
2013 data.
6
Nursing Education Statistics 2013-2014
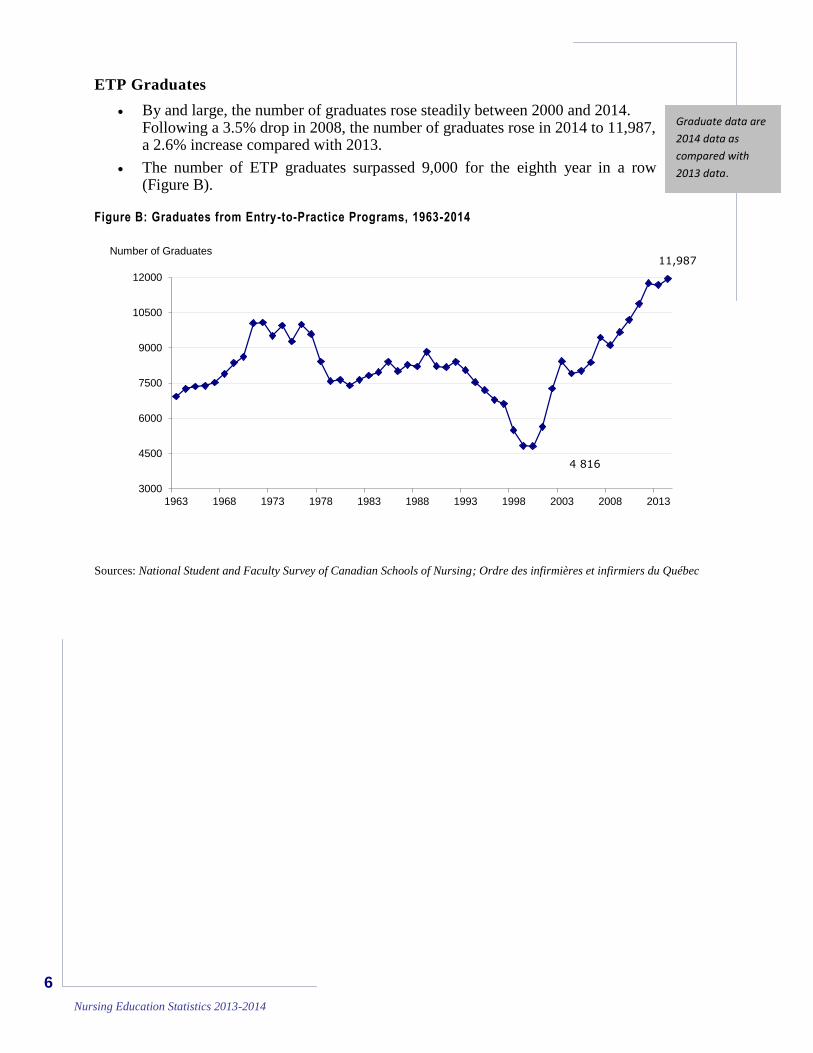
ETP Graduates
By and large, the number of graduates rose steadily between 2000 and 2014. Following a 3.5% drop in 2008, the number of graduates rose in 2014 to 11,987, a 2.6% increase compared with 2013.
The number of ETP graduates surpassed 9,000 for the eighth year in a row (Figure B).
Figure B: Graduates from Entry-to-Practice Programs, 1963-2014
Sources: National Student and Faculty Survey of Canadian Schools of Nursing; Ordre des infirmières et infirmiers du Québec
11,987
3000
4500
6000
7500
9000
10500
12000
1963 1968 1973 1978 1983 1988 1993 1998 2003 2008 2013
Number of Graduates
4 816
Graduate data are
2014 data as
compared with
2013 data.
7 Nursing Education Statistics 2013-2014
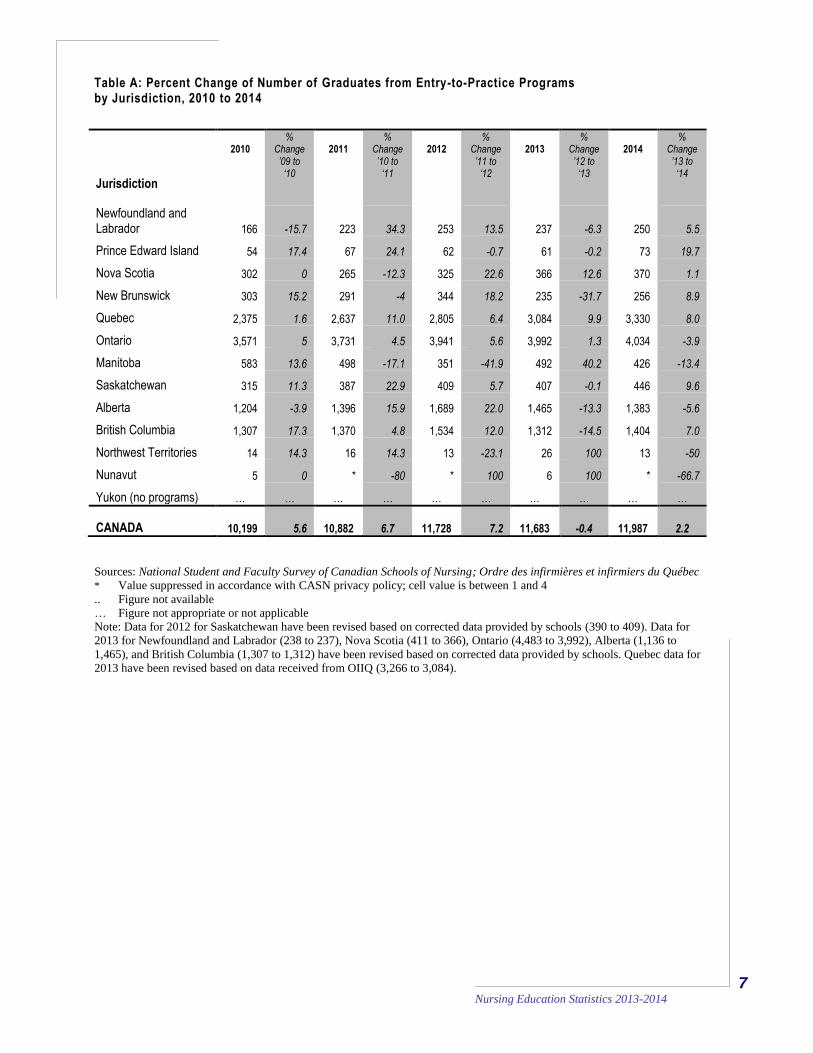
Table A: Percent Change of Number of Graduates from Entry-to-Practice Programs by Jurisdiction, 2010 to 2014
Sources: National Student and Faculty Survey of Canadian Schools of Nursing; Ordre des infirmières et infirmiers du Québec
* Value suppressed in accordance with CASN privacy policy; cell value is between 1 and 4
.. Figure not available
… Figure not appropriate or not applicable
Note: Data for 2012 for Saskatchewan have been revised based on corrected data provided by schools (390 to 409). Data for
2013 for Newfoundland and Labrador (238 to 237), Nova Scotia (411 to 366), Ontario (4,483 to 3,992), Alberta (1,136 to
1,465), and British Columbia (1,307 to 1,312) have been revised based on corrected data provided by schools. Quebec data for
2013 have been revised based on data received from OIIQ (3,266 to 3,084).
Jurisdiction
2010
% Change ’09 to
‘10
2011
% Change ’10 to
‘11
2012
% Change ’11 to
‘12
2013
% Change ’12 to
‘13
2014
% Change ’13 to
‘14
Newfoundland and Labrador 166 -15.7
223
34.3
253
13.5 237 -6.3 250 5.5
Prince Edward Island 54 17.4 67 24.1 62 -0.7 61 -0.2 73 19.7
Nova Scotia 302 0 265 -12.3 325 22.6 366 12.6 370 1.1
New Brunswick 303 15.2 291 -4 344 18.2 235 -31.7 256 8.9
Quebec 2,375 1.6 2,637 11.0 2,805 6.4 3,084 9.9 3,330 8.0
Ontario 3,571 5 3,731 4.5 3,941 5.6 3,992 1.3 4,034 -3.9
Manitoba 583 13.6 498 -17.1 351 -41.9 492 40.2 426 -13.4
Saskatchewan 315 11.3 387 22.9 409 5.7 407 -0.1 446 9.6
Alberta 1,204 -3.9 1,396 15.9 1,689 22.0 1,465 -13.3 1,383 -5.6
British Columbia 1,307 17.3 1,370 4.8 1,534 12.0 1,312 -14.5 1,404 7.0
Northwest Territories 14 14.3 16 14.3 13 -23.1 26 100 13 -50
Nunavut 5 0 * -80 * 100 6 100 * -66.7
Yukon (no programs) … … … … … … … … … …
CANADA 10,199 5.6 10,882
6.7
11,728
7.2 11,683 -0.4 11,987 2.2
8
Nursing Education Statistics 2013-2014
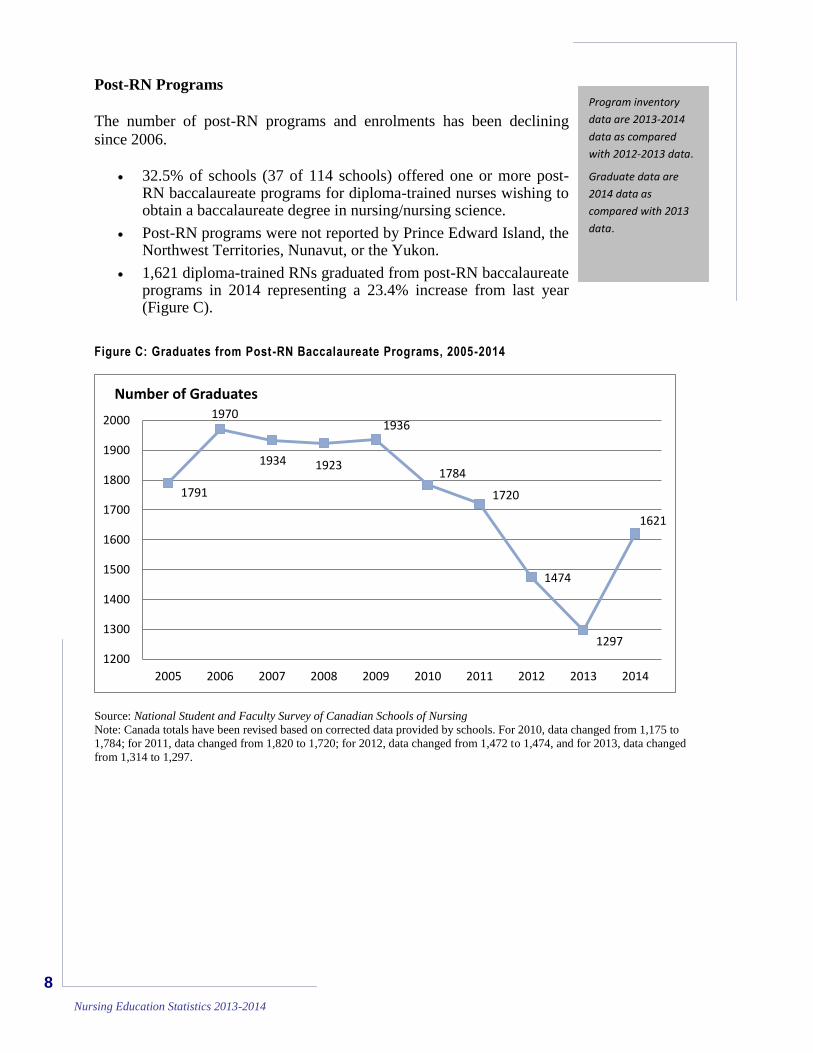
Post-RN Programs
The number of post-RN programs and enrolments has been declining
since 2006.
32.5% of schools (37 of 114 schools) offered one or more post-
RN baccalaureate programs for diploma-trained nurses wishing to obtain a baccalaureate degree in nursing/nursing science.
Post-RN programs were not reported by Prince Edward Island, the Northwest Territories, Nunavut, or the Yukon.
1,621 diploma-trained RNs graduated from post-RN baccalaureate programs in 2014 representing a 23.4% increase from last year (Figure C).
Figure C: Graduates from Post-RN Baccalaureate Programs, 2005-2014
Source: National Student and Faculty Survey of Canadian Schools of Nursing
Note: Canada totals have been revised based on corrected data provided by schools. For 2010, data changed from 1,175 to
1,784; for 2011, data changed from 1,820 to 1,720; for 2012, data changed from 1,472 to 1,474, and for 2013, data changed
from 1,314 to 1,297.
1791
1970
1934 1923
1936
1784
1720
1474
1297
1621
1200
1300
1400
1500
1600
1700
1800
1900
2000
2005 2006 2007 2008 2009 2010 2011 2012 2013 2014
Number of Graduates
Program inventory
data are 2013-2014
data as compared
with 2012-2013 data.
Graduate data are
2014 data as
compared with 2013
data.
9 Nursing Education Statistics 2013-2014
“Historically, recessions produce jumps in the enrolment of short‐course programs. Enrolment jumps are therefore likeliest in two‐year college programs and university graduate programs.” Usher, A., & Dunn, R. (2009).
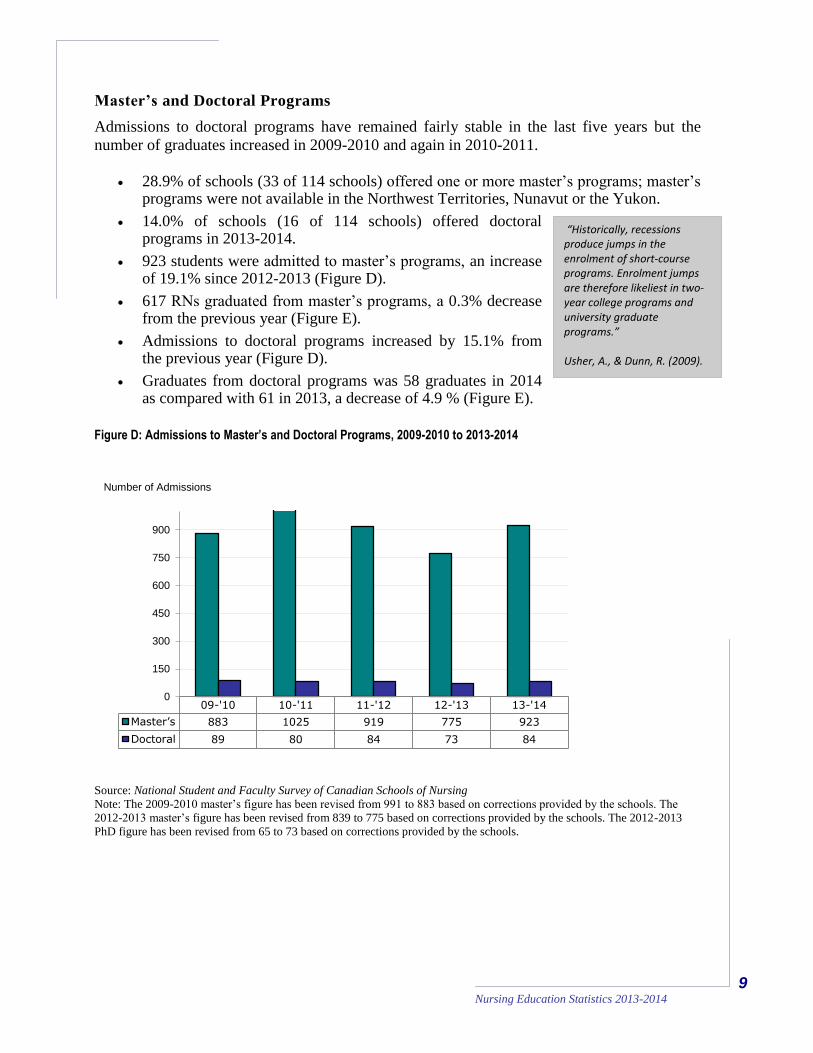
Master’s and Doctoral Programs
Admissions to doctoral programs have remained fairly stable in the last five years but the
number of graduates increased in 2009-2010 and again in 2010-2011.
28.9% of schools (33 of 114 schools) offered one or more master’s programs; master’s
programs were not available in the Northwest Territories, Nunavut or the Yukon.
14.0% of schools (16 of 114 schools) offered doctoral programs in 2013-2014.
923 students were admitted to master’s programs, an increase of 19.1% since 2012-2013 (Figure D).
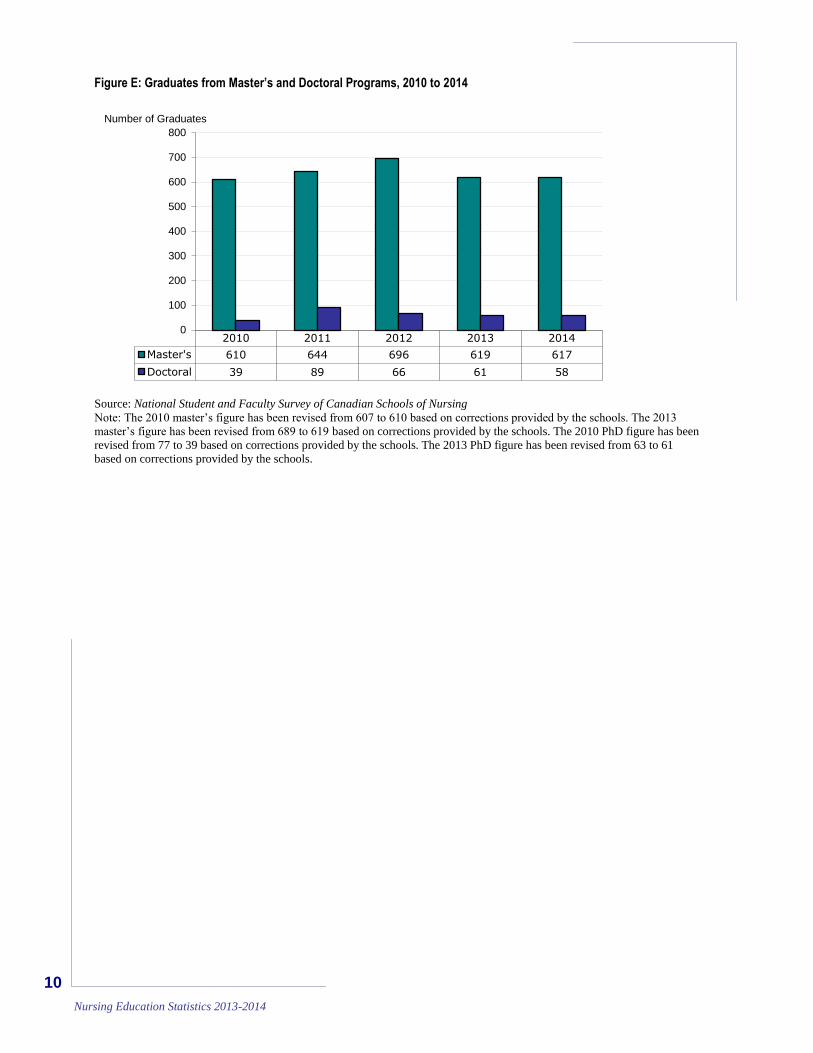
617 RNs graduated from master’s programs, a 0.3% decrease from the previous year (Figure E).
Admissions to doctoral programs increased by 15.1% from the previous year (Figure D).
Graduates from doctoral programs was 58 graduates in 2014 as compared with 61 in 2013, a decrease of 4.9 % (Figure E).
Figure D: Admissions to Master’s and Doctoral Programs, 2009-2010 to 2013-2014
Source: National Student and Faculty Survey of Canadian Schools of Nursing Note: The 2009-2010 master’s figure has been revised from 991 to 883 based on corrections provided by the schools. The
2012-2013 master’s figure has been revised from 839 to 775 based on corrections provided by the schools. The 2012-2013
PhD figure has been revised from 65 to 73 based on corrections provided by the schools.
09-'10 10-'11 11-'12 12-'13 13-'14
Master’s 883 1025 919 775 923
Doctoral 89 80 84 73 84
0
150
300
450
600
750
900
Number of Admissions
10
Nursing Education Statistics 2013-2014
Figure E: Graduates from Master’s and Doctoral Programs, 2010 to 2014
Source: National Student and Faculty Survey of Canadian Schools of Nursing
Note: The 2010 master’s figure has been revised from 607 to 610 based on corrections provided by the schools. The 2013
master’s figure has been revised from 689 to 619 based on corrections provided by the schools. The 2010 PhD figure has been
revised from 77 to 39 based on corrections provided by the schools. The 2013 PhD figure has been revised from 63 to 61
based on corrections provided by the schools.
2010 2011 2012 2013 2014
Master's 610 644 696 619 617
Doctoral 39 89 66 61 58
0
100
200
300
400
500
600
700
800
Number of Graduates
11 Nursing Education Statistics 2013-2014
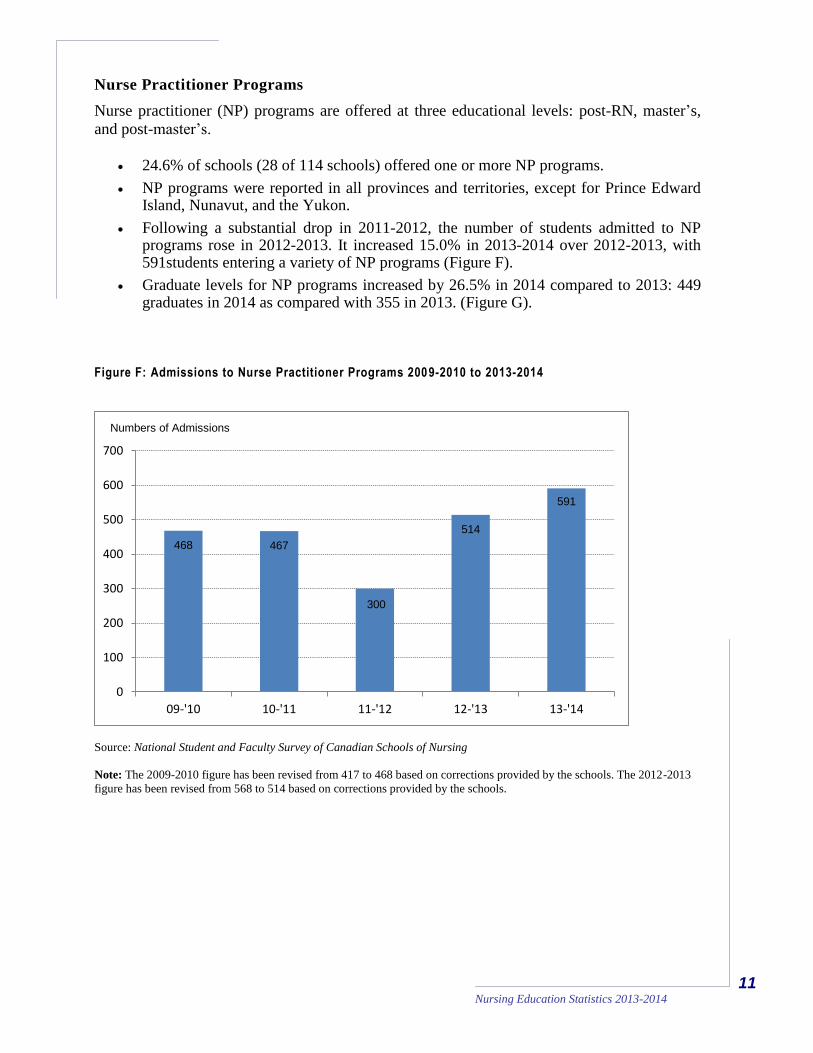
Nurse Practitioner Programs
Nurse practitioner (NP) programs are offered at three educational levels: post-RN, master’s,
and post-master’s.
24.6% of schools (28 of 114 schools) offered one or more NP programs.
NP programs were reported in all provinces and territories, except for Prince Edward Island, Nunavut, and the Yukon.
Following a substantial drop in 2011-2012, the number of students admitted to NP programs rose in 2012-2013. It increased 15.0% in 2013-2014 over 2012-2013, with 591students entering a variety of NP programs (Figure F).
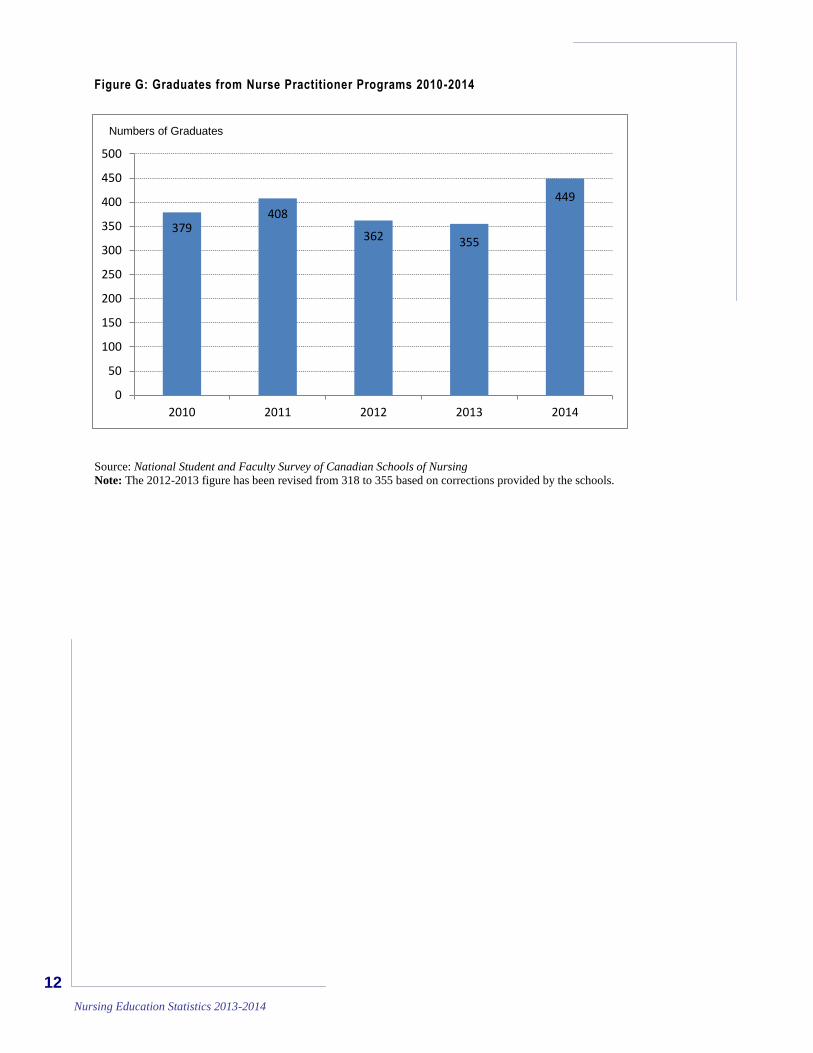
Graduate levels for NP programs increased by 26.5% in 2014 compared to 2013: 449 graduates in 2014 as compared with 355 in 2013. (Figure G).
Figure F: Admissions to Nurse Practitioner Programs 2009-2010 to 2013-2014
Source: National Student and Faculty Survey of Canadian Schools of Nursing
Note: The 2009-2010 figure has been revised from 417 to 468 based on corrections provided by the schools. The 2012-2013
figure has been revised from 568 to 514 based on corrections provided by the schools.
468 467
300
514
591
0
100
200
300
400
500
600
700
09-'10 10-'11 11-'12 12-'13 13-'14
Numbers of Admissions
12
Nursing Education Statistics 2013-2014
Figure G: Graduates from Nurse Practitioner Programs 2010-2014
Source: National Student and Faculty Survey of Canadian Schools of Nursing
Note: The 2012-2013 figure has been revised from 318 to 355 based on corrections provided by the schools.
379 408
362 355
449
0
50
100
150
200
250
300
350
400
450
500
2010 2011 2012 2013 2014
Numbers of Graduates
13 Nursing Education Statistics 2013-2014
Approaches to Program Delivery
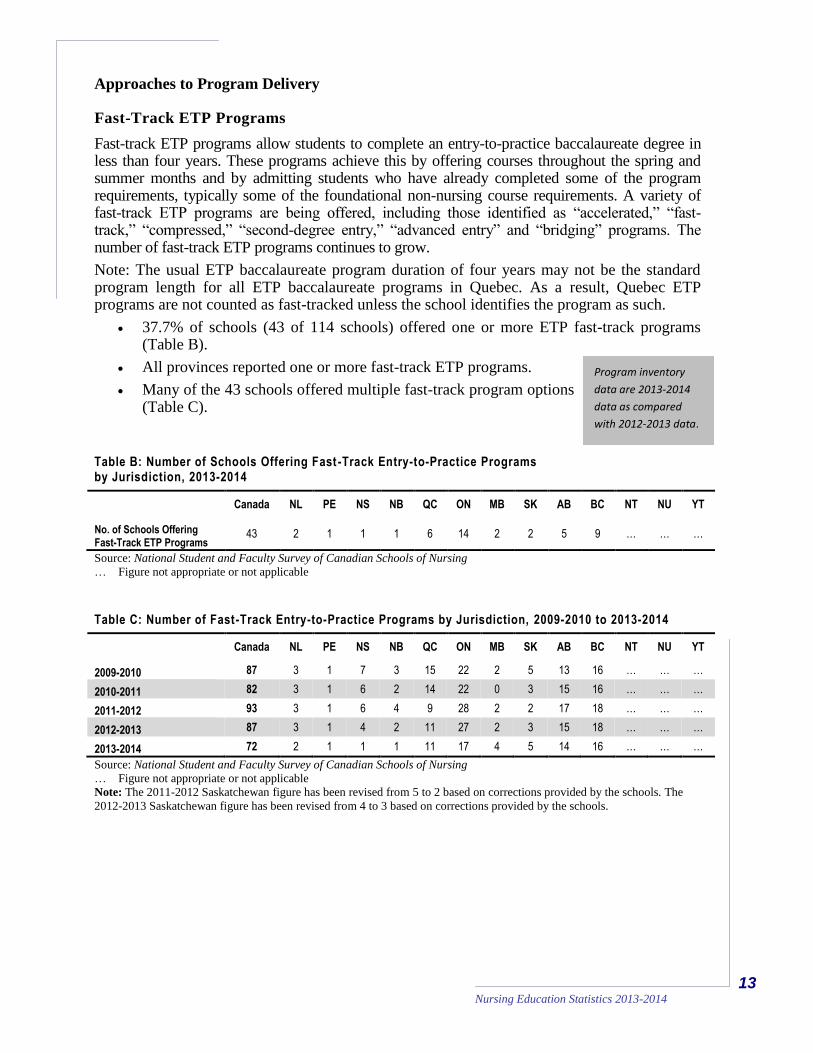
Fast-Track ETP Programs
Fast-track ETP programs allow students to complete an entry-to-practice baccalaureate degree in less than four years. These programs achieve this by offering courses throughout the spring and summer months and by admitting students who have already completed some of the program requirements, typically some of the foundational non-nursing course requirements. A variety of fast-track ETP programs are being offered, including those identified as “accelerated,” “fast-track,” “compressed,” “second-degree entry,” “advanced entry” and “bridging” programs. The number of fast-track ETP programs continues to grow.
Note: The usual ETP baccalaureate program duration of four years may not be the standard program length for all ETP baccalaureate programs in Quebec. As a result, Quebec ETP programs are not counted as fast-tracked unless the school identifies the program as such.
37.7% of schools (43 of 114 schools) offered one or more ETP fast-track programs (Table B).
All provinces reported one or more fast-track ETP programs.
Many of the 43 schools offered multiple fast-track program options (Table C).
Table B: Number of Schools Offering Fast -Track Entry-to-Practice Programs by Jurisdiction, 2013-2014
Canada NL PE NS NB QC ON MB SK AB BC NT NU YT
No. of Schools Offering Fast-Track ETP Programs
43 2 1 1 1 6 14 2 2 5 9 … … …
Source: National Student and Faculty Survey of Canadian Schools of Nursing
… Figure not appropriate or not applicable
Table C: Number of Fast-Track Entry-to-Practice Programs by Jurisdiction, 2009-2010 to 2013-2014
Canada NL PE NS NB QC ON MB SK AB BC NT NU YT
2009-2010 87 3 1 7 3 15 22 2 5 13 16 … … …
2010-2011 82 3 1 6 2 14 22 0 3 15 16 … … …
2011-2012 93 3 1 6 4 9 28 2 2 17 18 … … …
2012-2013 87 3 1 4 2 11 27 2 3 15 18 … … …
2013-2014 72 2 1 1 1 11 17 4 5 14 16 … … …
Source: National Student and Faculty Survey of Canadian Schools of Nursing
… Figure not appropriate or not applicable
Note: The 2011-2012 Saskatchewan figure has been revised from 5 to 2 based on corrections provided by the schools. The
2012-2013 Saskatchewan figure has been revised from 4 to 3 based on corrections provided by the schools.
Program inventory
data are 2013-2014
data as compared
with 2012-2013 data.
14
Nursing Education Statistics 2013-2014
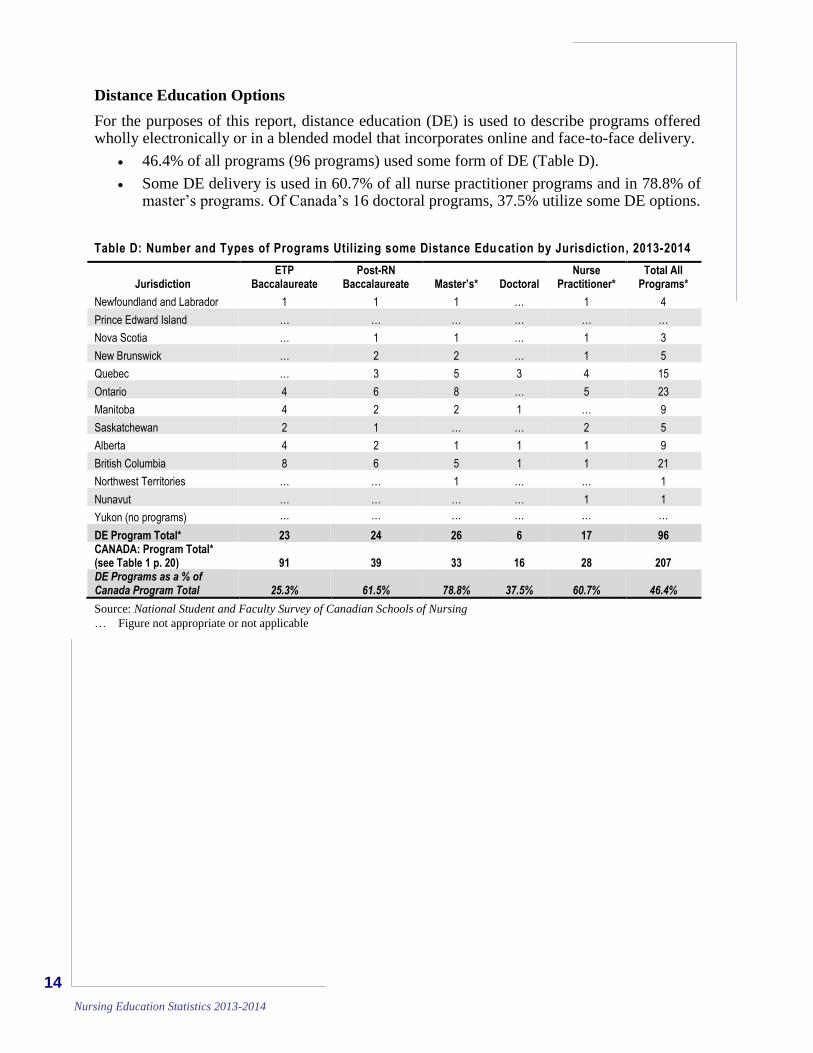
Distance Education Options
For the purposes of this report, distance education (DE) is used to describe programs offered wholly electronically or in a blended model that incorporates online and face-to-face delivery.
46.4% of all programs (96 programs) used some form of DE (Table D).
Some DE delivery is used in 60.7% of all nurse practitioner programs and in 78.8% of master’s programs. Of Canada’s 16 doctoral programs, 37.5% utilize some DE options.
Table D: Number and Types of Programs Utilizing some Distance Edu cation by Jurisdiction, 2013-2014
Jurisdiction ETP
Baccalaureate Post-RN
Baccalaureate Master’s* Doctoral Nurse
Practitioner* Total All
Programs*
Newfoundland and Labrador 1 1 1 … 1 4
Prince Edward Island … … … … … …
Nova Scotia … 1 1 … 1 3
New Brunswick … 2 2 … 1 5
Quebec … 3 5 3 4 15
Ontario 4 6 8 … 5 23
Manitoba 4 2 2 1 … 9
Saskatchewan 2 1 … … 2 5
Alberta 4 2 1 1 1 9
British Columbia 8 6 5 1 1 21
Northwest Territories … … 1 … … 1
Nunavut … … … … 1 1
Yukon (no programs) … … … … … …
DE Program Total* 23 24 26 6 17 96 CANADA: Program Total* (see Table 1 p. 20) 91 39 33 16 28 207 DE Programs as a % of Canada Program Total 25.3% 61.5% 78.8% 37.5% 60.7% 46.4%
Source: National Student and Faculty Survey of Canadian Schools of Nursing
… Figure not appropriate or not applicable
15 Nursing Education Statistics 2013-2014
2014 Key RN Faculty Findings
The supply of RN faculty is a major factor affecting the capacity of programs to educate nurses.
i It is influenced by retirement of existing faculty, the inflow of newly prepared
faculty, and variables such as the ability to attract and retain qualified faculty.ii
RN or nursing faculty encompasses different types of nursing educators. For the purposes of this report:
“Permanent faculty” refers to tenured/tenurable faculty who teach nursing courses in a university and permanent full-time or permanent part-time faculty who teach nursing courses in a college.
“Full-time faculty” refers to full-time permanent faculty who teach nursing courses plus full-time contract faculty (these are faculty who hold contracts of one academic year or longer) who teach nursing courses.
“Contract faculty” refers to full-time contract faculty (these are faculty who hold contracts of one academic year or longer) who teach nursing courses plus part-time contract faculty (these are faculty who hold contracts of less than one academic year) who teach nursing courses.
Clinical faculty are not included in faculty counts.
“RN faculty” and “faculty” refer to all of the above.
RN Faculty Demographics
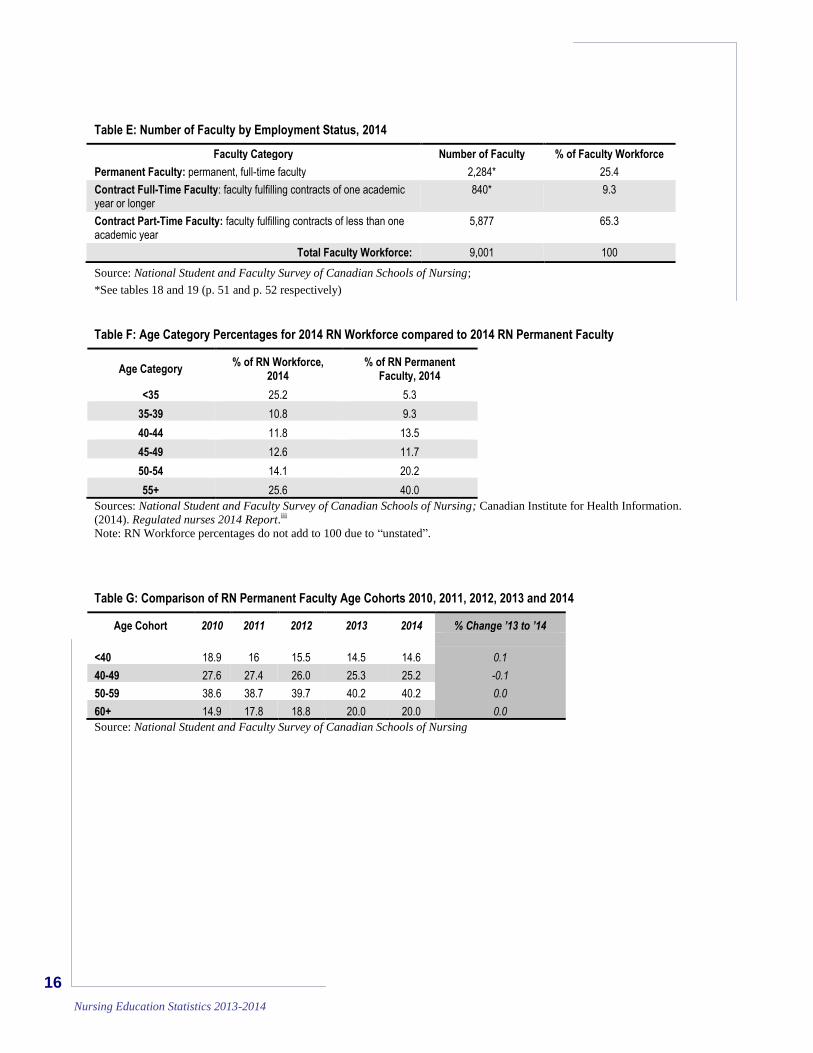
9,001 RN faculty members were employed by schools of nursing in 2014.
Only 25.4% of faculty members are permanent—2,284 of the 9,001 RN faculty (Table E).
60.2% of permanent faculty were 50 years of age or older; 40.0% of permanent faculty were 55 years or older (Table F) and 20.0% were 60 years or over.
The RN faculty are older than the general RN workforce with the percentage of RN permanent faculty in the 50+ age cohort more than 10 percentage points higher than the percentage of 50+ in the RN workforce
iii (Table F).
An increasing percentage of RN permanent faculty were in the 50+ age cohort with the greatest percentage change in the 60+ age cohort (Table G).
The response rate for the question about age cohorts was 68.8% (64 schools). The response rate for the questions about employment status was 94.7% (108 schools).
Faculty data are
2014 data as
compared with
2013 data.
16
Nursing Education Statistics 2013-2014
Table E: Number of Faculty by Employment Status, 2014
Faculty Category Number of Faculty % of Faculty Workforce
Permanent Faculty: permanent, full-time faculty 2,284* 25.4
Contract Full-Time Faculty: faculty fulfilling contracts of one academic year or longer
840* 9.3
Contract Part-Time Faculty: faculty fulfilling contracts of less than one academic year
5,877 65.3
Total Faculty Workforce: 9,001 100
Source: National Student and Faculty Survey of Canadian Schools of Nursing;
*See tables 18 and 19 (p. 51 and p. 52 respectively)
Table F: Age Category Percentages for 2014 RN Workforce compared to 2014 RN Permanent Faculty
Age Category % of RN Workforce,
2014 % of RN Permanent
Faculty, 2014
<35 25.2 5.3
35-39 10.8 9.3
40-44 11.8 13.5
45-49 12.6 11.7
50-54 14.1 20.2
55+ 25.6 40.0
Sources: National Student and Faculty Survey of Canadian Schools of Nursing; Canadian Institute for Health Information.
(2014). Regulated nurses 2014 Report.iii
Note: RN Workforce percentages do not add to 100 due to “unstated”.
Table G: Comparison of RN Permanent Faculty Age Cohorts 2010, 2011, 2012, 2013 and 2014
Age Cohort 2010 2011 2012 2013 2014 % Change ’13 to ’14
<40 18.9 16 15.5 14.5 14.6 0.1
40-49 27.6 27.4 26.0 25.3 25.2 -0.1
50-59 38.6 38.7 39.7 40.2 40.2 0.0
60+ 14.9 17.8 18.8 20.0 20.0 0.0
Source: National Student and Faculty Survey of Canadian Schools of Nursing
17 Nursing Education Statistics 2013-2014
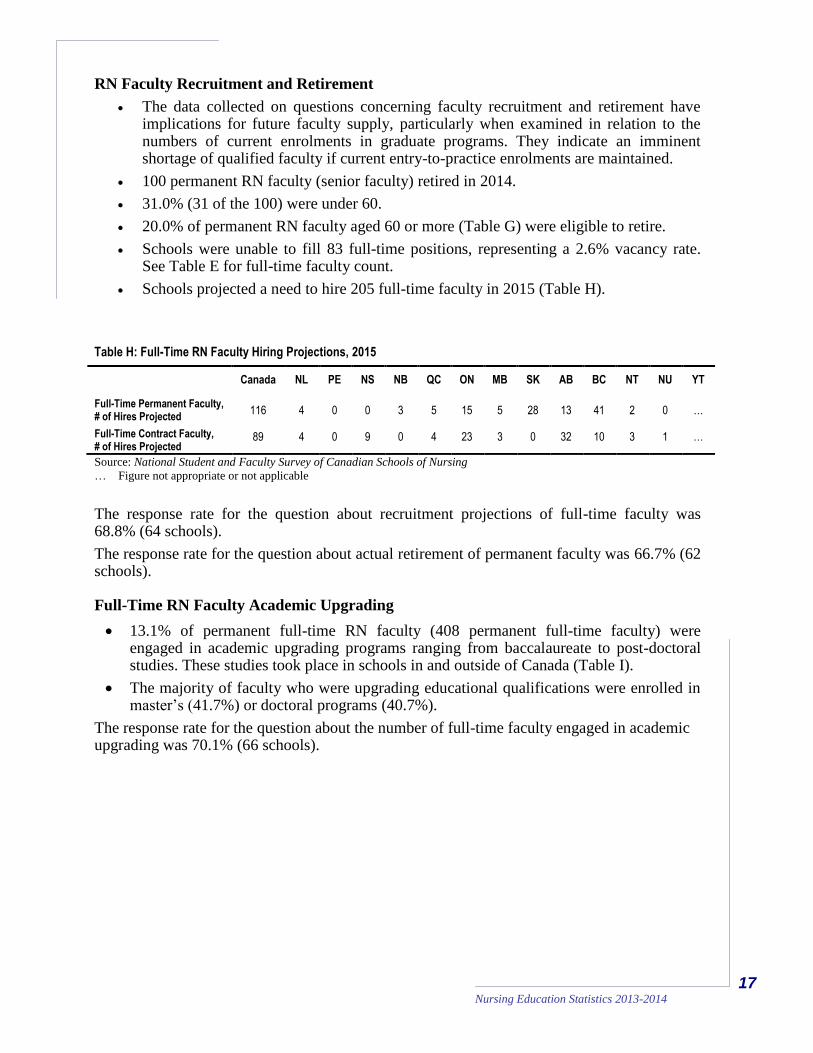
RN Faculty Recruitment and Retirement
The data collected on questions concerning faculty recruitment and retirement have implications for future faculty supply, particularly when examined in relation to the numbers of current enrolments in graduate programs. They indicate an imminent shortage of qualified faculty if current entry-to-practice enrolments are maintained.
100 permanent RN faculty (senior faculty) retired in 2014.
31.0% (31 of the 100) were under 60.
20.0% of permanent RN faculty aged 60 or more (Table G) were eligible to retire.
Schools were unable to fill 83 full-time positions, representing a 2.6% vacancy rate. See Table E for full-time faculty count.
Schools projected a need to hire 205 full-time faculty in 2015 (Table H).
Table H: Full-Time RN Faculty Hiring Projections, 2015
Canada NL PE NS NB QC ON MB SK AB BC NT NU YT
Full-Time Permanent Faculty, # of Hires Projected
116 4 0 0 3 5 15 5 28 13 41 2 0 …
Full-Time Contract Faculty, # of Hires Projected
89 4 0 9 0 4 23 3 0 32 10 3 1 …
Source: National Student and Faculty Survey of Canadian Schools of Nursing
… Figure not appropriate or not applicable
The response rate for the question about recruitment projections of full-time faculty was 68.8% (64 schools).
The response rate for the question about actual retirement of permanent faculty was 66.7% (62 schools).
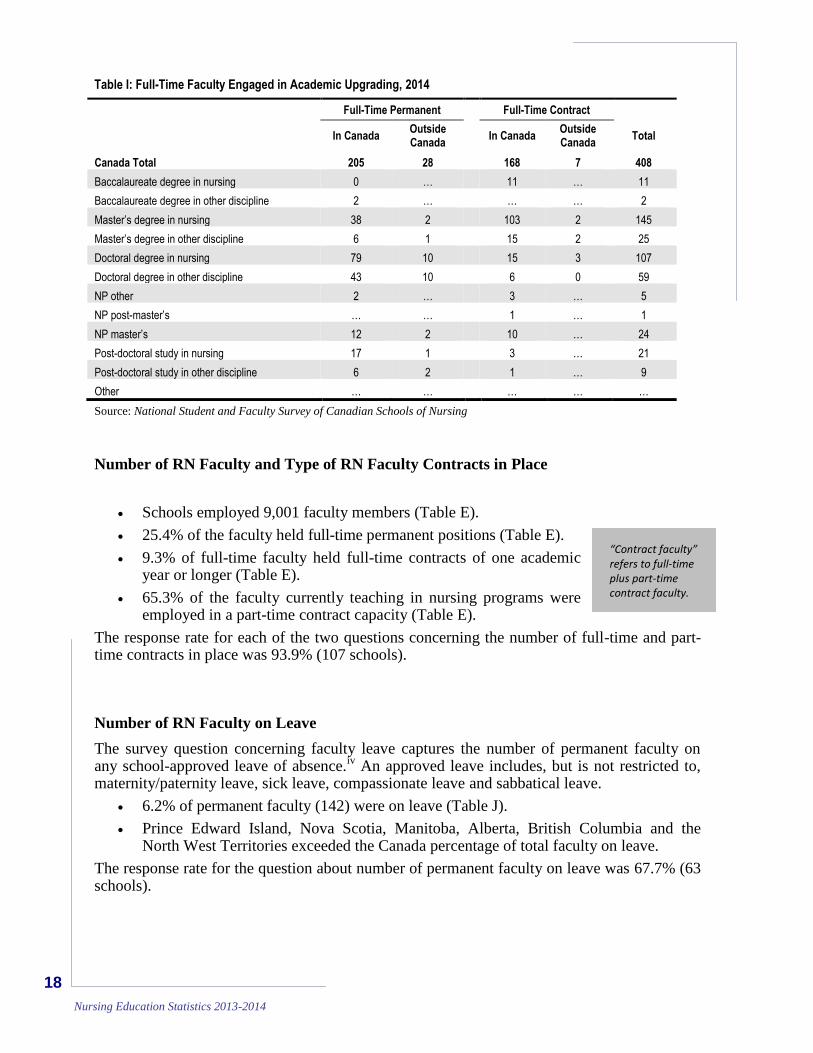
Full-Time RN Faculty Academic Upgrading
13.1% of permanent full-time RN faculty (408 permanent full-time faculty) were engaged in academic upgrading programs ranging from baccalaureate to post-doctoral studies. These studies took place in schools in and outside of Canada (Table I).
The majority of faculty who were upgrading educational qualifications were enrolled in master’s (41.7%) or doctoral programs (40.7%).
The response rate for the question about the number of full-time faculty engaged in academic upgrading was 70.1% (66 schools).
18
Nursing Education Statistics 2013-2014
Table I: Full-Time Faculty Engaged in Academic Upgrading, 2014
Full-Time Permanent Full-Time Contract
In Canada
Outside Canada
In Canada
Outside Canada
Total
Canada Total 205 28 168 7 408
Baccalaureate degree in nursing 0 … 11 … 11
Baccalaureate degree in other discipline 2 … … … 2
Master’s degree in nursing 38 2 103 2 145
Master’s degree in other discipline 6 1 15 2 25
Doctoral degree in nursing 79 10 15 3 107
Doctoral degree in other discipline 43 10 6 0 59
NP other 2 … 3 … 5
NP post-master’s … … 1 … 1
NP master’s 12 2 10 … 24
Post-doctoral study in nursing 17 1 3 … 21
Post-doctoral study in other discipline 6 2 1 … 9
Other … … … … …
Source: National Student and Faculty Survey of Canadian Schools of Nursing
Number of RN Faculty and Type of RN Faculty Contracts in Place
Schools employed 9,001 faculty members (Table E).
25.4% of the faculty held full-time permanent positions (Table E).
9.3% of full-time faculty held full-time contracts of one academic year or longer (Table E).
65.3% of the faculty currently teaching in nursing programs were employed in a part-time contract capacity (Table E).
The response rate for each of the two questions concerning the number of full-time and part-time contracts in place was 93.9% (107 schools).
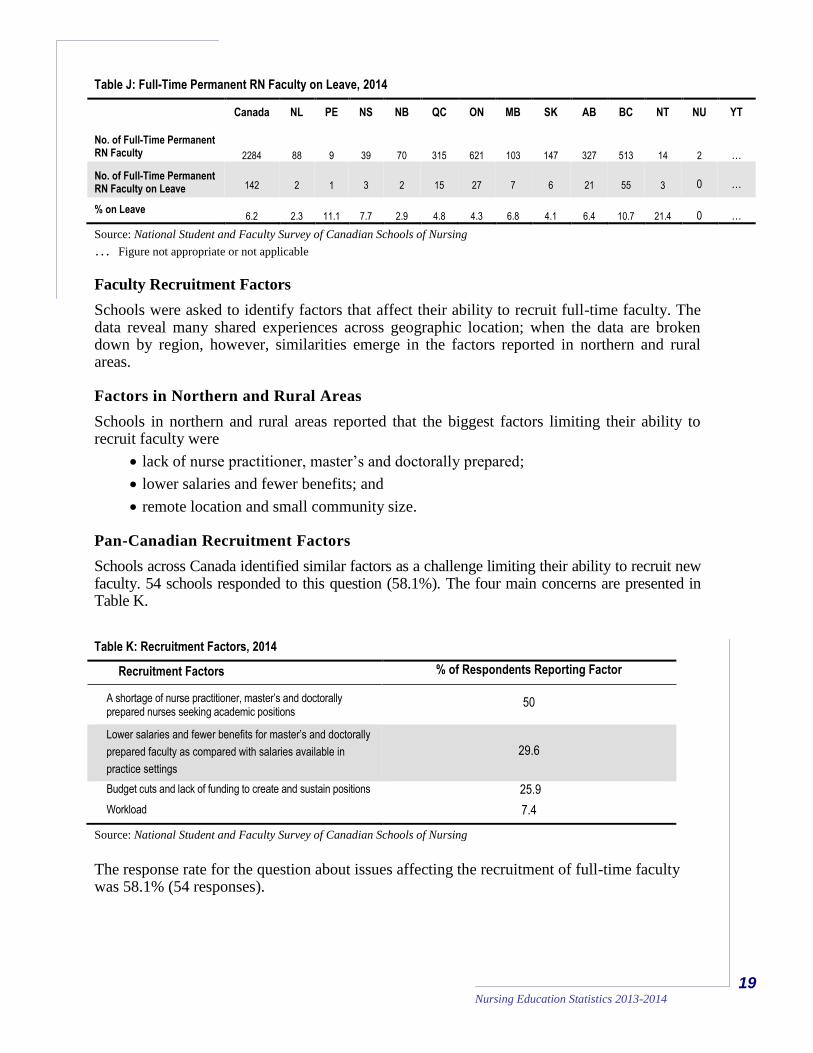
Number of RN Faculty on Leave
The survey question concerning faculty leave captures the number of permanent faculty on any school-approved leave of absence.
iv An approved leave includes, but is not restricted to,
maternity/paternity leave, sick leave, compassionate leave and sabbatical leave.
6.2% of permanent faculty (142) were on leave (Table J).
Prince Edward Island, Nova Scotia, Manitoba, Alberta, British Columbia and the North West Territories exceeded the Canada percentage of total faculty on leave.
The response rate for the question about number of permanent faculty on leave was 67.7% (63 schools).
“Contract faculty” refers to full-time plus part-time contract faculty.
19 Nursing Education Statistics 2013-2014
Table J: Full-Time Permanent RN Faculty on Leave, 2014
Canada NL PE NS NB QC ON MB SK AB BC NT NU YT
No. of Full-Time Permanent RN Faculty 2284 88 9 39 70 315 621 103 147 327 513 14 2 …
No. of Full-Time Permanent RN Faculty on Leave 142 2 1 3 2 15 27 7 6 21 55 3 0 …
% on Leave 6.2 2.3 11.1 7.7 2.9 4.8 4.3 6.8 4.1 6.4 10.7 21.4 0 …
Source: National Student and Faculty Survey of Canadian Schools of Nursing
… Figure not appropriate or not applicable
Faculty Recruitment Factors
Schools were asked to identify factors that affect their ability to recruit full-time faculty. The data reveal many shared experiences across geographic location; when the data are broken down by region, however, similarities emerge in the factors reported in northern and rural areas.
Factors in Northern and Rural Areas
Schools in northern and rural areas reported that the biggest factors limiting their ability to recruit faculty were
lack of nurse practitioner, master’s and doctorally prepared;
lower salaries and fewer benefits; and
remote location and small community size.
Pan-Canadian Recruitment Factors
Schools across Canada identified similar factors as a challenge limiting their ability to recruit new faculty. 54 schools responded to this question (58.1%). The four main concerns are presented in Table K.
Table K: Recruitment Factors, 2014
Recruitment Factors % of Respondents Reporting Factor
A shortage of nurse practitioner, master’s and doctorally prepared nurses seeking academic positions
50
Lower salaries and fewer benefits for master’s and doctorally
prepared faculty as compared with salaries available in
practice settings
29.6
Budget cuts and lack of funding to create and sustain positions 25.9
Workload 7.4
Source: National Student and Faculty Survey of Canadian Schools of Nursing
The response rate for the question about issues affecting the recruitment of full-time faculty was 58.1% (54 responses).
20
Nursing Education Statistics 2013-2014
Summary of Key Program and RN Faculty Findings
The number of graduates from entry-to-practice programs continued to increase in 2013-2014 as a result of the expansion of seats and program delivery models in the last decade (11,987 in 2014, a 2.4% increase compared with 2013).
Admissions increased in 2013-2014; 15,774 students entered ETP programs, an increase of 5.4% from 14,968 the previous year.
46.4% of all programs now use some distance education delivery, which may be improving student access.
Increased graduate program admissions need to be sustained to avoid a potential faculty shortage as the following data indicate:
o 40.2% of faculty were in the 55+ age cohort
o 20.0% of faculty were in the 60+ age cohort.
o Currently there are 395 students enrolled in PhD nursing programs in Canada, 89 of which are current faculty members.
o The potential future supply of new faculty from current PhD enrolment in Canada is therefore 306.
o In 2013-2014, master’s and doctoral admissions increased by 19.1% and 15.1%, respectively. However, the number of graduates from master’s and doctoral programs decreased slightly.
o The replacement pool (master’s and doctoral graduates) for retiring faculty is inadequate if enrolments in graduate programs remain at current levels.
21 Nursing Education Statistics 2013-2014
2013-2014 Results
The 2013-2014 survey was issued to the 134 schools of nursing offering entry-to-practice (ETP) pre-licensure education entitling successful graduates to apply for initial licensure/registration as an RN, or for post-RN, NP and graduate RN education. It was completed by 114 schools, including 88 of a possible 94 CASN members.
The overall survey response rate was 85.1%; the CASN member response rate was 94.6%. See the tables starting on page 22 for more detailed information about omitted or unusable data. On average, 72.0% of schools responded to the faculty questions.
Different collection periods and methodologies and under-reporting from a small proportion of schools may result in differences between the records of a provincial/territorial government or regulatory body and the data from the National Student and Faculty Survey of Canadian Schools of Nursing.
The following tables represent data as reported by each of the participating schools and do not include data from other sources. CASN is not responsible for errors in data reported by schools.
Note: New this year – In order to ensure clarity the OIIQ data is used for both the admissions and graduate data points for entry to practice in all sections of this report.
Previously the use of OIIQ data was limited to the section “Key Program Findings.”
It is important to read the notes that accompany each table as well as the section “Methodological Notes” on page 53, which contains information pertinent to all of the tables. The full survey methodology and definitions are in Appendix A.
22
Nursing Education Statistics 2013-2014
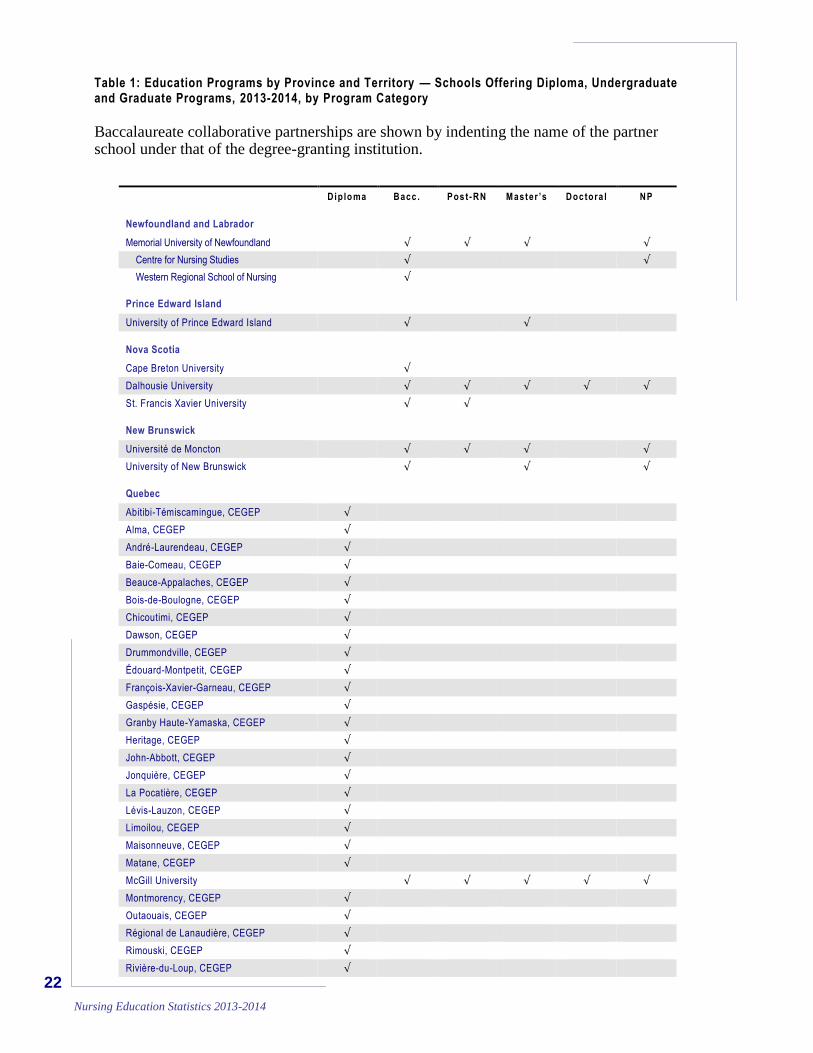
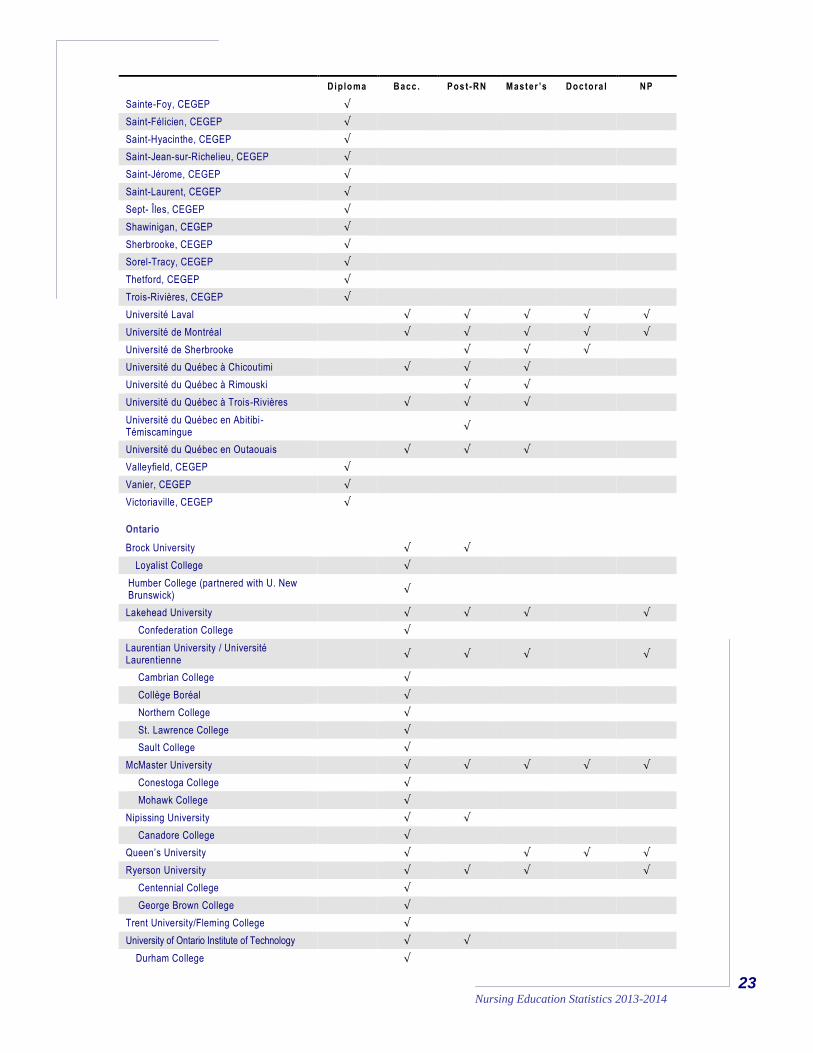
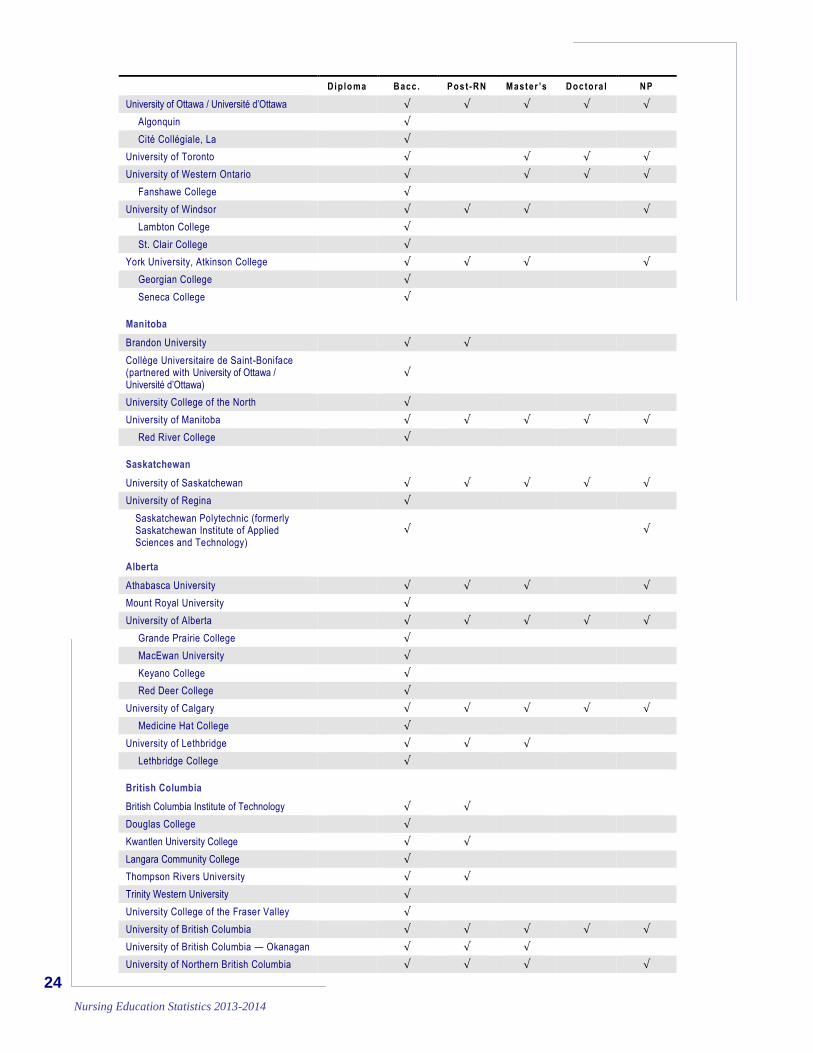
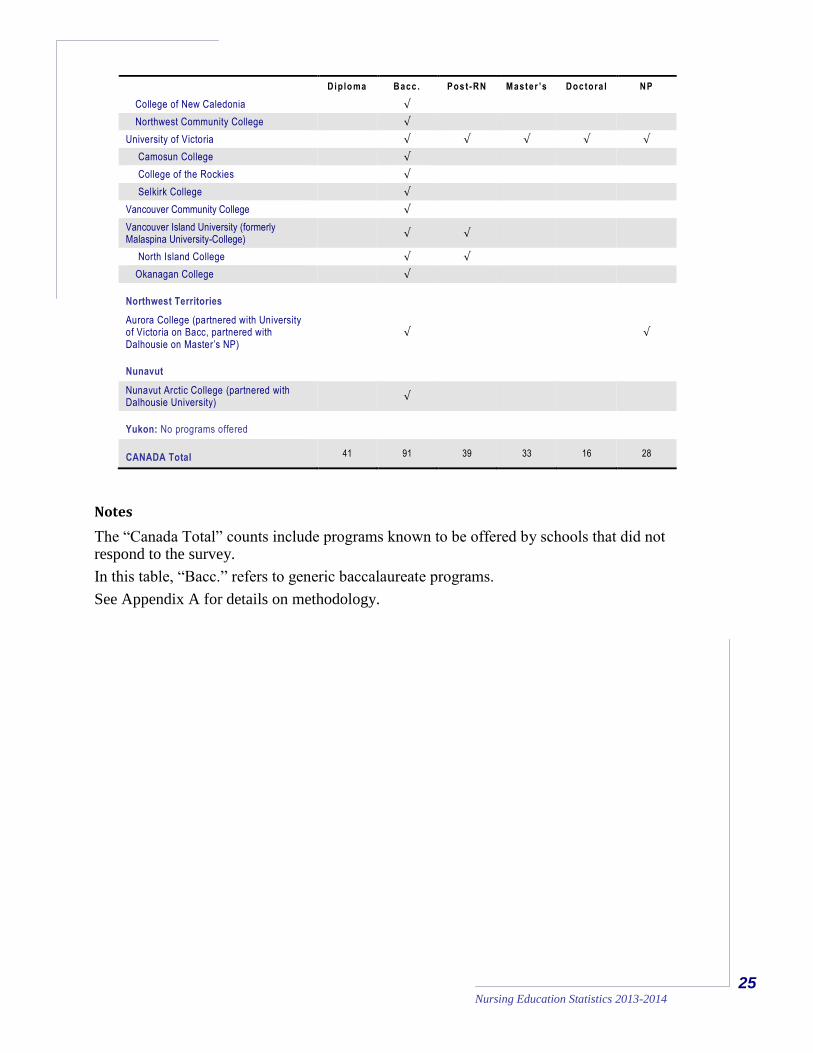
Table 1: Education Programs by Province and Territory — Schools Offering Diploma, Undergraduate and Graduate Programs, 2013-2014, by Program Category
Baccalaureate collaborative partnerships are shown by indenting the name of the partner school under that of the degree-granting institution.
Diplo ma Bacc . Pos t-RN Master ’s Doc tora l NP
Newfoundland and Labrador
Memorial University of Newfoundland √ √ √ √
Centre for Nursing Studies √ √
Western Regional School of Nursing √
Prince Edward Island
University of Prince Edward Island √ √
Nova Scotia
Cape Breton University √
Dalhousie University √ √ √ √ √
St. Francis Xavier University √ √
New Brunswick
Université de Moncton √ √ √ √
University of New Brunswick √ √ √
Quebec
Abitibi-Témiscamingue, CEGEP √
Alma, CEGEP √
André-Laurendeau, CEGEP √
Baie-Comeau, CEGEP √
Beauce-Appalaches, CEGEP √
Bois-de-Boulogne, CEGEP √
Chicoutimi, CEGEP √
Dawson, CEGEP √
Drummondville, CEGEP √
Édouard-Montpetit, CEGEP √
François-Xavier-Garneau, CEGEP √
Gaspésie, CEGEP √
Granby Haute-Yamaska, CEGEP √
Heritage, CEGEP √
John-Abbott, CEGEP √
Jonquière, CEGEP √
La Pocatière, CEGEP √
Lévis-Lauzon, CEGEP √
Limoilou, CEGEP √
Maisonneuve, CEGEP √
Matane, CEGEP √
McGill University √ √ √ √ √
Montmorency, CEGEP √
Outaouais, CEGEP √
Régional de Lanaudière, CEGEP √
Rimouski, CEGEP √
Rivière-du-Loup, CEGEP √
23 Nursing Education Statistics 2013-2014
Diplo ma Bacc . Pos t-RN Master ’s Doc tora l NP
Sainte-Foy, CEGEP √
Saint-Félicien, CEGEP √
Saint-Hyacinthe, CEGEP √
Saint-Jean-sur-Richelieu, CEGEP √
Saint-Jérome, CEGEP √
Saint-Laurent, CEGEP √
Sept- Îles, CEGEP √
Shawinigan, CEGEP √
Sherbrooke, CEGEP √
Sorel-Tracy, CEGEP √
Thetford, CEGEP √
Trois-Rivières, CEGEP √
Université Laval √ √ √ √ √
Université de Montréal √ √ √ √ √
Université de Sherbrooke √ √ √
Université du Québec à Chicoutimi √ √ √
Université du Québec à Rimouski √ √
Université du Québec à Trois-Rivières √ √ √
Université du Québec en Abitibi-Témiscamingue
√
Université du Québec en Outaouais √ √ √
Valleyfield, CEGEP √
Vanier, CEGEP √
Victoriaville, CEGEP √
Ontario
Brock University √ √
Loyalist College √
Humber College (partnered with U. New Brunswick)
√
Lakehead University √ √ √ √
Confederation College √
Laurentian University / Université Laurentienne
√ √ √ √
Cambrian College √
Collège Boréal √
Northern College √
St. Lawrence College √
Sault College √
McMaster University √ √ √ √ √
Conestoga College √
Mohawk College √
Nipissing University √ √
Canadore College √
Queen’s University √ √ √ √
Ryerson University √ √ √ √
Centennial College √
George Brown College √
Trent University/Fleming College √
University of Ontario Institute of Technology √ √
Durham College √
24
Nursing Education Statistics 2013-2014
Diplo ma Bacc . Pos t-RN Master ’s Doc tora l NP
University of Ottawa / Université d’Ottawa √ √ √ √ √
Algonquin √
Cité Collégiale, La √
University of Toronto √ √ √ √
University of Western Ontario √ √ √ √
Fanshawe College √
University of Windsor √ √ √ √
Lambton College √
St. Clair College √
York University, Atkinson College √ √ √ √
Georgian College √
Seneca College √
Manitoba
Brandon University √ √
Collège Universitaire de Saint-Boniface (partnered with University of Ottawa / Université d’Ottawa)
√
University College of the North √
University of Manitoba √ √ √ √ √
Red River College √
Saskatchewan
University of Saskatchewan √ √ √ √ √
University of Regina √
Saskatchewan Polytechnic (formerly Saskatchewan Institute of Applied Sciences and Technology)
√ √
Alberta
Athabasca University √ √ √ √
Mount Royal University √
University of Alberta √ √ √ √ √
Grande Prairie College √
MacEwan University √
Keyano College √
Red Deer College √
University of Calgary √ √ √ √ √
Medicine Hat College √
University of Lethbridge √ √ √
Lethbridge College √
British Columbia
British Columbia Institute of Technology √ √
Douglas College √
Kwantlen University College √ √
Langara Community College √
Thompson Rivers University √ √
Trinity Western University √
University College of the Fraser Valley √
University of British Columbia √ √ √ √ √
University of British Columbia — Okanagan √ √ √
University of Northern British Columbia √ √ √ √
25 Nursing Education Statistics 2013-2014
Diplo ma Bacc . Pos t-RN Master ’s Doc tora l NP
College of New Caledonia √
Northwest Community College √
University of Victoria √ √ √ √ √
Camosun College √
College of the Rockies √
Selkirk College √
Vancouver Community College √
Vancouver Island University (formerly Malaspina University-College)
√ √
North Island College √ √
Okanagan College √
Northwest Territories
Aurora College (partnered with University of Victoria on Bacc, partnered with Dalhousie on Master’s NP)
√ √
Nunavut
Nunavut Arctic College (partnered with Dalhousie University)
√
Yukon: No programs offered
CANADA Total 41 91 39 33 16 28
Notes
The “Canada Total” counts include programs known to be offered by schools that did not respond to the survey.
In this table, “Bacc.” refers to generic baccalaureate programs.
See Appendix A for details on methodology.
26
Nursing Education Statistics 2013-2014
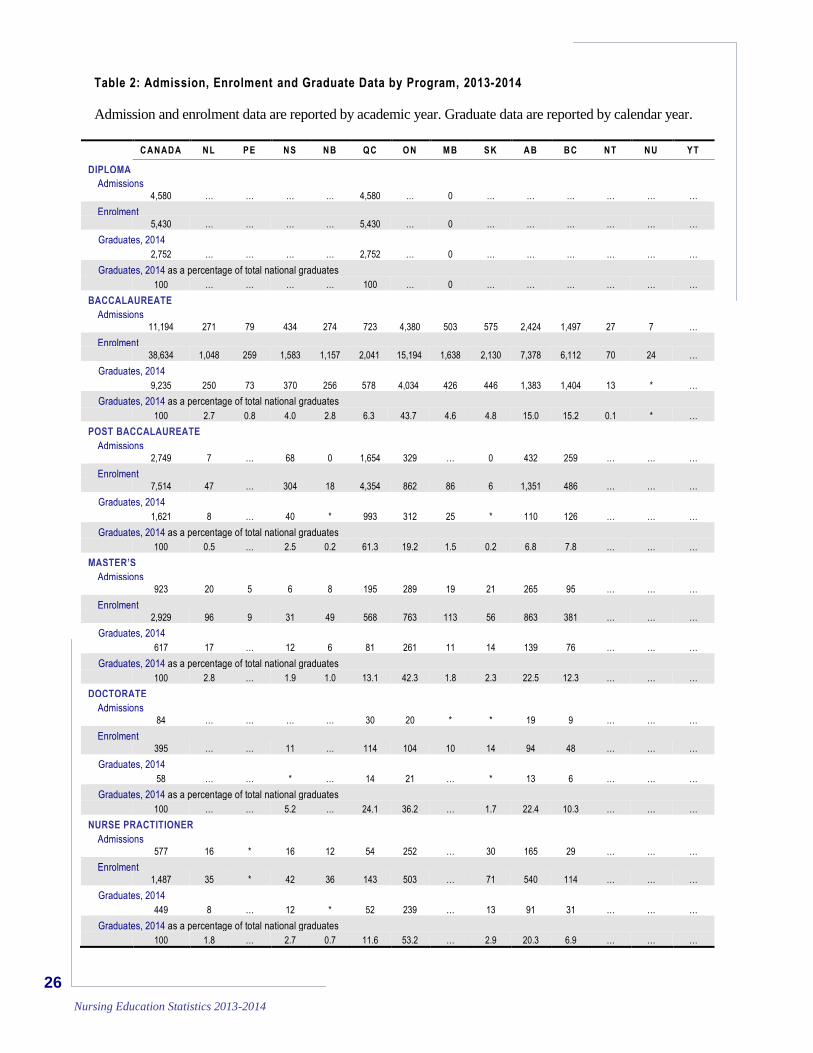
Table 2: Admission, Enrolment and Graduate Data by Program, 2013-2014
Admission and enrolment data are reported by academic year. Graduate data are reported by calendar year.
CANADA NL PE NS NB QC ON MB SK AB BC NT NU YT
DIPLOMA
Admissions 4,580 … … … … 4,580 … 0 … … … … … …
Enrolment 5,430 … … … … 5,430 … 0 … … … … … …
Graduates, 2014
2,752 … … … … 2,752 … 0 … … … … … …
Graduates, 2014 as a percentage of total national graduates
100 … … … … 100 … 0 … … … … … …
BACCALAUREATE
Admissions 11,194 271 79 434 274 723 4,380 503 575 2,424 1,497 27 7 …
Enrolment 38,634 1,048 259 1,583 1,157 2,041 15,194 1,638 2,130 7,378 6,112 70 24 …
Graduates, 2014
9,235 250 73 370 256 578 4,034 426 446 1,383 1,404 13 * …
Graduates, 2014 as a percentage of total national graduates
100 2.7 0.8 4.0 2.8 6.3 43.7 4.6 4.8 15.0 15.2 0.1 * …
POST BACCALAUREATE
Admissions 2,749 7 … 68 0 1,654 329 … 0 432 259 … … …
Enrolment 7,514 47 … 304 18 4,354 862 86 6 1,351 486 … … …
Graduates, 2014
1,621 8 … 40 * 993 312 25 * 110 126 … … …
Graduates, 2014 as a percentage of total national graduates
100 0.5 … 2.5 0.2 61.3 19.2 1.5 0.2 6.8 7.8 … … …
MASTER’S
Admissions 923 20 5 6 8 195 289 19 21 265 95 … … …
Enrolment 2,929 96 9 31 49 568 763 113 56 863 381 … … …
Graduates, 2014
617 17 … 12 6 81 261 11 14 139 76 … … …
Graduates, 2014 as a percentage of total national graduates
100 2.8 … 1.9 1.0 13.1 42.3 1.8 2.3 22.5 12.3 … … …
DOCTORATE
Admissions 84 … … … … 30 20 * * 19 9 … … …
Enrolment 395 … … 11 … 114 104 10 14 94 48 … … …
Graduates, 2014
58 … … * … 14 21 … * 13 6 … … …
Graduates, 2014 as a percentage of total national graduates
100 … … 5.2 … 24.1 36.2 … 1.7 22.4 10.3 … … …
NURSE PRACTITIONER
Admissions 577 16 * 16 12 54 252 … 30 165 29 … … …
Enrolment 1,487 35 * 42 36 143 503 … 71 540 114 … … …
Graduates, 2014
449 8 … 12 * 52 239 … 13 91 31 … … …
Graduates, 2014 as a percentage of total national graduates
100 1.8 … 2.7 0.7 11.6 53.2 … 2.9 20.3 6.9 … … …

27 Nursing Education Statistics 2013-2014
Notes
OIIQ data 2013-2014: 4,580 students were admitted to diploma programs and 723 students to
baccalaureate programs; 2,752 students graduated from diploma programs and 578 from baccalaureate
programs. Enrolment data were not reported.
As of 2013-2014, OIIQ data is used for all Quebec admission and graduate numbers to ensure a
complete and accurate picture.
Totals may not sum to 100% due to rounding.
Summary of omitted and unusable data:
Newfoundland and Labrador
Nurse Practitioner 1 school’s admission data; 1 school’s enrolment data; 1 school’s graduate data
New Brunswick
Nurse Practitioner 1 school’s graduate data
Prince Edward Island
Master’s 1 school’s graduate data
Quebec
Baccalaureate 1 school’s admission data; 1 school’s enrolment data; 1 school’s graduate data
Post-RN Baccalaureate 1 school’s admission data; 1 school’s enrolment data; 1 school’s graduate data
Master’s 1 school’s admission data; 1 school’s enrolment data; 1 school’s graduate data
Doctoral 1 school’s admission data; 1 school’s enrolment data; 1 school’s graduate data
Ontario
Baccalaureate 3 schools’ admission data; 3 schools’ enrolment data; 3 school’s graduate data
Post-RN Baccalaureate 2 schools’ admission data; 2 schools’ enrolment data; 2 school’s graduate data
Manitoba
Baccalaureate 1 school’s admission data; 1 school’s enrolment data; 1 school’s graduate data
Master’s 1 school’s admission data; 1 school’s enrolment data
Nurse Practitioner 1 school’s admission data
Doctoral 1 school’s graduate data
Alberta
Master’s 1 school’s admission data; 1 school’s enrolment data; 1 school’s graduate data
British Columbia
Post-RN Baccalaureate 2 schools’ admission data; 2 schools’ enrolment data; 2 school’s graduate data
Master’s 1 school’s graduate data
Symbols
.. Figure not available … Figure not appropriate or not applicable
* Value suppressed in accordance with CASN privacy policy; cell value is between 1 and 4
** Value suppressed to ensure confidentiality; cell value is 5 or greater
28
Nursing Education Statistics 2013-2014
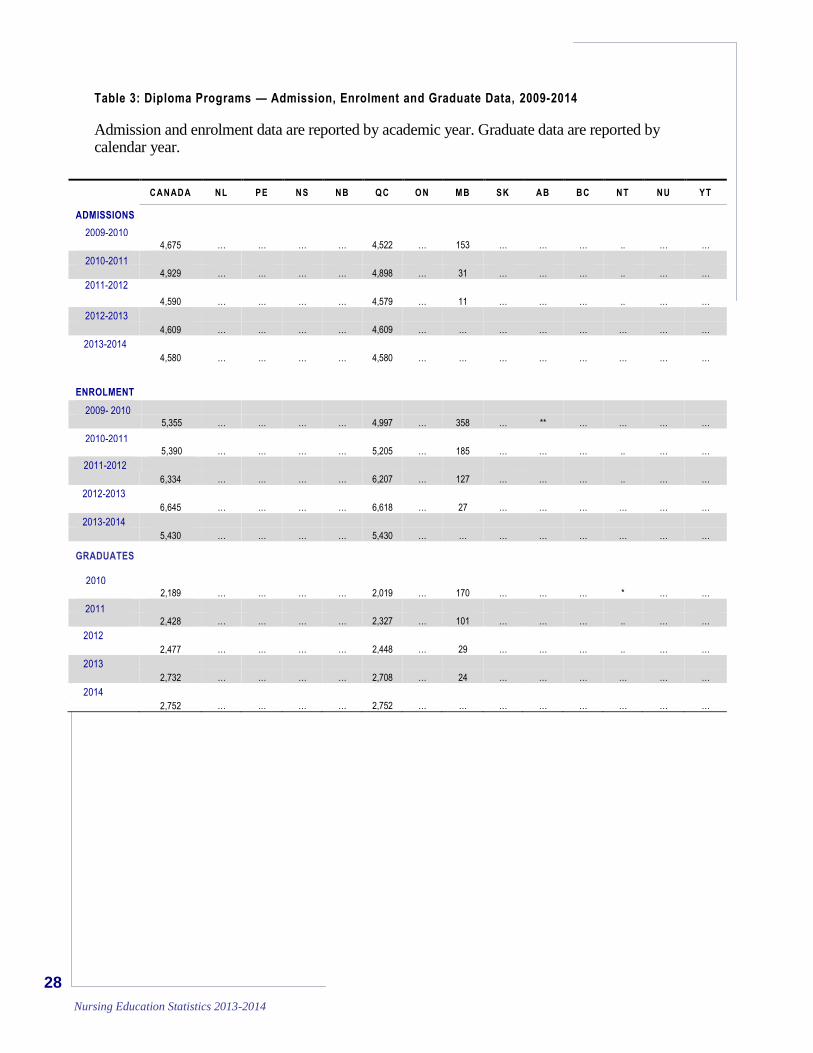
Table 3: Diploma Programs — Admission, Enrolment and Graduate Data, 2009-2014
Admission and enrolment data are reported by academic year. Graduate data are reported by calendar year.
CANADA NL PE NS NB QC ON MB SK AB BC NT NU YT
ADMISSIONS
2009-2010 4,675 … … … … 4,522 … 153 … … … .. … …
2010-2011
4,929 … … … … 4,898 … 31 … … … .. … …
2011-2012
4,590 … … … … 4,579 … 11 … … … .. … …
2012-2013
4,609 … … … … 4,609 … … … … … … … …
2013-2014
4,580 … … … … 4,580 … … … … … … … …
ENROLMENT
2009- 2010
5,355 … … … … 4,997 … 358 … ** … … … …
2010-2011
5,390 … … … … 5,205 … 185 … … … .. … …
2011-2012
6,334 … … … … 6,207 … 127 … … … .. … …
2012-2013
6,645 … … … … 6,618 … 27 … … … … … …
2013-2014
5,430 … … … … 5,430 … … … … … … … …
GRADUATES
2010
2,189 … … … … 2,019 … 170 … … … * … …
2011
2,428 … … … … 2,327 … 101 … … … .. … …
2012
2,477 … … … … 2,448 … 29 … … … .. … …
2013
2,732 … … … … 2,708 … 24 … … … … … …
2014
2,752 … … … … 2,752 … … … … … … … …
29 Nursing Education Statistics 2013-2014
Notes
Summary of omitted and unusable data:
2009-2010: All data usable.
2010-2011: All data usable.
2011-2012: All data usable.
2012-2013: All data usable.
2013-2014: All data usable.
OIIQ reports the following for Quebec diploma programs:
2009-2010: 4,522 students were admitted to diploma programs and 522 students to
baccalaureate programs; 2,019 students graduated from diploma programs and
356 from baccalaureate programs. Enrolment data were not reported.
(Note: Data corrected by OIIQ in 2011. Previous reporting for 2009-2010:
OIIQ reported 4,522 students were admitted to diploma programs and 522
students to baccalaureate programs; 2,508 students graduated from diploma
programs and 495 from baccalaureate programs. Enrolment data were not
reported.)
2010-2011: 4,898 students were admitted to diploma programs and 547 students to
baccalaureate programs; 2,327 students graduated from diploma programs and
362 from baccalaureate programs. Enrolment data were not reported.
2011-2012: 4,579 students were admitted to diploma programs and 718 students to
baccalaureate programs; 2,448 students graduated from diploma programs and
400 from baccalaureate programs. Enrolment data were not reported.
2012-2013: 4,609 students were admitted to diploma programs and 708 students to
baccalaureate programs; 2,448 students graduated from diploma programs and
400 from baccalaureate programs. Enrolment data were not reported.
2013-2014: 4,580 students were admitted to diploma programs; 2,752 students graduated
from diploma programs. Enrolment data were not reported.
Symbols
.. Figure not available … Figure not appropriate or not applicable
* Value suppressed in accordance with CASN privacy policy; cell value is between 1 and 4
** Value suppressed to ensure confidentiality; cell value is 5 or greater
30
Nursing Education Statistics 2013-2014
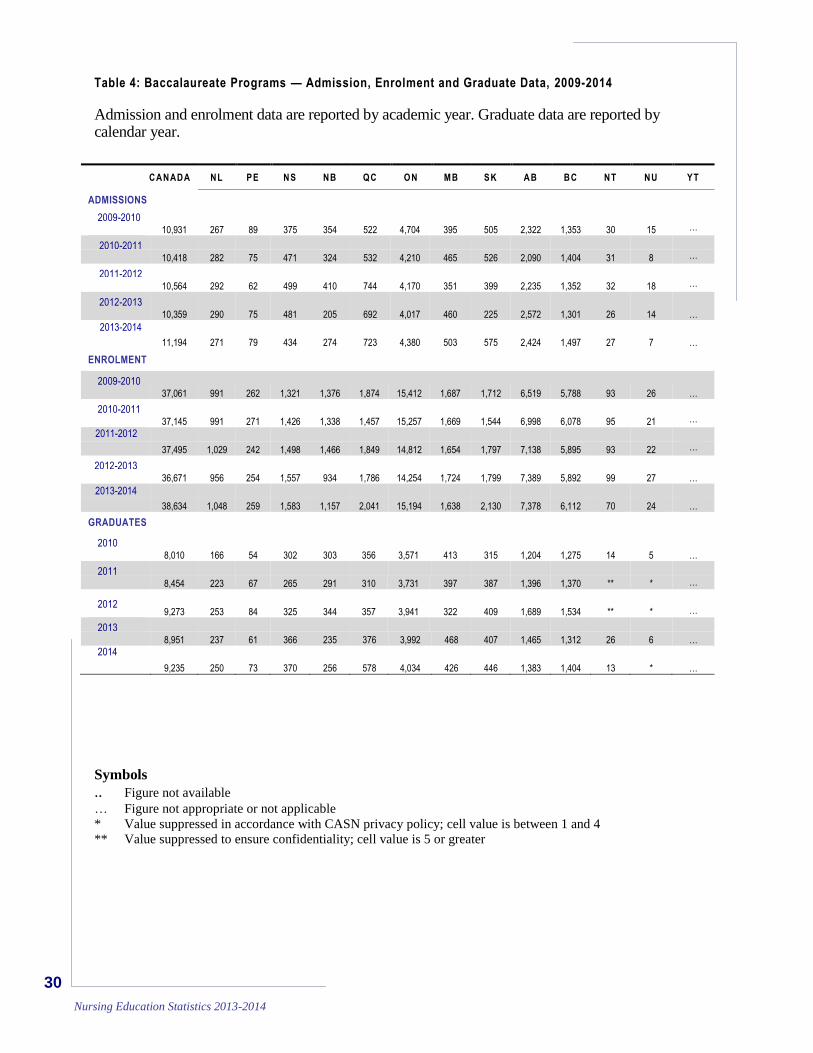
Table 4: Baccalaureate Programs — Admission, Enrolment and Graduate Data, 2009-2014
Admission and enrolment data are reported by academic year. Graduate data are reported by calendar year.
CANADA NL PE NS NB QC ON MB SK AB BC NT NU YT
ADMISSIONS
2009-2010 10,931 267 89 375 354 522 4,704 395 505 2,322 1,353 30 15 …
2010-2011
10,418 282 75 471 324 532 4,210 465 526 2,090 1,404 31 8 …
2011-2012
10,564 292 62 499 410 744 4,170 351 399 2,235 1,352 32 18 …
2012-2013
10,359 290 75 481 205 692 4,017 460 225 2,572 1,301 26 14 …
2013-2014
11,194 271 79 434 274 723 4,380 503 575 2,424 1,497 27 7 …
ENROLMENT
2009-2010 37,061 991 262 1,321 1,376 1,874 15,412 1,687 1,712 6,519 5,788 93 26 …
2010-2011
37,145 991 271 1,426 1,338 1,457 15,257 1,669 1,544 6,998 6,078 95 21 … 2011-2012
37,495 1,029 242 1,498 1,466 1,849 14,812 1,654 1,797 7,138 5,895 93 22 …
2012-2013
36,671 956 254 1,557 934 1,786 14,254 1,724 1,799 7,389 5,892 99 27 …
2013-2014
38,634 1,048 259 1,583 1,157 2,041 15,194 1,638 2,130 7,378 6,112 70 24 …
GRADUATES
2010
8,010 166 54 302 303 356 3,571 413 315 1,204 1,275 14 5 …
2011
8,454 223 67 265 291 310 3,731 397 387 1,396 1,370 ** * …
2012
9,273 253 84 325 344 357 3,941 322 409 1,689 1,534 ** * …
2013
8,951 237 61 366 235 376 3,992 468 407 1,465 1,312 26 6 …
2014
9,235 250 73 370 256 578 4,034 426 446 1,383 1,404 13 * …
Symbols
.. Figure not available … Figure not appropriate or not applicable
* Value suppressed in accordance with CASN privacy policy; cell value is between 1 and 4
** Value suppressed to ensure confidentiality; cell value is 5 or greater
31 Nursing Education Statistics 2013-2014
Notes
As of 2007, the treatment of graduate data from program delivery partnerships that cross provincial or territorial boundaries was changed so that graduate results from these partnerships would be recorded under the student’s home province or territory. Historical data have been amended accordingly.
Summary of omitted and unusable data:
2009-2010: Admissions data from 2 schools in Ontario, and 1 school in British Columbia.
2010-2011: Admissions data from 2 schools in British Columbia, 1 school in Manitoba.
Enrolment data from 1 school in British Columbia.
2011-2012: Admissions data from 1 school in British Columbia, 2 schools in Ontario, 1 school in Manitoba. Enrolment data from 1 school in British Columbia.
2012-2013: Admissions data from 5 schools in Ontario, 1 school in Quebec, 1 school in Alberta, 1 school in Saskatchewan, 1 school in Manitoba
Enrolment data from 1 school in Ontario, 1 school in Quebec, 1 school in Saskatchewan Graduate data from 5 schools in Ontario, 1 school in Quebec, 1 school in Saskatchewan.
2013-2014: Admissions data from 1 school in Quebec; 3 schools in Ontario; 1 school in Manitoba.
Enrolment data from 1 school in Quebec; 3 schools in Ontario; 1 school in Manitoba.
Graduate data from 1 school in Quebec; 3 schools in Ontario; 1 school in Manitoba.
OIIQ reports the following for Quebec diploma and baccalaureate programs:
2009-2010: 4,522 students were admitted to diploma programs and 522 students to
baccalaureate programs; 2,019 students graduated from diploma programs and
356 from baccalaureate programs. Enrolment data were not reported.
(Note: Data corrected by OIIQ in 2011. Previous reporting for 2009-2010:
OIIQ reported 4,522 students were admitted to diploma programs and 522
students to baccalaureate programs; 2,508 students graduated from diploma
programs and 495 from baccalaureate programs. Enrolment data were not
reported.)
2010-2011: 4,898 students were admitted to diploma programs and 547 students to
baccalaureate programs; 2,327 students graduated from diploma programs and
362 from baccalaureate programs. Enrolment data were not reported.
2011-2012: 4,579 students were admitted to diploma programs and 718 students to
baccalaureate programs; 2,448 students graduated from diploma programs and
400 from baccalaureate programs. Enrolment data were not reported.
2012-2013: 4,609 students were admitted to diploma programs and 708 students to
baccalaureate programs; 2,448 students graduated from diploma programs and
400 from baccalaureate programs. Enrolment data were not reported.
2013-2014: 723 students were admitted to baccalaureate programs; 578 graduated from
baccalaureate programs. Enrolment data were not reported.
32
Nursing Education Statistics 2013-2014
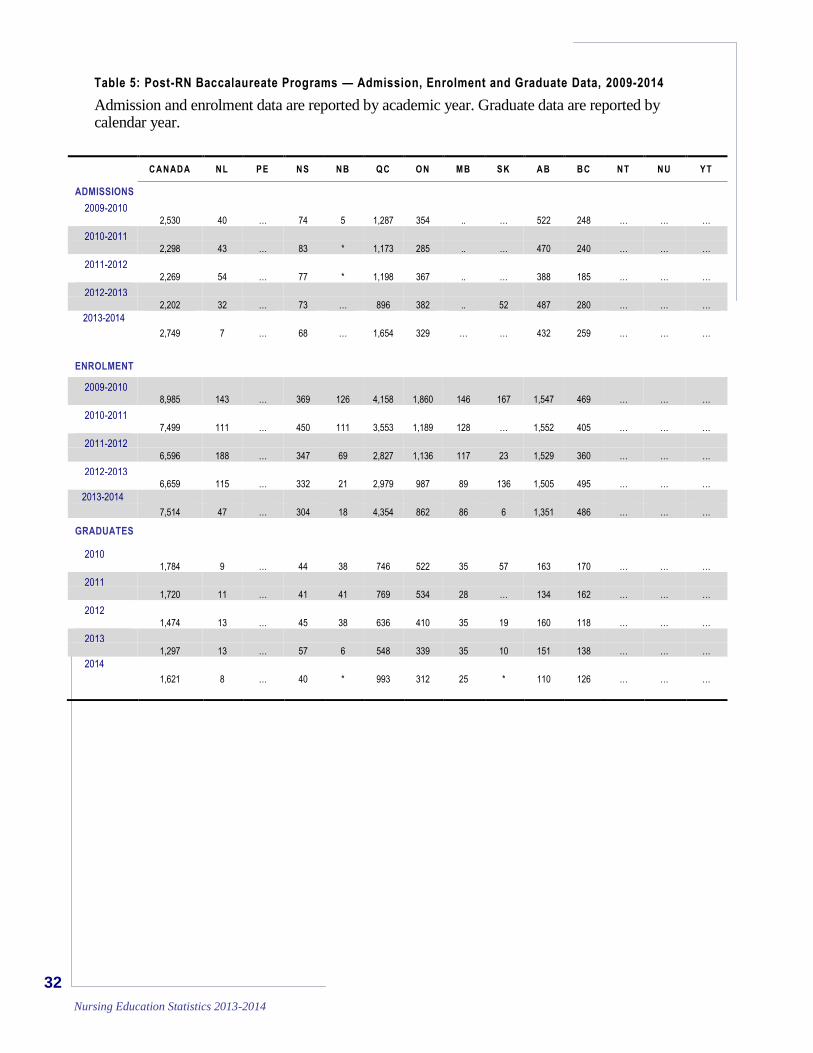
Table 5: Post-RN Baccalaureate Programs — Admission, Enrolment and Graduate Data, 2009-2014
Admission and enrolment data are reported by academic year. Graduate data are reported by calendar year.
CANADA NL PE NS NB QC ON MB SK AB BC NT NU YT
ADMISSIONS
2009-2010
2,530 40 … 74 5 1,287 354 .. … 522 248 … … …
2010-2011
2,298 43 … 83 * 1,173 285 .. … 470 240 … … …
2011-2012
2,269 54 … 77 * 1,198 367 .. … 388 185 … … …
2012-2013
2,202 32 … 73 … 896 382 .. 52 487 280 … … …
2013-2014
2,749 7 … 68 … 1,654 329 … … 432 259 … … …
ENROLMENT
2009-2010
8,985 143 … 369 126 4,158 1,860 146 167 1,547 469 … … …
2010-2011
7,499 111 … 450 111 3,553 1,189 128 … 1,552 405 … … …
2011-2012
6,596 188 … 347 69 2,827 1,136 117 23 1,529 360 … … …
2012-2013
6,659 115 … 332 21 2,979 987 89 136 1,505 495 … … …
2013-2014
7,514 47 … 304 18 4,354 862 86 6 1,351 486 … … …
GRADUATES
2010 1,784 9 … 44 38 746 522 35 57 163 170 … … …
2011
1,720 11 … 41 41 769 534 28 … 134 162 … … …
2012
1,474 13 … 45 38 636 410 35 19 160 118 … … …
2013
1,297 13 … 57 6 548 339 35 10 151 138 … … …
2014
1,621 8 … 40 * 993 312 25 * 110 126 … … …
33 Nursing Education Statistics 2013-2014
Notes
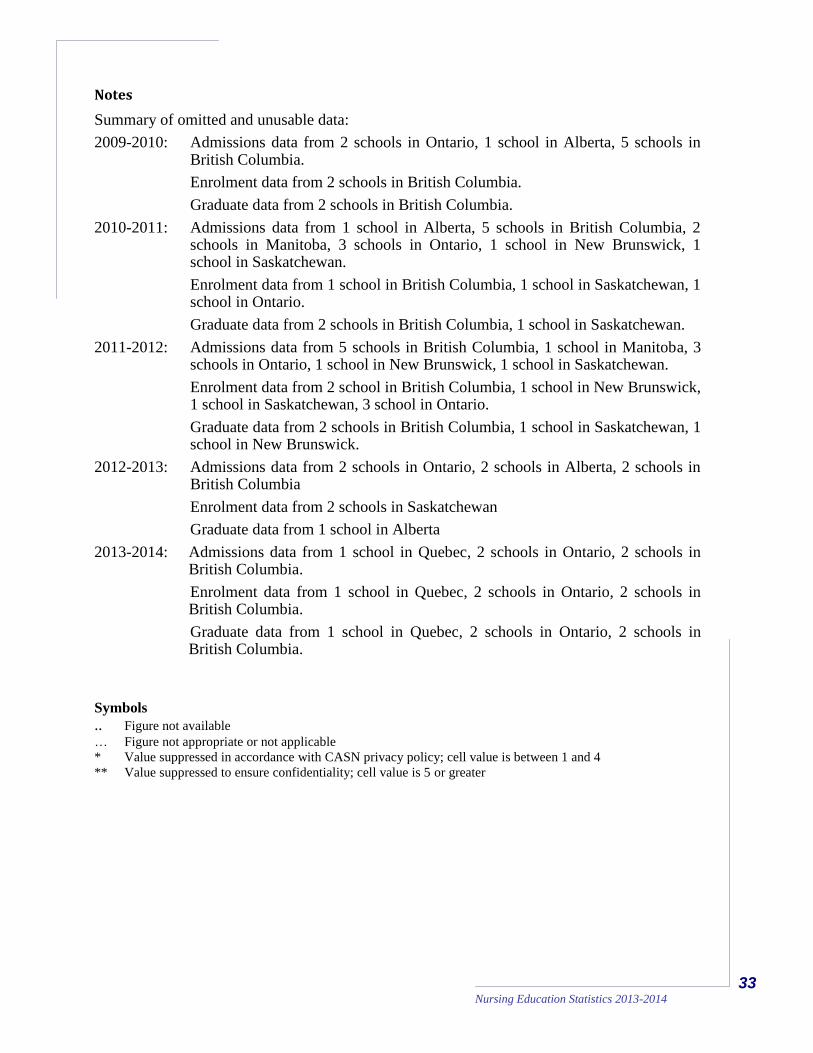
Summary of omitted and unusable data:
2009-2010: Admissions data from 2 schools in Ontario, 1 school in Alberta, 5 schools in British Columbia.
Enrolment data from 2 schools in British Columbia.
Graduate data from 2 schools in British Columbia.
2010-2011: Admissions data from 1 school in Alberta, 5 schools in British Columbia, 2 schools in Manitoba, 3 schools in Ontario, 1 school in New Brunswick, 1 school in Saskatchewan.
Enrolment data from 1 school in British Columbia, 1 school in Saskatchewan, 1 school in Ontario.
Graduate data from 2 schools in British Columbia, 1 school in Saskatchewan.
2011-2012: Admissions data from 5 schools in British Columbia, 1 school in Manitoba, 3 schools in Ontario, 1 school in New Brunswick, 1 school in Saskatchewan.
Enrolment data from 2 school in British Columbia, 1 school in New Brunswick, 1 school in Saskatchewan, 3 school in Ontario.
Graduate data from 2 schools in British Columbia, 1 school in Saskatchewan, 1 school in New Brunswick.
2012-2013: Admissions data from 2 schools in Ontario, 2 schools in Alberta, 2 schools in British Columbia
Enrolment data from 2 schools in Saskatchewan
Graduate data from 1 school in Alberta
2013-2014: Admissions data from 1 school in Quebec, 2 schools in Ontario, 2 schools in British Columbia.
Enrolment data from 1 school in Quebec, 2 schools in Ontario, 2 schools in British Columbia.
Graduate data from 1 school in Quebec, 2 schools in Ontario, 2 schools in British Columbia.
Symbols
.. Figure not available … Figure not appropriate or not applicable
* Value suppressed in accordance with CASN privacy policy; cell value is between 1 and 4
** Value suppressed to ensure confidentiality; cell value is 5 or greater
34
Nursing Education Statistics 2013-2014
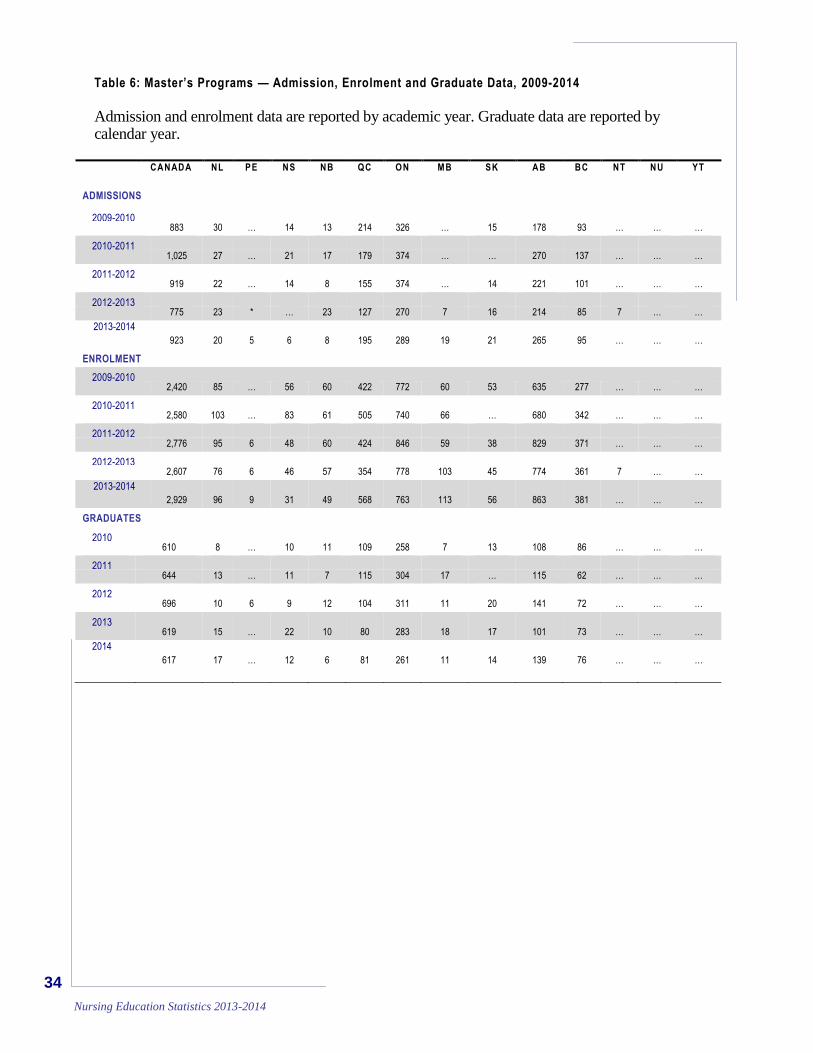
Table 6: Master’s Programs — Admission, Enrolment and Graduate Data, 2009-2014
Admission and enrolment data are reported by academic year. Graduate data are reported by calendar year.
CANADA NL PE NS NB QC ON MB SK AB BC NT NU YT
ADMISSIONS
2009-2010
883 30 … 14 13 214 326 … 15 178 93 … … …
2010-2011
1,025 27 … 21 17 179 374 … … 270 137 … … …
2011-2012
919 22 … 14 8 155 374 … 14 221 101 … … …
2012-2013
775 23 * … 23 127 270 7 16 214 85 7 … …
2013-2014
923 20 5 6 8 195 289 19 21 265 95 … … …
ENROLMENT
2009-2010 2,420 85 … 56 60 422 772 60 53 635 277 … … …
2010-2011 2,580 103 … 83 61 505 740 66 … 680 342 … … …
2011-2012
2,776 95 6 48 60 424 846 59 38 829 371 … … …
2012-2013
2,607 76 6 46 57 354 778 103 45 774 361 7 … …
2013-2014
2,929 96 9 31 49 568 763 113 56 863 381 … … …
GRADUATES
2010
610 8 … 10 11 109 258 7 13 108 86 … … …
2011
644 13 … 11 7 115 304 17 … 115 62 … … …
2012
696 10 6 9 12 104 311 11 20 141 72 … … …
2013
619 15 … 22 10 80 283 18 17 101 73 … … …
2014
617 17 … 12 6 81 261 11 14 139 76 … … …
35 Nursing Education Statistics 2013-2014
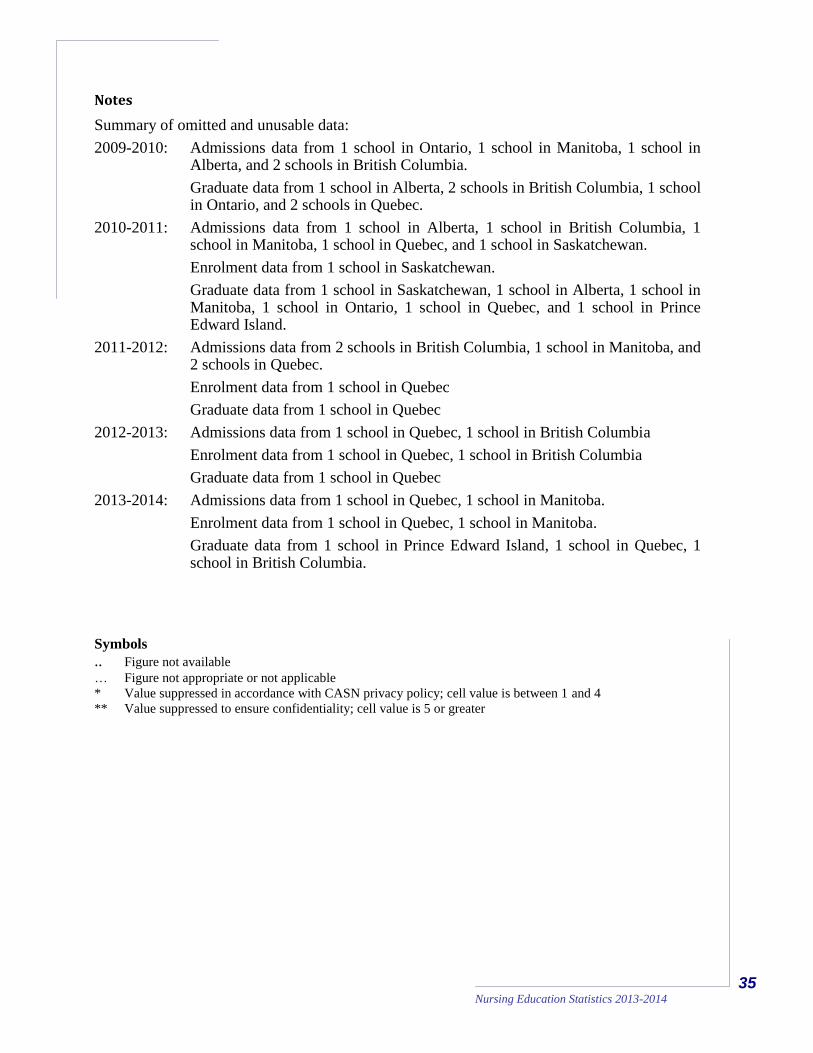
Notes
Summary of omitted and unusable data:
2009-2010: Admissions data from 1 school in Ontario, 1 school in Manitoba, 1 school in Alberta, and 2 schools in British Columbia.
Graduate data from 1 school in Alberta, 2 schools in British Columbia, 1 school in Ontario, and 2 schools in Quebec.
2010-2011: Admissions data from 1 school in Alberta, 1 school in British Columbia, 1 school in Manitoba, 1 school in Quebec, and 1 school in Saskatchewan.
Enrolment data from 1 school in Saskatchewan.
Graduate data from 1 school in Saskatchewan, 1 school in Alberta, 1 school in Manitoba, 1 school in Ontario, 1 school in Quebec, and 1 school in Prince Edward Island.
2011-2012: Admissions data from 2 schools in British Columbia, 1 school in Manitoba, and 2 schools in Quebec.
Enrolment data from 1 school in Quebec
Graduate data from 1 school in Quebec
2012-2013: Admissions data from 1 school in Quebec, 1 school in British Columbia
Enrolment data from 1 school in Quebec, 1 school in British Columbia
Graduate data from 1 school in Quebec
2013-2014: Admissions data from 1 school in Quebec, 1 school in Manitoba.
Enrolment data from 1 school in Quebec, 1 school in Manitoba.
Graduate data from 1 school in Prince Edward Island, 1 school in Quebec, 1 school in British Columbia.
Symbols
.. Figure not available … Figure not appropriate or not applicable
* Value suppressed in accordance with CASN privacy policy; cell value is between 1 and 4
** Value suppressed to ensure confidentiality; cell value is 5 or greater
36
Nursing Education Statistics 2013-2014
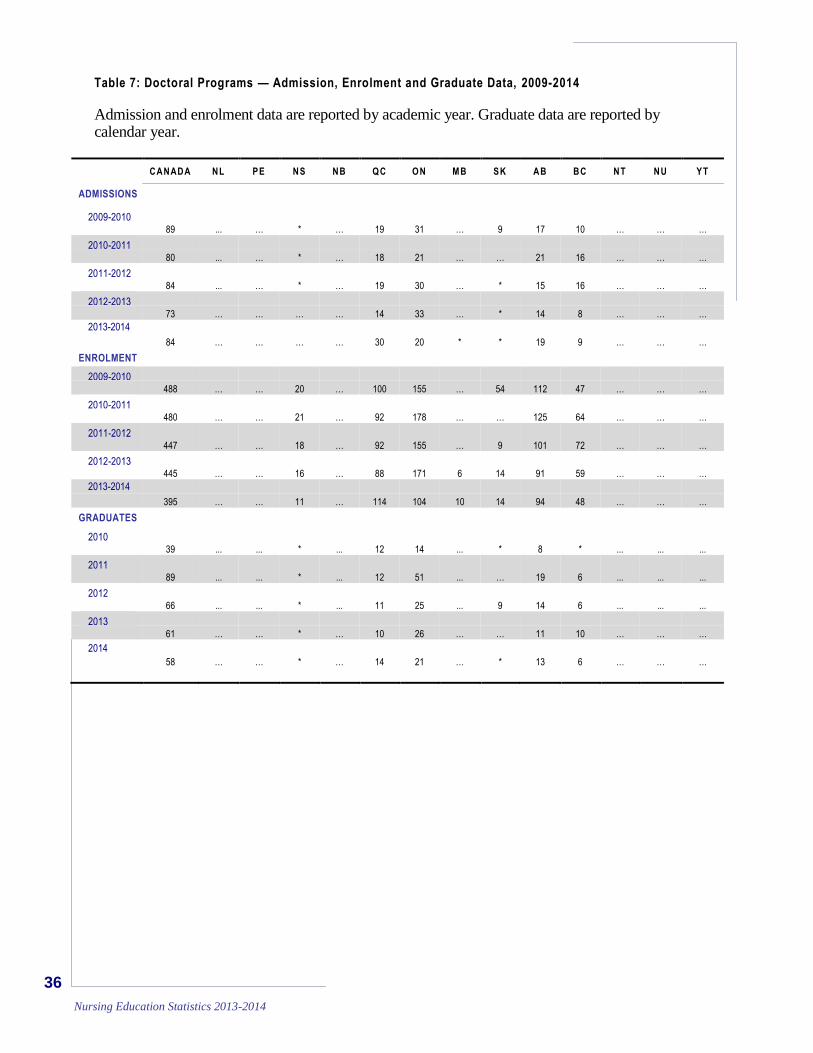
Table 7: Doctoral Programs — Admission, Enrolment and Graduate Data, 2009-2014
Admission and enrolment data are reported by academic year. Graduate data are reported by calendar year.
CANADA NL PE NS NB QC ON MB SK AB BC NT NU YT
ADMISSIONS
2009-2010
89 ... … * … 19 31 … 9 17 10 … … …
2010-2011
80 ... … * … 18 21 … … 21 16 … … …
2011-2012
84 ... … * … 19 30 … * 15 16 … … …
2012-2013
73 … … … … 14 33 … * 14 8 … … …
2013-2014
84 … … … … 30 20 * * 19 9 … … …
ENROLMENT
2009-2010
488 … … 20 … 100 155 … 54 112 47 … … …
2010-2011
480 … … 21 … 92 178 … … 125 64 … … …
2011-2012
447 … … 18 … 92 155 … 9 101 72 … … …
2012-2013
445 … … 16 … 88 171 6 14 91 59 … … …
2013-2014
395 … … 11 … 114 104 10 14 94 48 … … …
GRADUATES
2010
39 ... ... * ... 12 14 ... * 8 * ... ... ...
2011
89 ... ... * ... 12 51 ... … 19 6 ... ... ...
2012
66 ... ... * ... 11 25 ... 9 14 6 ... ... ...
2013
61 … … * … 10 26 … … 11 10 … … …
2014
58 … … * … 14 21 … * 13 6 … … …
37 Nursing Education Statistics 2013-2014
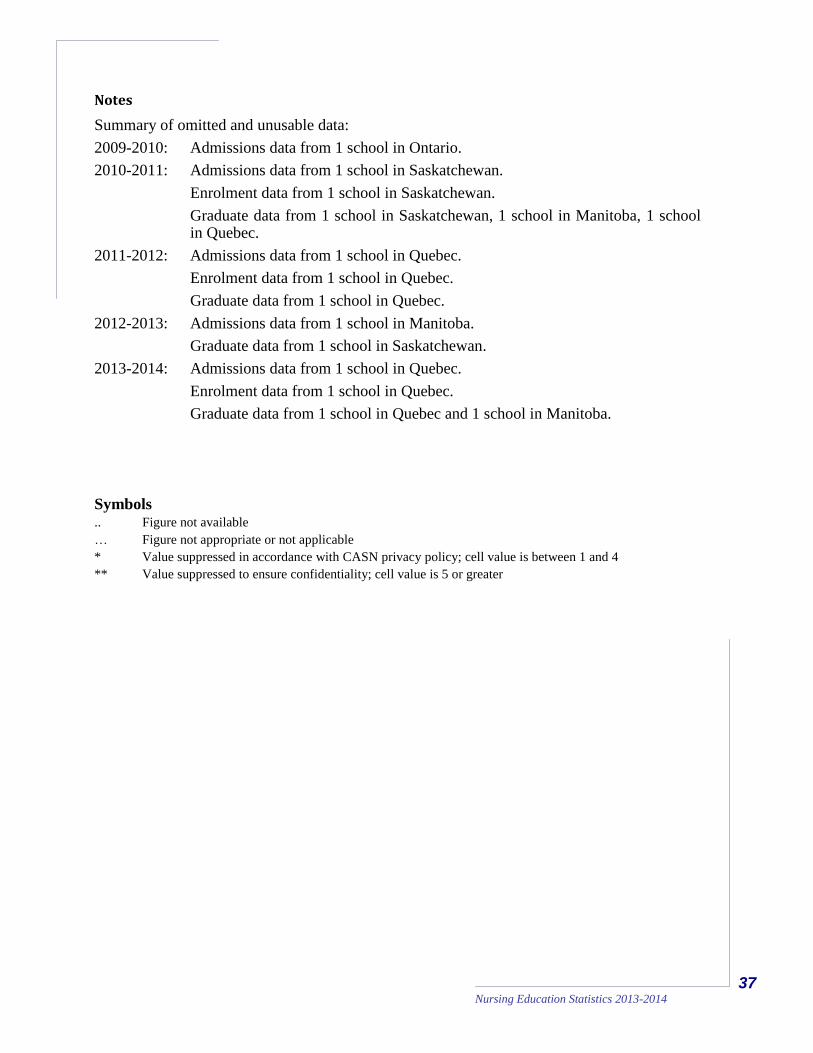
Notes
Summary of omitted and unusable data:
2009-2010: Admissions data from 1 school in Ontario.
2010-2011: Admissions data from 1 school in Saskatchewan.
Enrolment data from 1 school in Saskatchewan.
Graduate data from 1 school in Saskatchewan, 1 school in Manitoba, 1 school in Quebec.
2011-2012: Admissions data from 1 school in Quebec.
Enrolment data from 1 school in Quebec.
Graduate data from 1 school in Quebec.
2012-2013: Admissions data from 1 school in Manitoba.
Graduate data from 1 school in Saskatchewan.
2013-2014: Admissions data from 1 school in Quebec.
Enrolment data from 1 school in Quebec.
Graduate data from 1 school in Quebec and 1 school in Manitoba.
Symbols .. Figure not available
… Figure not appropriate or not applicable
* Value suppressed in accordance with CASN privacy policy; cell value is between 1 and 4
** Value suppressed to ensure confidentiality; cell value is 5 or greater
38
Nursing Education Statistics 2013-2014
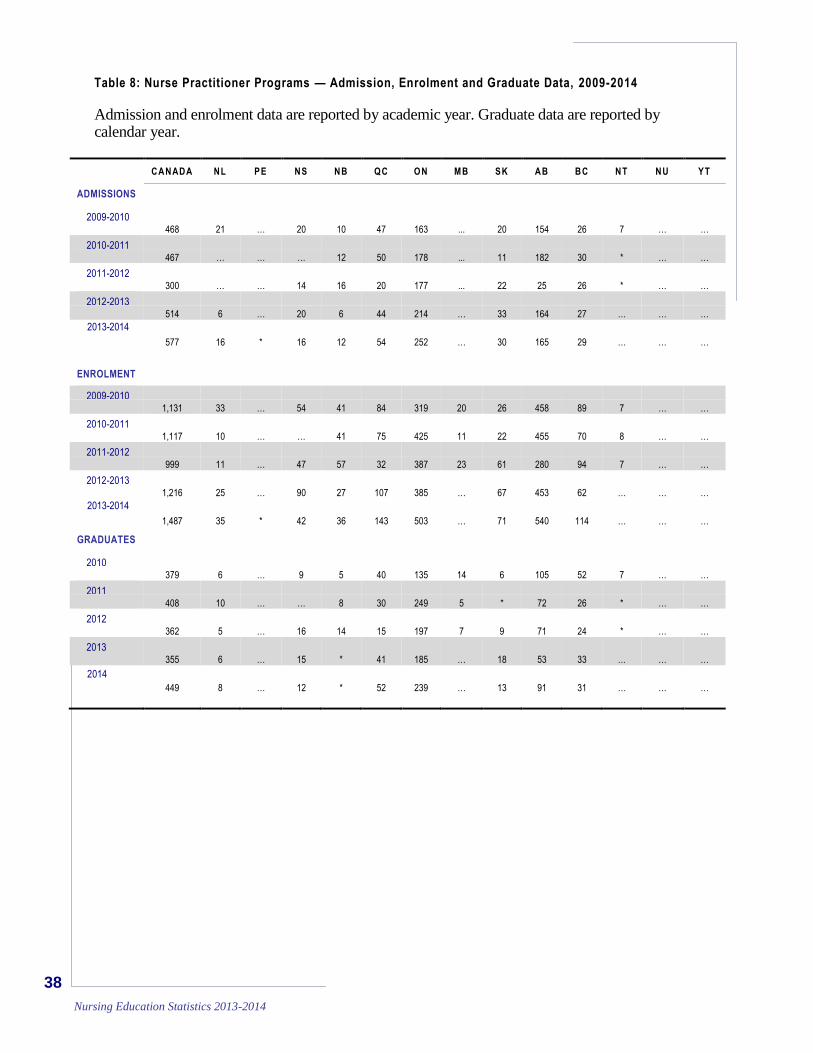
Table 8: Nurse Practitioner Programs — Admission, Enrolment and Graduate Data, 2009-2014
Admission and enrolment data are reported by academic year. Graduate data are reported by calendar year.
CANADA NL PE NS NB QC ON MB SK AB BC NT NU YT
ADMISSIONS
2009-2010
468 21 … 20 10 47 163 ... 20 154 26 7 … …
2010-2011
467 … … … 12 50 178 ... 11 182 30 * … …
2011-2012
300 … … 14 16 20 177 ... 22 25 26 * … …
2012-2013
514 6 … 20 6 44 214 … 33 164 27 … … …
2013-2014
577 16 * 16 12 54 252 … 30 165 29 … … …
ENROLMENT
2009-2010
1,131 33 … 54 41 84 319 20 26 458 89 7 … …
2010-2011
1,117 10 … … 41 75 425 11 22 455 70 8 … …
2011-2012
999 11 … 47 57 32 387 23 61 280 94 7 … …
2012-2013
1,216 25 … 90 27 107 385 … 67 453 62 … … …
2013-2014
1,487 35 * 42 36 143 503 … 71 540 114 … … …
GRADUATES
2010
379 6 … 9 5 40 135 14 6 105 52 7 … …
2011
408 10 … … 8 30 249 5 * 72 26 * … …
2012
362 5 … 16 14 15 197 7 9 71 24 * … …
2013
355 6 … 15 * 41 185 … 18 53 33 … … …
2014
449 8 … 12 * 52 239 … 13 91 31 … … …

39 Nursing Education Statistics 2013-2014
Notes
Summary of omitted and unusable data:
2009-2010: Admissions data from 1 school in Newfoundland, 1 school in the Northwest Territories.
Enrolment data from 1 school in Newfoundland, 1 school in the Northwest Territories.
Graduate data from 1 school in Newfoundland.
2010-2011: Admissions data from 1 school in British Columbia, 1 school in Manitoba, 1 school in Saskatchewan.
Enrolment data from 1 school in Saskatchewan.
Graduate data from 1 school in Saskatchewan.
2011-2012: Admissions data from 1 school in British Columbia, 1 school in Alberta, 1 school in Manitoba, 1 school in Ontario, and 2 school in Nova Scotia.
Enrolment data from 1 school in Nova Scotia, and 1 school in British Columbia.
Graduate data from 1 school in Nova Scotia.
2012-2013: Admissions data from 1 school in Manitoba, 1 school in British Columbia
Enrolment data from 1 school in British Columbia.
2013-2014: Admissions data from 1 school in Newfoundland and Labrador and 1 school in Manitoba.
Enrolment data from 1 school in Newfoundland and Labrador.
Graduate data from 1 school in New Brunswick and 1 school in Newfoundland and Labrador.
Symbols .. Figure not available … Figure not appropriate or not applicable
* Value suppressed in accordance with CASN privacy policy; cell value is between 1 and 4
** Value suppressed to ensure confidentiality; cell value is 5 or greater
40
Nursing Education Statistics 2013-2014
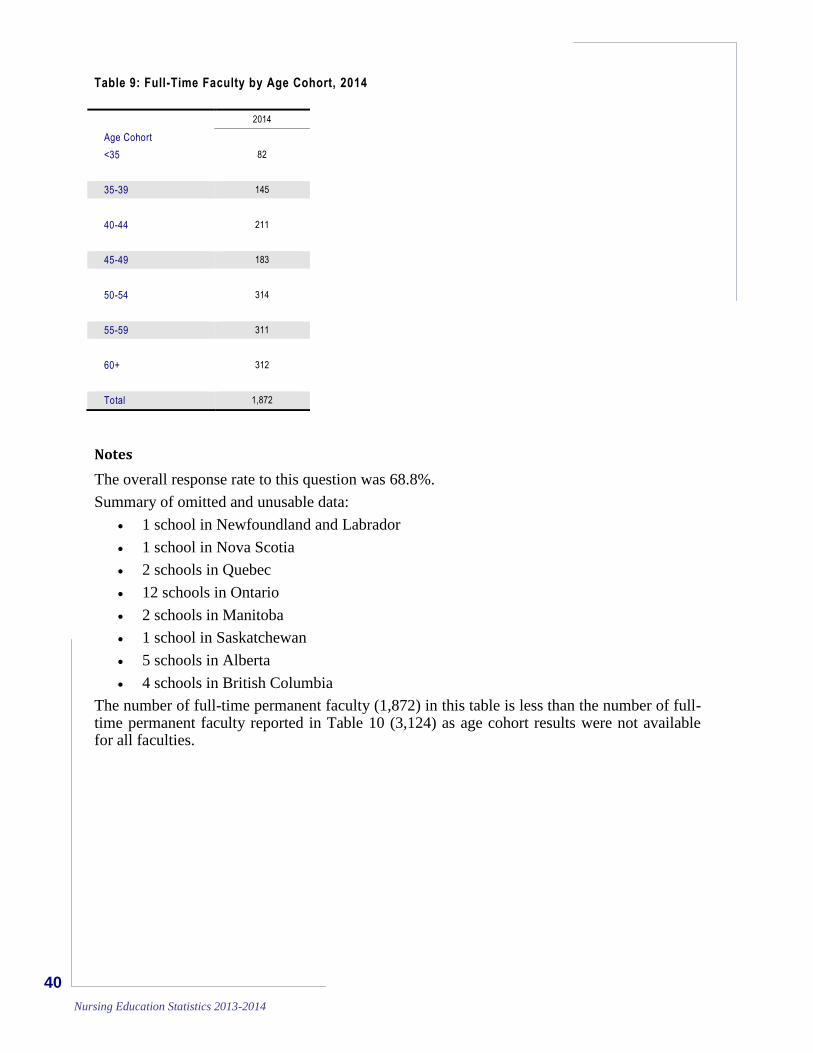
Table 9: Full-Time Faculty by Age Cohort, 2014
2014
Age Cohort
<35 82
35-39 145
40-44 211
45-49 183
50-54 314
55-59 311
60+ 312
Total 1,872
Notes
The overall response rate to this question was 68.8%.
Summary of omitted and unusable data:
1 school in Newfoundland and Labrador
1 school in Nova Scotia
2 schools in Quebec
12 schools in Ontario
2 schools in Manitoba
1 school in Saskatchewan
5 schools in Alberta
4 schools in British Columbia
The number of full-time permanent faculty (1,872) in this table is less than the number of full-time permanent faculty reported in Table 10 (3,124) as age cohort results were not available for all faculties.
41 Nursing Education Statistics 2013-2014
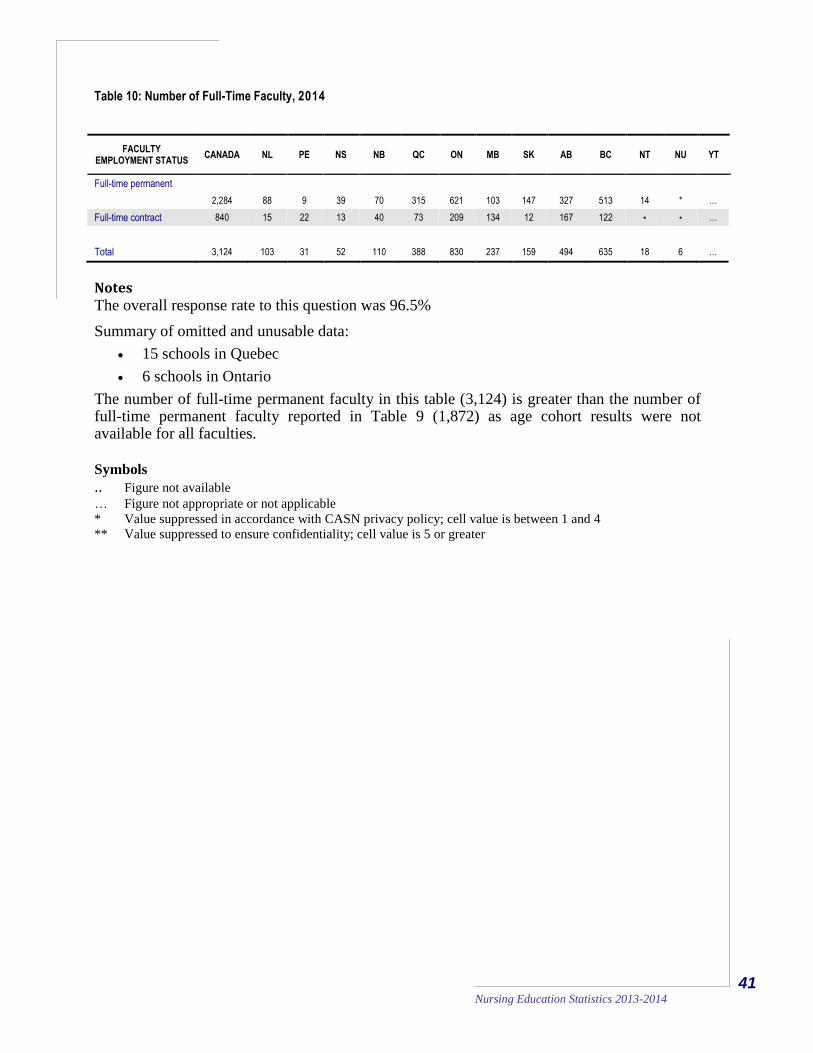
Table 10: Number of Full-Time Faculty, 2014
FACULTY EMPLOYMENT STATUS
CANADA NL PE NS NB QC ON MB SK AB BC NT NU YT
Full-time permanent
2,284 88 9 39 70 315 621 103 147 327 513 14 * …
Full-time contract 840 15 22 13 40 73 209 134 12 167 122 * * …
Total 3,124 103 31 52 110 388 830 237 159 494 635 18 6 …
Notes The overall response rate to this question was 96.5%
Summary of omitted and unusable data:
15 schools in Quebec
6 schools in Ontario
The number of full-time permanent faculty in this table (3,124) is greater than the number of full-time permanent faculty reported in Table 9 (1,872) as age cohort results were not available for all faculties.
Symbols
.. Figure not available … Figure not appropriate or not applicable
* Value suppressed in accordance with CASN privacy policy; cell value is between 1 and 4
** Value suppressed to ensure confidentiality; cell value is 5 or greater
42
Nursing Education Statistics 2013-2014
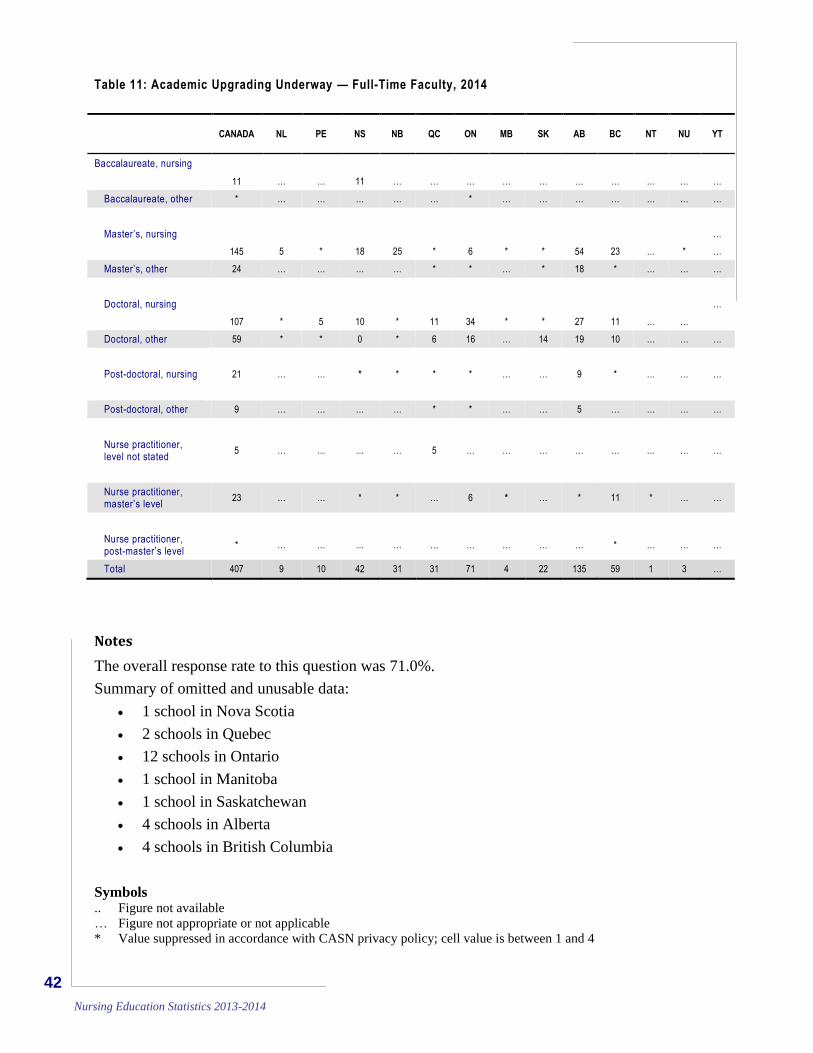
Table 11: Academic Upgrading Underway — Full-Time Faculty, 2014
CANADA NL PE NS NB QC ON MB SK AB BC NT NU YT
Baccalaureate, nursing
11 … … 11 … … … … … … … … … …
Baccalaureate, other * … … … … … * … … … … … … …
Master’s, nursing …
145 5 * 18 25 * 6 * * 54 23 … * …
Master’s, other 24 … … … … * * … * 18 * … … …
Doctoral, nursing …
107 * 5 10 * 11 34 * * 27 11 … …
Doctoral, other 59 * * 0 * 6 16 … 14 19 10 … … …
Post-doctoral, nursing 21 … … * * * * … … 9 * … … …
Post-doctoral, other 9 … … … … * * … … 5 … … … …
Nurse practitioner, level not stated
5 … … … … 5 … … … … … … … …
Nurse practitioner, master’s level
23 … … * * … 6 * … * 11 * … …
Nurse practitioner, post-master’s level
* … … … … … … … … … * … … …
Total 407 9 10 42 31 31 71 4 22 135 59 1 3 …
Notes
The overall response rate to this question was 71.0%.
Summary of omitted and unusable data:
1 school in Nova Scotia
2 schools in Quebec
12 schools in Ontario
1 school in Manitoba
1 school in Saskatchewan
4 schools in Alberta
4 schools in British Columbia
Symbols .. Figure not available
… Figure not appropriate or not applicable
* Value suppressed in accordance with CASN privacy policy; cell value is between 1 and 4
43 Nursing Education Statistics 2013-2014
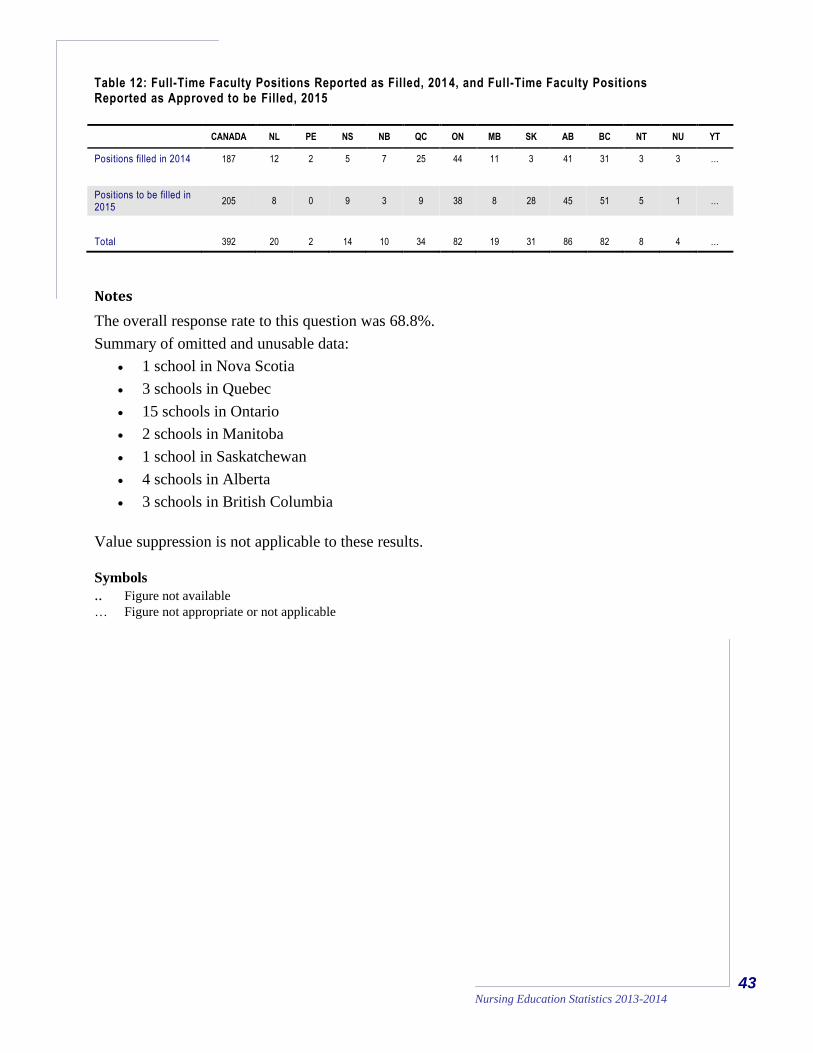
Table 12: Full-Time Faculty Positions Reported as Filled, 2014, and Full-Time Faculty Positions Reported as Approved to be Filled, 2015
CANADA NL PE NS NB QC ON MB SK AB BC NT NU YT
Positions filled in 2014 187 12 2 5 7 25 44 11 3 41 31 3 3 …
Positions to be filled in 2015
205 8 0 9 3 9 38 8 28 45 51 5 1 …
Total 392 20 2 14 10 34 82 19 31 86 82 8 4 …
Notes
The overall response rate to this question was 68.8%.
Summary of omitted and unusable data:
1 school in Nova Scotia
3 schools in Quebec
15 schools in Ontario
2 schools in Manitoba
1 school in Saskatchewan
4 schools in Alberta
3 schools in British Columbia
Value suppression is not applicable to these results.
Symbols
.. Figure not available … Figure not appropriate or not applicable
44
Nursing Education Statistics 2013-2014
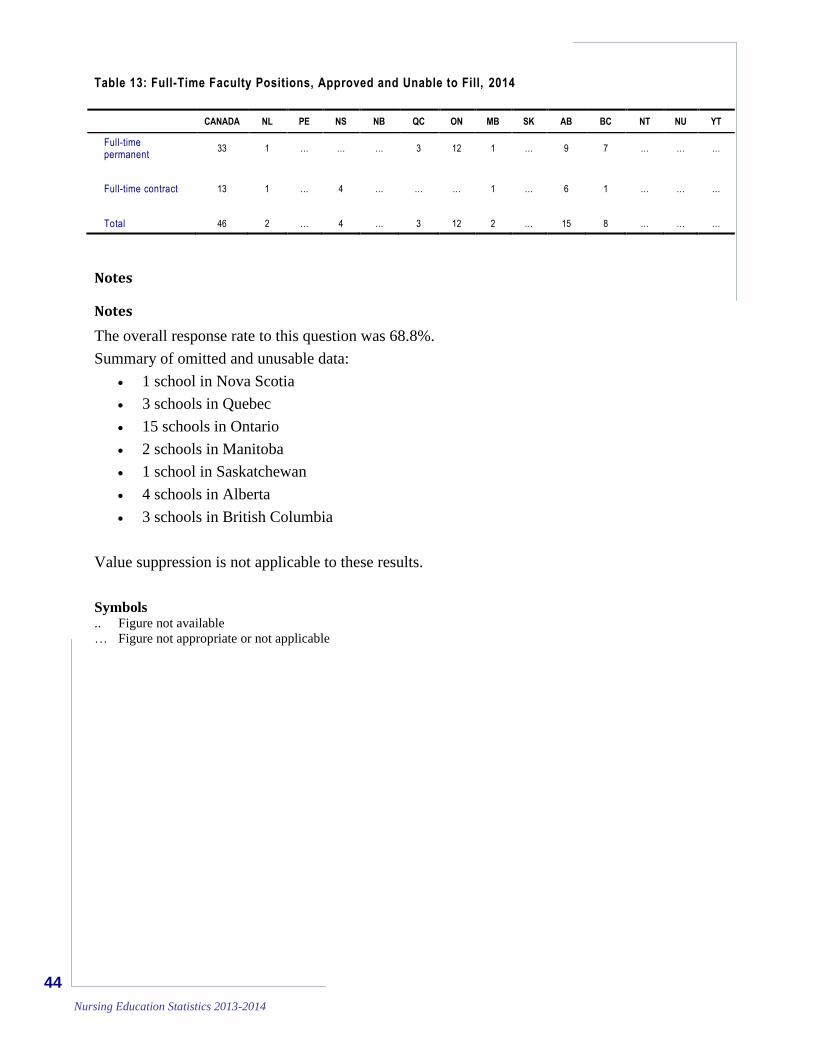
Table 13: Full-Time Faculty Positions, Approved and Unable to Fill, 2014
CANADA NL PE NS NB QC ON MB SK AB BC NT NU YT
Full-time permanent
33 1 … … … 3 12 1 … 9 7 … … …
Full-time contract 13 1 … 4 … … … 1 … 6 1 … … …
Total 46 2 … 4 … 3 12 2 … 15 8 … … …
Notes
Notes
The overall response rate to this question was 68.8%.
Summary of omitted and unusable data:
1 school in Nova Scotia
3 schools in Quebec
15 schools in Ontario
2 schools in Manitoba
1 school in Saskatchewan
4 schools in Alberta
3 schools in British Columbia
Value suppression is not applicable to these results.
Symbols .. Figure not available
… Figure not appropriate or not applicable
45 Nursing Education Statistics 2013-2014
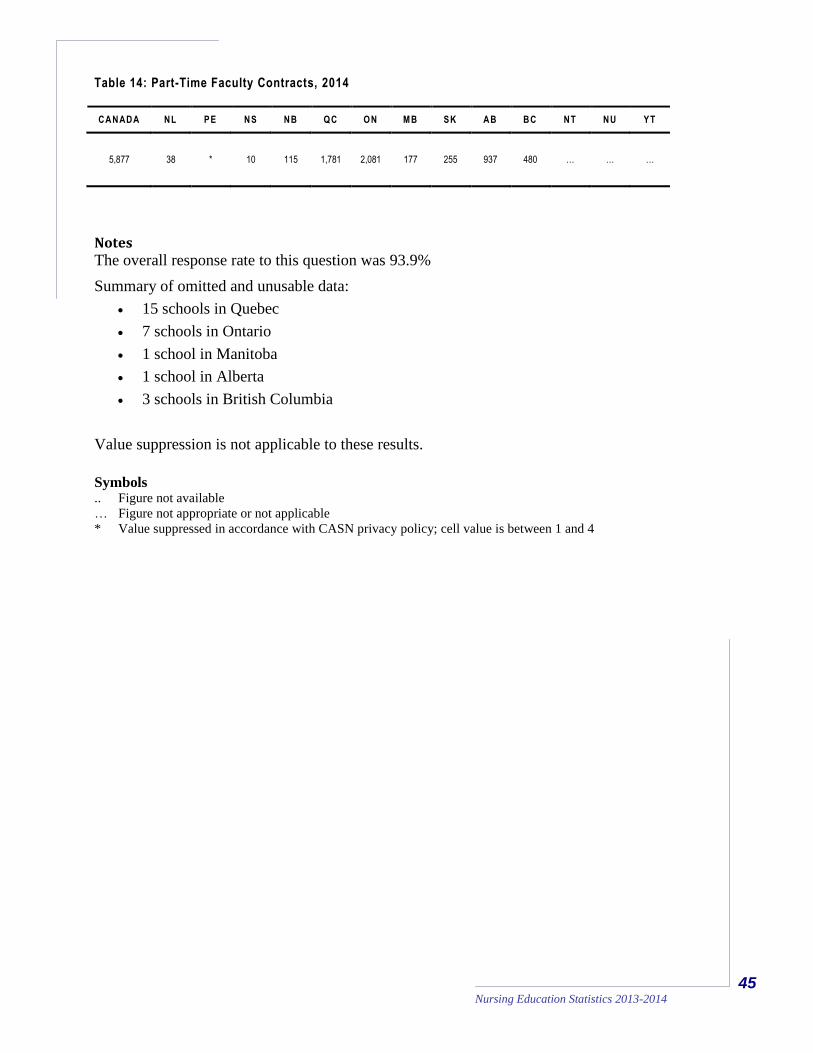
Table 14: Part-Time Faculty Contracts, 2014
CANADA NL PE NS NB QC ON MB SK AB BC NT NU YT
5,877 38 * 10 115 1,781 2,081 177 255 937 480 … … …
Notes The overall response rate to this question was 93.9%
Summary of omitted and unusable data:
15 schools in Quebec
7 schools in Ontario
1 school in Manitoba
1 school in Alberta
3 schools in British Columbia
Value suppression is not applicable to these results.
Symbols .. Figure not available
… Figure not appropriate or not applicable
* Value suppressed in accordance with CASN privacy policy; cell value is between 1 and 4
46
Nursing Education Statistics 2013-2014
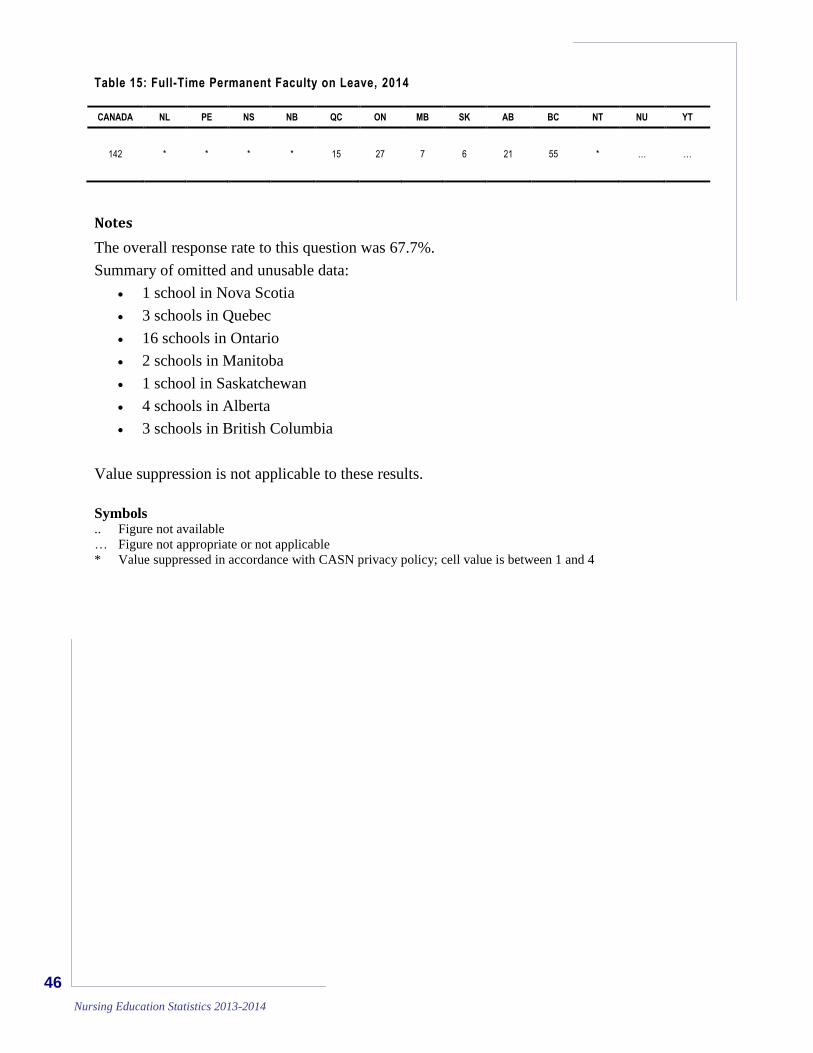
Table 15: Full-Time Permanent Faculty on Leave, 2014
CANADA NL PE NS NB QC ON MB SK AB BC NT NU YT
142 * * * * 15 27 7 6 21 55 * … …
Notes
The overall response rate to this question was 67.7%.
Summary of omitted and unusable data:
1 school in Nova Scotia
3 schools in Quebec
16 schools in Ontario
2 schools in Manitoba
1 school in Saskatchewan
4 schools in Alberta
3 schools in British Columbia
Value suppression is not applicable to these results.
Symbols .. Figure not available
… Figure not appropriate or not applicable
* Value suppressed in accordance with CASN privacy policy; cell value is between 1 and 4
47 Nursing Education Statistics 2013-2014
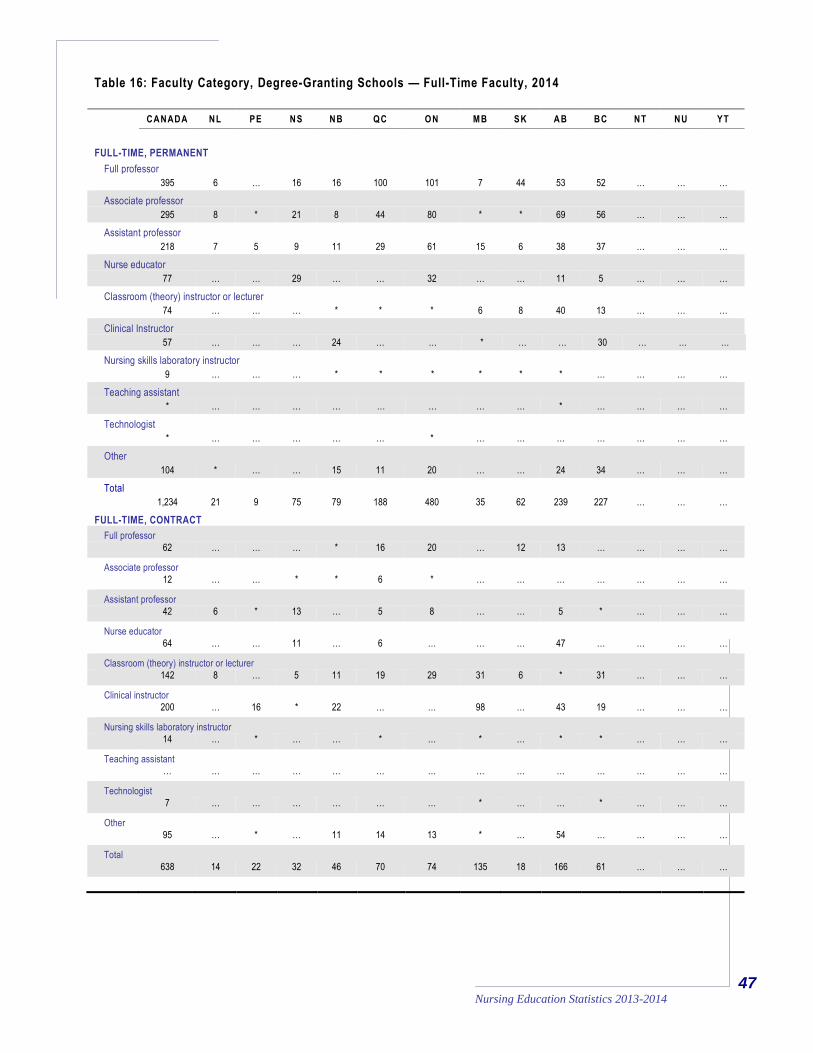
Table 16: Faculty Category, Degree-Granting Schools — Full-Time Faculty, 2014
CANADA NL PE NS NB QC ON MB SK AB BC NT NU YT
FULL-TIME, PERMANENT
Full professor
395 6 … 16 16 100 101 7 44 53 52 … … …
Associate professor
295 8 * 21 8 44 80 * * 69 56 … … …
Assistant professor
218 7 5 9 11 29 61 15 6 38 37 … … …
Nurse educator
77 … … 29 … … 32 … … 11 5 … … …
Classroom (theory) instructor or lecturer
74 … … … * * * 6 8 40 13 … … …
Clinical Instructor
57 … … … 24 … … * … … 30 … … …
Nursing skills laboratory instructor
9 … … … * * * * * * … … … …
Teaching assistant
* … … … … … … … … * … … … …
Technologist
* … … … … … * … … … … … … …
Other
104 * … … 15 11 20 … … 24 34 … … …
Total
1,234 21 9 75 79 188 480 35 62 239 227 … … …
FULL-TIME, CONTRACT
Full professor
62 … … … * 16 20 … 12 13 … … … …
Associate professor
12 … … * * 6 * … … … … … … …
Assistant professor
42 6 * 13 … 5 8 … … 5 * … … …
Nurse educator
64 … … 11 … 6 … … … 47 … … … …
Classroom (theory) instructor or lecturer
142 8 … 5 11 19 29 31 6 * 31 … … …
Clinical instructor
200 … 16 * 22 … … 98 … 43 19 … … …
Nursing skills laboratory instructor
14 … * … … * … * … * * … … …
Teaching assistant
… … … … … … … … … … … … … …
Technologist
7
7
… … … … … … * … … * … … …
Other
95 … * … 11 14 13 * … 54 … … … …
Total
638 14 22 32 46 70 74 135 18 166 61 … … …
48
Nursing Education Statistics 2013-2014
Notes The overall response rate to this question was 96.5%
Summary of omitted and unusable data:
6 schools in Quebec
6 schools in Ontario
1 school in Manitoba
2 schools in British Columbia
Symbols .. Figure not available
… Figure not appropriate or not applicable
* Value suppressed in accordance with CASN privacy policy; cell value is between 1 and 4
** Value suppressed to ensure confidentiality; cell value is 5 or greater
49 Nursing Education Statistics 2013-2014
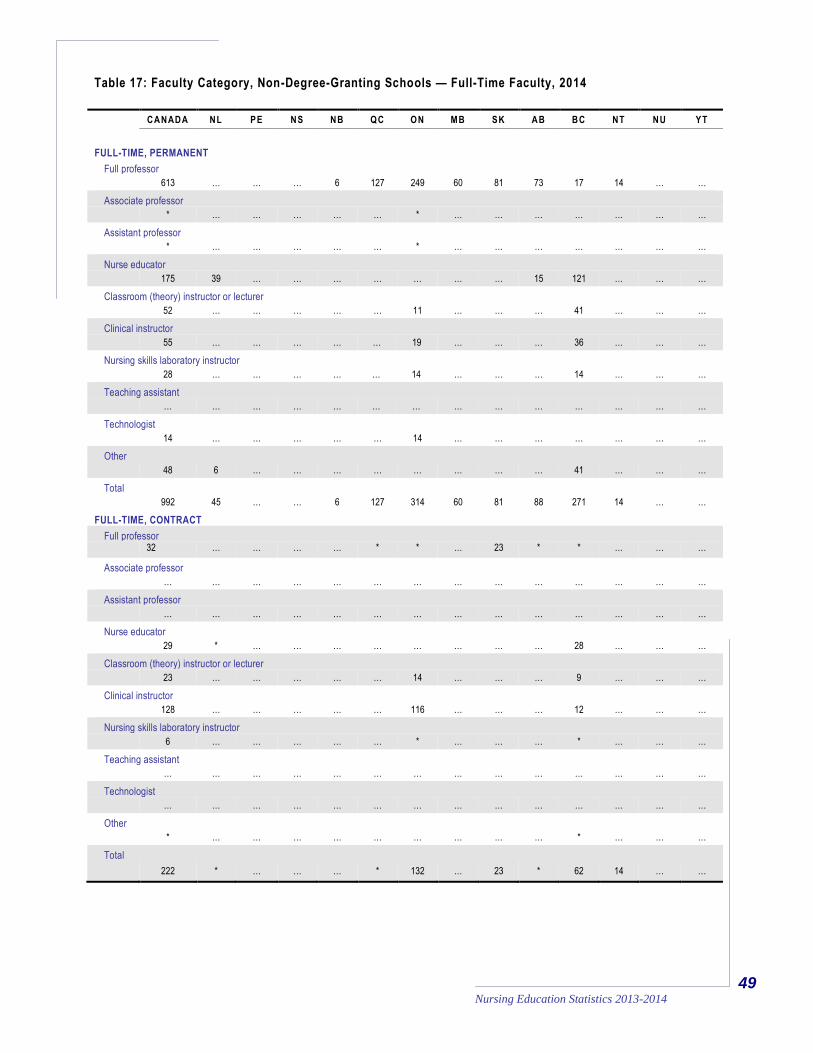
Table 17: Faculty Category, Non-Degree-Granting Schools — Full-Time Faculty, 2014
CANADA NL PE NS NB QC ON MB SK AB BC NT NU YT
FULL-TIME, PERMANENT
Full professor
613 … … … 6 127 249 60 81 73 17 14 … …
Associate professor
* … … … … … * … … … … … … …
Assistant professor
* … … … … … * … … … … … … …
Nurse educator
175 39 … … … … … … … 15 121 … … …
Classroom (theory) instructor or lecturer
52 … … … … … 11 … … … 41 … … …
Clinical instructor
55 … … … … … 19 … … … 36 … … …
Nursing skills laboratory instructor
28 … … … … … 14 … … … 14 … … …
Teaching assistant
… … … … … … … … … … … … … …
Technologist
14 … … … … … 14 … … … … … … …
Other
48 6 … … … … … … … … 41 … … …
Total
992 45 … … 6 127 314 60 81 88 271 14 … …
FULL-TIME, CONTRACT
Full professor
32 … … … … * * … 23 * * … … …
Associate professor
… … … … … … … … … … … … … …
Assistant professor
… … … … … … … … … … … … … …
Nurse educator
29 * … … … … … … … … 28 … … …
Classroom (theory) instructor or lecturer
23 … … … … … 14 … … … 9 … … …
Clinical instructor
128 … … … … … 116 … … … 12 … … …
Nursing skills laboratory instructor
6 … … … … … * … … … * … … …
Teaching assistant
… … … … … … … … … … … … … …
Technologist
… … … … … … … … … … … … … …
Other
* … … … … … … … … … * … … …
Total
222 * … … … * 132 … 23 * 62 14 … …
50
Nursing Education Statistics 2013-2014
Notes The overall response rate to this question was 96.5%
Summary of omitted and unusable data:
6 schools in Quebec
6 schools in Ontario
1 school in Manitoba
2 schools in British Columbia
Symbols .. Figure not available
… Figure not appropriate or not applicable
* Value suppressed in accordance with CASN privacy policy; cell value is between 1 and 4
** Value suppressed to ensure confidentiality; cell value is 5 or greater

51 Nursing Education Statistics 2013-2014
Table 18: Highest Academic Credential — Full-Time Faculty, 2014
CREDENT IAL CANADA NL PE NS NB QC ON MB SK AB BC NT NU YT
Diploma, nursing * … … … … … … * … … … … … …
Diploma, other
… … … … … … … … … … … … … …
Baccalaureate, nursing 341 10 15 22 33 10 30 11 14 93 97 8 6 …
Baccalaureate, other
6 … … … … * … * * * * … … …
Master’s, nursing 888 61 10 25 31 56 263 7 53 141 242 7 * …
Master’s, other 336 8 … * 9 6 113 * 32 60 102 * … …
Doctoral, nursing 334 8 5 22 13 47 97 13 … 64 64 * … …
Doctoral, other 265 11 … 6 14 61 91 20 * 33 24 … * …
Post-doctoral, nursing 48 … … 6 * 8 12 … … 13 7 … … …
Post-doctoral, other 26 … … * … 12 * … … 6 * … … …
Notes
The overall response rate to this question was 71.0%.
Summary of omitted and unusable data:
1 school in Nova Scotia
3 schools in Quebec
12 schools in Ontario
1 school in Manitoba
1 school in Saskatchewan
4 schools in Alberta
4 schools in British Columbia
Symbols
.. Figure not available … Figure not appropriate or not applicable
* Value suppressed in accordance with CASN privacy policy; cell value is between 1 and 4
** Value suppressed to ensure confidentiality; cell value is 5 or greater
52
Nursing Education Statistics 2013-2014
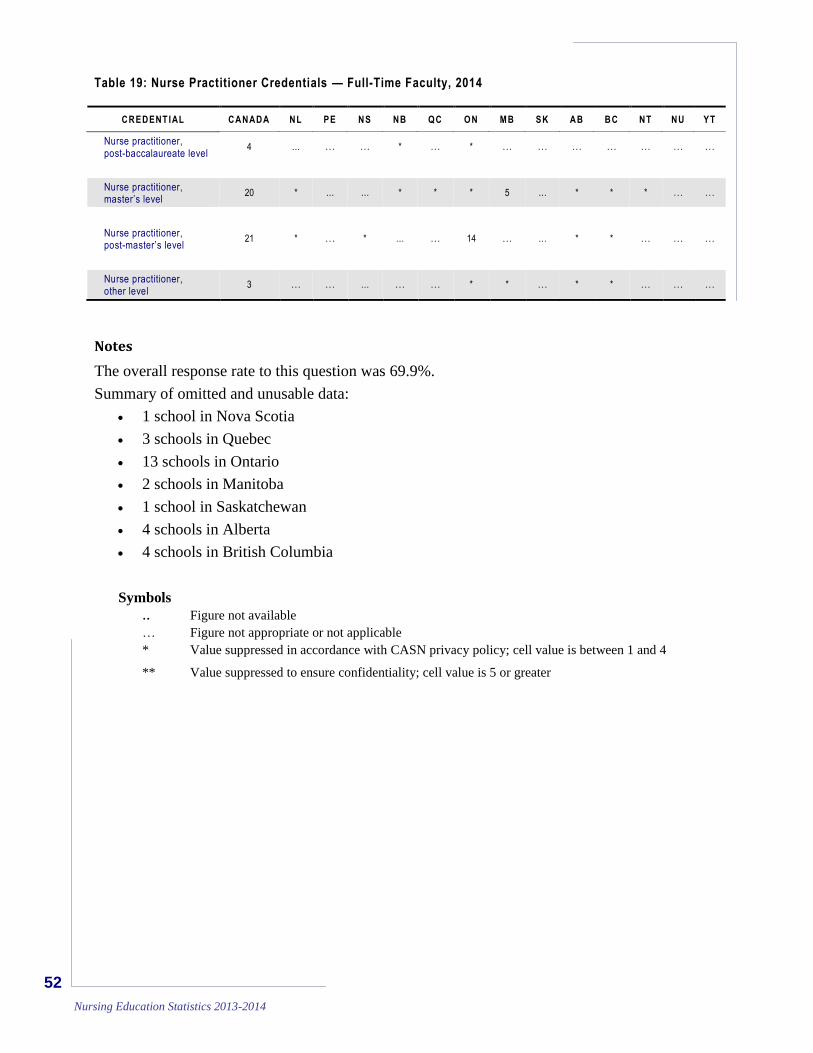
Table 19: Nurse Practitioner Credentials — Full-Time Faculty, 2014
CREDENT IAL CANADA NL PE NS NB QC ON MB SK AB BC NT NU YT
Nurse practitioner, post-baccalaureate level
4 … … … * … * … … … … … … …
Nurse practitioner, master’s level
20 * … … * * * 5 … * * * … …
Nurse practitioner, post-master’s level
21 * … * … … 14 … … * * … … …
Nurse practitioner, other level
3 … … … … … * * … * * … … …
Notes
The overall response rate to this question was 69.9%.
Summary of omitted and unusable data:
1 school in Nova Scotia
3 schools in Quebec
13 schools in Ontario
2 schools in Manitoba
1 school in Saskatchewan
4 schools in Alberta
4 schools in British Columbia
Symbols
.. Figure not available … Figure not appropriate or not applicable
* Value suppressed in accordance with CASN privacy policy; cell value is between 1 and 4
** Value suppressed to ensure confidentiality; cell value is 5 or greater
53 Nursing Education Statistics 2013-2014
Methodological Notes — Survey Tables
Classification of nursing programs
Programs are identified by a standard data code, which allows the RN education data to be attributed to one of six program categories.
Diploma Diploma, Diploma Exit option, PN to RN, LPN to RN, DEC Baccalaureate: Standard, Generic, Collaborative, Accelerated, Fast Track, Advanced,
Second Degree Entry, Compressed, LPN to RN and RPN to RN Baccalaureate
Post-RN: Post-RN Baccalaureate, DEC-BACC Master’s: Master’s in Nursing, DESS Doctoral: Doctorate in Nursing Nurse Practitioner:* Nurse Practitioner, NP integrated with a degree program, e.g., MN/NP
*NP programs may be combined with or integrated into master’s degree programs, and schools may or may not report separate data for these integrated programs. Where the data are reported separately it is recorded under both the NP program and the master’s program.
Collection Period
Program inventory, admission and enrolment data are collected on the academic year. This year’s collection is for the 2013-2014 academic year.
Graduate and faculty data are collected on the calendar year. This year’s collection captures these data for calendar year 2014.
Data Collection Terms
Admission: Admission results are calculated by totalling the number of first-time nursing students admitted to Year 1 of the program plus the number of advanced entrant students admitted in any year of the program.
Admission results include data for each intake offered throughout the course of an academic year.
Schools are asked to report admission results after the allowed withdrawal date of their institution.
Enrolment: Enrolment results are a count of the number of students enrolled in each year of
study.
Enrolment results include data for each intake offered throughout the course of an academic year.
Schools are asked to report enrolment results after the allowed withdrawal date of their institution.
54
Nursing Education Statistics 2013-2014
Entry-to-Practice Programs: Entry-to-practice (RN-ETP) programs entitle the successful graduate to apply
for licensure/registration. RN-ETP programs include diploma, generic baccalaureate and entry-to-practice master’s.
Graduates: Graduate results are calculated by totalling the number of degrees awarded by
each institution throughout a calendar year.
See Appendix A for a list of the definitions provided to all schools.
Data Limitations
Data included in the survey tables are as reported by the schools that responded to the survey. See “Survey Response” below for details on annual response rates.
Schools sometimes provide data that are unusable or fail to report requested data. Each table is accompanied by a summary of omitted data.
Out-of-Province/Territory Partnerships
Colleges and universities may establish program delivery partnerships that cross provincial or territorial boundaries. In 2007, the treatment of graduate data from program delivery partnerships that cross provincial or territorial boundaries was amended so that graduate results would be recorded in the student’s home province or territory. Admission and enrolment data continue to be recorded according to the program delivery responsibility of each partner. The handling of admission and enrolment data did not change. Historical graduate data have been adjusted accordingly. Please see “Survey Methodology” for additional details. Out-of-province/territory baccalaureate collaborative partnerships as of 2013-2014 include: Aurora College, N.W.T., partnered with the University of Victoria, B.C.; Université de Saint-Boniface, M.B., partnered with University of Ottawa / Université d’Ottawa. Ont.; Nunavut Arctic College, Nunavut, partnered with Dalhousie University, N.S.; and Humber College, Ont., partnered with the University of New Brunswick, N.B.
Out-of-province/territory master’s NP stream collaborative partnerships as of 2013-2014
include: Aurora College, N.W.T., partnered with Dalhousie, N.S.
Survey Response
2009-2010: The survey was issued to all 135 schools offering nursing programs; 111 schools completed the survey; 1 Ontario college (1 ETP baccalaureate programs) and 1 Quebec university (1 ETP baccalaureate programs, 1 post-RN baccalaureate program, and 1 master’s program) and 21 Quebec CEGEPs/colleges (21 ETP diploma programs) did not complete the survey. The overall survey response rate was 82%; the CASN member response rate was 92%. See the tables starting on page 20 for more detailed information about omitted or unusable data. On average, 69.1% of schools responded to the faculty questions.
2010-2011: The survey was issued to all 135 schools offering nursing programs; 111 schools completed the survey; 1 Ontario university (1 ETP baccalaureate program, 1 post RN Baccalaureate program, 1 master’s program, and 1 NP program), 2 Ontario colleges (2 ETP baccalaureate programs) and 1 Quebec university (1 ETP baccalaureate programs, 1 post-RN baccalaureate program, and 1 master’s program) and 20 Quebec CEGEPs/colleges (20 ETP diploma programs) did not complete the survey. The overall survey response rate was 82%;
55 Nursing Education Statistics 2013-2014
the CASN member response rate was 92%. See the tables starting on page 20 for more detailed information about omitted or unusable data. On average, 66.0% of schools responded to the faculty questions.
2011-2012: The survey was issued to all 135 schools offering nursing programs; 111 schools completed the survey; 4 Ontario colleges (4 ETP baccalaureate programs) and 1 Quebec university (1 ETP baccalaureate programs, 1 post-RN baccalaureate program, and 1 master’s program) and 17 Quebec CEGEPs/colleges (17 ETP diploma programs), 2 British Columbia colleges (2 ETP baccalaureate programs, 1 post-RN baccalaureate program) did not complete the survey. The overall survey response rate was 82%; the CASN member response rate was 93%. See the tables starting on page 20 for more detailed information about omitted or unusable data. On average, 74.9% of schools responded to the faculty questions.
2012-2013: The survey was issued to the 135 schools of nursing offering programs; 114 schools completed the survey; The overall survey response rate was 84.4%; the CASN member response rate was 91.4%. See the tables starting on page 22 for more detailed information about omitted or unusable data. On average, 72.3% of schools responded to the faculty questions.
2013-2014: The survey was issued to the 134 schools of nursing offering programs; 114 schools completed the survey; The overall survey response rate was 85.1%; the CASN member response rate was 94.6%. See the tables starting on page 22 for more detailed information about omitted or unusable data. On average, 72.0% of schools responded to the faculty questions.
Privacy and Confidentiality
In accordance CASN’s privacy policies, small cell entries between 1 and 4 are not reported. Some cell values of 5 or greater have also been suppressed to protect confidentiality.
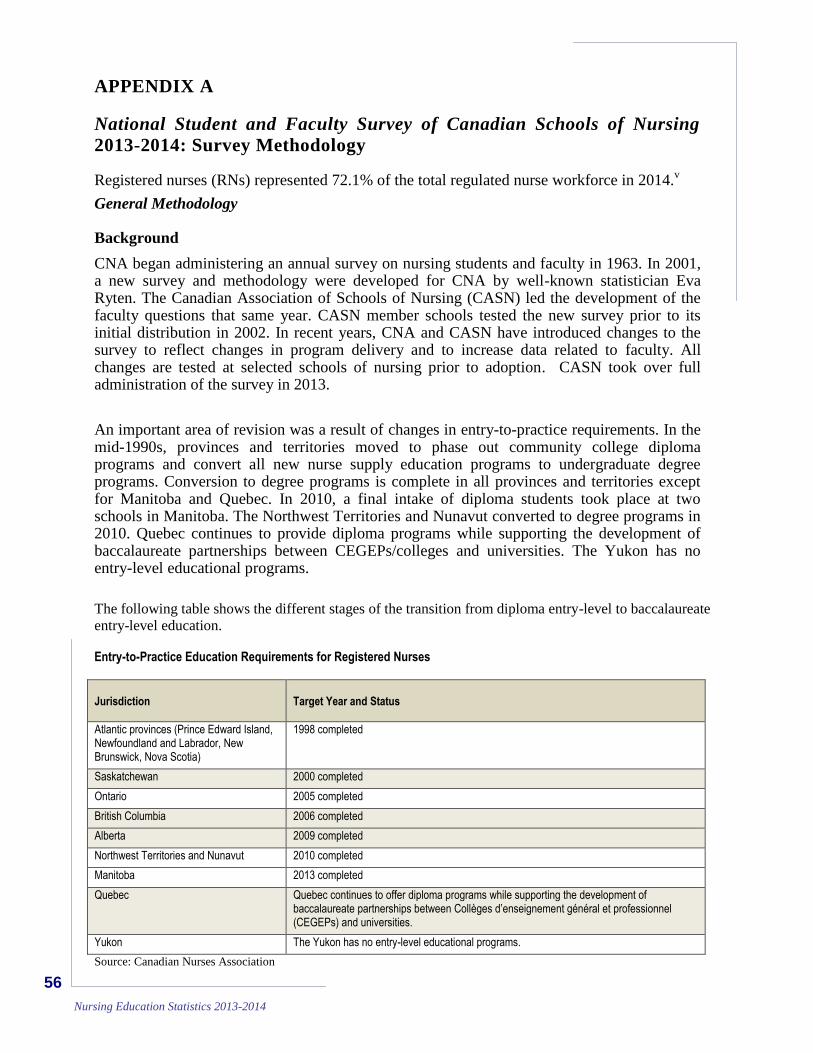
56
Nursing Education Statistics 2013-2014
APPENDIX A
National Student and Faculty Survey of Canadian Schools of Nursing
2013-2014: Survey Methodology
Registered nurses (RNs) represented 72.1% of the total regulated nurse workforce in 2014.v
General Methodology
Background
CNA began administering an annual survey on nursing students and faculty in 1963. In 2001, a new survey and methodology were developed for CNA by well-known statistician Eva Ryten. The Canadian Association of Schools of Nursing (CASN) led the development of the faculty questions that same year. CASN member schools tested the new survey prior to its initial distribution in 2002. In recent years, CNA and CASN have introduced changes to the survey to reflect changes in program delivery and to increase data related to faculty. All changes are tested at selected schools of nursing prior to adoption. CASN took over full administration of the survey in 2013.
An important area of revision was a result of changes in entry-to-practice requirements. In the mid-1990s, provinces and territories moved to phase out community college diploma programs and convert all new nurse supply education programs to undergraduate degree programs. Conversion to degree programs is complete in all provinces and territories except for Manitoba and Quebec. In 2010, a final intake of diploma students took place at two schools in Manitoba. The Northwest Territories and Nunavut converted to degree programs in 2010. Quebec continues to provide diploma programs while supporting the development of baccalaureate partnerships between CEGEPs/colleges and universities. The Yukon has no entry-level educational programs.
The following table shows the different stages of the transition from diploma entry-level to baccalaureate
entry-level education. Entry-to-Practice Education Requirements for Registered Nurses Jurisdiction
Target Year and Status
Atlantic provinces (Prince Edward Island, Newfoundland and Labrador, New Brunswick, Nova Scotia)
1998 completed
Saskatchewan 2000 completed
Ontario 2005 completed
British Columbia 2006 completed
Alberta 2009 completed
Northwest Territories and Nunavut 2010 completed
Manitoba 2013 completed
Quebec Quebec continues to offer diploma programs while supporting the development of baccalaureate partnerships between Collèges d’enseignement général et professionnel (CEGEPs) and universities.
Yukon The Yukon has no entry-level educational programs.
Source: Canadian Nurses Association
57 Nursing Education Statistics 2013-2014
The conversion from diploma to degree programs brought in its wake many statistical
complications. The mechanism adopted to convert from diploma to degree programs was the
introduction of collaborative degree programs. “Collaborative” refers to a relationship of
cooperation between a university and one or more college-level institutions. The extent and
type of collaboration models existing between a university and its collaborating partner or
partners vary greatly. For example, at one extreme, the university may be responsible only for
ensuring that the curriculum meets university degree standards, and the college may deliver
the entire curriculum on its sites. At the other extreme, the university may be heavily involved
not only in approving academic standards but also in delivering sizable amounts of the
curriculum on its campuses.
A data record linking process permits admission and enrolment data of programs delivered under a collaborative model to be linked to the graduate program data of the degree-granting partner. This approach allows for the statistical tracking of nursing students by qualification earned from the point of admission, by each year of enrolment, through to graduation. It also accommodates recent changes whereby some colleges now award baccalaureate degrees or have changed their institution type from college to university. Historical results have not been affected by these changes.
Data Collection
The survey requests information on the following:
Program inventory — covers all nursing programs leading to initial licensure (e.g., diploma, diploma exit, baccalaureate, collaborative baccalaureate) as well as formal programs furthering an RN’s education (e.g., post-RN, master’s, doctorate, nurse practitioner); includes distance education programs, multiple language offerings and multiple partnership arrangements. Collection period: academic year.
Graduates — by qualification earned, graduates by gender for each program listed in the program inventory, by partner, by site, where available. Collection period: calendar year.
Faculty demographics — details on faculty responsible for the delivery of programs listed in the program inventory, by gender, contract type, rank and status; these data include components such as highest academic credential, age cohorts, faculty on leave, average age of retirement, attrition other than retirement, and additional information on classroom ratios. Collection period: calendar year.
Admission and enrolment data are collected for the previous academic year to ensure that fall, winter and summer intake data are gathered. Graduate data are collected for the calendar year to align with annual licensing examination practices and health human resources planning. Admission and enrolment data are counted only after the school’s allowed withdrawal date.
The data are completed by the appropriate designate at each school, and are reviewed and approved by the dean, director, program head or equivalent. On receipt, the data are reviewed by CASN to ensure that all programs, sites, partners and data elements have been included. Comparisons are made to program inventories from previous years as well as program data listed on each school website to ensure that data are representative of all programs offered by the school.
Disparities are resolved by the CASN program lead and the faculty member(s) responsible for the data compiled. The dean, director, program head or equivalent validates the data’s accuracy and completeness, and approves the use of the data to prepare reports and to support research and policy decisions affecting the future supply of nurses in Canada.
58
Nursing Education Statistics 2013-2014
When data are not reported, the omitted data are sorted by data type and captured in one of two categories: (1) not available, or (2) not appropriate or applicable. Omitted data are identified in the reports.
In 2009, an online version of the survey was available to CASN members. In 2013-2014, the online survey was available to all schools of nursing along with online school-level reports.
Data Organization
As mentioned earlier, the data derived from the survey accommodate the increasing variety and complexity of nursing education models in Canada, including NP education models. The data are organized to allow for statistical trends to be tracked at provincial/territorial and national levels by qualification earned.
Another component of data organization accommodates the increasing variety of nurse practitioner (NP) programs. NP programs may be combined with or integrated into master’s degree programs, and schools may report separate data for these integrated programs. In these instances, data are recorded under the NP program. If the school is unable to provide the data separately (e.g., some integrated programs are reported such that all admission, enrolment and/or graduate data are included in the master’s program), then all the data are included under the master’s program.
Links are established between partners offering collaborative baccalaureate programs such that admission, enrolment and graduate data records mirror the delivery of each partner. A baccalaureate program is attributed to each partner offering a part of the baccalaureate program. This approach allows for the statistical tracking of nursing students by qualification earned from the point of admission, by each year of enrolment, at each partner site through to graduation. It also accommodates recent changes whereby some colleges now award baccalaureate degrees or have changed their institution type from college to university. Historical results have not been affected by these changes.
Colleges and universities may establish program delivery partnerships that cross provincial or territorial boundaries. In 2007, the treatment of graduate data from program delivery partnerships that cross provincial or territorial boundaries was amended so that graduate results would be recorded in the student’s home province or territory. Admission and enrolment data continue to be recorded according to the program delivery responsibility of each partner. The handling of admission and enrolment data did not change. Historical graduate data have been adjusted accordingly. Please see “Survey Methodology” for additional details.
Tables
The survey data are summarized in 19 tables for distribution to schools of nursing and interested parties (e.g., CASN member schools, researchers, government departments). Each table contains important notes covering data scope, updates to previous years’ data, omissions and acknowledgments.
It is important to review the program names included in each of the program categories listed in the various tables. Equally important is an understanding of the approach taken to collaborative baccalaureate programs, data pertaining to NP programs and partnerships outside provincial or territorial boundaries. See the section “Background,” above, for information on this point as well as “Data Organization.” A review of the definitions used in the survey, in the next section, is also recommended.
59 Nursing Education Statistics 2013-2014
Data Confidentiality and Privacy
As part of the 2013-2014 survey submission procedures, each school completed a confidentiality and approval release form authorizing CASN to release the data for purposes of research, policy-making, advocacy, etc.
CASN staff adheres to CASN’s privacy policy, available on the CASN website.
Definitions Used in the Survey
Advanced Entrants (counted as of the school’s allowed withdrawal date)
Students previously enrolled in a non-nursing program (e.g., bachelor of arts, physiotherapy, and bachelor of science) who transfer to an RN education program. These students have already completed some of the program’s required courses. As a result, they may be approved to join an existing student cohort in Year 2 or Year 3, and so on. Data reported in this selection are included in the calculation of admissions.
Advanced entrants include:
students previously enrolled in school X in a non-nursing program who transfer to an RN education program in school X;
students previously enrolled in school Y in a non-nursing program who transfer to an RN education program at school X; and
students with a degree from a non-nursing program who enter an RN education program.
Note: Advanced entrants differ from first-time students. See the definition for “first-time students.”
Baccalaureate Program Collaborative Delivery
A baccalaureate program offered in partnership between a university and another institution. Program partners may also belong to a consortium.
Baccalaureate Program University Delivery
A baccalaureate program offered solely by a university; no partners are involved.
Campus Site
The school site (campus) where a program is offered.
Continuing Students (counted as of the school’s allowed withdrawal date)
Continuing students include:
full-time students who progress to the next year of study without interruption, remaining with the same student cohort from one year of study to the next;
part-time students who require more than one academic year to complete all required courses; and
students who fail a course in a particular year of an RN education program but are permitted to move to Year 2 (policy may vary from one school to another).
Employment Status
A description of the employment status of faculty members. Includes tenured/tenure-track (permanent), non-tenured (non-permanent), full-time and part-time status.

60
Nursing Education Statistics 2013-2014
Enrolment (counted as of the school’s allowed withdrawal date)
The number of students enrolled in each year of study.
Enrolment Status
The type of student enrolled in a given program. Student enrolment status options are
first time;
continuing;
advanced entrant;
repeater;
returnee leave of absence;
transfer-in internal; and
transfer-in external.
Faculty Categories
The categories (i.e., faculty titles) provided may not apply to each school. Schools are encouraged to enter faculty titles in use at their school.
F1 Category
Within a university, these people are tenured/tenurable faculty who teach nursing courses.
Within a college, these people are permanent full-time or permanent part-time faculty who
teach nursing courses.
F2 Category
Within a university, these people are non-tenurable faculty fulfilling time-limited contracts of
one full academic year or longer who teach nursing courses. Within a college, these people
are contract/non-permanent faculty fulfilling time-limited contracts of one full academic
year or longer who teach nursing courses.
F3 Category
Within a university, these people are non-tenurable faculty fulfilling time-limited contracts of
less than one full academic year who teach nursing courses. Within a college, these people
are contract/non-permanent faculty fulfilling time-limited contracts of less than one full
academic year who teach nursing courses.
First-Time Students (counted as of the school’s allowed withdrawal date)
New entrants to Year 1 of an RN education program. First-time students are found only in Year 1 data. Nursing students who are in Year 2 for the first time are not considered first-time students. Data reported in this selection are included in the calculation of admissions.
Note: First-time students differ from advanced entrants. See the definition of advanced entrants.
Intake
The number of times in an academic year when students enter programs. Sometimes intake is confused with the number of students admitted.
61 Nursing Education Statistics 2013-2014
Program Category
Data are recorded in the database according to the following program categories: baccalaureate programs — university delivery, baccalaureate program — collaborative delivery, post-RN, master’s, doctoral, nurse practitioner. Each program category may contain multiple programs.
Example: Program category “post-RN” — the school may offer a post-RN program on-site as well as a post-RN program via distance. Both programs are listed under program category “post-RN”.
Program Duration
The expected number of years/semesters required to complete the entire program based on full-time program delivery.
Qualification
The name of the credential awarded upon successful completion of a program (e.g., BN, BScN, MN).
Repeater Students (counted as of the school’s allowed withdrawal date)
Students who must repeat an entire year of study because they failed to meet their RN education program requirements in a given year (policy may vary from one school to another). However, students who are allowed to move on to the next year of the program while at the same time repeating a course from a previous year of study are not to be included in this enrolment status option. See “continuing students.”
Returnee Leave of Absence (LOA) Students (counted as of the school’s allowed
withdrawal date)
Students who return to an RN education program following a school-sanctioned leave of absence (LOA) (e.g., maternity leave). The school policy regarding the amount of time a student may be absent dictates which students are included in this enrolment status option.
Roll-up Results
The combined total of program results where the programs belong to the same program category.
Transfer-In Internal Students (counted as of the school’s allowed withdrawal date)
These students continue in an RN education program without interruption but transfer to a different campus of the same school to do so. These students have previously been counted in the program data of the original campus. This new enrolment status option permits schools with multiple campuses to better track the flow of nursing students across their various campus locations.
Note: In past years, some schools reported these students as “continuing students”. If possible, please specify transfer-in internal students.
62
Nursing Education Statistics 2013-2014
Transfer-In External Students (counted as of the school’s allowed withdrawal date)
Students who started an RN education program at one school and transferred to a second school to continue their studies while remaining in the same program category. These students have previously been included in the program data of the original school. This new enrolment status option allows the receiving school to differentiate between transfers who are nursing students from other institutions and non-nursing students (see related information under “advanced entrants”).
Note: In past years, some schools reported these students as “continuing students,” while others chose “first time” in Year 2, etc. Transfer-in external students should be identified where possible.
63 Nursing Education Statistics 2013-2014
Endnotes
i Med-Emerg Inc. (2006). Building the future: An integrated strategy for nursing human resources in Canada.
Phase II final report. Ottawa: Nursing Sector Study Corporation.
ii Regan, S., Thorne, S., & Mildon, B. (2009). Uncovering blind spots in education and practice leadership:
Towards a collaborative response to the nurse shortage. Canadian Journal of Nursing Leadership, 22(2), 30-40.
iii
Canadian Institute for Health Information. (2014). Regulated nurses 2014 Report. Ottawa: Author.
iv National Education Association: Higher Education Research Center. (2007). Part-time faculty: A look at data
and issues, 11(3), 1-12.
v Canadian Institute for Health Information. (2014). Regulated nurses 2014 Report. Ottawa: Author.