Embed Size (px)
Citation preview

Regulating Networks – The Indian Telecommunication Experience
ICRIER SEMINAR – JUNE 2006

2
Telecom Growth – The Changing Scenario
0
5
10
15
20
25
Stage I II III IV
Tel
e-d
ensi
ty
Year Ending
6
11.5
22.5
1948 19982003
20052007
0.021.94
1948
3
Stages of Telecom Regulation
Stage I - Monopoly provision by State incumbent : No regulation 1948-1998
Stage II - Cost – plus tariff regulation 1998-2003
Stage III - Competition regulation 2003-2006

4
Cost plus Tariff Regulation to Competition Regulation
Stages:
• Till 2003, Telecom Tariffs were fixed/permitted by the
Regulators.
• In a number of other countries, even today, tariffs are
approved by the Regulator
• These tariffs are mostly fixed on a cost plus basis – on the
incumbent’s data
• This is done by the Power Regulators in India also.
• USA and UK Power Regulators did this till a few years back.
• We made the change of moving to Competition Regulation in
place of Tariff Regulation in 2003.
• This step made all the difference to the Indian Telecom
Sector.

5
Components of Competition Regulation
• Technology neutrality • Appropriate Interconnection Neutrality• To increase competition between operators working in the same
network - Cost based rentals- Cost based ICU charges – no profits- Termination charges lowest possible based on actual termination
cost - Entry fee – 2G, 3G case- Equal Access to scarce resources – spectrum, ROW, Towers,
Last Mile etc.- Removal of barriers to efficient network build up e.g. infra-
structure sharing restrictions- Critical network resources available at fair and non-discriminatory
prices- Establishing network elements at fair prices- Fair play conduct- Mergers and acquisitions – transparent rules -regulate only those
who are Significant Market Players (SMPs)

6
What does Cost plus lead to?
1999 : Rs. 32 per minute tariff 2003 : Rs. 4 per minute tariff High ADC – Rs. 8 per minute etc No ADC for mobiles Very high Domestic Leased Line Tariffs due to monopolistic conditions Very high IPLC tariffs due to monopolistic conditions
In other sectors, cost plus tariffs have led to :-- Power Sector - inappropriate fuels, locations and technology - padding of cost and taxation - No efforts at cost reduction both for equipment and fuel
- Steel Sector - Prices determined by public sector’s cost - Inappropriate locations and technology
- Fertilizer - Retention price policy continues - Inappropriate technologies - Input prices continue to be high leading to higher subsidy bills
- Imported - Very high cost Fertilizer - No incentive for efficiency in handling and sale Handling

7
TRAI facilitated huge reduction in forborne tariffs in 2003-05 Measures indicated in boxes – and by increasing competition Also, by allowing handsets sales in instalments. Mobile growth stepped up significantly – once mobile and fixed line tariffs became
equal Mobile then became the telephone of the working class Mobile growth in 2003-04 and 2004-05 > average mobile growth in earlier years X 12
Cellular Mobile Growth and effective charge per minutefor 250 outgoing MOU/month
1.2 1.20
13.00
33.60
65.07
75.92
52.17
0.88 1.20 1.88 3.586.50
0.00
2.00
4.00
6.00
8.00
10.00
12.00
14.00
16.00
18.00
Mar-98 Mar-99 Mar-00 Mar-01 Mar-02 Mar-03 Mar-04 Mar-05 Sep-05 Dec-05
Eff
ec
tiv
e c
ha
rge
(in
Rs
. pe
r m
in.)
0
10
20
30
40
50
60
70
80
Mo
bile
su
bs
cri
be
r b
as
e (
in M
illio
n)
Fixed (Rs./min.) Full Mobile (Rs./min)#REF! Mobile Subscriber base (Millions)
NTP
Telecom Tariff
3rd & 4th cellular operator
WLL introduce
CPP introduced
Lowering of ADC from 30% to
10% of sector
0.85

8
17.821.59
26.5132.44
38.1643.17 46.48
52.08 53.2457.17
0
10
20
30
40
50
60
70
1998 1999 2000 2001 2002 2003 2004 2005 July2005
Dec2005
Financial Year
Subs
crib
er B
ase
(mill
ion)
PSU’s Operators Subscriber base
Growth 1998-2005 = 34.28 million subscribers
Fixed 40.70 million
Mobile 16.47 million 5million/year in comparison to 0.35 million/year in pre-reform period.Only difference – competitive environment
PSU operators have shown remarkable growth in competitive environment.
Phase I Phase II

9
0.88 1.22 2.02 3.856.81
11.45
30.06
46.33
53.76
67.68
0
10
20
30
40
50
60
70
80
1998 1999 2000 2001 2002 2003 2004 2005 July2005
Dec2005
Financial Year
Su
bsc
rib
er
Ba
se (
mil
lio
n)
Private Operators Subscriber base
Growth 1998-2005 = 45.45 million subscribers
Fixed 8.22 million
Mobile 59.46 million
Private operators have contributed very largely to post 1998 growth
Private operators have contributed primarily in mobile growth due to lower costs
Liberalisation aimed at private participation and investment in telephony
Private telephones overtook public telephone in July 2005 only a few years after liberalisation
This was possible due to appropriate regulatory regime
Phase I Phase II

10
Investment in Telecom Sector and Subscriber Numbers
Approximate Investment upto March 2005
(Rs. In Thousand
Crores)
No. of Subscribers
Market share(%age)
PSU Operators
94 57.17 45.79
Private Operators
51.5 67.68 54.21
Aim of liberalization was more investment/growth.Has this been fulfilled in telecom sector?

11
Growth of Mobile Subscriber base with reducing ARPU
1.88 3.58 6.54 1333.7
5275.921319
1113884
634 469 407 3740
20406080
FY2000
FY2001
FY2002
FY2003
FY2004
FY2005
Dec-05
Subs
cribe
r Bas
e (m
illion
)
0
500
1000
1500
ARPU
(Rs./
mon
th)
SubscriberBase(Million)
ARPU(Rs./month)

12
As ARPU has fallen, revenues have grown
0
200
400
600
800
1000
1200
1400
FY 2000 FY 2001 FY 2002 FY 2003 FY 2004 FY 2005
AP
RU
(R
s./m
on
th)
0
5000
10000
15000
20000
25000
30000
Rev
enu
es o
f M
ob
ile
Op
erat
ors
(Rs.
Cro
re)
ARPU (Rs./month) Revenue of Mobile Operators (in Crores of Rs.)
13
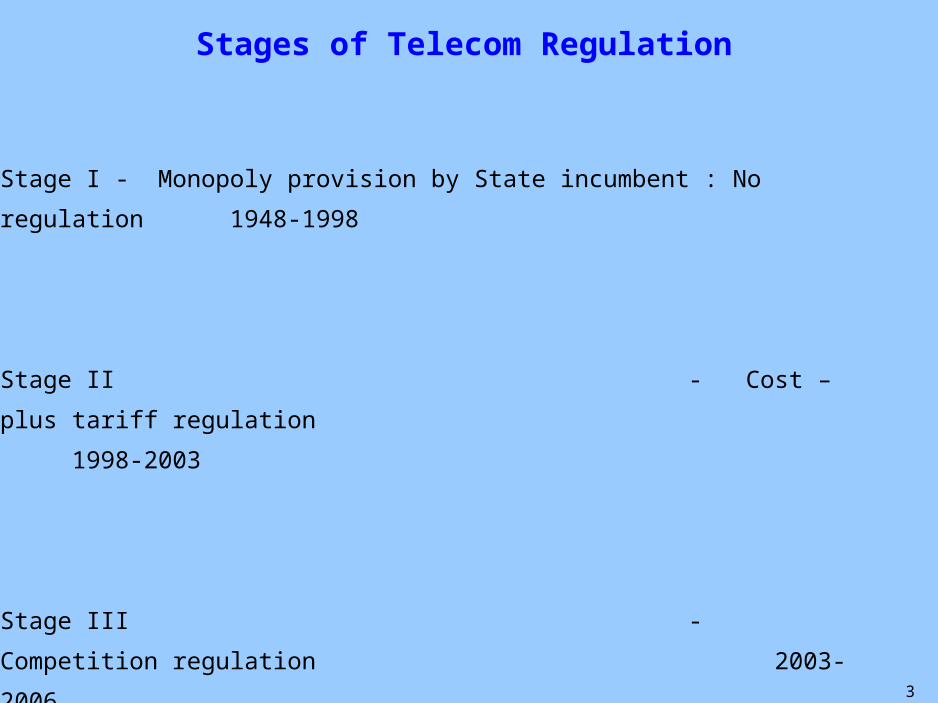
Name of the country
Call charge per minute
Minutes of Use per
subscriber per month
ARPU (Average Revenue Per User)
Termination rates per minute
Fixed Mobile
US$ Minutes US$ US$ US$
Australia 0.24 159 43 0.016 0.152
Brazil 0.11 92 11 0.020 0.080
China 0.04 261 10 0.010 0.025
Switzerland 0.45 119 59 0.017 0.163
Japan 0.33 156 63 0.022 0.130
India 0.04* 309 11 0.007 0.007
Call charges per Minutes of Use, ARPU and Termination Rates per minute for mobile service in different countries (June 04)
* Has come down to 0.03 in 2005 – lowest in the world
Since the tariffs are low – there is huge unmet mobile demand in rural areas – only mobile towers have to reach
Some low end ARPUs being offered by operators are $ 4 per month and entry cost (handset price) $35
At these rates, huge market is waiting to be tapped
Our lowest termination rates encourage aggressive competition at origination of calls
14
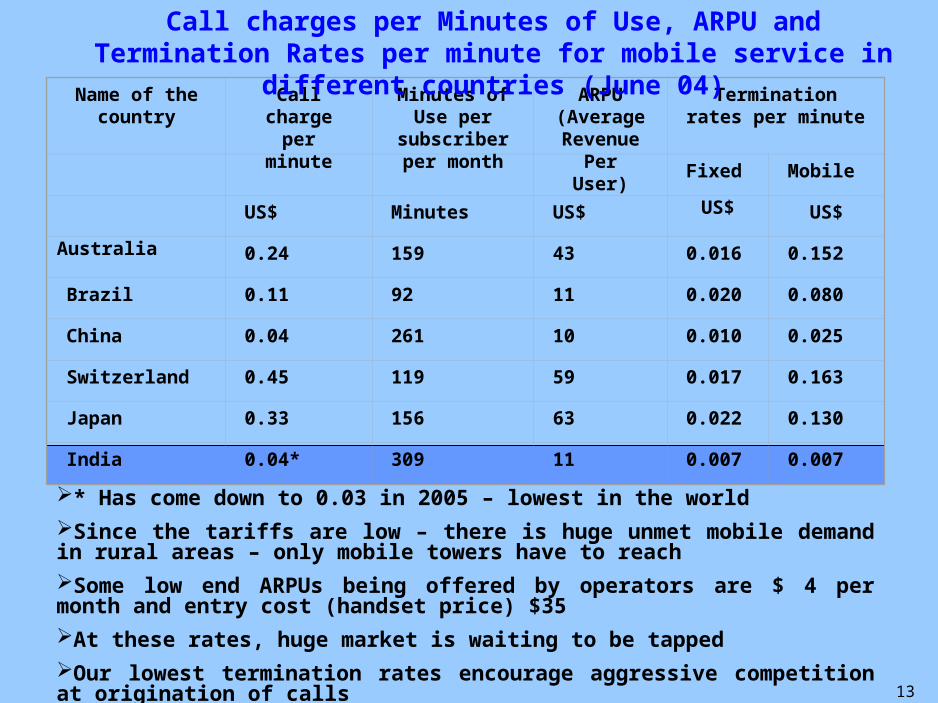
31.1332.8
1.96
9.86 10.4
26.2
21.3
14.3
12.210.4
4 4.85.8
6.98.2
1.741.71.51.20.90.70.50.40.30.31.94
9.08
7.04
5.14.33.6
2.92.31.91.61.3
0
5
10
15
20
25
30
35
Mar-96 Mar-97 Mar-98 Mar-99 Mar-00 Mar-01 Mar-02 Mar-03 Mar-04 Mar-05 Jun-05 Sep-05
Urban Teledensity Rural Teledensity Total Teledensity

15
Mobile coverage beyond the urban population in selected countries, by region, 2002.
Region Country Pop. Covered by mobile signal
Africa Cape Verde 90%
Togo 90%
Zambia 50%
Americas Eucador 86%
Mexico 90%
Arab States Jordan 90%
Morrocco 95%
Asia-Pacific Korea-Rep. 99%
Malaysia 95%
Philippines 70%
Europe Azerbaijan 94%
Czech Republic 99%
Slovak Rep. 98%
India 20%
Source:- ITU World Telecommunication Indicators DatabaseIf mobiles can cover high population % in other developing countries, in India also they canOnce higher population coverage is achieved, growth will be further acceleratedFor larger mobile coverage we have to go to rural areas, where 70% of our population lives

16
Present Coverage of Mobile Networks (2004-05)(Population Coverage 25-30%)
____________________________________________________________________By area Population Coverage
____________________________________________________________________Towns ~1700 out of 5200 ~275 Million____________________________________________________________________Rural areas Negligible Negligible____________________________________________________________________
Proposed Network Coverage by 2006; operators plan(Population Coverage 75%)
______________________________________________________________________________________________________
By area Population Coverage_______________________________________________________________Towns ~4900 out of 5200 ~300 Million_______________________________________________________________Rural areas ~350,000 out of ~450 Million
607,000 villages______________________________________________________________________________________________________

17
Substantial Growth for all
Excerpts from Morgan Stanley Report: Are present tariffs predatory?
• “Even at monthly ARPU of US$5, Wireless Operators can make money”
• “ … with telecom equipment cost having fallen globally, and most of the GSM operators being allotted higher spectrum, the incremental capex/sub in India has fallen.”
• “ We have performed a sensitivity to capex cost and ARPU. A consumer yielding a monthly ARPU of US$5 provides incremental ROCE of 16% based on capex/capacity of US$60.”
The present ARPU is around $9 per month, hence operators can profitably expand into non-covered and rural areas. In any case operators are already offering $ 4 / month ARPU tariff packages.

18
No. of households with key durables (in
million)
S. No.
All India
Urban + semi-urban
Rural Urban + semi-urban
Rural
Total Households(Millions)
192 54 138
1 Bicycle 44% 46% 43% 24.84 59.34
2 Radios 35% 44% 32% 23.76 44.16
3 Television 32% 64% 19% 34.56 26.22
4 Two wheelers(Scooters & Motorcycles)
12% 25% 7% 13.5 9.66
The rural areas have demand Demographical Analysis (2001):
Penetration of households with key consumer durable assets

19
Urban/Rural income-wise distribution of households(In millions)
Income Group Rural Households Urban Households
Lower 5887 (47.94%) 931 (18.96%)
Lower Middle 4277 (34.83%) 1658 (33.76%)
Middle to High 2116 (17.23%) 2322 (47.28%)
Total 12281 (100%) 4911(100%)

20
Number of cable homes and number of fixed line telephone subscribers
Figures in million – (Year 2003)
S. No.
Name of the country
No. of cable TV + DTH subscribers
No. of fixed line connections
1 Australia 1.55 10.82
2 China 105.00 # 263.00
3 United Kingdom 10.50 34.90
4 Japan 8.10 71.15
5 Korea 11.94 22.88
6 Taiwan 5.30 13.36
7 Thailand 0.43 6.60
8 Unites States 94.97 181.6
9 India* 61 47
India numbers are for 2005.
There is no country other than India where cable TV connections exceed fixed line phones
This indicates a huge demand in India for entertainment and multi-sourced news and information
Hence triple play networks in India will be hugely successful

21
Existing USO regime – Implementation till 2010
• Public Telephones in Villages – 3,344• Rural Telephones – 22,010• ADC for rural telephones to be
covered under existing USO regime from 2008 to 2010 – 5,000
Total - 30,354• In addition, funds have already been given
from ADC since 2003 and some more may be allotted till 2008 ~12000
• After the investment shown above, we will achieve a rural tele-density of 4%
(Figures in Rupees Cr.)

22
Proposed USO regime
• One-time subsidy for 20,000 BTSs – 7,200
• Bandwidth subsidy – 2,080
Total – 9,000
(Figures in Rupees Cr.)

23
Collection and Disbursement of USOF
Financial Year Collection Disbursement Balance
2002-03 1653.61 300 1353.612003-04 2143.22 200 3296.832004-05 3457.73 1314.58 5439.98Total 7254.56 1814.58 5439.982005-10 37541 17936.80 25044.2
Collection and Disbursement of USOF
(Rs in crore)

24
Parameters Korea Malaysia China India
Internet connections per 100 persons
27 12.2 2.7 0.46
Broadband connections per 100 persons
26 0.68 1.5 0.02
Charges per 100 kbps per month (US$)
0.25 7.61 3.07 15.63
GDP (US$ Per capita) 10,000 4,000 965 465
OVERALL ICT PENETRATION IN INDIA STILL LAGS BEHINDOTHER COUNTRIES
Key internet and broadband indicatorsJune 2004

25
Service provider Approx. Capacity – Dark & Lit Fiber (2005)
Present Lit Capacity (2004)
Utilization
Tata (SAFE, SMW3, SMW4, Indicom)
5.15 0.014 Less than 0.010 Tbps
Bharti (i2i, SMW4) 8.5 0.160
Reliance (FLAG, FALCON) 3.0 0.005
Total 16.7 0.180
SUFFICIENT INFRASTRUCTURE ALREADY EXISTS AND IS GROWING, BUT UTILIZATION NEEDS TO BE INCREASED
International ConnectivityCapacity in Tbps; 1 Tb = 1,000 Gb
National Connectivity
• 670,000 route KM of fiber has been deployed across the country
• BSNL alone has reached 30,000 of its 35,000 exchanges with fiber
• There is a possible capacity of up to 20 Gbps to each of these 30,000 locations
• Using wireless, satellite and other technologies, these 30,000 exchange locations can be leveraged as hubs for distributing broadband connectivity to all the surrounding villages
• Many routes between major cities (approx. 150) with > 1 Tbps capacity, and utilization less than 3 Gbps on average

26
THANK YOU


![2[1]. Strengthening Indian Agriculture Surabhi ICRIER](https://img.pdfslide.net/doc/110x75/577cdc501a28ab9e78aa4b24/21-strengthening-indian-agriculture-surabhi-icrier.jpg)