Embed Size (px)
Citation preview

Regulation: from Theory to Practice
Carlo Cambini
Politecnico di Torino,Florence School of Regulation, EUI
IEFE – Bocconi University, MIlan
References
Books✜ “Regulatory Reform”, Armstrong, Cowan and Vickers, Mit Press,
1994.✜ “A Theory of Incentives in Regulation and Procurement”, Laffont
J.J. and Tirole J., MIT Press, 1993.✜ “Economics of Regulation and Antitrust”, Viscusi, Vernon and
Harrington, MIT Press, 2000.Surveys:✜ Armstrong, M. and D. Sappington (2006), “Regulation, Competition
and Liberalization”, Journal of Economic Literature, XLIV, 325-366.✜ Guthrie, G. (2006), “Regulating Infrastructure: The Impact on Risk
and Investment”, Journal of Economic Literature, 44(4), 925-972.
Why regulate?✤ Kinds of market failures:
✤ Market power (leading to inefficiently high prices):✜ Economies of scale and scope✜ Anticompetitive behaviour✜ Externalities✜ Government limits to competition (e.g. patents)
✤ Externalities (leading to inappropriate prices)
✤ Information problems on service quality and/or costs
✤ Main target: cost oriented prices … to mimic perfectcompetition!
Price regulation in practive:Rate of return regulation
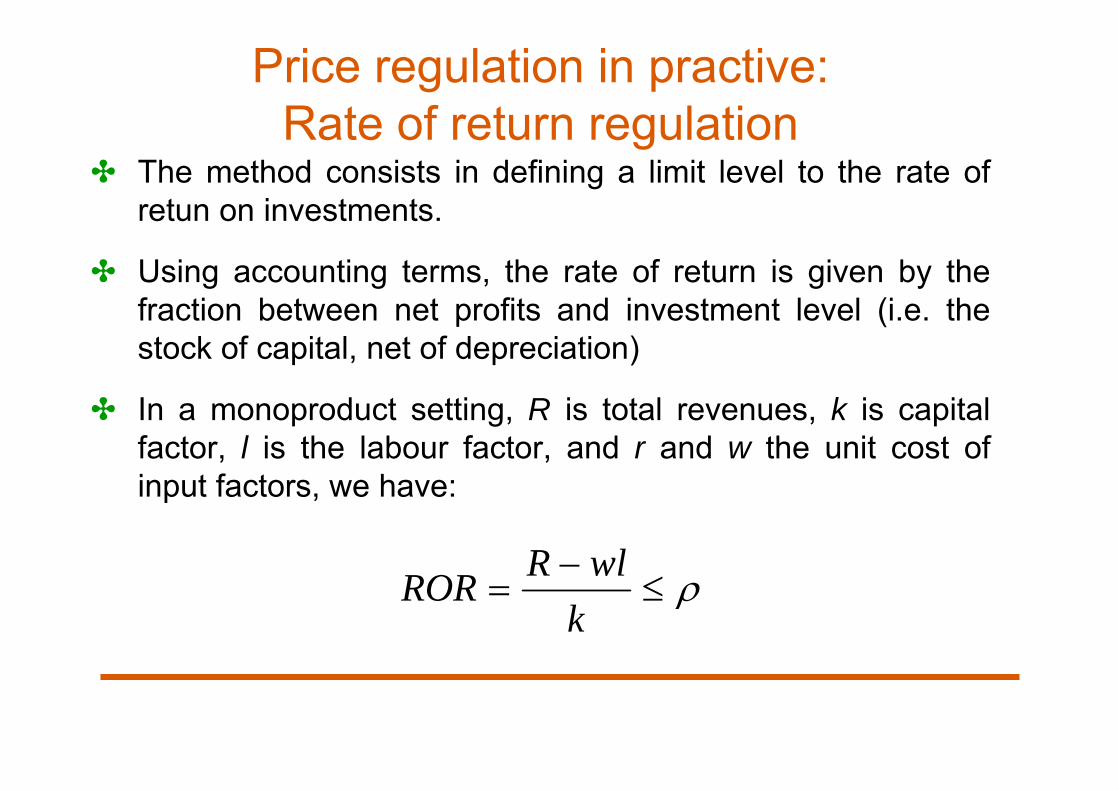
✤ The method consists in defining a limit level to the rate ofretun on investments.
✤ Using accounting terms, the rate of return is given by thefraction between net profits and investment level (i.e. thestock of capital, net of depreciation)
✤ In a monoproduct setting, R is total revenues, k is capitalfactor, l is the labour factor, and r and w the unit cost ofinput factors, we have:
k
wlRROR
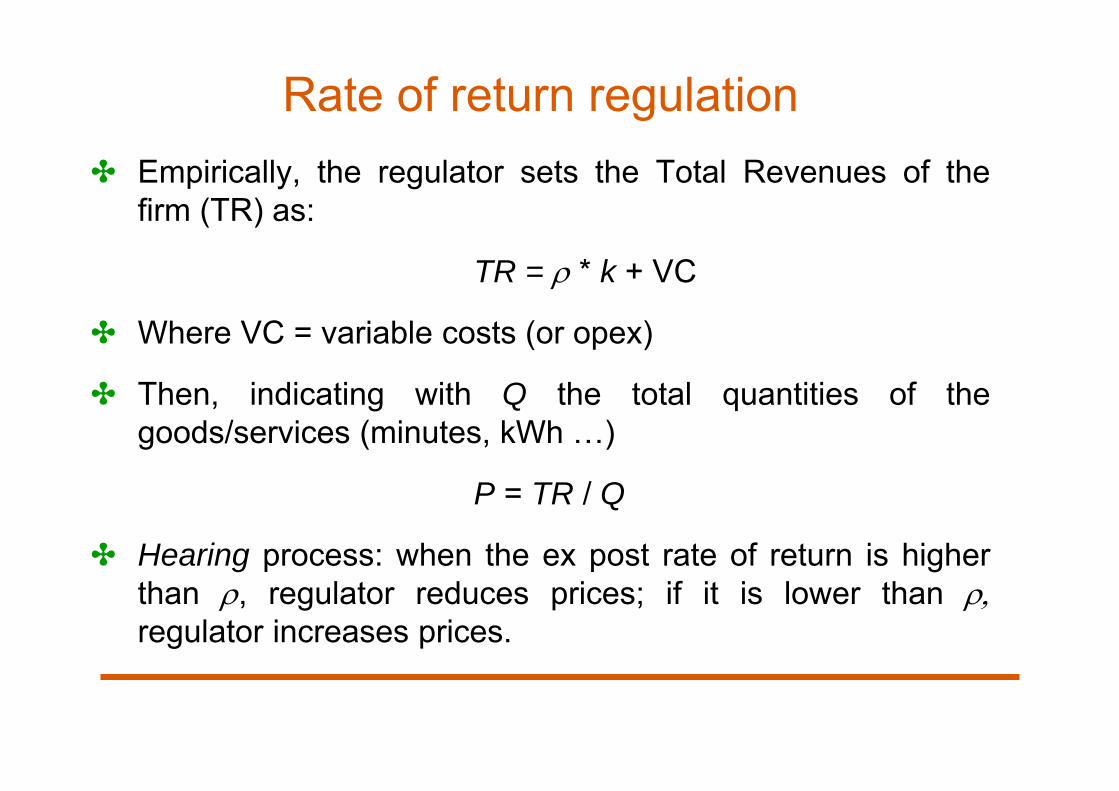
Rate of return regulation✤ Empirically, the regulator sets the Total Revenues of the
firm (TR) as:
TR = * k + VC
✤ Where VC = variable costs (or opex)
✤ Then, indicating with Q the total quantities of thegoods/services (minutes, kWh …)
P = TR / Q
✤ Hearing process: when the ex post rate of return is higherthan , regulator reduces prices; if it is lower than regulator increases prices.
Rate of return regulation✤ Pros of ROR:
✜ Financial integrity of regulated firm is always guaranteed;✜ Monitoring of profits✜ No incentive to reduce service quality
✤ Cons of ROR:✜ No incentive to reduce costs (no productive efficiency)
cost plus mechanism✜ Incentive to overinvest (inefficiently) if r (Averch –
Johnson effect)✜ Risk of accounting manipulation✜ Information demanded method and so high administrative
costs
Price cap regulation✤ Regulator defines, for a certain period of time, a limit to the
growth of price(s) of a (single or a weight average) set ofgoods or services:
Pt = (1 + RPIt - X) Pt-1
✤ RPIt = retail price index
✤ X = (estimated) growth in productivity reduction thatregulator wants to pass to consumers
Price Cap regulation ✤ The regulator should define the X factor and, in a
multiproduct setting how to evaluate the average levelof price (i.e. the weight to apply to every services).
✤ Given the general rule, the regulated firm is free to setsingle prices with respect only to the imposed contrainton their average level
✤ In addition, regulator sets the time period in which theconstraint is valid (regulatory lag). In Italy it lasts(almost) three years.
Setting the X Factor✤Same problem than for initial prices:✜ If X set too low: too much profit for the regulated firm✜ If set too high: risk of financial distress
✤General principle✜ In a competitive economy, firms pass on to customers the
cost increases (due to higher input prices), but also thecost decreases (due to increases in productivity)
✜Therefore, the prices rise at a rate equal to the to thedifference between the rate at which input prices rise andthe rate at which productivity increases
Setting the X Factor: In Practice✤Using historic growth rates to predict future growth rates✜ Adjustment might need to be made if in the past low
incentives for cost reduction (e.g., due to ROR regulation)✜ etc.
✤ In some countries, the data might not be available✜ Using historical changes in the prices of regulated services✜ Benchmarking with other countries
✤Whatever the method, the regulator may also base the X onprojections of future revenues and costs (in a manner similarto ROR regulation)
Incentive Regulation
✤“Incentive regulation” refers to alternative regulationswhich aim at providing incentives for efficiency
✤Examples of incentive regulation:✜Earnings sharing✜Revenue sharing✜Price freezes✜Rate case moratoriums✜Price caps
Earnings Sharing Regulation✤ It explicits sharing of realized earnings between the regulated
firm and consumers
✤ For instance,✜ the target rate of return is 12 percent✜ the firm can keep all earnings between 10 and 14 percent✜ 50% of earnings between 14 and 16 percent✜ 0% of earnings in excess of 16 percent
✤Employed in the US and Europe (energy, airport, …)
✤ In particular as a component of initial price cap plans
Revenue Sharing Regulation
✤Requires the regulated firm to share its revenueswith consumers over a pre-defined threshold
✤More recently, implemented in many Electricregulators in Europe
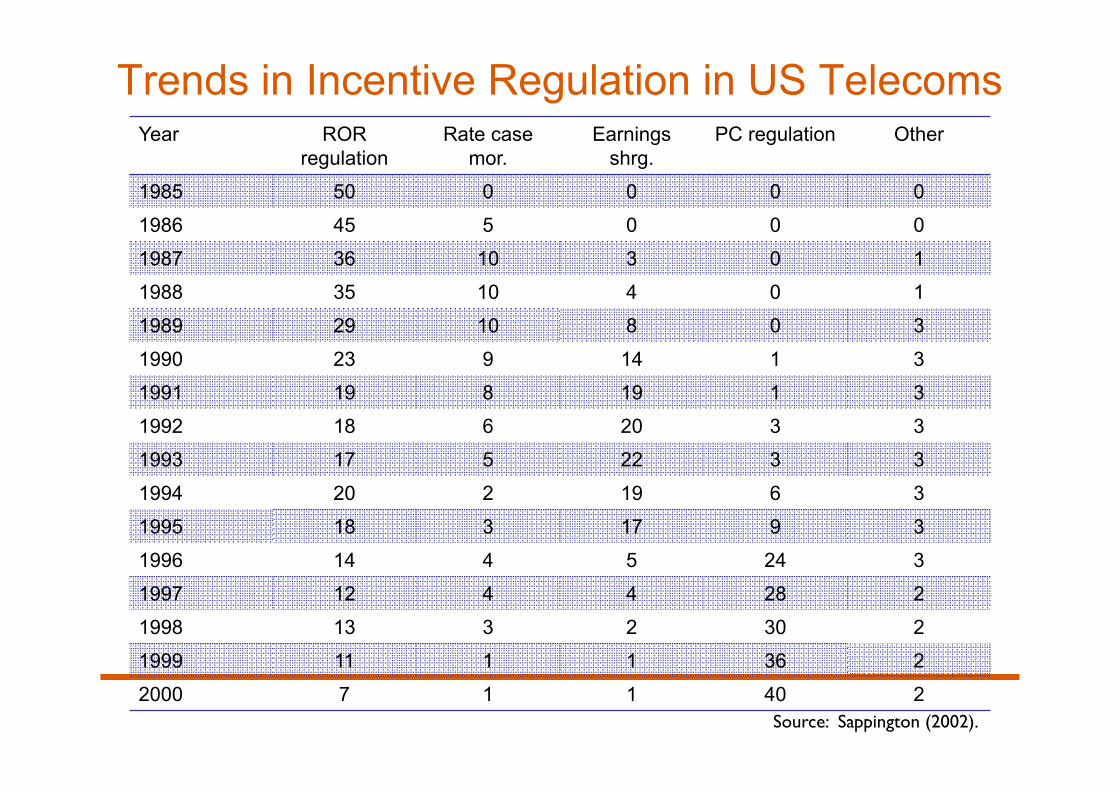
Trends in Incentive Regulation in US TelecomsYear ROR
regulationRate case
mor.Earnings
shrg.PC regulation Other
1985 50 0 0 0 0
1986 45 5 0 0 0
1987 36 10 3 0 1
1988 35 10 4 0 1
1989 29 10 8 0 3
1990 23 9 14 1 3
1991 19 8 19 1 3
1992 18 6 20 3 3
1993 17 5 22 3 3
1994 20 2 19 6 3
1995 18 3 17 9 3
1996 14 4 5 24 3
1997 12 4 4 28 2
1998 13 3 2 30 2
1999 11 1 1 36 2
2000 7 1 1 40 2Source: Sappington (2002).
Advantages of Price Cap
✤Incentives for cost-minimization✜ Link between prices and costs severed
✤No input bias (A-J effect)✜No connection between profit and rate base
✤Smaller administrative costs
✤However,✜ In practice, cost and profit monitoring during reviews =>
some of the distortions associated to ROR regulation canappear
Potential Drawbacks✤ Prices may diverge significantly from realized costs✜ May reduce allocative efficiency and welfare✜ Problem more pronounced when
• There is considerable variation in possible costs• Regulator values consumer surplus sufficiently more than profit• Positive production levels are always desirable
✜ ROR regulation can outperform price cap when these three effectsprevail
✤ Risk shifts to the regulated firm => higher cost of capital
✤ Strong incentives to reduce costs… can imply strong incentives toreduce quality✜ Reducing repair and customer assistance, etc.✜ Postponing innovations in quality✜ => service quality regulation
Potential Drawbacks✤Price flexibility to the firm✜ It can undo some cross-subsidies that the regulator wanted
to set. For instance, choose not to serve high-cost or lowwillingness to pay consumers
✜ Incentives for predatory pricing may persist if bothcompetitive and regulated services are subject to the sameprice cap
✤ The regulator is not obliged rates of return, and hence hasgreater discretion; increases risk of capture
✤ Implementation can be complex✜ Uncertainties about cost variations
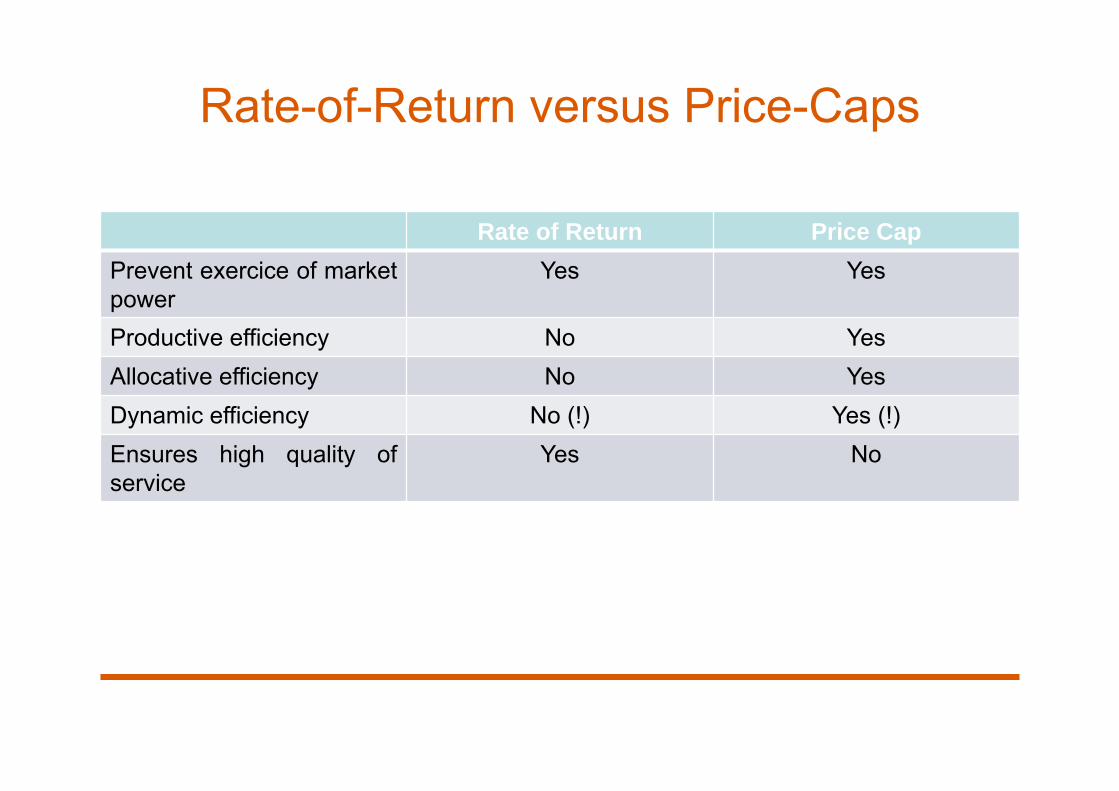
Rate-of-Return versus Price-Caps
Rate of Return Price CapPrevent exercice of marketpower
Yes Yes
Productive efficiency No YesAllocative efficiency No YesDynamic efficiency No (!) Yes (!)Ensures high quality ofservice
Yes No
Price Cap regulation✤ Empirical evidence on PC (Sappington, 2003) using data
from US Telecommunications Industry:✜ Incentive to renew some type of equipments (digital commutator, digital
transmission) but not to increase aggregate investment✜ Incentive to increase total factor productivity✜ Decrease in retail prices … but not consistently✜ Increase in net profits … even if no clear evidence for reductions in
operative costs✜ No clear incentive to reduce services’ quality
✤ Alexander et al. (1996) examine the evidence on the cost ofcapital for regulated industries and find that, as expected,firms facing incentive regulation have higher systematic riskthan firms subject to rate-of-return regulation.
Incentive regulation in Energy Sectors✤ Incentive regulation increases productivity and service
quality in UK electric regional distribution (Jamasb andPollitt 2007; Domah and Pollit, 2004; Newbery and Pollit,1998)
✤ Quality impact is ambiguous: Not negative impact ofincentive regulation in quality provision in Norway(Growitsch et al. 2010); negative effect of IR on quality inthe US (Ter Martirosyan and Kwoka, 2010) without MQS.
✤ Incentive regulation increases labour productivity in electricdistribution in developing countries (Pollit, 2004; Rudnik andZolezzi, 2001)
✤ Incentive regulation increases firms’ investments, but only incost-reducing activities (Cambini and Rondi, 2010).
✤ Surveys on IR in Energy: Joskow 2008, Vogelsang 2006
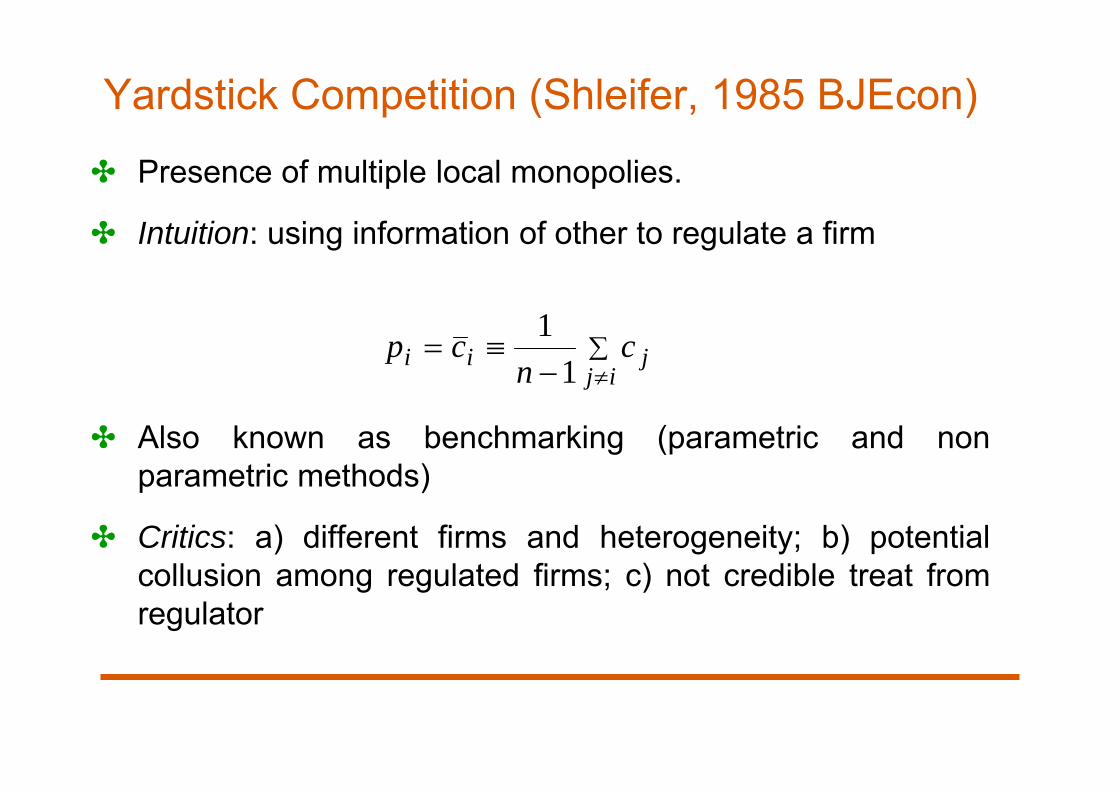
Yardstick Competition (Shleifer, 1985 BJEcon)
✤ Presence of multiple local monopolies.
✤ Intuition: using information of other to regulate a firm
✤ Also known as benchmarking (parametric and nonparametric methods)
✤ Critics: a) different firms and heterogeneity; b) potentialcollusion among regulated firms; c) not credible treat fromregulator
ij
jii cn
cp1
1
How to use benchmarking? ART’s intervention
✤ With Deliberation n. 1/2016 ART started a publicconsultation for the definition of the optimal dimensions (i.e.extension in km) of a motorway concessionary.
✤ The analysis is aimed at assessing, through the use ofquantitative methods, the scale and cost efficiency of theItalian motorway concessionaires for the purpose ofdetermining the optimal size of the sector on the basis of itscharacteristics.
✤ The cost structure is a very important factor for policymakers, both to define a proper benchmarking and evaluatethe effect of competition for the sector (yardstickcompetition).
22
Deliberation n. 70/2016 (July)✤ By applying different methodologies (stochastic frontier and
regression analysis) and considering different cost functions(Cobb-Douglas and Translog), the scope is to determine thekey factors that best explain the changes in productioncosts for small- and medium-large motorwayconcessionaires.
23
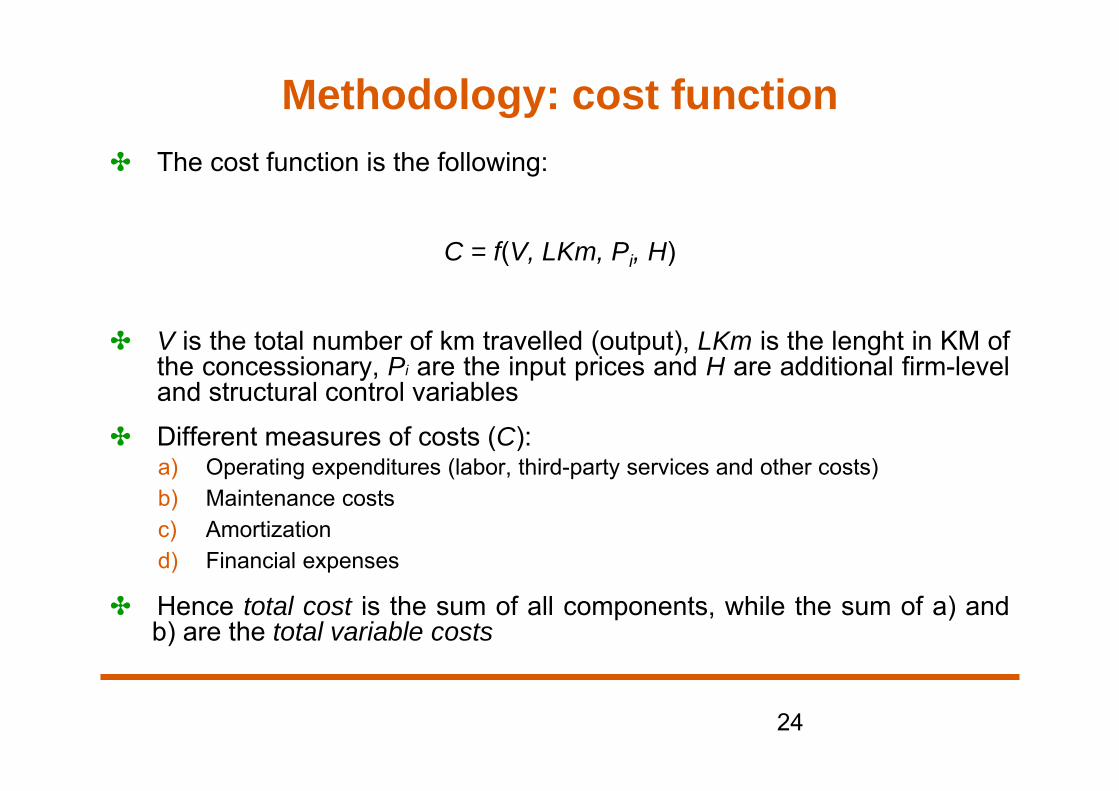
Methodology: cost function ✤ The cost function is the following:
C = f(V, LKm, Pi, H)
✤ V is the total number of km travelled (output), LKm is the lenght in KM ofthe concessionary, Pi are the input prices and H are additional firm-leveland structural control variables
✤ Different measures of costs (C):a) Operating expenditures (labor, third-party services and other costs)b) Maintenance costsc) Amortizationd) Financial expenses
✤ Hence total cost is the sum of all components, while the sum of a) andb) are the total variable costs
24
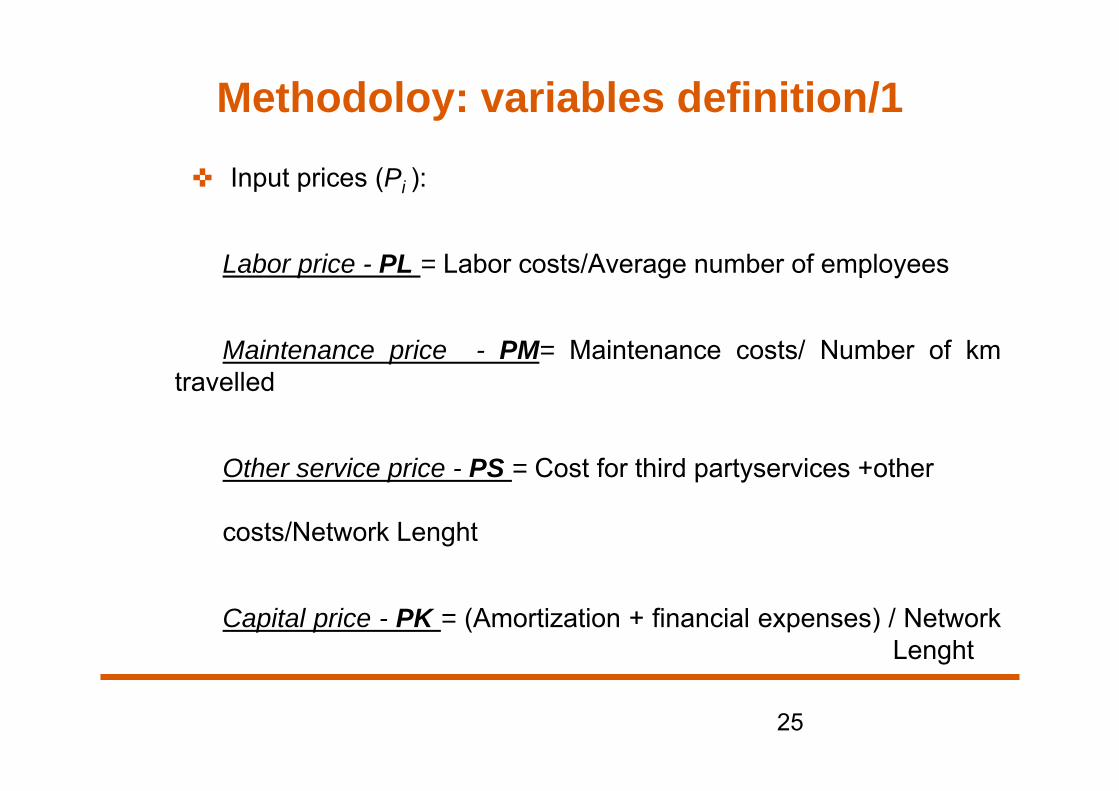
✜ Input prices (Pi ):
Labor price - PL = Labor costs/Average number of employees
Maintenance price - PM= Maintenance costs/ Number of kmtravelled
Other service price - PS = Cost for third partyservices +other
costs/Network Lenght
Capital price - PK = (Amortization + financial expenses) / NetworkLenght
Methodoloy: variables definition/1
25
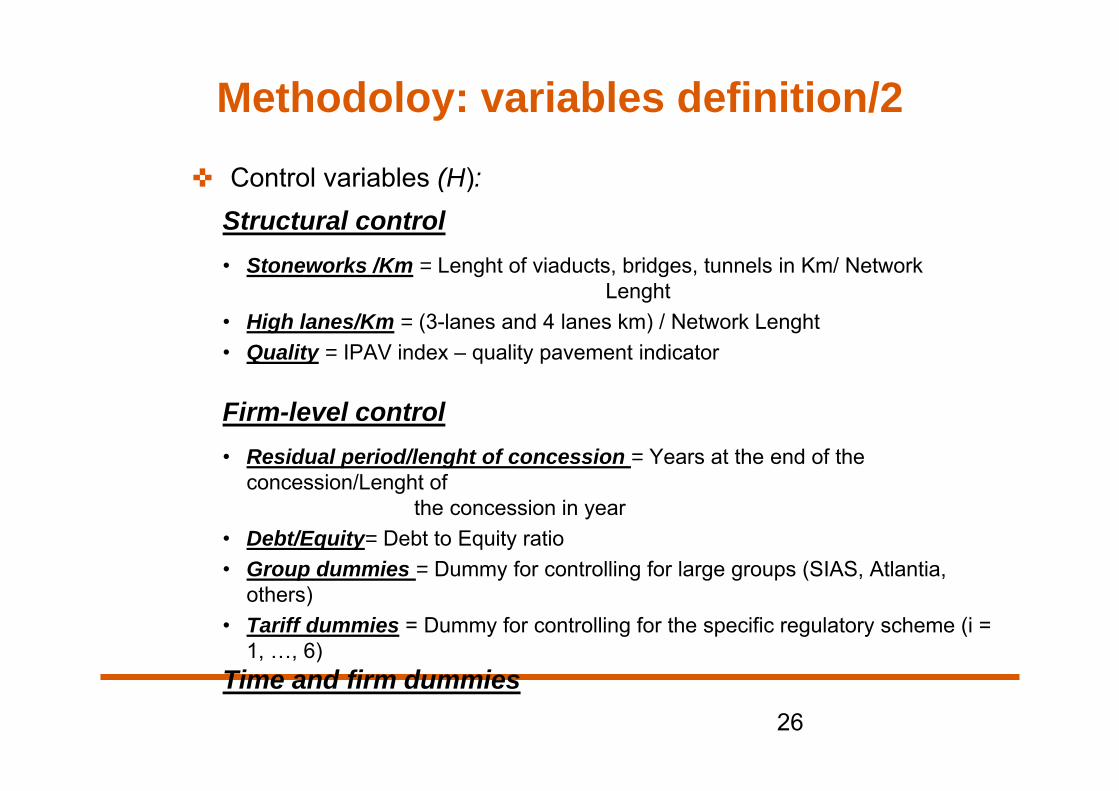
✜ Control variables (H):Structural control• Stoneworks /Km = Lenght of viaducts, bridges, tunnels in Km/ Network
Lenght• High lanes/Km = (3-lanes and 4 lanes km) / Network Lenght• Quality = IPAV index – quality pavement indicator
Firm-level control• Residual period/lenght of concession = Years at the end of the
concession/Lenght of the concession in year
• Debt/Equity= Debt to Equity ratio• Group dummies = Dummy for controlling for large groups (SIAS, Atlantia,
others)• Tariff dummies = Dummy for controlling for the specific regulatory scheme (i =
1, …, 6)Time and firm dummies
Methodoloy: variables definition/2
26
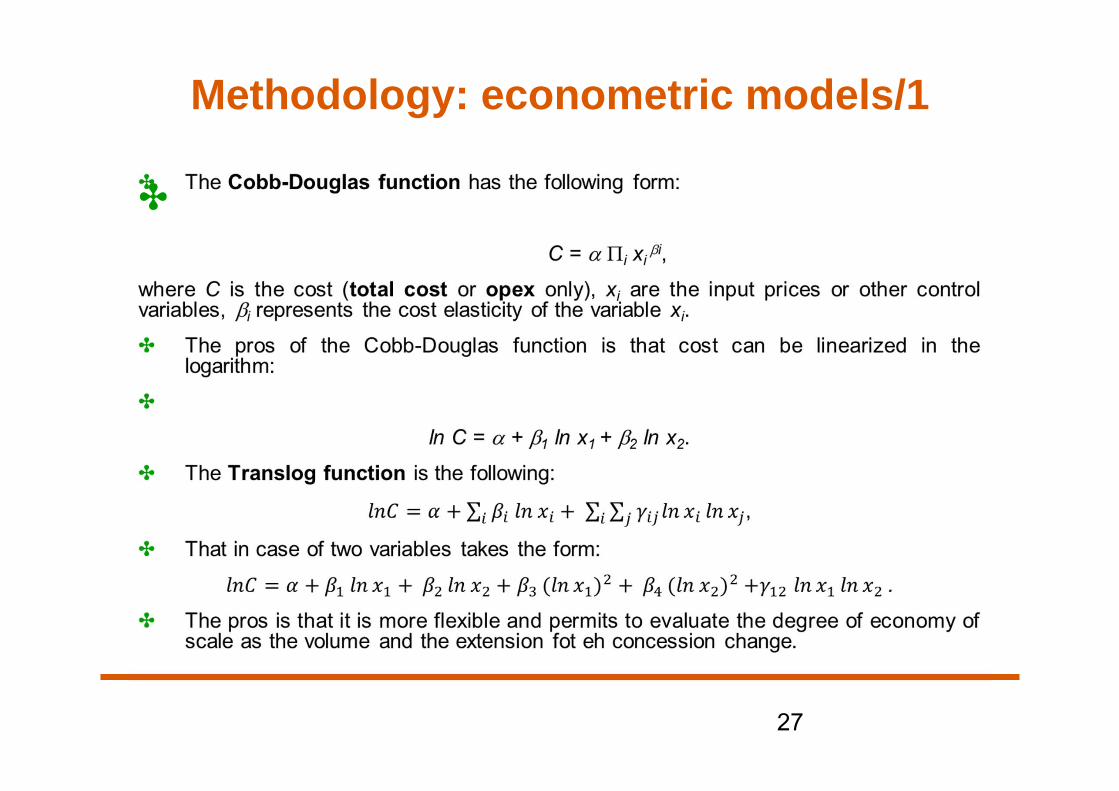
Methodology: econometric models/1
✤
27
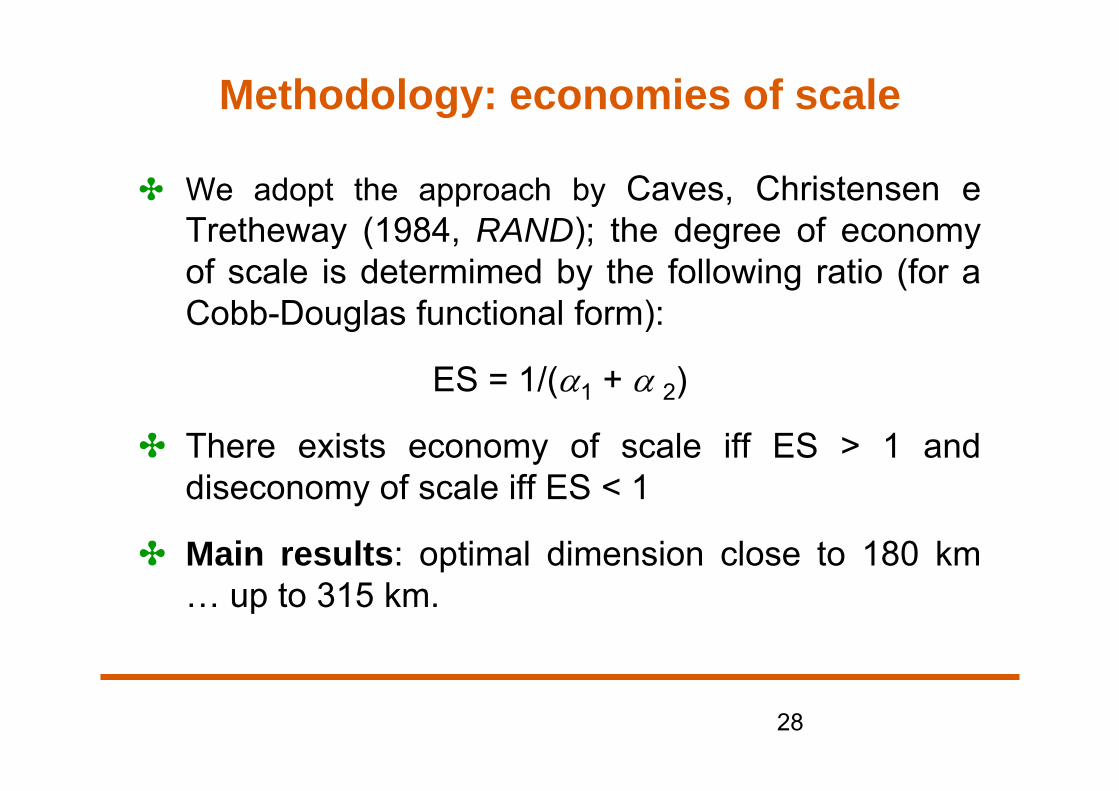
Methodology: economies of scale
✤ We adopt the approach by Caves, Christensen eTretheway (1984, RAND); the degree of economyof scale is determimed by the following ratio (for aCobb-Douglas functional form):
ES = 1/(1 + 2)
✤ There exists economy of scale iff ES > 1 anddiseconomy of scale iff ES < 1
✤ Main results: optimal dimension close to 180 km… up to 315 km.
28
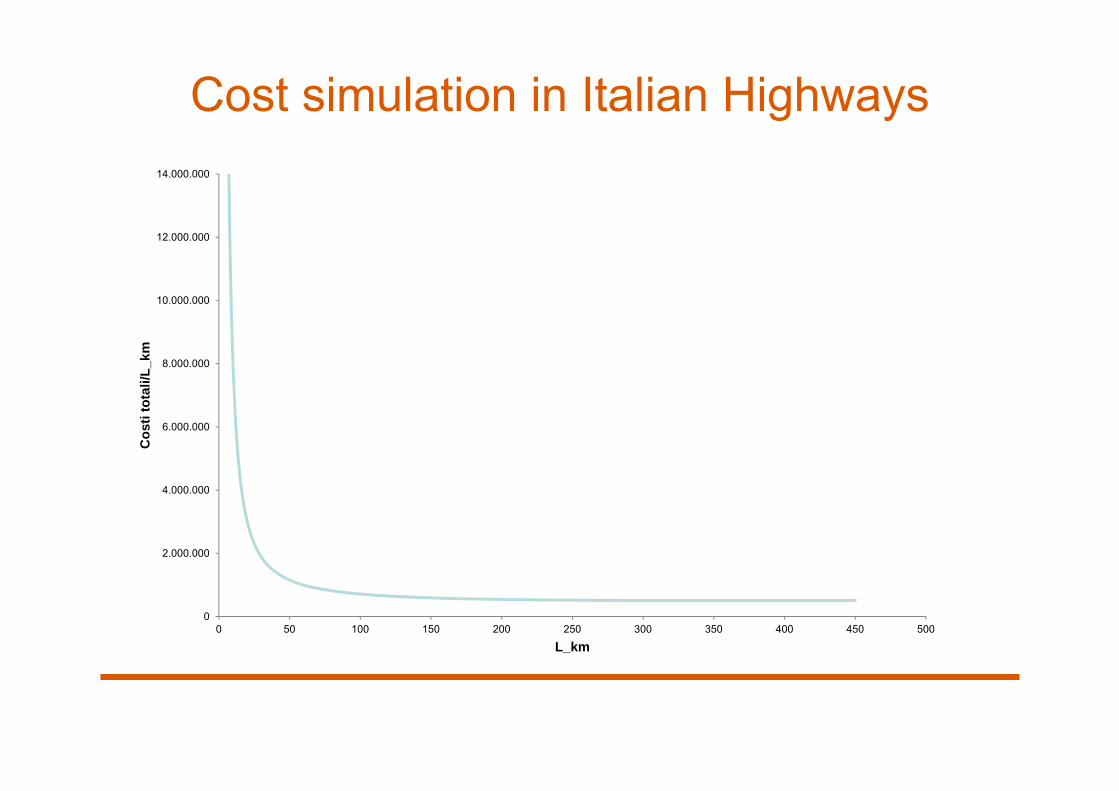
Cost simulation in Italian Highways
0
2.000.000
4.000.000
6.000.000
8.000.000
10.000.000
12.000.000
14.000.000
0 50 100 150 200 250 300 350 400 450 500
Cos
ti to
tali/
L_km
L_km
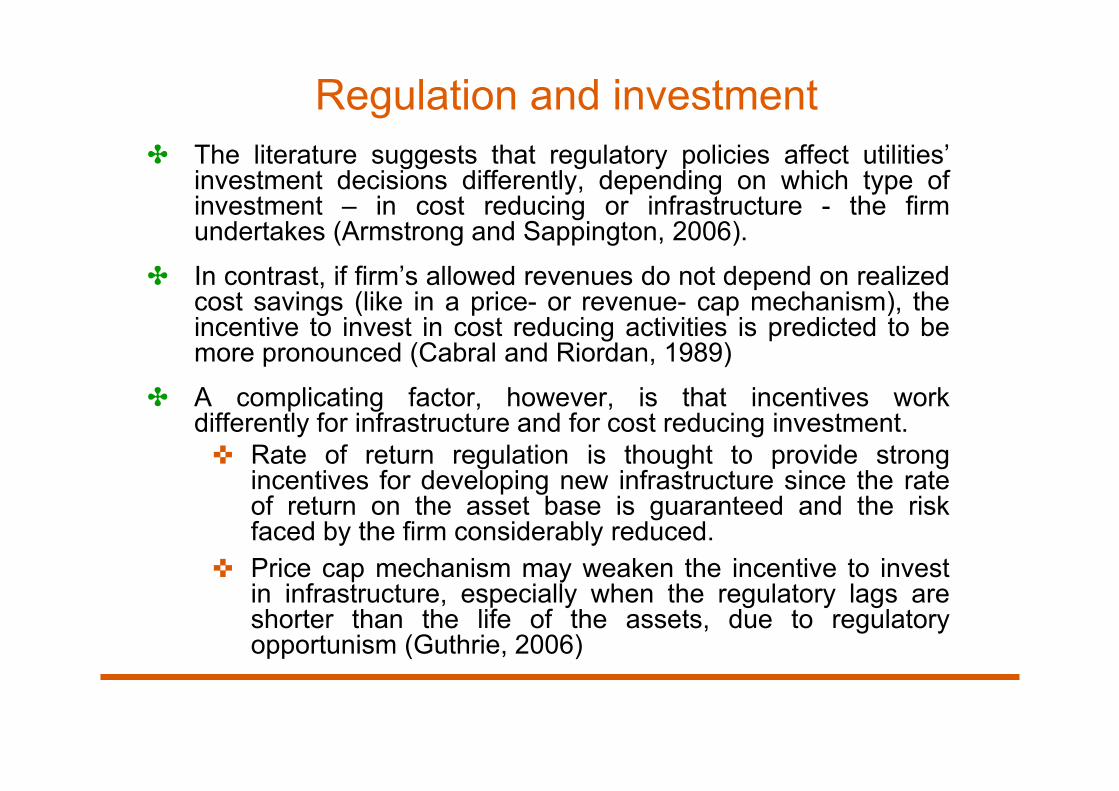
Regulation and investment✤ The literature suggests that regulatory policies affect utilities’
investment decisions differently, depending on which type ofinvestment – in cost reducing or infrastructure - the firmundertakes (Armstrong and Sappington, 2006).
✤ In contrast, if firm’s allowed revenues do not depend on realizedcost savings (like in a price- or revenue- cap mechanism), theincentive to invest in cost reducing activities is predicted to bemore pronounced (Cabral and Riordan, 1989)
✤ A complicating factor, however, is that incentives workdifferently for infrastructure and for cost reducing investment.✜ Rate of return regulation is thought to provide strong
incentives for developing new infrastructure since the rateof return on the asset base is guaranteed and the riskfaced by the firm considerably reduced.
✜ Price cap mechanism may weaken the incentive to investin infrastructure, especially when the regulatory lags areshorter than the life of the assets, due to regulatoryopportunism (Guthrie, 2006)
New Incentives Scheme for Innovation & Investment
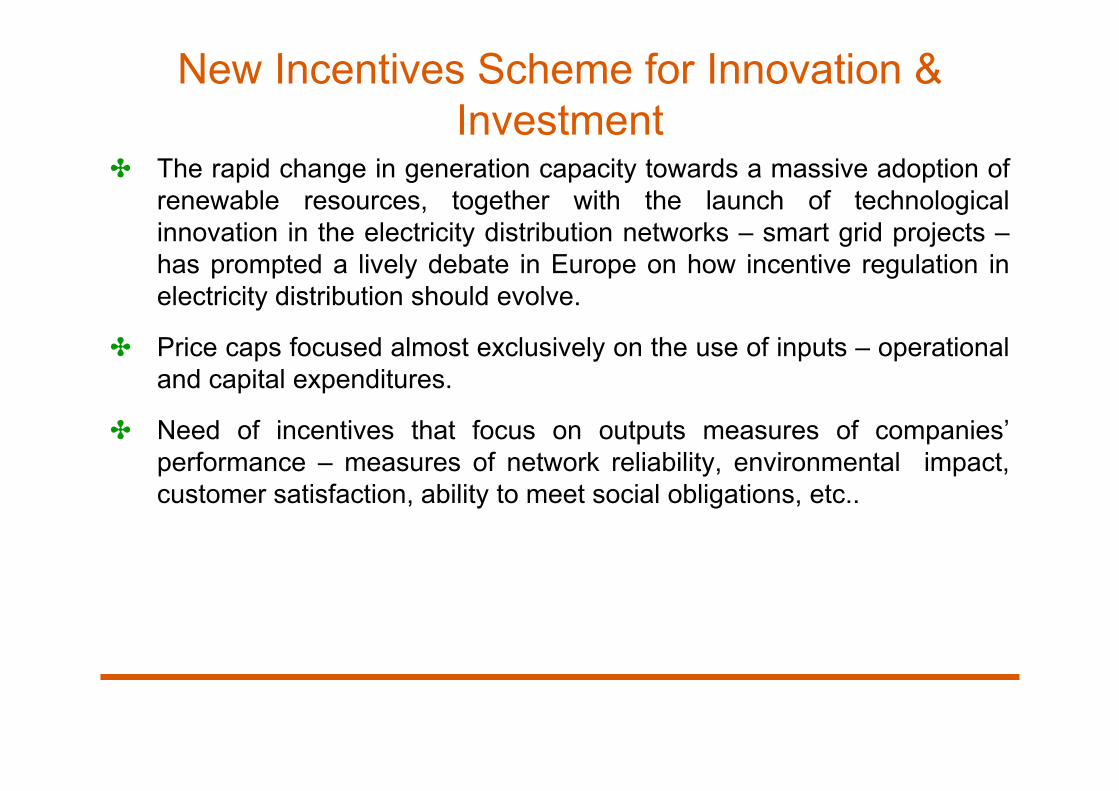
✤ The rapid change in generation capacity towards a massive adoption ofrenewable resources, together with the launch of technologicalinnovation in the electricity distribution networks – smart grid projects –has prompted a lively debate in Europe on how incentive regulation inelectricity distribution should evolve.
✤ Price caps focused almost exclusively on the use of inputs – operationaland capital expenditures.
✤ Need of incentives that focus on outputs measures of companies’performance – measures of network reliability, environmental impact,customer satisfaction, ability to meet social obligations, etc..
New Incentives Scheme for Innovation & Investment
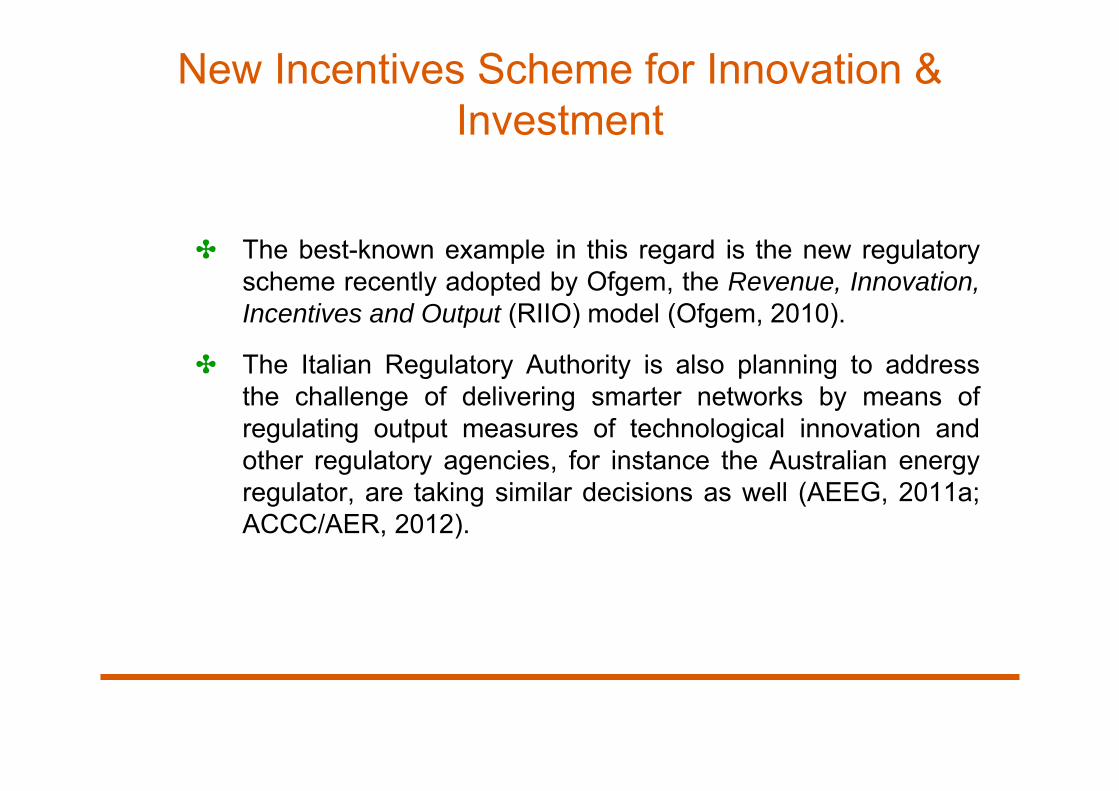
✤ The best-known example in this regard is the new regulatoryscheme recently adopted by Ofgem, the Revenue, Innovation,Incentives and Output (RIIO) model (Ofgem, 2010).
✤ The Italian Regulatory Authority is also planning to addressthe challenge of delivering smarter networks by means ofregulating output measures of technological innovation andother regulatory agencies, for instance the Australian energyregulator, are taking similar decisions as well (AEEG, 2011a;ACCC/AER, 2012).
Grid Evolution
33
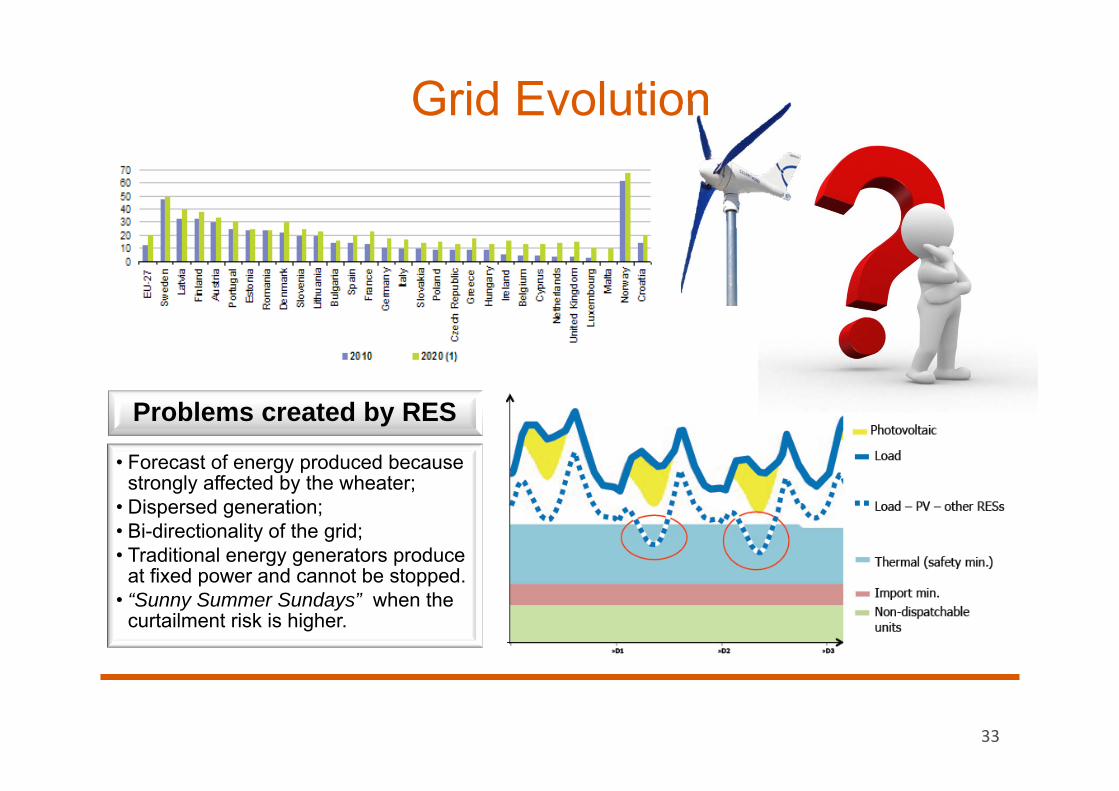
Problems created by RES
• Forecast of energy produced because strongly affected by the wheater;
• Dispersed generation;• Bi-directionality of the grid;• Traditional energy generators produce
at fixed power and cannot be stopped. • “Sunny Summer Sundays” when the
curtailment risk is higher.
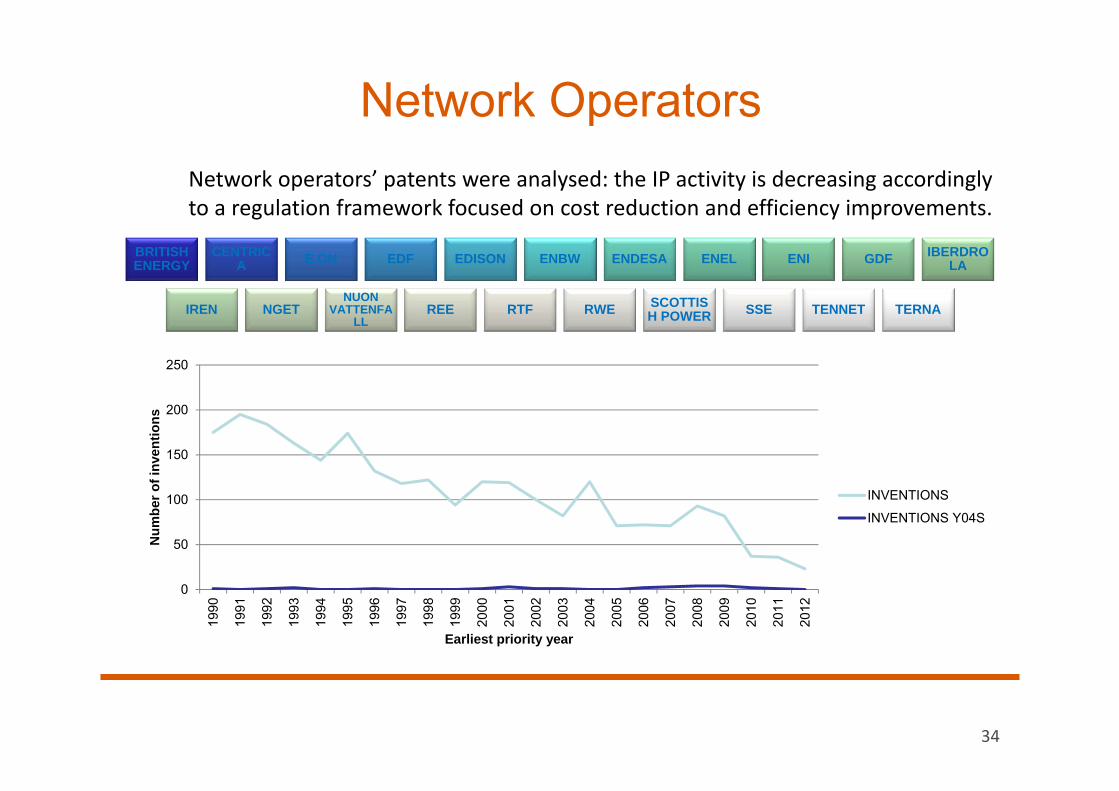
Network OperatorsNetwork operators’ patents were analysed: the IP activity is decreasing accordingly to a regulation framework focused on cost reduction and efficiency improvements.
34
BRITISH ENERGY
CENTRICA E.ON EDF EDISON ENBW ENDESA ENEL ENI GDF IBERDRO
LA
IREN NGETNUON
VATTENFALL
REE RTF RWE SCOTTISH POWER SSE TENNET TERNA
0
50
100
150
200
250
1990
1991
1992
1993
1994
1995
1996
1997
1998
1999
2000
2001
2002
2003
2004
2005
2006
2007
2008
2009
2010
2011
2012
Num
ber o
f inv
entio
ns
Earliest priority year
INVENTIONS
INVENTIONS Y04S
Market Players
35
% APPLICATION ABB
SCHNEIDER
SIEMENS
ITRON
TOSHIBA
LG
PANASONIC
MITSUBISHI
HITACHI
EATON
TOYOTA
IBM
HONDA
ELSTER
SILVER SPRING
SCHWEITZER
BOSCH
KEPCO
EDF
POS. Patents % Cumul%
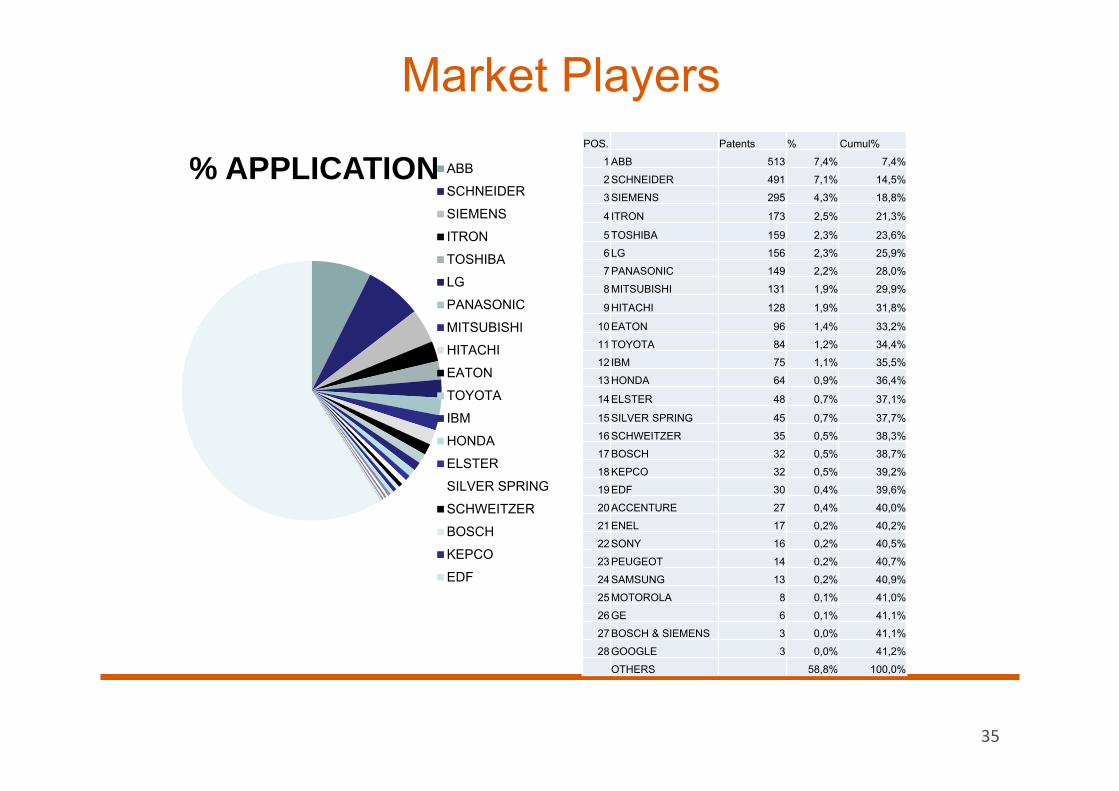
1 ABB 513 7,4% 7,4%
2 SCHNEIDER 491 7,1% 14,5%
3 SIEMENS 295 4,3% 18,8%
4 ITRON 173 2,5% 21,3%
5 TOSHIBA 159 2,3% 23,6%
6 LG 156 2,3% 25,9%
7 PANASONIC 149 2,2% 28,0%
8 MITSUBISHI 131 1,9% 29,9%
9 HITACHI 128 1,9% 31,8%
10 EATON 96 1,4% 33,2%
11 TOYOTA 84 1,2% 34,4%
12 IBM 75 1,1% 35,5%
13 HONDA 64 0,9% 36,4%
14 ELSTER 48 0,7% 37,1%
15 SILVER SPRING 45 0,7% 37,7%
16 SCHWEITZER 35 0,5% 38,3%
17 BOSCH 32 0,5% 38,7%
18 KEPCO 32 0,5% 39,2%
19 EDF 30 0,4% 39,6%
20 ACCENTURE 27 0,4% 40,0%
21 ENEL 17 0,2% 40,2%
22 SONY 16 0,2% 40,5%
23 PEUGEOT 14 0,2% 40,7%
24 SAMSUNG 13 0,2% 40,9%
25 MOTOROLA 8 0,1% 41,0%
26 GE 6 0,1% 41,1%
27 BOSCH & SIEMENS 3 0,0% 41,1%
28 GOOGLE 3 0,0% 41,2%
OTHERS 58,8% 100,0%
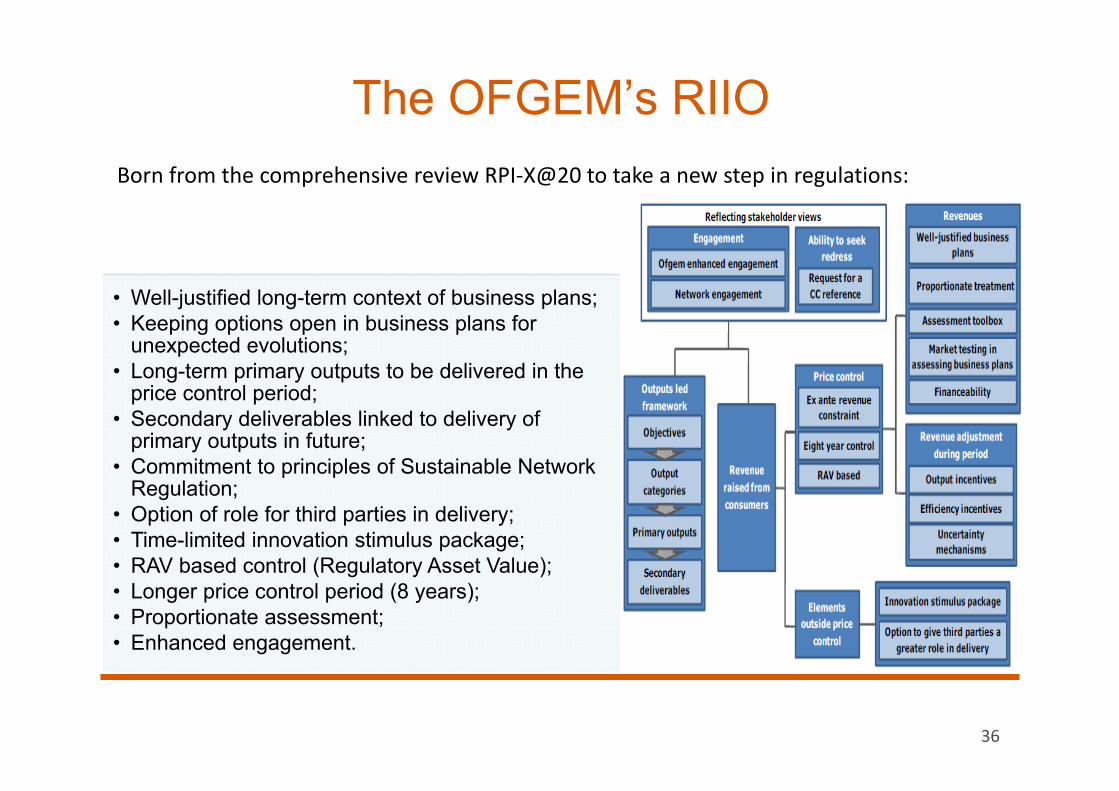
• Well-justified long-term context of business plans;• Keeping options open in business plans for
unexpected evolutions;• Long-term primary outputs to be delivered in the
price control period;• Secondary deliverables linked to delivery of
primary outputs in future;• Commitment to principles of Sustainable Network
Regulation;• Option of role for third parties in delivery;• Time-limited innovation stimulus package;• RAV based control (Regulatory Asset Value);• Longer price control period (8 years);• Proportionate assessment;• Enhanced engagement.
The OFGEM’s RIIO
36
Born from the comprehensive review RPI‐X@20 to take a new step in regulations:
An application of Quality Regulation: the Electricity in Italy
✤ In 2009 Italy had 135 Distribution Network Operators (DNO)
✤Total energy delivered was almost 280 TWh
✤Enel Distribuzione was responsible for 86.2% of distributed energy✜A2A Reti Elettriche (4.1%), ACEA Distribuzione (3.6%); other DNO
less than 1% of distributed energy
✤Enel is present in all regions of Italy and it is organized in 115 Zones(11 Territorial Units and 4 macro Areas)
✤DNOs are regulated by the Italian Regulatory Authority for Electricityand Gas (Autorità per l’energia elettrica e il gas – AEEG)
37
✤Electricity distribution tariff is unique across Italy
✤It is composed of several building blocks:✜Hybrid incentive mechanism: price cap on opex + WACC on
capex✜input-based elements (+2% WACC for 8-12 years)
• Innovation (also smart grid demostration projects)✜output-based quality-specific incentives
• SAIDI (since 2000) and SAIFI+MAIFI (since 2008)
✤Now in the fourth tariff period (2012-15)
38
Aims of Quality Regulation✜Italian regulator is keen on considering a more unified
approach to tariff schemes, based to a greater extenton output regulation
• [AEEG Consultation Document n. 34/11; Benedettini et al., 2011; Lo Schiavo et al., 2013]
✜Recent regulatory schemes (f.i., Ofgem RIIO model)include additional output measures that focus onsustainability and innovation
• [Baucknecht, 2011; Muller, 2011; Meeus et al., 2011]
39
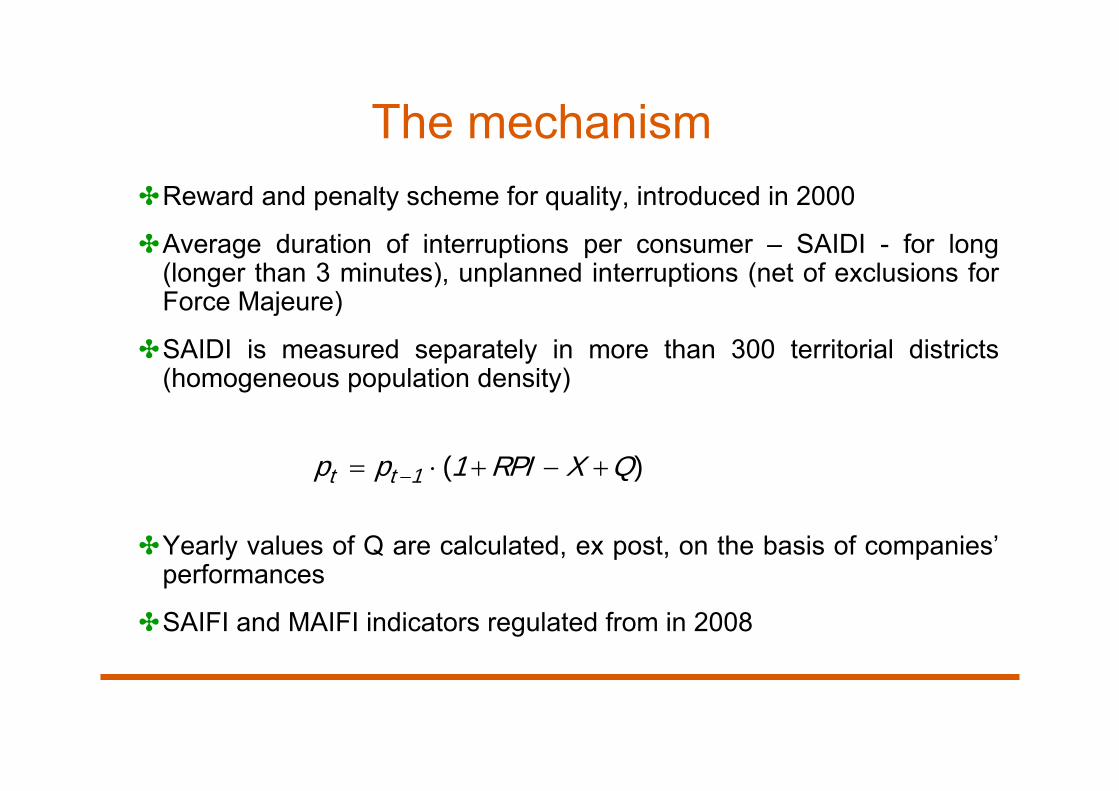
The mechanism✤Reward and penalty scheme for quality, introduced in 2000
✤Average duration of interruptions per consumer – SAIDI - for long(longer than 3 minutes), unplanned interruptions (net of exclusions forForce Majeure)
✤SAIDI is measured separately in more than 300 territorial districts(homogeneous population density)
✤Yearly values of Q are calculated, ex post, on the basis of companies’performances
✤SAIFI and MAIFI indicators regulated from in 2008
40
pt pt 1 (1 RPI X Q)
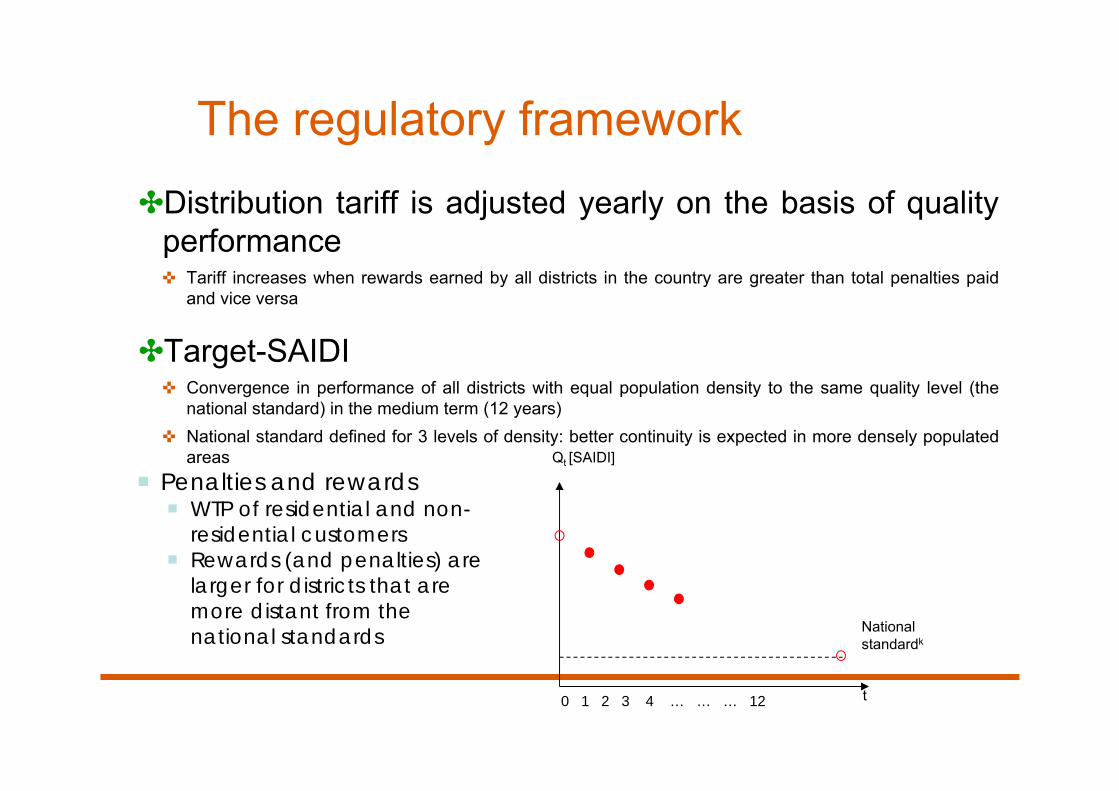
The regulatory framework✤Distribution tariff is adjusted yearly on the basis of quality
performance✜ Tariff increases when rewards earned by all districts in the country are greater than total penalties paid
and vice versa
✤Target-SAIDI✜ Convergence in performance of all districts with equal population density to the same quality level (the
national standard) in the medium term (12 years)✜ National standard defined for 3 levels of density: better continuity is expected in more densely populated
areas
41
t0 1 2 3 4 … … … 12
Qt [SAIDI]
National standardk
Penalties and rewards WTP of residential and non-
residential customers Rewards (and penalties) are
larger for districts that are more distant from the national standards
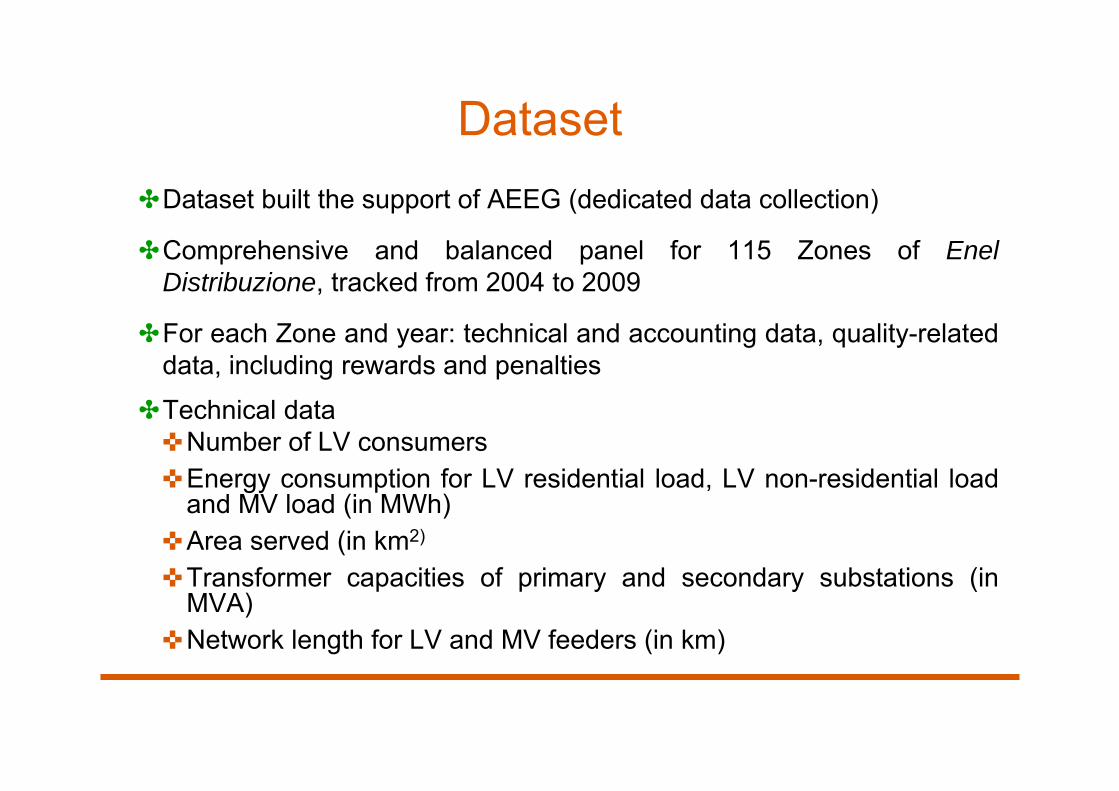
Dataset✤Dataset built the support of AEEG (dedicated data collection)
✤Comprehensive and balanced panel for 115 Zones of EnelDistribuzione, tracked from 2004 to 2009
✤For each Zone and year: technical and accounting data, quality-relateddata, including rewards and penalties
✤Technical data✜Number of LV consumers✜Energy consumption for LV residential load, LV non-residential load
and MV load (in MWh)✜Area served (in km2)
✜Transformer capacities of primary and secondary substations (inMVA)
✜Network length for LV and MV feeders (in km)
42
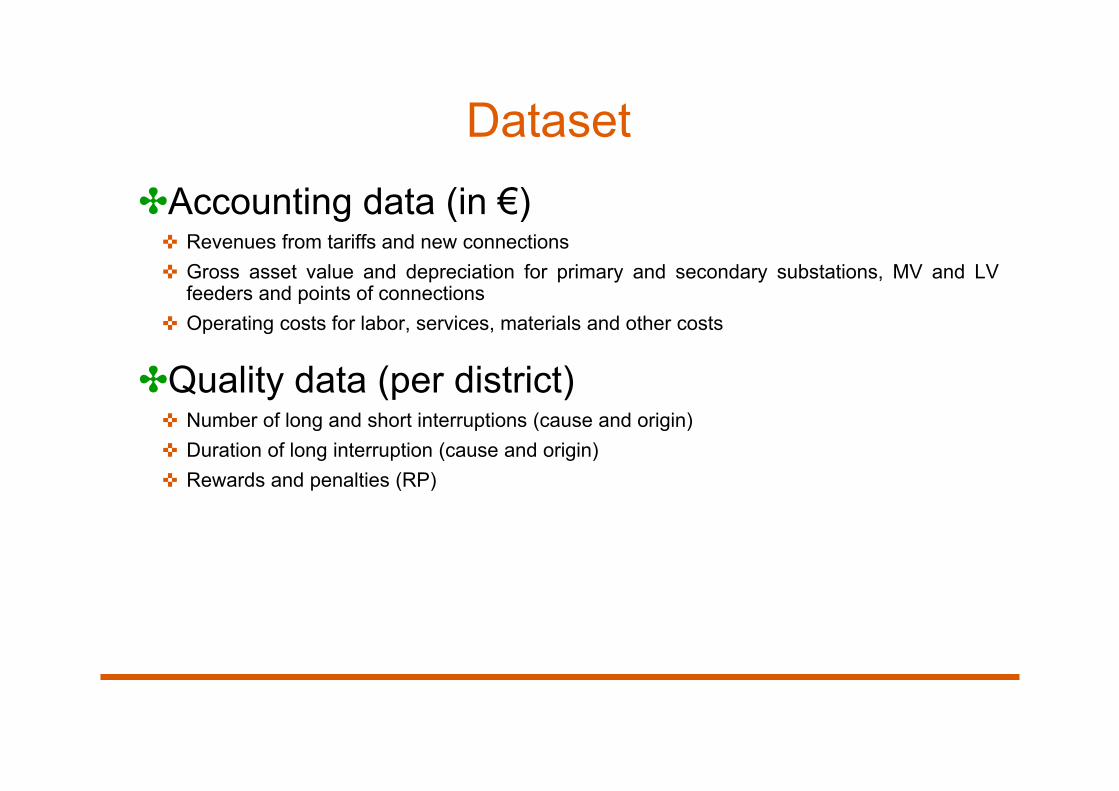
Dataset✤Accounting data (in €)
✜ Revenues from tariffs and new connections✜ Gross asset value and depreciation for primary and secondary substations, MV and LV
feeders and points of connections✜ Operating costs for labor, services, materials and other costs
✤Quality data (per district)✜ Number of long and short interruptions (cause and origin)✜ Duration of long interruption (cause and origin)✜ Rewards and penalties (RP)
43
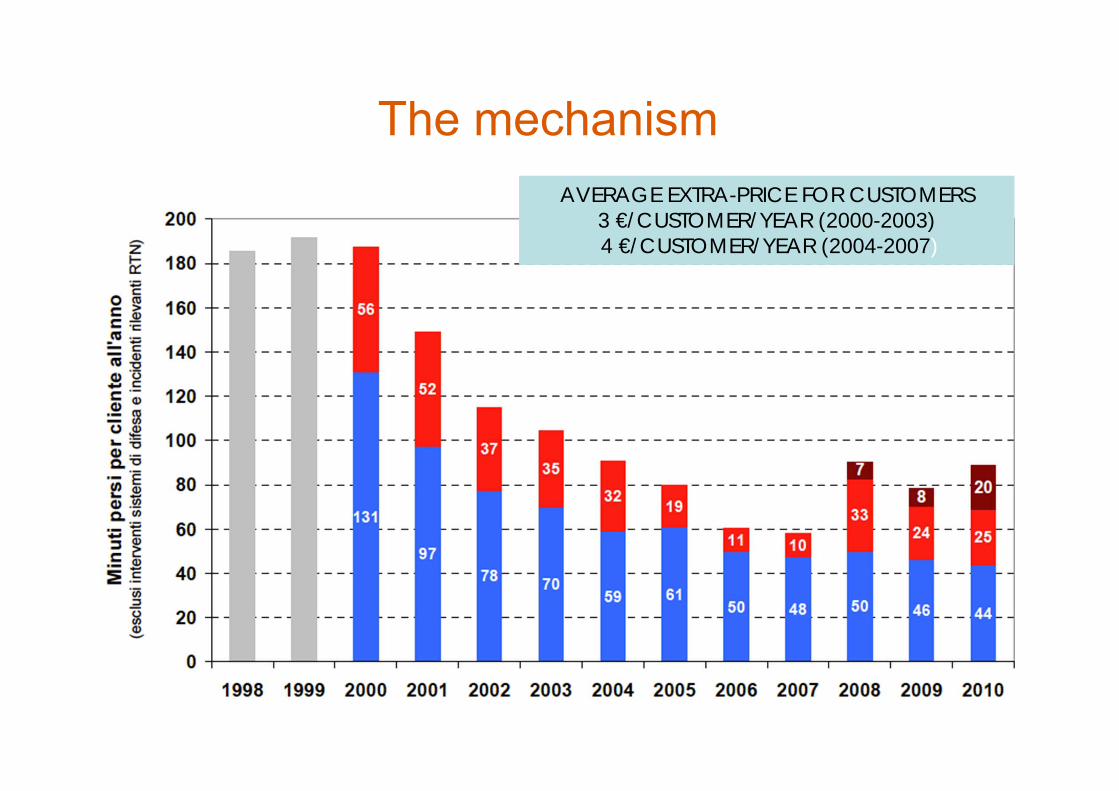
The mechanism 44
AVERAGE EXTRA-PRICE FOR CUSTOMERS 3 €/CUSTOMER/YEAR (2000-2003) 4 €/CUSTOMER/YEAR (2004-2007)
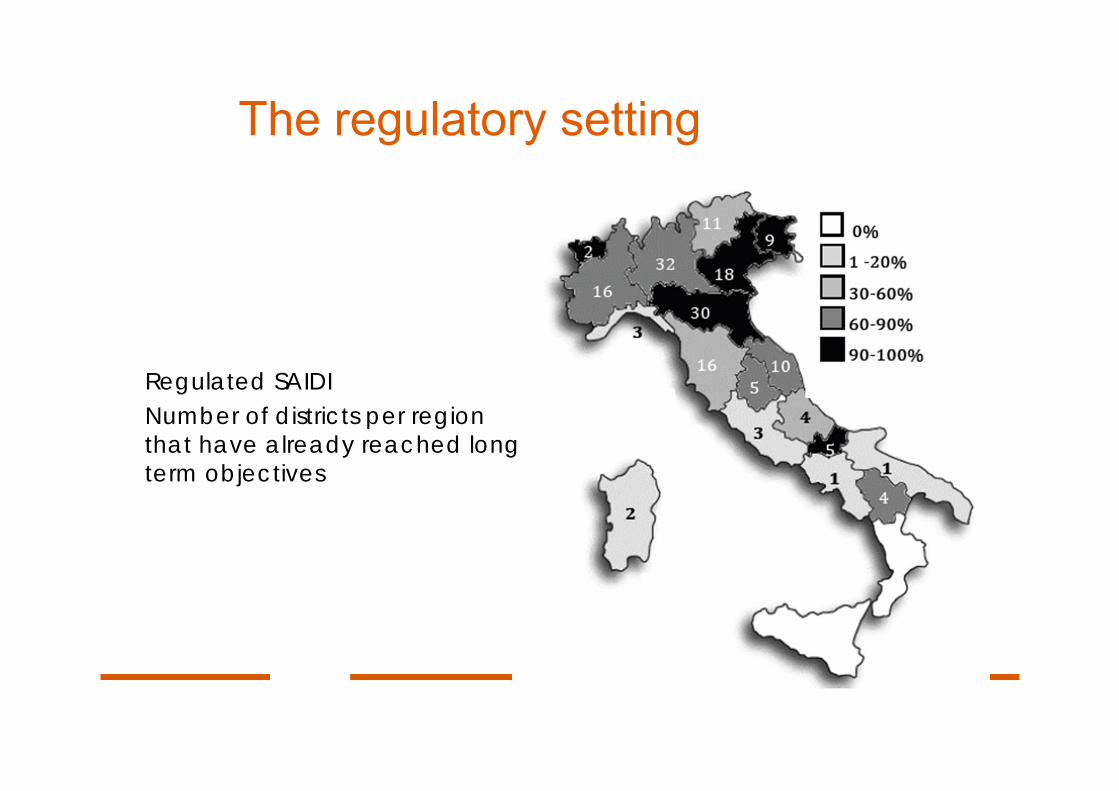
The regulatory setting45
Regulated SAIDINumber of districts per region that have already reached long term objectives
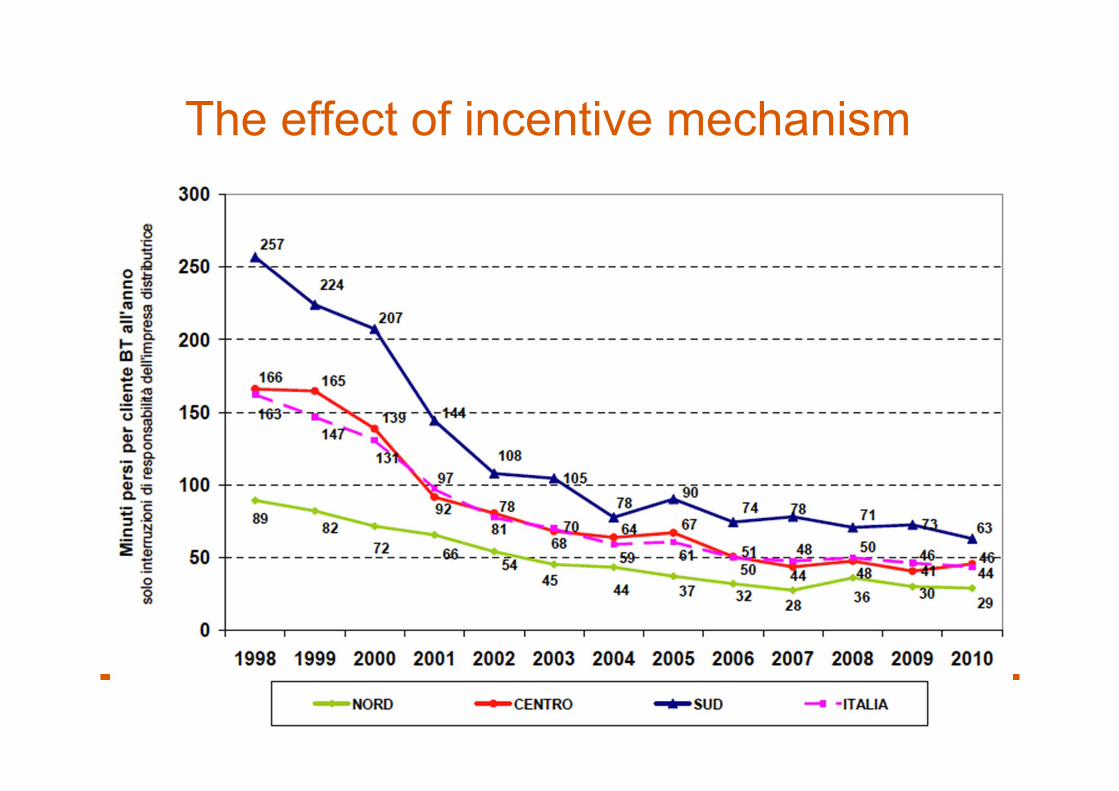
The effect of incentive mechanism 46
Policy options for quality✤Rewards preferentially assigned to better performers in 2004
✤Rewards preferentially assigned to Cost-efficient Zones
✤Regulatory incentives for quality were never meant as a compensationfor quality-related expenditures
✤Policy option (1)✜Support quality improvements (where difficult to achieve) rather than
reward good performance✜AEEG Regulatory Order n. ARG/elt 198/11: since January 2012
rewards to high performing districts have been significantly reduced,while those to underperforming ones can increase if significantimprovements in SAIDI are achieved
47
Policy options for quality
✤Policy option (2)✜Current national standards account for network density, but they
disregard the composition of the load✜Redefined in terms of costs of ENS, convergence might not require
the same level of expenditures, by reducing the need to spend inareas where the composition of the load does not justify theexpenses
48
Financial issues in Regulation
✤ Financial issues in Price Cap regulation:
✤ It is true that in price cap regulation Regulatordoes not directly set a return on investment…. But it has to do that almost indirectly inorder to correctly take into account the cost ofcapital when evaluating a policy intervention.
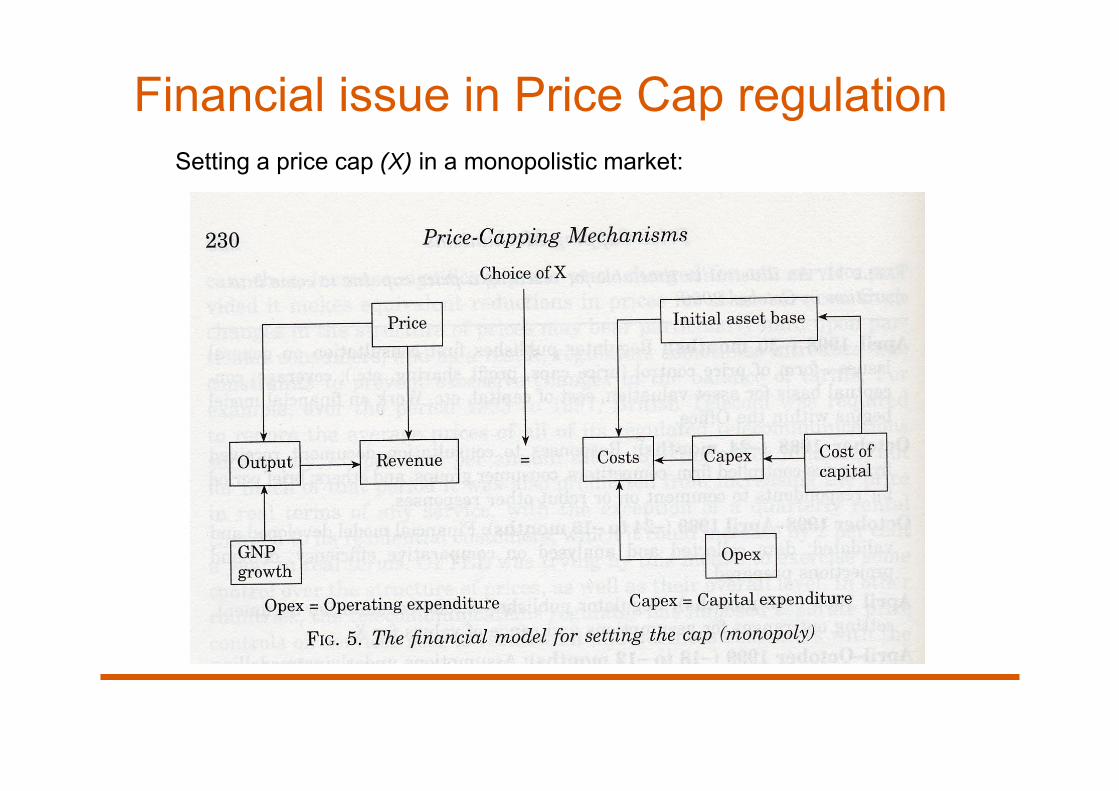
Financial issue in Price Cap regulationSetting a price cap (X) in a monopolistic market:
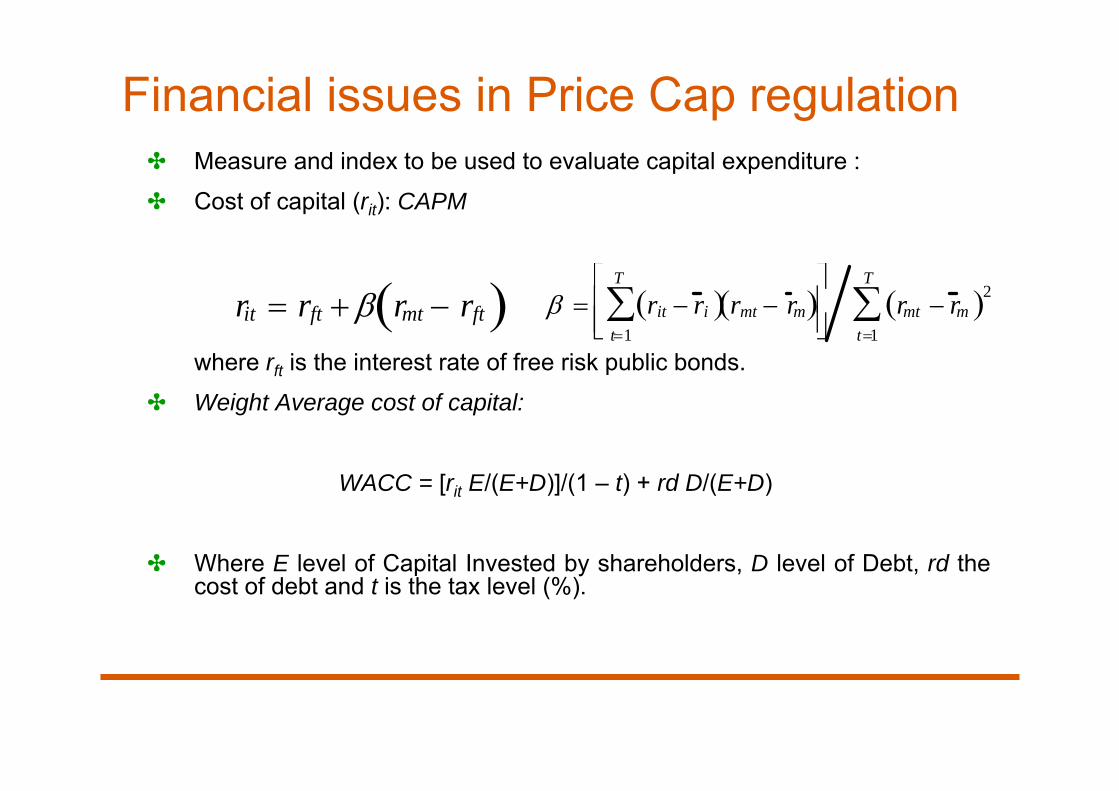
Financial issues in Price Cap regulation✤ Measure and index to be used to evaluate capital expenditure :
✤ Cost of capital (rit): CAPM
where rft is the interest rate of free risk public bonds.
✤ Weight Average cost of capital:
WACC = [rit E/(E+D)]/(1 – t) + rd D/(E+D)
✤ Where E level of Capital Invested by shareholders, D level of Debt, rd thecost of debt and t is the tax level (%).
rit rft rmt rft rit r i rmt r m
t1
T
rmt r m 2
t1
T
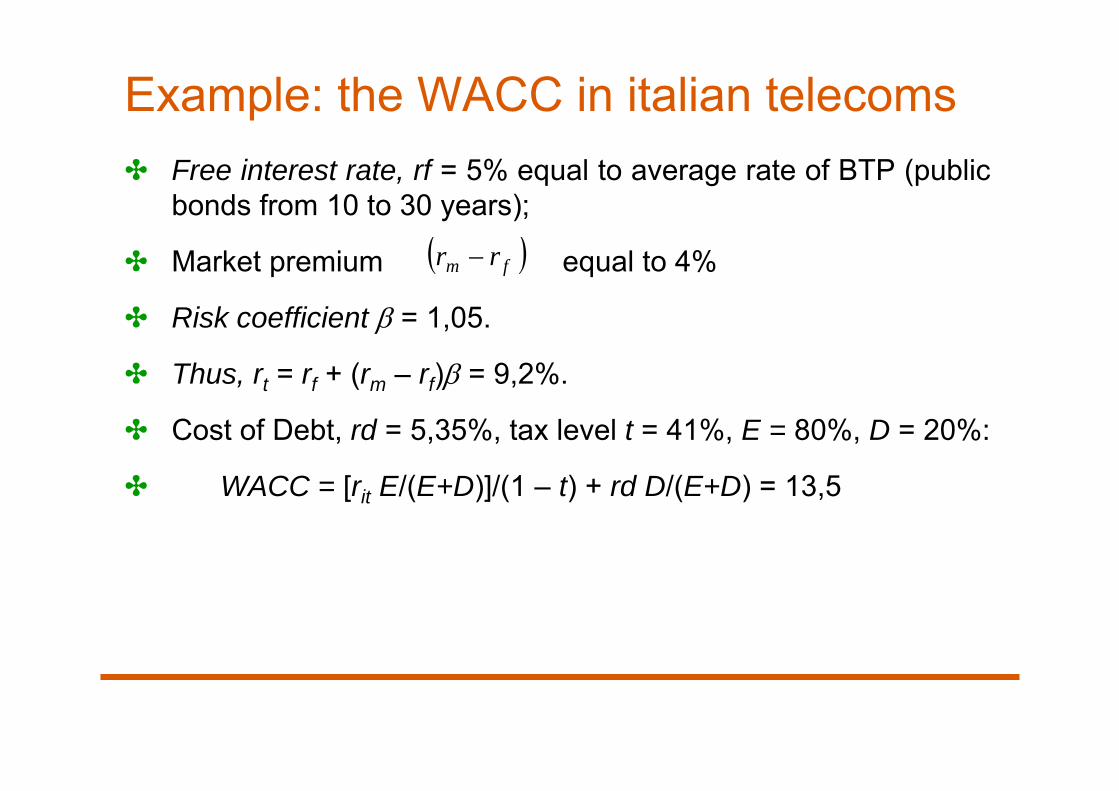
Example: the WACC in italian telecoms✤ Free interest rate, rf = 5% equal to average rate of BTP (public
bonds from 10 to 30 years);
✤ Market premium equal to 4%
✤ Risk coefficient = 1,05.
✤ Thus, rt = rf + (rm – rf) = 9,2%.
✤ Cost of Debt, rd = 5,35%, tax level t = 41%, E = 80%, D = 20%:
✤ WACC = [rit E/(E+D)]/(1 – t) + rd D/(E+D) = 13,5
fm rr
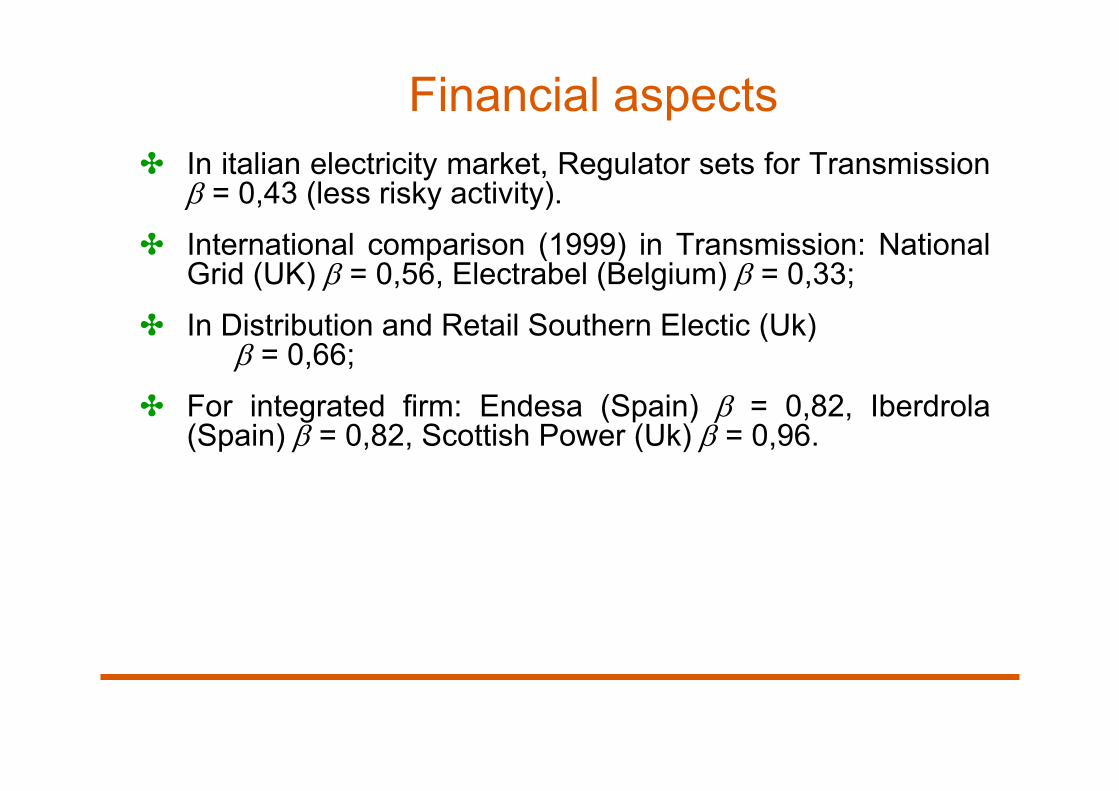
Financial aspects✤ In italian electricity market, Regulator sets for Transmission
= 0,43 (less risky activity).
✤ International comparison (1999) in Transmission: NationalGrid (UK) = 0,56, Electrabel (Belgium) = 0,33;
✤ In Distribution and Retail Southern Electic (Uk) = 0,66;
✤ For integrated firm: Endesa (Spain) = 0,82, Iberdrola(Spain) = 0,82, Scottish Power (Uk) = 0,96.
54
international benchmarking: DB ML Group Infrastructure and ORR;
national benchmarking: Terna, electricity network, and Snam, gas network
DELIBERATION N. 75/2016 ART ON RAILWAYS ACCESS CHARGING
55
The “Dash for Debt”
✤ Ten years after the beginning of privatization and liberalizationin network industries in Europe, regulated utilities havesubstantially increased their financial leverage
✤ In the U.K., DTI and HM Treasury (2004) have expressed aconcern about the “dash for debt” “flight of equity” within theU.K. utilities sector from the mid-late 1990’s
✤ They argue that high leverage “could imply greater risks offinancial distress, transferring risk to consumers and taxpayersand threatening the future financeability of investmentrequirements”
56
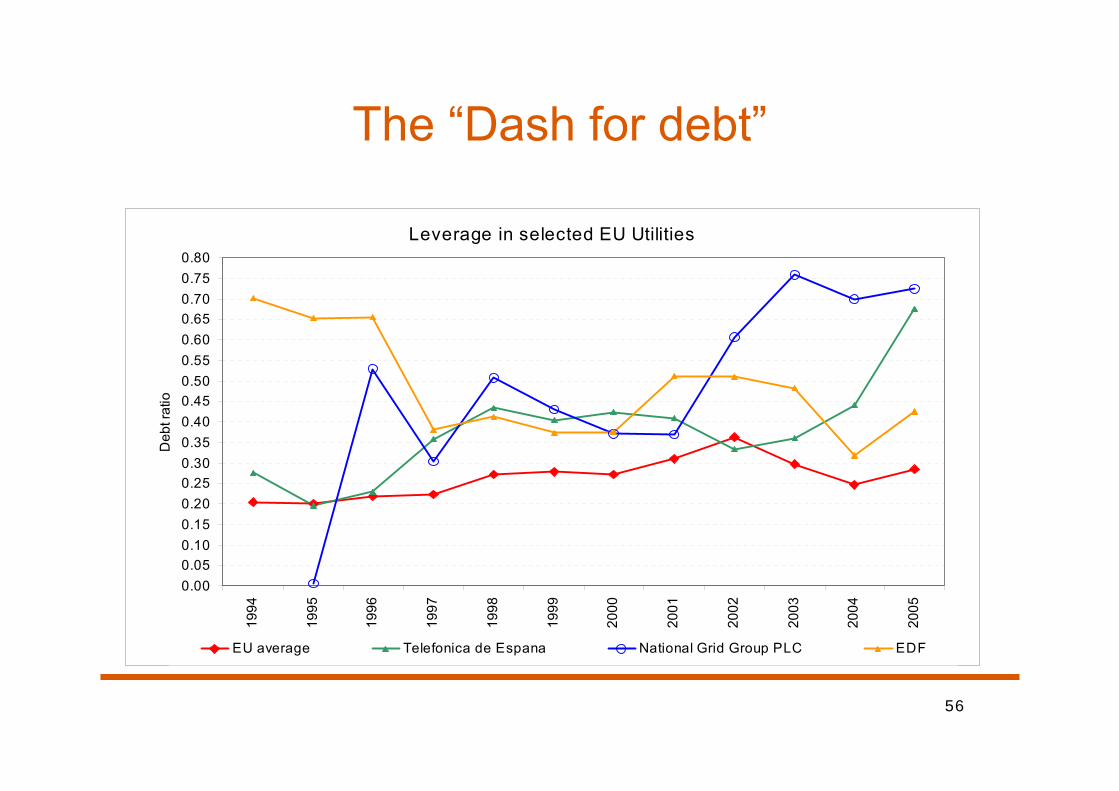
The “Dash for debt”
Leverage in selected EU Utilities
0.000.050.100.150.200.250.300.350.400.450.500.550.600.650.700.750.80
1994
1995
1996
1997
1998
1999
2000
2001
2002
2003
2004
2005
Deb
t rat
io
EU average Telefonica de Espana National Grid Group PLC EDF
57
The relevance of capital structure for regulated firms
✤ In the U.S., regulated rates are set so as to ensure the firm a“fair” rate of return on its capital
✤ In Europe, regulators often use RPI-X regulation, that ensurethat the firm will earn a return on its capital which will induce itto enhance and maintain its network
The determination of regulated rates depends to a large extenton the firm’s capital structure
By properly choosing its capital structure, a regulated firm canaffect its rates and hence its profitability
58
Europe and the U.S.
✤ It is well-documented that U.S. regulated utilities (which were always privateand subject to rate regulation by state and by federal commissions since the1910’s) are highly leveraged (Bowen, Daly and Huber (FM, 1982), Bradley,Jarrell, and Kim (JF, 1984) and Barclay, Marx, and Smith (JCF, 2003))
✤ The European situation is different because:✜ Private ownership and control of utilities is still the exception rather than the rule
(Bortolotti and Faccio, 2008 RFE)
✜ The degree of liberalization varies considerably across countries, and is stillincomplete in most sectors
✜ Not all European utilities are regulated by an independent regulatory agency(IRA): in some sectors regulation is performed directly by ministries,governmental committees, or local governments
59
A Strategic Explanation of Leverage 1/2
✤ In Public Utilities, regulatory choices (and political stance)change over time
✤ Typical problems are regulators’ lack of committment leadingto firms’ underinvestment (Armstrong and Sappington, 2006JEL; Guthrie, 2006 JEL)
✤ To provide investment incentives, regulators choose the “fair”rate of return
✤ But firms fear that the regulator will reduce the price after theinvestment is sunk
60
A Strategic Explanation of Leverage 2/2
✤ May firms “use” capital structure to influence the regulators’decisions? … and may regulators “use” capital structure to tie theirown hands and discipline their own opportunism?
✤ A welfare maximizing regulator has the incentive to set a highregulated price so as to reduce the probability that the firm willbecome financially distressed (Spiegel and Spulber, 1994 RAND)
✤ The firm’s leverage mitigates regulatory opportunism
✤ The regulator allows the firm to choose its leverage in order tocommit not to engage in opportunistic behaviour
61
Bortolotti, Cambini, Rondi and Spiegel (2011, JEMS)
✤ Unbalanced panel of virtually all 92 publicly traded utilities and transportationinfrastructure operators during 1994-2005 (927 firm-year observations) in 14 EUmember states:✜ 44 firms in electricity and gas distribution✜ 13 water supply companies✜ 15 telecoms (mainly vertically integrated operators)✜ 8 freight roads concessionaires✜ 12 transportation infrastructure operators
✤ We excluded airlines, oil and refinery companies, wireless telecoms, andelectricity generators because typically their prices are not regulated
✤ 67 firms in our sample have been privatized by 2005. Of these firms 24 havebeen privatized during 1994-2005 period. 25 firms in our sample are still state-controlled in 2005.
✤ Privatization is still incomplete: the state’s UCR in the firms in our sample are37% on av.
62
✤ Evidence that utilities increase their leverage following theintroduction of price regulation, provided they are privatelycontrolled holds after controlling for:
✜ Alternative measures of leverage: book leverage✜ Heterogeneity across sectors
• Sector-country clustering for common sectoral shocks from IRA• Tests on sub-samples: Energy, Electricity, TLC
✜ Privatization effects: Privatized vs. Non-privatized; Golden Share✜ Exogenous changes in equity markets: Stock market indexes and
Investor protection indexes
63
Leverage and prices
✤ Leverage Granger-causes Regulated Prices✜ The full sample✜ When the IRA is in place✜ Firms in industries regulated by an IRA✜ Privately-controlled firms (under 50% and restricted def.)✜ Firms that were and remained private (never privatized)
✤ Regulated Prices do not Granger-cause Leverage in all above cases✜ Leverage does not Granger-cause regulated prices for the sub-sample of
State-controlled firms
64
“ Arrangements for responding in the event that a network company experiences deteriorating
financial health “
Ofgem, 2008, n. 158, Position Paper
65
The Ofgem Proposal (1/3)✤ The legislative and regulatory framework in place for Britain’s energy networks is
designed to reduce the risk of financial distress affecting network operators and toensure that an acceptable level of service continues to be provided to consumersshould financial distress occur.
✤ There are a number of potential causes of financial distress. In some cases financialdistress may reflect the actions or strategies of the affected company, such as thefailure of management to control expenditure or excessive gearing, where acompany relies heavily on debt to finance its activities. It can also result from theactions of another party, such as the default or insolvency of a major trading partner.Finally, financial distress may result from the impact of exogenous factors thatimpose additional costs on a company or make it less attractive to investment.Financial distress may result from a combination of these or other factors.
66
The Ofgem Proposal (2/3)
✤ Regulatory remedy: financial ring-fence
✤ “Financial ring fence‟ is the requirement for the companies to provide a statementsigned by a director of the licensee and accompanied by a supporting statementfrom its auditors setting out that the company has adequate resources to properlyand efficiently carry out its functions over the next financial year.
✤ Another provision of the „financial ring fence‟ provides for a cash lock-up in certaincircumstances between the licensee and its affiliates. This prohibits a parentcompany from taking money out of a network company and thus out of theregulated GB networks in order to address financial concerns at a Group level.
✤ Collectively, the ring-fence conditions aim to protect the financial health of networkcompanies, and enable us to monitor financial health and take action wherenecessary (including enforcement action) to seek to prevent a materialdeterioration in the financial health of a network company.
67
✤ Other arrangements:✜ Information on detailed cost and revenue reporting arrangements in
place for the network companies✜ Control over Investment and its relation with service supply✜ Other financial informations (shares, credit ratings …..)
✤ However, OFGEM states that, even though notdesiderable, it might also consider to re-open thenegotiation process on price mechanism (re-openingprice control)!!!!
The Ofgem Proposal (3/3)
68
Re-opening price control (1/2)
✜ “[…] the cause of financial distress is largely due to factors beyond thecompany‟s control. These might include:
(i) instances where additional workload has arisen from new legislation that was not anticipated at the time of the last review, or unanticipated consumer demand; or
(ii) a material change in financial market conditions relative to those prevailing at the time a price control was set such that that an efficient company with an investment grade credit rating would no longer be able to finance its activities.”
✜ “Re-opening the settlement could reasonably be expected to relieve thefinancial distress in a timely manner.
69
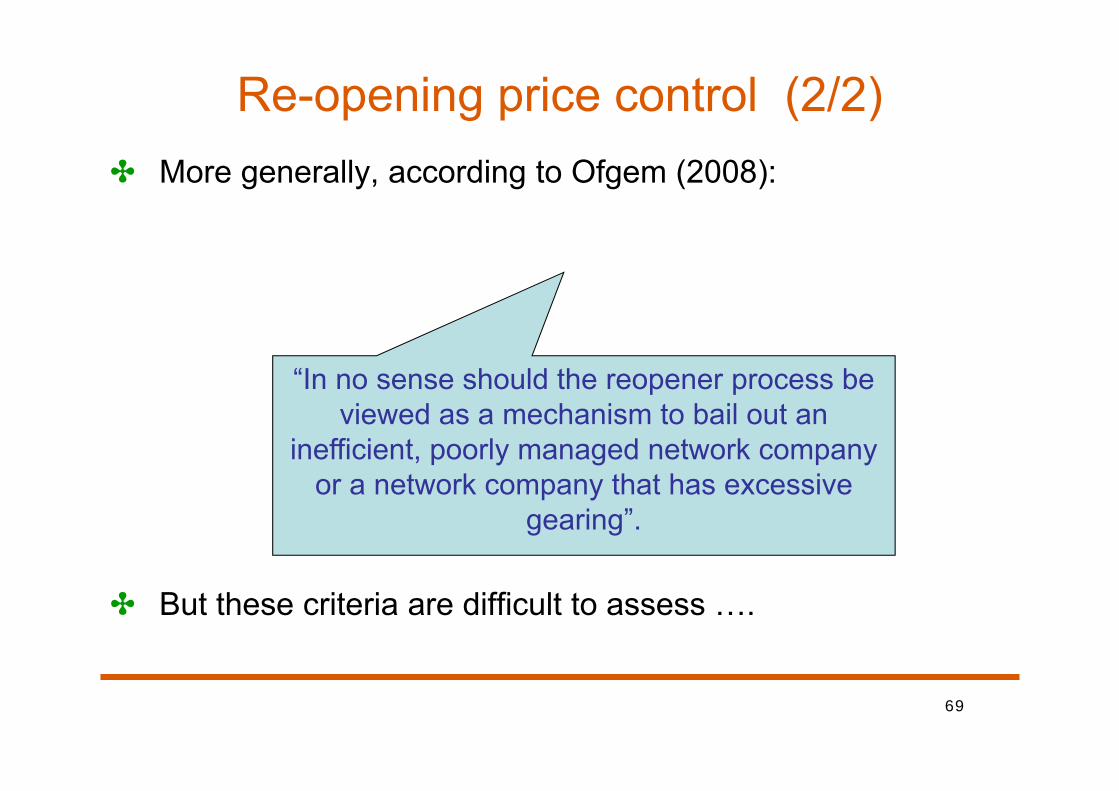
✤ More generally, according to Ofgem (2008):
✤ But these criteria are difficult to assess ….
Re-opening price control (2/2)
“In no sense should the reopener process be viewed as a mechanism to bail out an
inefficient, poorly managed network company or a network company that has excessive
gearing”.