Embed Size (px)
Citation preview
1
Regulatory methodologies
Incentive regulation for transport and
distribution of electricity,
French, Dutch and English examples
Stephane Jacobzone (OECD Secretariat)
Based on materials transmitted by the French energy regulator
2
1.1. Why incentive regulation?
1.2. Principles and risks
Outline
1.3. Different models
1.4. Economic Performance and quality of service
3
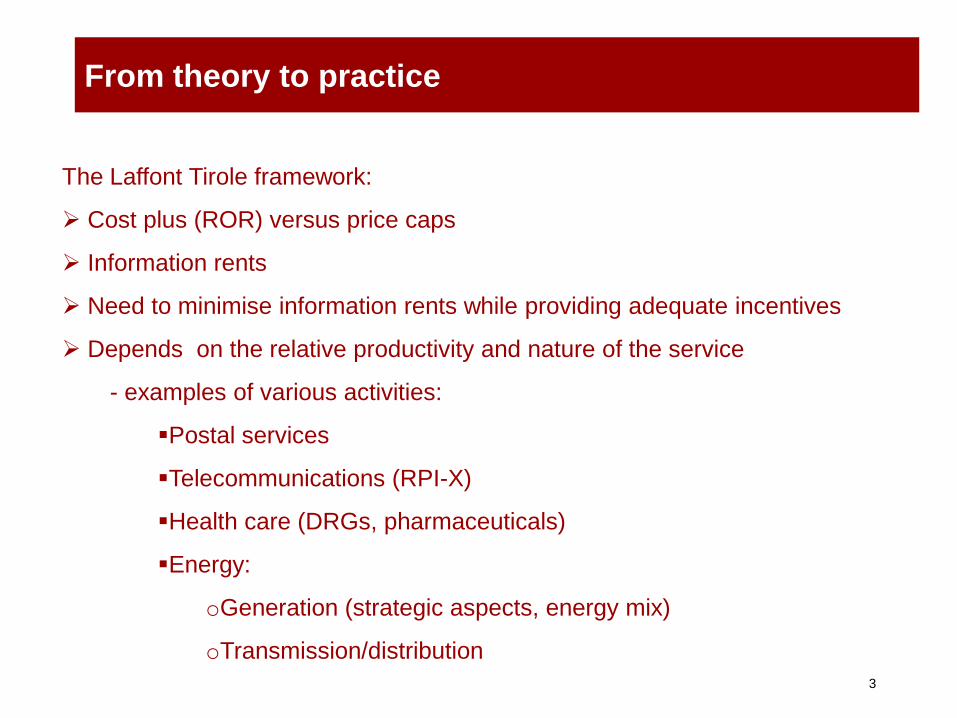
From theory to practice
The Laffont Tirole framework:
Cost plus (ROR) versus price caps
Information rents
Need to minimise information rents while providing adequate incentives
Depends on the relative productivity and nature of the service
- examples of various activities:
Postal services
Telecommunications (RPI-X)
Health care (DRGs, pharmaceuticals)
Energy:
oGeneration (strategic aspects, energy mix)
oTransmission/distribution
4
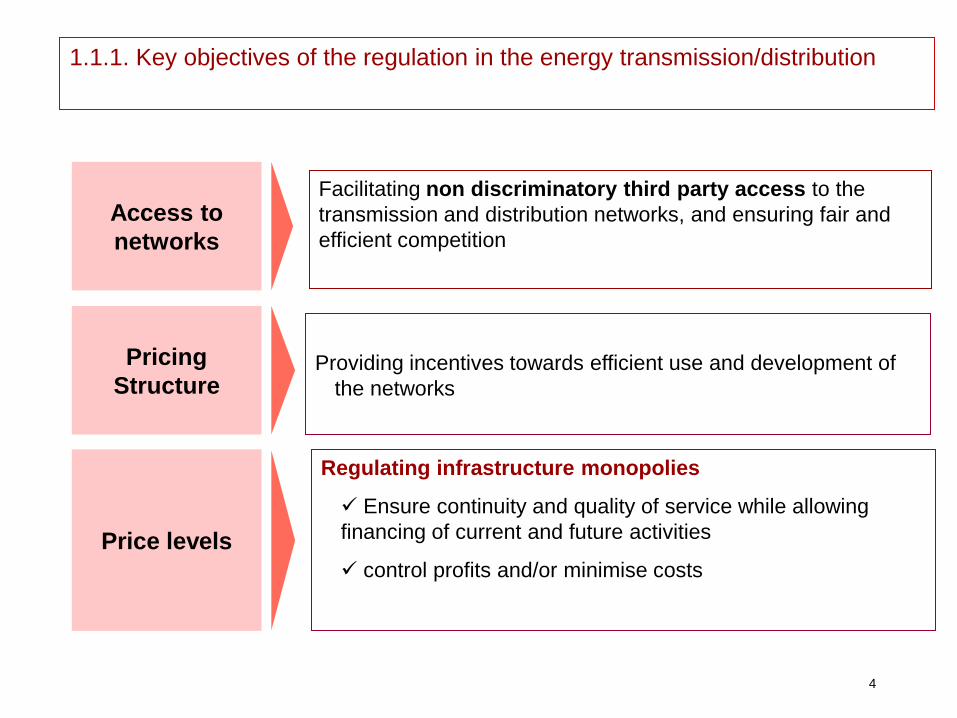
1.1.1. Key objectives of the regulation in the energy transmission/distribution
Regulating infrastructure monopolies
Ensure continuity and quality of service while allowing
financing of current and future activities
control profits and/or minimise costs
Price levels
Providing incentives towards efficient use and development of
the networks
Pricing
Structure
Facilitating non discriminatory third party access to the
transmission and distribution networks, and ensuring fair and
efficient competition
Access to
networks
5
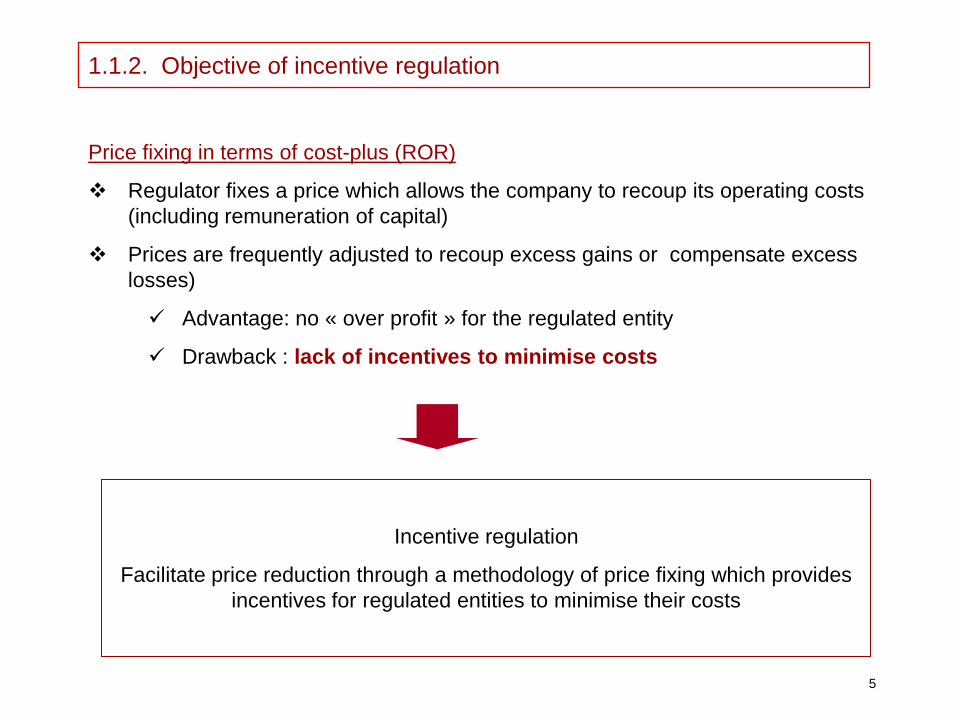
1.1.2. Objective of incentive regulation
Price fixing in terms of cost-plus (ROR)
Regulator fixes a price which allows the company to recoup its operating costs
(including remuneration of capital)
Prices are frequently adjusted to recoup excess gains or compensate excess
losses)
Advantage: no « over profit » for the regulated entity
Drawback : lack of incentives to minimise costs
Incentive regulation
Facilitate price reduction through a methodology of price fixing which provides
incentives for regulated entities to minimise their costs
6
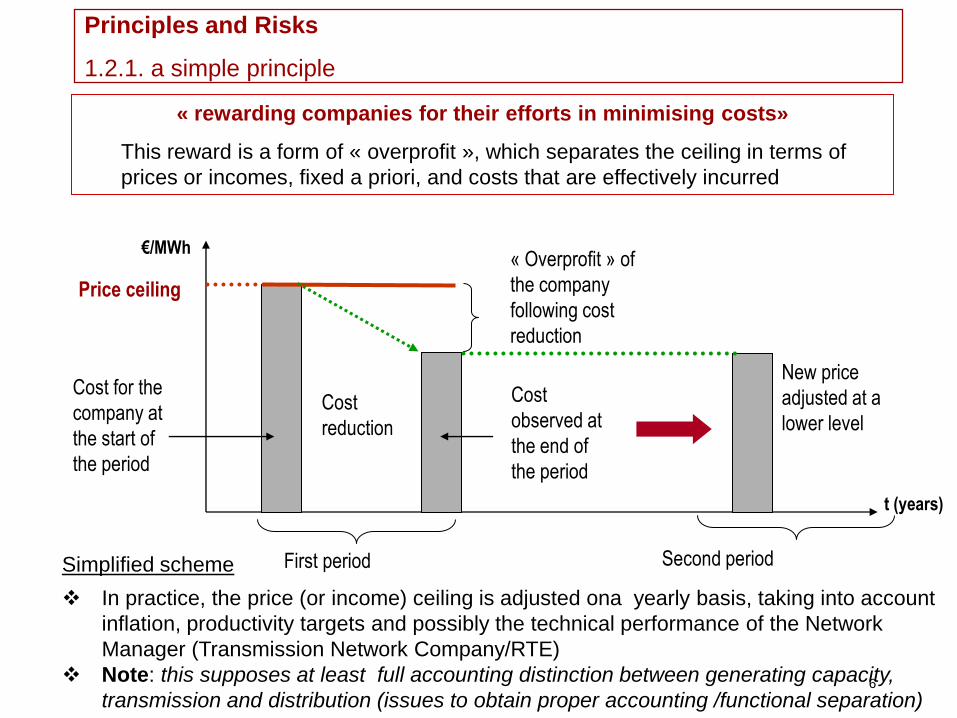
Principles and Risks
1.2.1. a simple principle
« rewarding companies for their efforts in minimising costs»
This reward is a form of « overprofit », which separates the ceiling in terms of
prices or incomes, fixed a priori, and costs that are effectively incurred
Simplified scheme
In practice, the price (or income) ceiling is adjusted ona yearly basis, taking into account
inflation, productivity targets and possibly the technical performance of the Network
Manager (Transmission Network Company/RTE)
Note: this supposes at least full accounting distinction between generating capacity,
transmission and distribution (issues to obtain proper accounting /functional separation)
t (years)
First period
Price ceiling
« Overprofit » of
the company
following cost
reduction
Cost for the
company at
the start of
the period
Cost
observed at
the end of
the period
New price
adjusted at a
lower level Cost
reduction
Second period
€/MWh
7
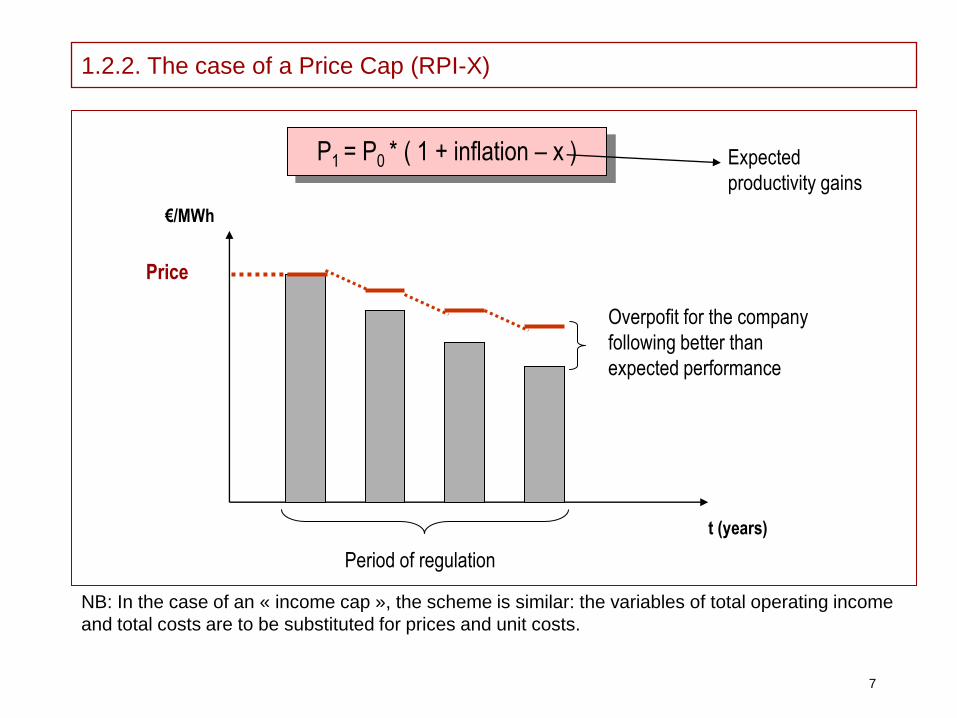
1.2.2. The case of a Price Cap (RPI-X)
P1 = P0 * ( 1 + inflation – x )
t (years)
€/MWh
Period of regulation
Price
Expected
productivity gains
Overpofit for the company
following better than
expected performance
NB: In the case of an « income cap », the scheme is similar: the variables of total operating income
and total costs are to be substituted for prices and unit costs.
8
1.2.3. Overprofit: a normal consequence of incentive regulation
Overprofit is necessary to provide adequate incentives towards cost
reduction
Excessive overprofit is the potential risk with which the regulator is faced
with in the short term, and in terms of political acceptance
Overprofit will be higher if the information asymmetry between the
regulator and the regulated entity is significant
To obtain its overprofit, the network manager reveals to the regulator
information on the amount of effort that he is able to invest to reduce its
costs, as well as on the efficient level of costs
This information allows the regulator to fix lower prices in the second
period
The user is always winning in the long term (if the overprofit results from
cost cutting at constant quality level)
Note: but it needs an ability to commit over several periods: independence of
the regulators, stability of the macroeconomic framework.
9
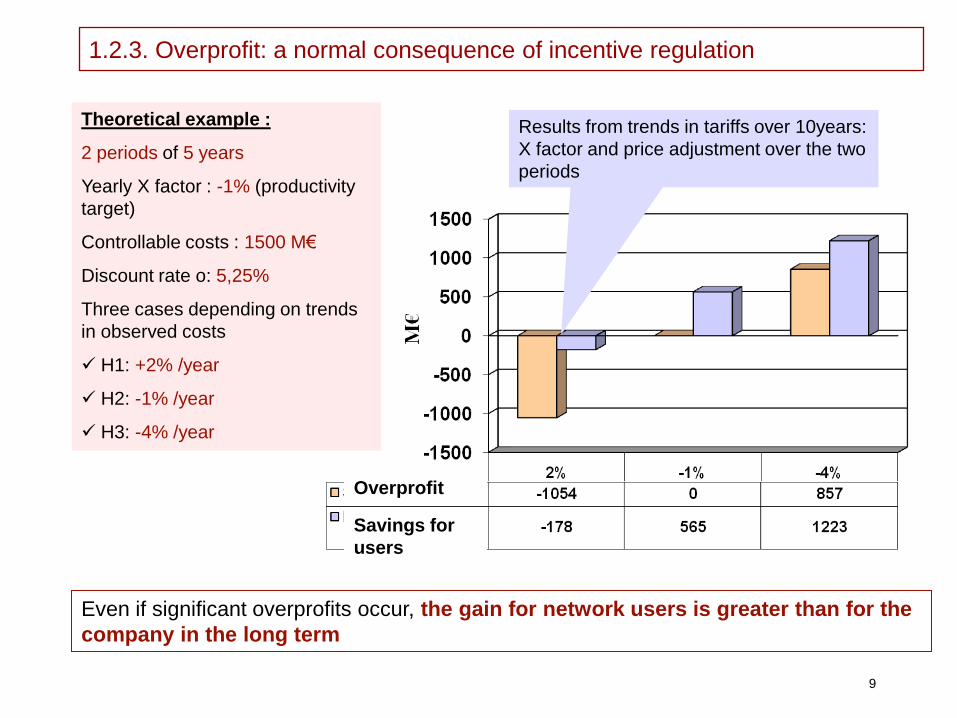
1.2.3. Overprofit: a normal consequence of incentive regulation
Theoretical example :
2 periods of 5 years
Yearly X factor : -1% (productivity
target)
Controllable costs : 1500 M€
Discount rate o: 5,25%
Three cases depending on trends
in observed costs
H1: +2% /year
H2: -1% /year
H3: -4% /year
Even if significant overprofits occur, the gain for network users is greater than for the
company in the long term
Results from trends in tariffs over 10years:
X factor and price adjustment over the two
periods
Overprofit
Savings for
users
10
1.2.4. Paradox of information asymmetries
The regulator implements incentive regulation as it lacks information over the
level of efficient costs for the company
This lack of information confronts the regulator with two types of risks :
Excessive gains of productivity required from the company => financial risk for
the company
Excessive level of remuneration => excessive overprofit
The regulated company can obtain excessive overprofit through :
Overestimating future expenses
Negotiating apparently ambitious targets of productivity which
are in reality easy to reach
Requiring a higher rate of profitability to compensate for
greater financial risk
11
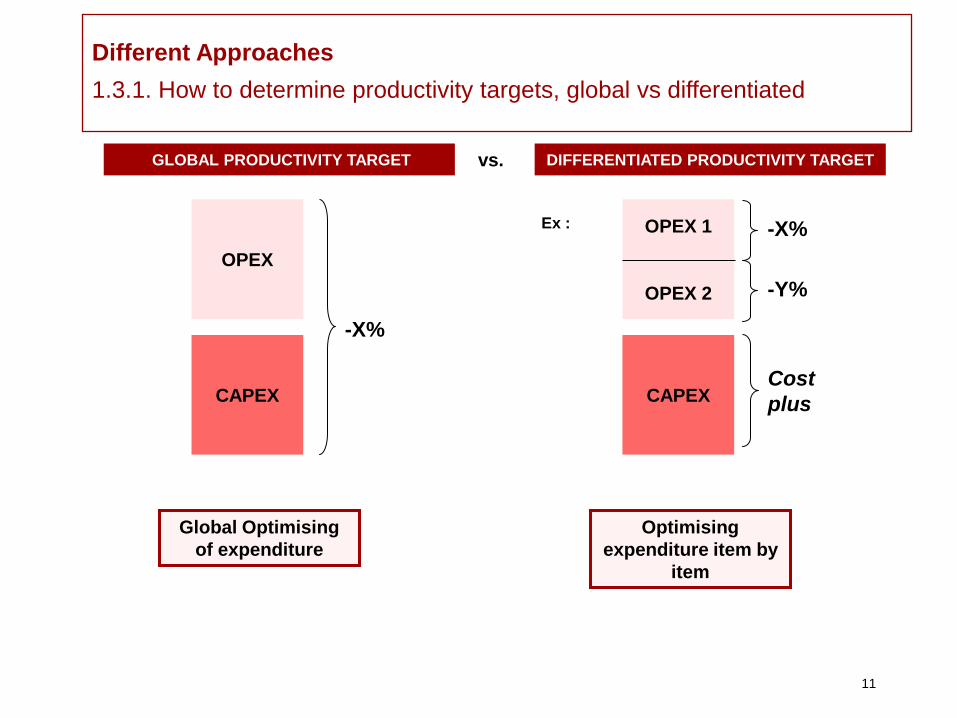
Different Approaches
1.3.1. How to determine productivity targets, global vs differentiated
OPEX
CAPEX
-X%
GLOBAL PRODUCTIVITY TARGET DIFFERENTIATED PRODUCTIVITY TARGET
OPEX 1
OPEX 2
CAPEX
-X%
vs.
Global Optimising
of expenditure
Optimising
expenditure item by
item
Cost
plus
-Y%
Ex :
12
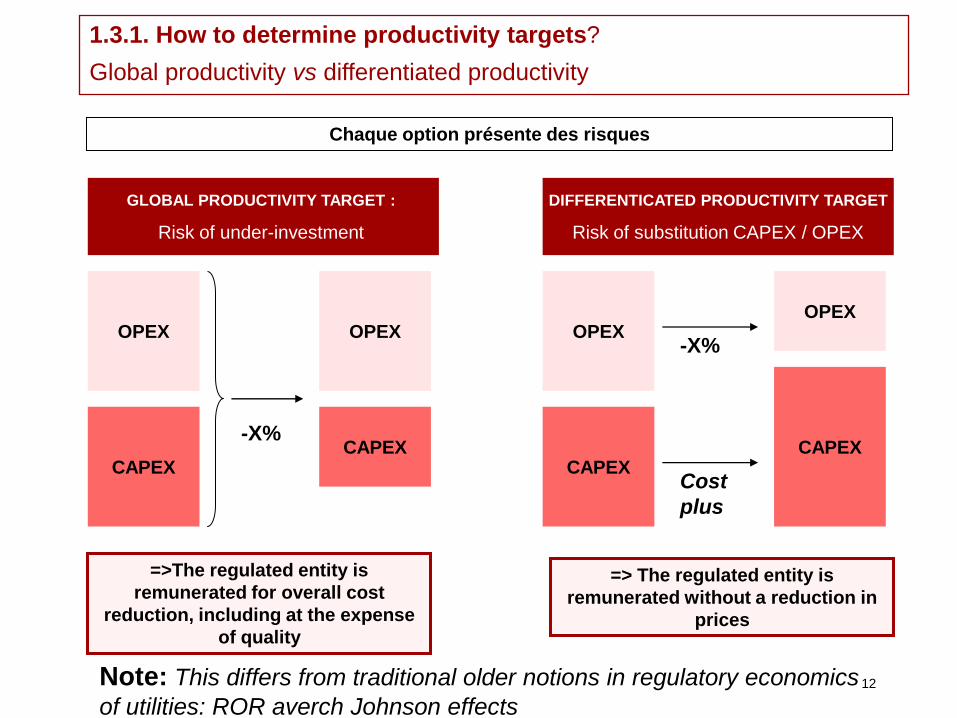
Chaque option présente des risques
GLOBAL PRODUCTIVITY TARGET :
Risk of under-investment
DIFFERENTICATED PRODUCTIVITY TARGET
Risk of substitution CAPEX / OPEX
OPEX
CAPEX
OPEX
CAPEX
OPEX
CAPEX
-X%
OPEX
CAPEX
Cost
plus
-X%
=>The regulated entity is
remunerated for overall cost
reduction, including at the expense
of quality
=> The regulated entity is
remunerated without a reduction in
prices
1.3.1. How to determine productivity targets?
Global productivity vs differentiated productivity
Note: This differs from traditional older notions in regulatory economics
of utilities: ROR averch Johnson effects
13
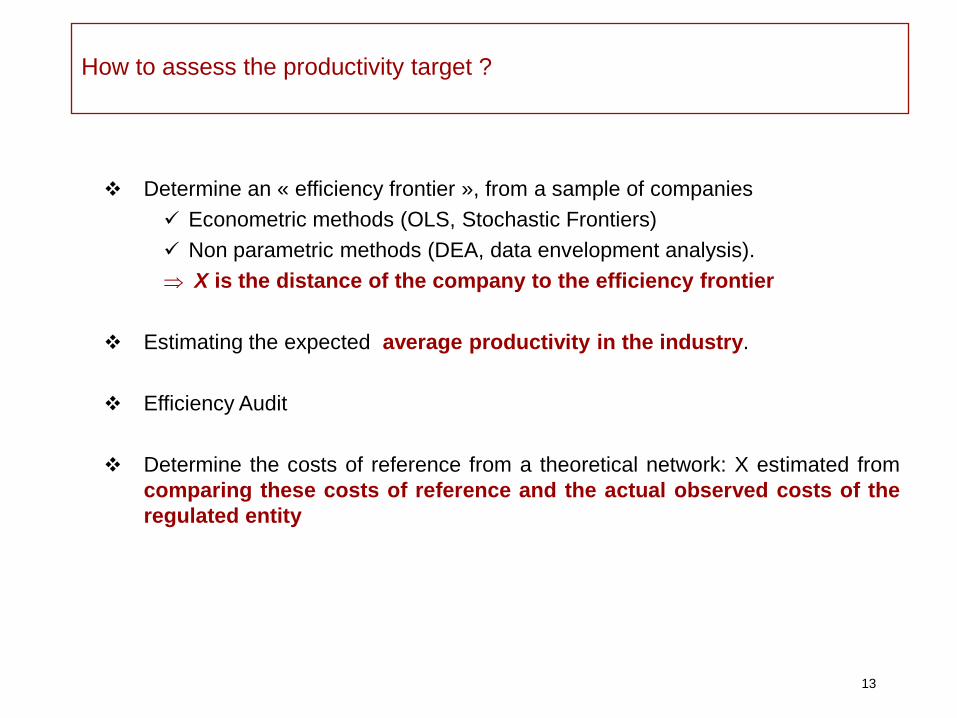
Determine an « efficiency frontier », from a sample of companies
Econometric methods (OLS, Stochastic Frontiers)
Non parametric methods (DEA, data envelopment analysis).
X is the distance of the company to the efficiency frontier
Estimating the expected average productivity in the industry.
Efficiency Audit
Determine the costs of reference from a theoretical network: X estimated from
comparing these costs of reference and the actual observed costs of the
regulated entity
How to assess the productivity target ?
14
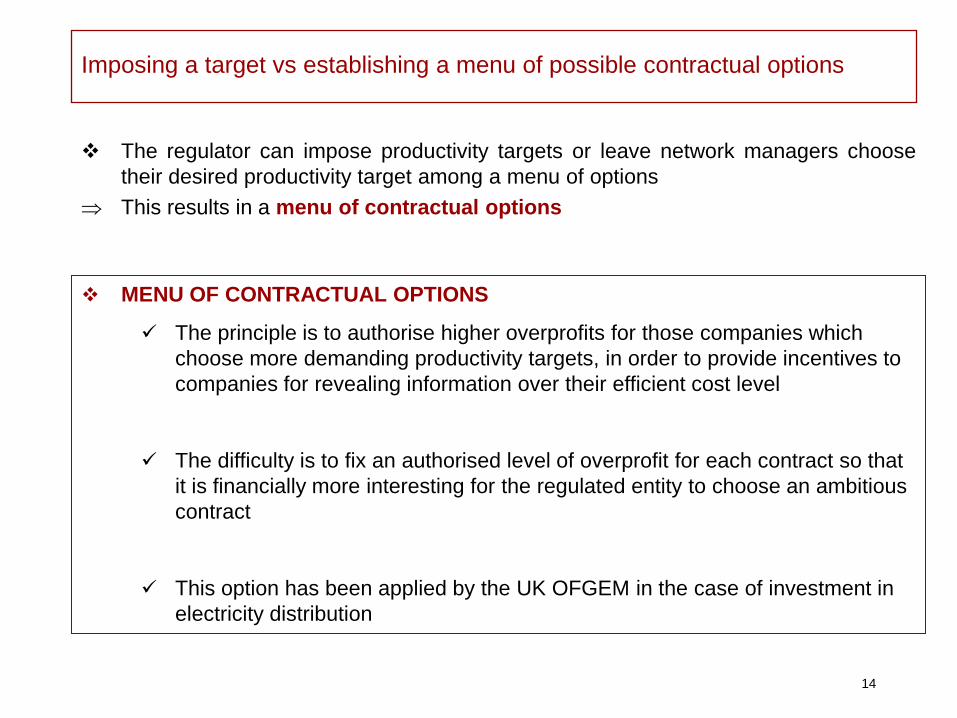
The regulator can impose productivity targets or leave network managers choose
their desired productivity target among a menu of options
This results in a menu of contractual options
Imposing a target vs establishing a menu of possible contractual options
MENU OF CONTRACTUAL OPTIONS
The principle is to authorise higher overprofits for those companies which
choose more demanding productivity targets, in order to provide incentives to
companies for revealing information over their efficient cost level
The difficulty is to fix an authorised level of overprofit for each contract so that
it is financially more interesting for the regulated entity to choose an ambitious
contract
This option has been applied by the UK OFGEM in the case of investment in
electricity distribution

15
The level of incentives of the chosen model
The level of incentive depends primarily on the duration of the period of
regulation
The level of incentive can be diminished by mechanisms that may cap profits (but
also losses) of the regulated entity during the period of regulation
Such a mechanism may reduce the incentive power of the regulation but may also
protect the regulator against excessive overprofit or against the risk of financial
non viability of the regulated entity
Ex : a possibility is to cap the rate of return ex-post.
The level of incentive depends on the credibility of the regulator and its ability to
make firm commitments as concerns the rules that have been set ex-ante.
Note
Difficulty to commit over time periods (emerging countries)
Macroeconomic stability
Too short periods: equivalent to a ROR/Cost plus
16
0
20
40
60
80
100
120
0
20
40
60
80
100
120
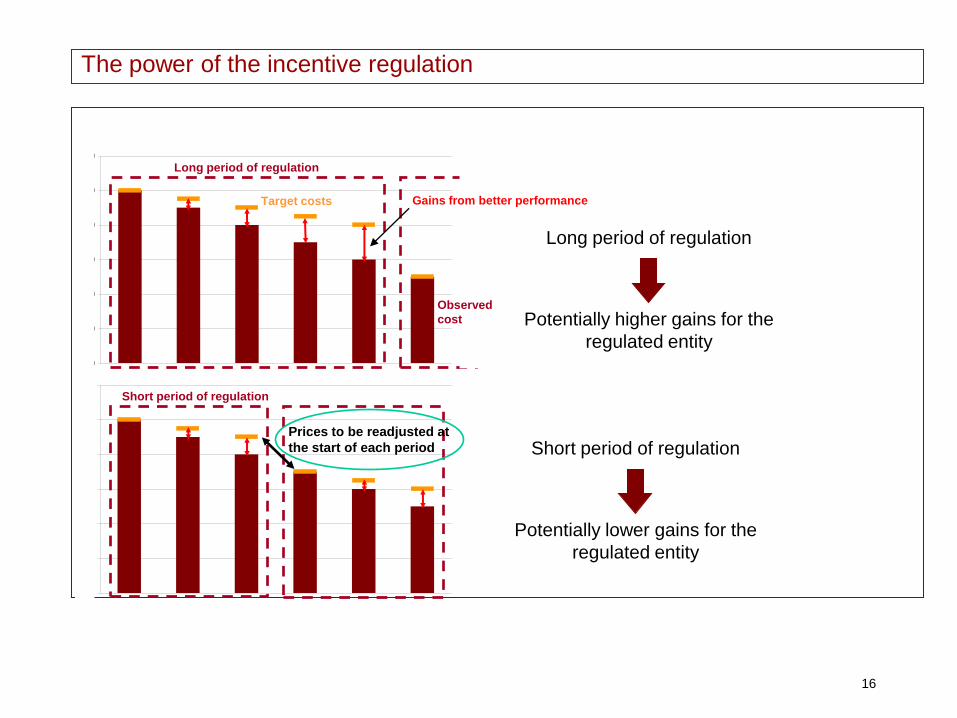
Long period of regulation
Long period of regulation
Target costs Gains from better performance
Observed
cost Potentially higher gains for the
regulated entity
Prices to be readjusted at
the start of each period
Short period of regulation
Short period of regulation
Potentially lower gains for the
regulated entity
The power of the incentive regulation
17
The level of uncertainty faced by the network manager
Sources of uncertainty for network managers
Difficulty in forecasting future costs, or lack of control
Difficulty of estimating future electricity consumption (in the case of a price
cap rather than an income cap)
Capacity of the network manager to reduce costs to reach the fixed
productivity target
Productivity gains and level of remuneration of the company
As target productivity is imposed, perception of risk by the regulated entity
may increase
An increase in the level of remuneration is only warranted if the productivity
target is demanding
18
Economic Performance vs service quality
.4.1. the risk of reduction in quality of service
The network manager may be tempted to reduce its costs at the expense of
service quality, reducing investments or expenses for maintenance and
intervention
This risk will be even more important if the regulatyor opts for a global
productivity target.
Monitoring investment policies
Implementing incentive regulation for quality
19
Incentive regulation for quality
Two main approaches (1/2)
First approach : Fixing optimum quality standards and imposing penalties in
case of non compliance
The quality standard is determined through equalising at the margin :
The marginal production cost of quality by the network manager
The marginal cost of « non quality » for users of the network
This marginal cost of non-quality for users is supposed to be constant and can be
estimated from surveys
Most often, the regulator does not have information on the marginal costs for
producing quality (which would require thorough modelling of the whole network).
=> In practice, this approach is not applied frequently
20
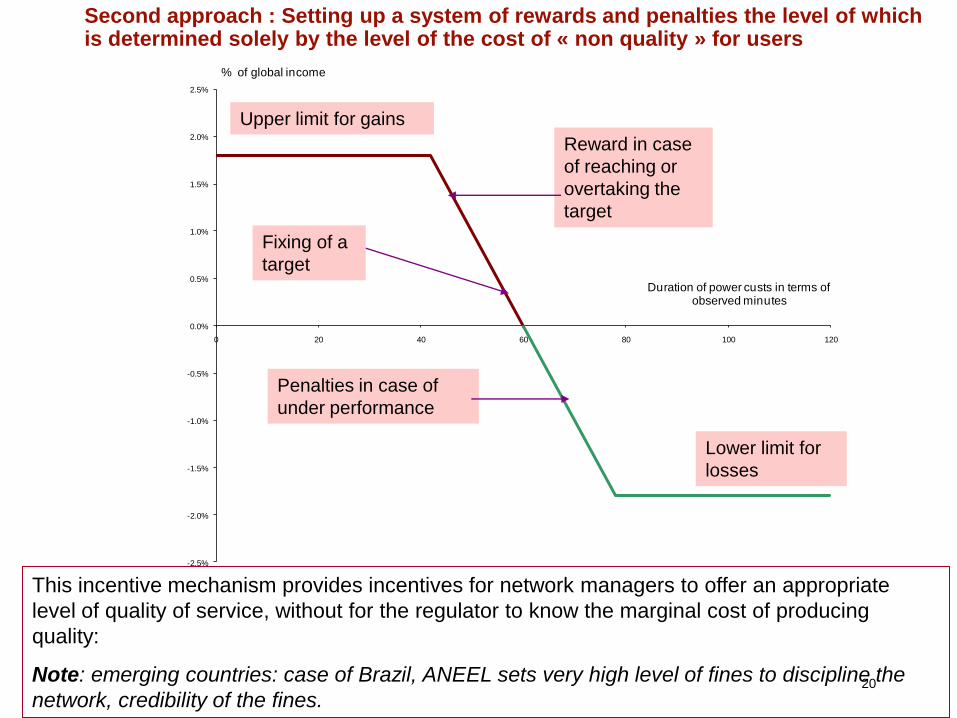
This incentive mechanism provides incentives for network managers to offer an appropriate
level of quality of service, without for the regulator to know the marginal cost of producing
quality:
Note: emerging countries: case of Brazil, ANEEL sets very high level of fines to discipline the
network, credibility of the fines.
Second approach : Setting up a system of rewards and penalties the level of which is determined solely by the level of the cost of « non quality » for users
-2.5%
-2.0%
-1.5%
-1.0%
-0.5%
0.0%
0.5%
1.0%
1.5%
2.0%
2.5%
0 20 40 60 80 100 120
Duration of power custs in terms of observed minutes
% of global income
Fixing of a
target
Reward in case
of reaching or
overtaking the
target
Lower limit for
losses
Upper limit for gains
Penalties in case of
under performance
21
Additional options
Penalties/rewards can be applied globally (in terms of overall price variation), or
for each affected user
Incentives schemes which include only penalties may involve:
Direct compensations solely directed to the users impacted by the
deterioration in quality
Or compensating all users through a reduction of prices
Symmetric schemes with penalties and rewards involve price adjustment in the
follow up period
22
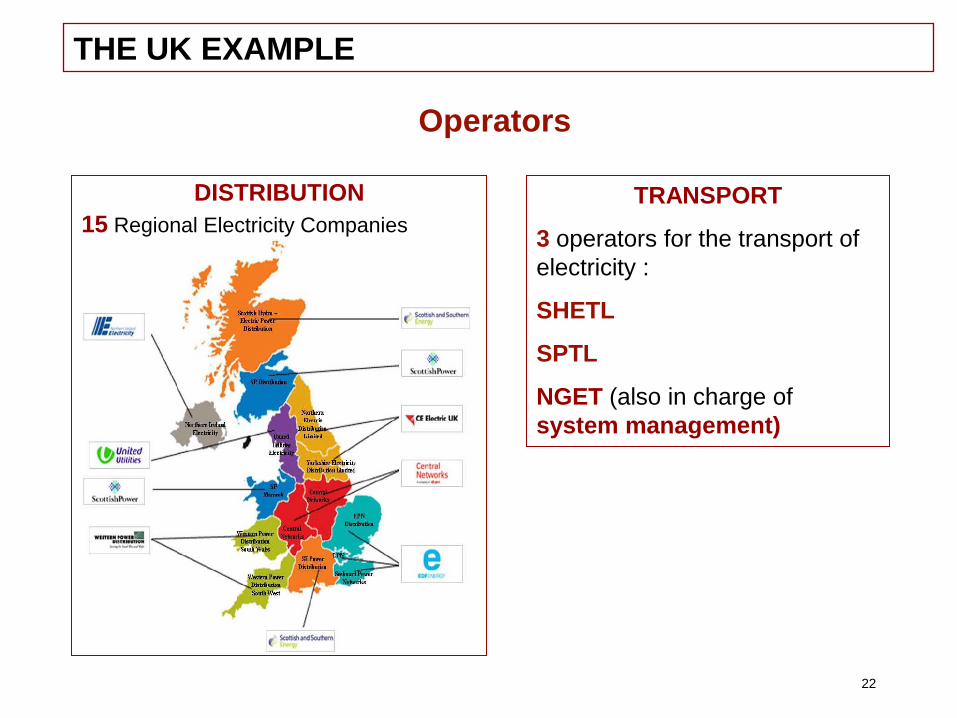
Operators
THE UK EXAMPLE
DISTRIBUTION
15 Regional Electricity Companies
TRANSPORT
3 operators for the transport of
electricity :
SHETL
SPTL
NGET (also in charge of
system management)
23
Structure of prices for clients are fixed by the companies (licences awarded by
Ofgem fix main rules for the structure of prices)
Pricniple of incentive regulation established in legal Act (Utility Act 2000).
OFGEM (Office for Gas and Electricity Market) checks that incomes received by
operators does not go over an authorised threshold for authorised annual income:
income cap principle
Regulatory framework
24
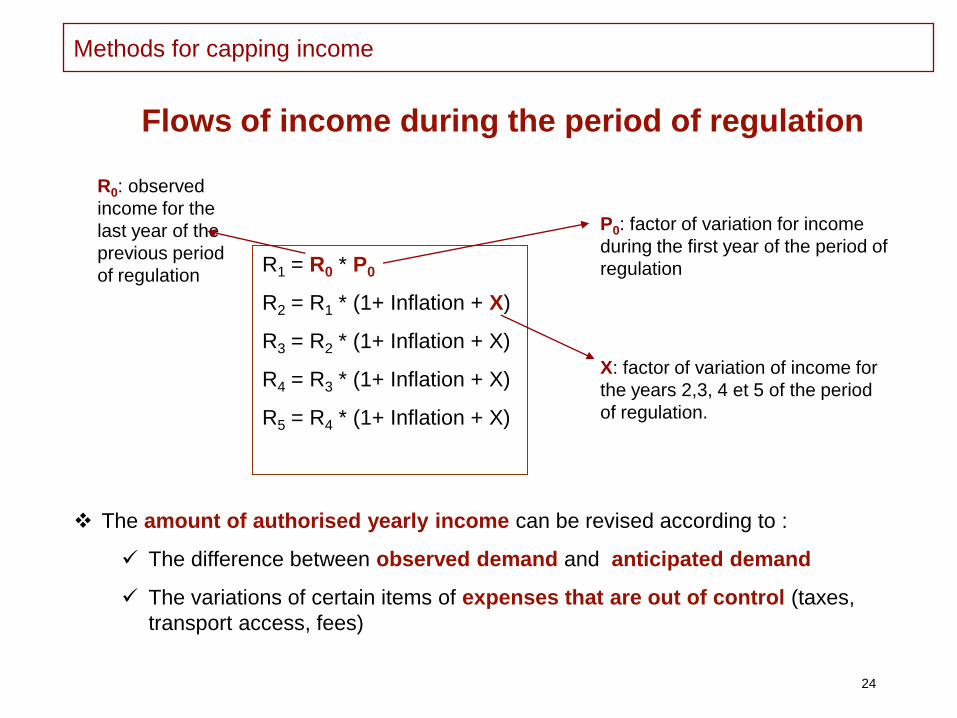
Methods for capping income
R1 = R0 * P0
R2 = R1 * (1+ Inflation + X)
R3 = R2 * (1+ Inflation + X)
R4 = R3 * (1+ Inflation + X)
R5 = R4 * (1+ Inflation + X)
P0: factor of variation for income
during the first year of the period of
regulation
Flows of income during the period of regulation
X: factor of variation of income for
the years 2,3, 4 et 5 of the period
of regulation.
R0: observed
income for the
last year of the
previous period
of regulation
The amount of authorised yearly income can be revised according to :
The difference between observed demand and anticipated demand
The variations of certain items of expenses that are out of control (taxes,
transport access, fees)
25
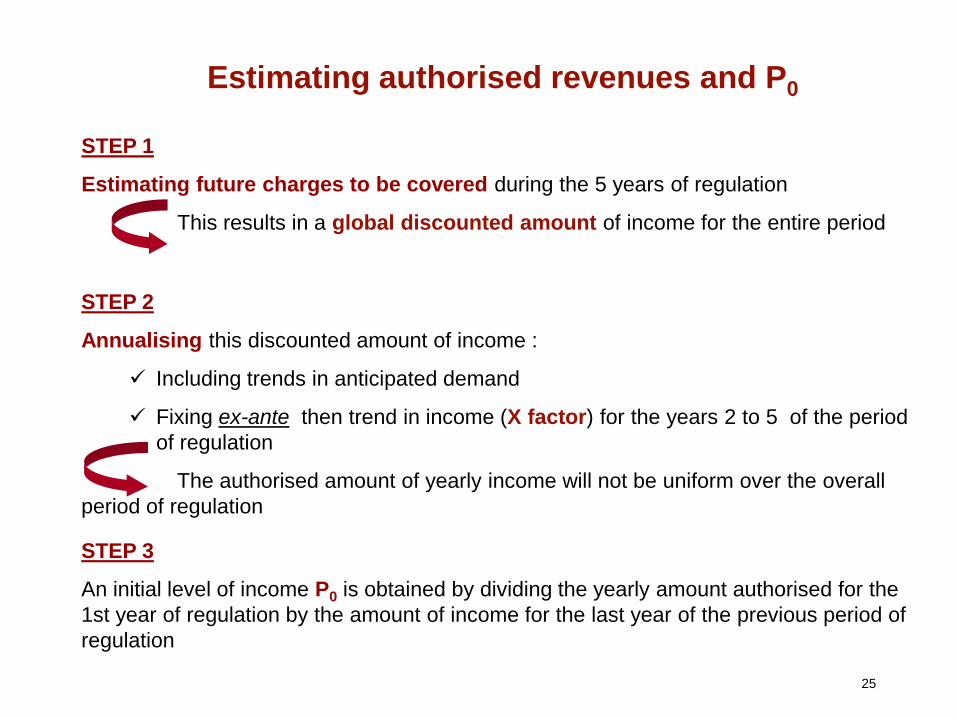
Estimating authorised revenues and P0
STEP 1
Estimating future charges to be covered during the 5 years of regulation
This results in a global discounted amount of income for the entire period
STEP 2
Annualising this discounted amount of income :
Including trends in anticipated demand
Fixing ex-ante then trend in income (X factor) for the years 2 to 5 of the period
of regulation
The authorised amount of yearly income will not be uniform over the overall
period of regulation
STEP 3
An initial level of income P0 is obtained by dividing the yearly amount authorised for the
1st year of regulation by the amount of income for the last year of the previous period of
regulation
26
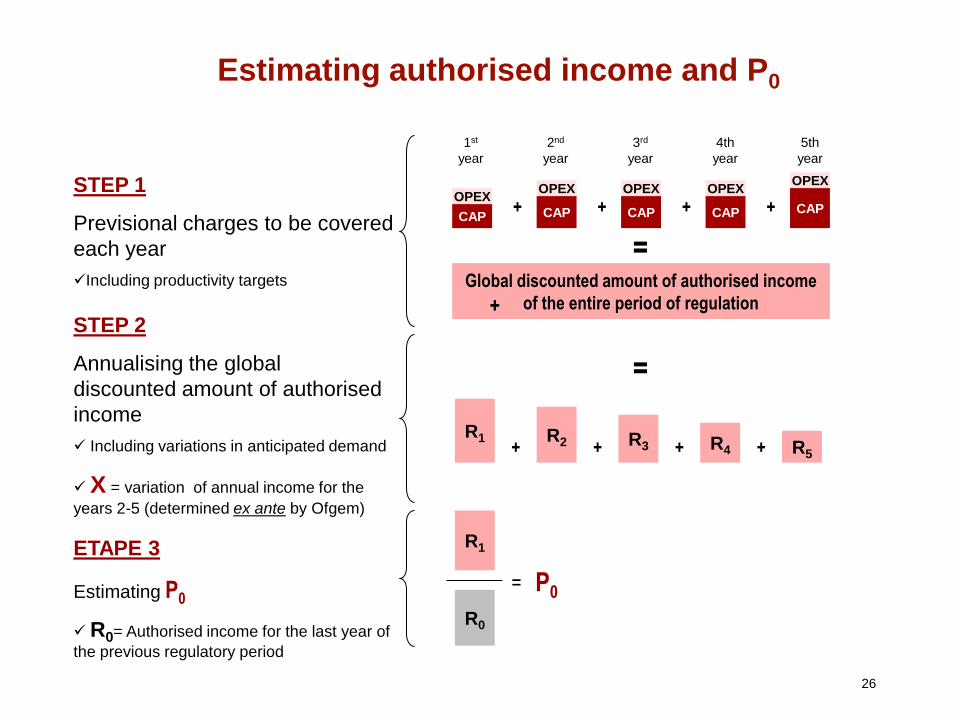
Global discounted amount of authorised income
of the entire period of regulation
OPEX
CAP
OPEX
CAP
OPEX
CAP
OPEX
CAP
OPEX
CAP
=
+
+
R1 R2 R3 R4 R5 + + + +
STEP 2
Annualising the global
discounted amount of authorised
income
Including variations in anticipated demand
X = variation of annual income for the
years 2-5 (determined ex ante by Ofgem)
Estimating authorised income and P0
R0
R1
= P0
STEP 1
Previsional charges to be covered
each year
Including productivity targets
ETAPE 3
Estimating P0
R0= Authorised income for the last year of
the previous regulatory period
+ + +
1st
year
2nd
year
3rd
year
4th
year
5th
year
=
27
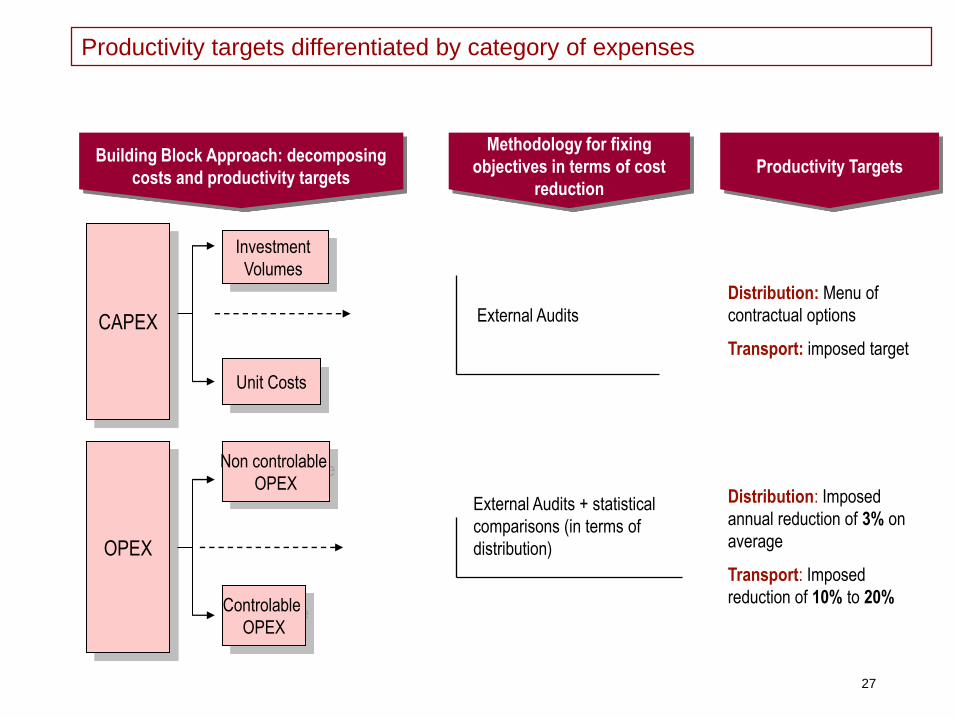
Productivity targets differentiated by category of expenses
Building Block Approach: decomposing
costs and productivity targets
CAPEX
OPEX
Non controlable
OPEX
Controlable
OPEX
Investment
Volumes
Unit Costs
Methodology for fixing
objectives in terms of cost
reduction
External Audits
External Audits + statistical
comparisons (in terms of
distribution)
Productivity Targets
Distribution: Menu of
contractual options
Transport: imposed target
Distribution: Imposed
annual reduction of 3% on
average
Transport: Imposed
reduction of 10% to 20%
28
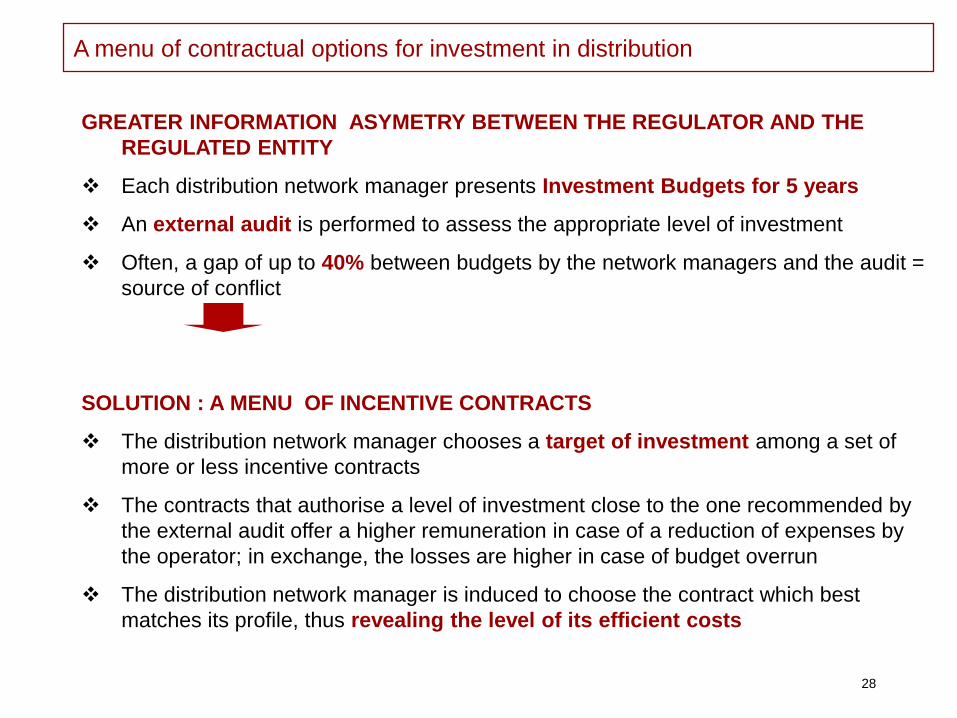
A menu of contractual options for investment in distribution
GREATER INFORMATION ASYMETRY BETWEEN THE REGULATOR AND THE
REGULATED ENTITY
Each distribution network manager presents Investment Budgets for 5 years
An external audit is performed to assess the appropriate level of investment
Often, a gap of up to 40% between budgets by the network managers and the audit =
source of conflict
SOLUTION : A MENU OF INCENTIVE CONTRACTS
The distribution network manager chooses a target of investment among a set of
more or less incentive contracts
The contracts that authorise a level of investment close to the one recommended by
the external audit offer a higher remuneration in case of a reduction of expenses by
the operator; in exchange, the losses are higher in case of budget overrun
The distribution network manager is induced to choose the contract which best
matches its profile, thus revealing the level of its efficient costs
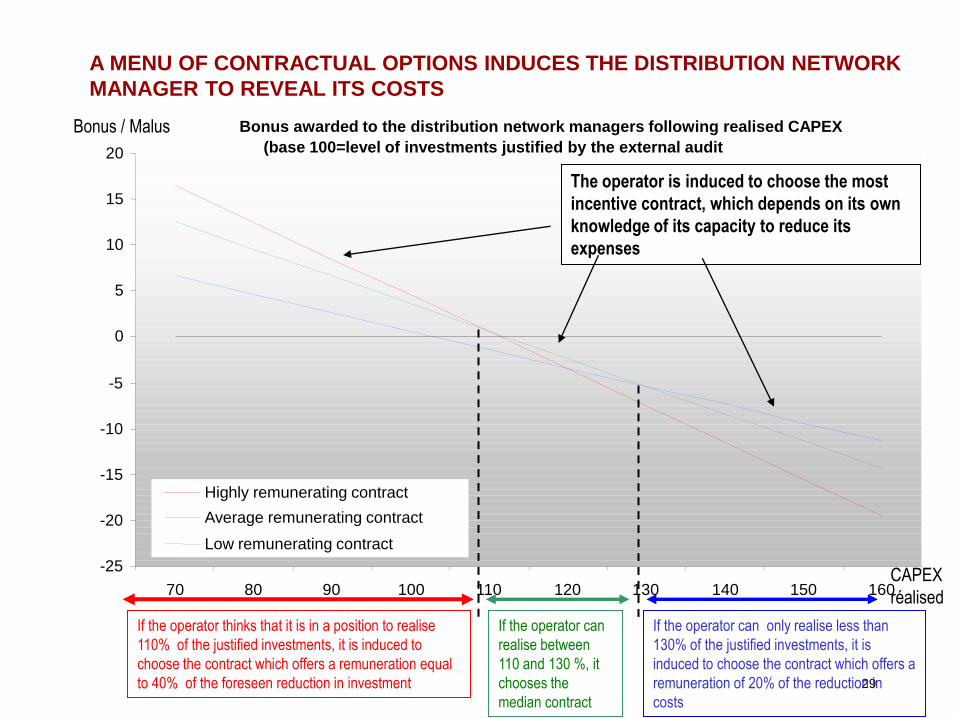
Bonus awarded to the distribution network managers following realised CAPEX
(base 100=level of investments justified by the external audit
-25
-20
-15
-10
-5
0
5
10
15
20
70 80 90 100 110 120 130 140 150 160
Highly remunerating contract
Average remunerating contract
Low remunerating contract
29
A MENU OF CONTRACTUAL OPTIONS INDUCES THE DISTRIBUTION NETWORK
MANAGER TO REVEAL ITS COSTS
If the operator can only realise less than
130% of the justified investments, it is
induced to choose the contract which offers a
remuneration of 20% of the reduction in
costs
The operator is induced to choose the most
incentive contract, which depends on its own
knowledge of its capacity to reduce its
expenses
If the operator thinks that it is in a position to realise
110% of the justified investments, it is induced to
choose the contract which offers a remuneration equal
to 40% of the foreseen reduction in investment
If the operator can
realise between
110 and 130 %, it
chooses the
median contract
CAPEX
réalised
Bonus / Malus
30
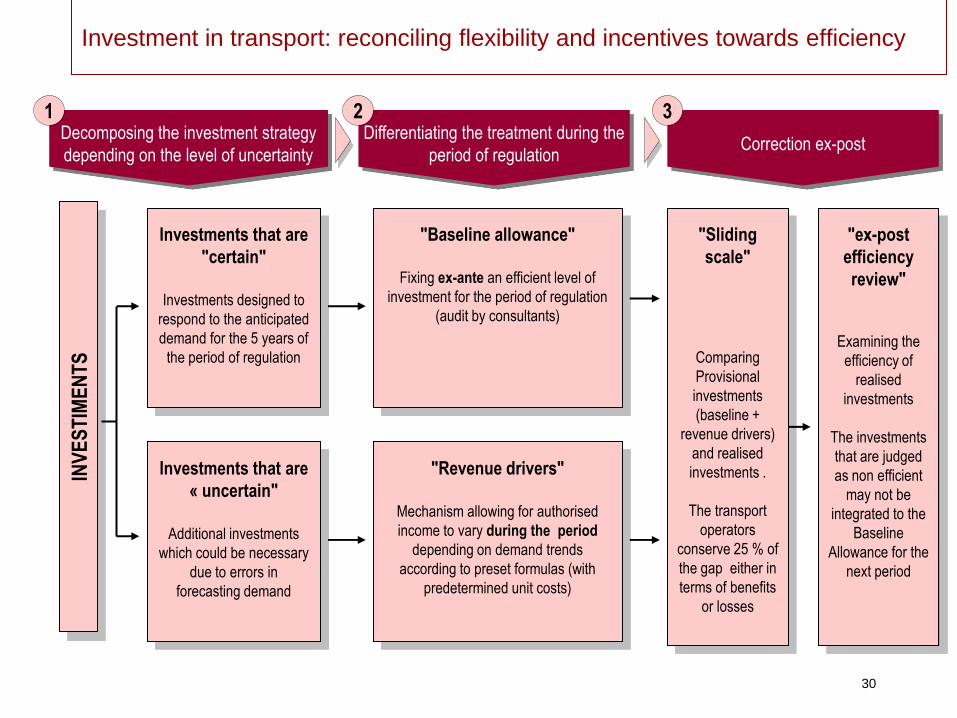
Investment in transport: reconciling flexibility and incentives towards efficiency
Decomposing the investment strategy
depending on the level of uncertainty
INV
ES
TIM
EN
TS
Investments that are
"certain"
Investments designed to
respond to the anticipated
demand for the 5 years of
the period of regulation
Investments that are
« uncertain"
Additional investments
which could be necessary
due to errors in
forecasting demand
Differentiating the treatment during the
period of regulation Correction ex-post
1 2 3
"Baseline allowance"
Fixing ex-ante an efficient level of
investment for the period of regulation
(audit by consultants)
"Revenue drivers"
Mechanism allowing for authorised
income to vary during the period
depending on demand trends
according to preset formulas (with
predetermined unit costs)
"Sliding
scale"
Comparing
Provisional
investments
(baseline +
revenue drivers)
and realised
investments .
The transport
operators
conserve 25 % of
the gap either in
terms of benefits
or losses
"ex-post
efficiency
review"
Examining the
efficiency of
realised
investments
The investments
that are judged
as non efficient
may not be
integrated to the
Baseline
Allowance for the
next period
31
The Regulation of Quality
TWO MECHANISMS FOR DISTRIBUTION
A uniform quality standard which provides a minimum level of quality for each
user
Individual Compensation of 50£ for 18 consecutive hours of power cut + 25£
by additional tranche of 6h
Specific regulations for exceptional climatic events
A scheme for incentive regulation of quality which induces each manager of a
distribution network to improve the average quality of supply
Targets in terms of the frequency and duration of the cuts, with a bonus or
malus in terms of the level of quality realised
Financial risk capped at +/- 3% of annual income
32
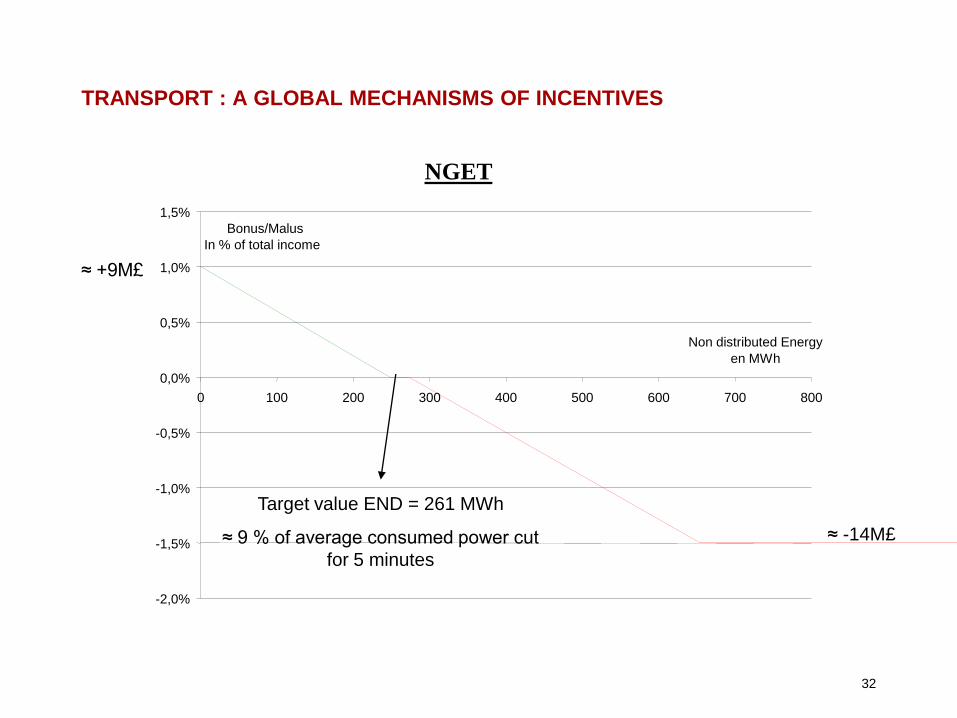
TRANSPORT : A GLOBAL MECHANISMS OF INCENTIVES
Target value END = 261 MWh
≈ 9 % of average consumed power cut
for 5 minutes
≈ -14M£
≈ +9M£
NGET
-2,0%
-1,5%
-1,0%
-0,5%
0,0%
0,5%
1,0%
1,5%
0 100 200 300 400 500 600 700 800
Non distributed Energy
en MWh
Bonus/Malus
In % of total income
33
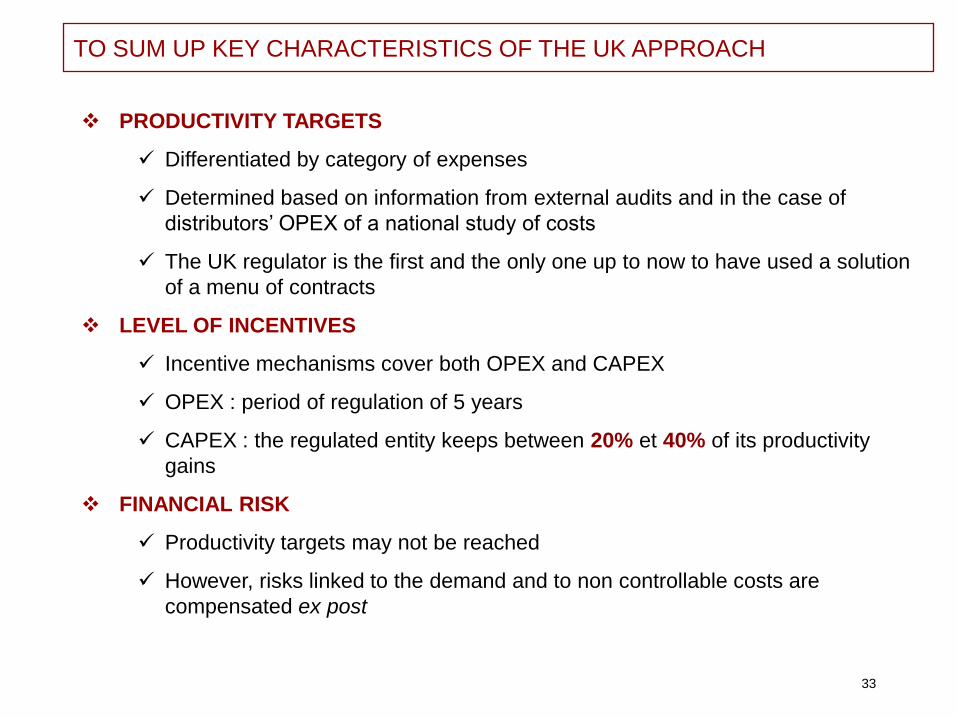
TO SUM UP KEY CHARACTERISTICS OF THE UK APPROACH
PRODUCTIVITY TARGETS
Differentiated by category of expenses
Determined based on information from external audits and in the case of
distributors’ OPEX of a national study of costs
The UK regulator is the first and the only one up to now to have used a solution
of a menu of contracts
LEVEL OF INCENTIVES
Incentive mechanisms cover both OPEX and CAPEX
OPEX : period of regulation of 5 years
CAPEX : the regulated entity keeps between 20% et 40% of its productivity
gains
FINANCIAL RISK
Productivity targets may not be reached
However, risks linked to the demand and to non controllable costs are
compensated ex post
34
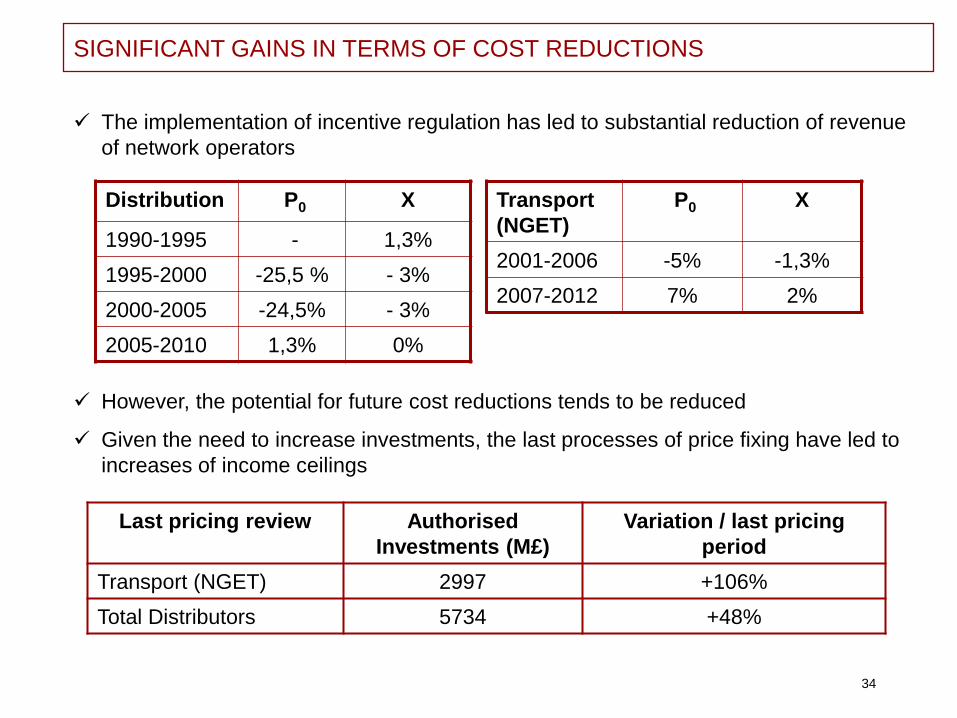
SIGNIFICANT GAINS IN TERMS OF COST REDUCTIONS
Distribution P0 X
1990-1995 - 1,3%
1995-2000 -25,5 % - 3%
2000-2005 -24,5% - 3%
2005-2010 1,3% 0%
The implementation of incentive regulation has led to substantial reduction of revenue
of network operators
Transport
(NGET)
P0 X
2001-2006 -5% -1,3%
2007-2012 7% 2%
However, the potential for future cost reductions tends to be reduced
Given the need to increase investments, the last processes of price fixing have led to
increases of income ceilings
Last pricing review Authorised
Investments (M£)
Variation / last pricing
period
Transport (NGET) 2997 +106%
Total Distributors 5734 +48%
35
A COMPLEX FRAMEWORK WITH SIGNIFICANT RESSOURCES
Each round of price fixing covers a 18 months period
A cycle of 5 successive consultations before reaching a final decision in terms of prices
A large number of documents published
For example, 80 documents have been published during the last distribution pricing round
Many studies performed by consultants
The business plans of the 14 distribution companies are subject to audit
Several external studies on the cost of capital and the productivity of companies
36
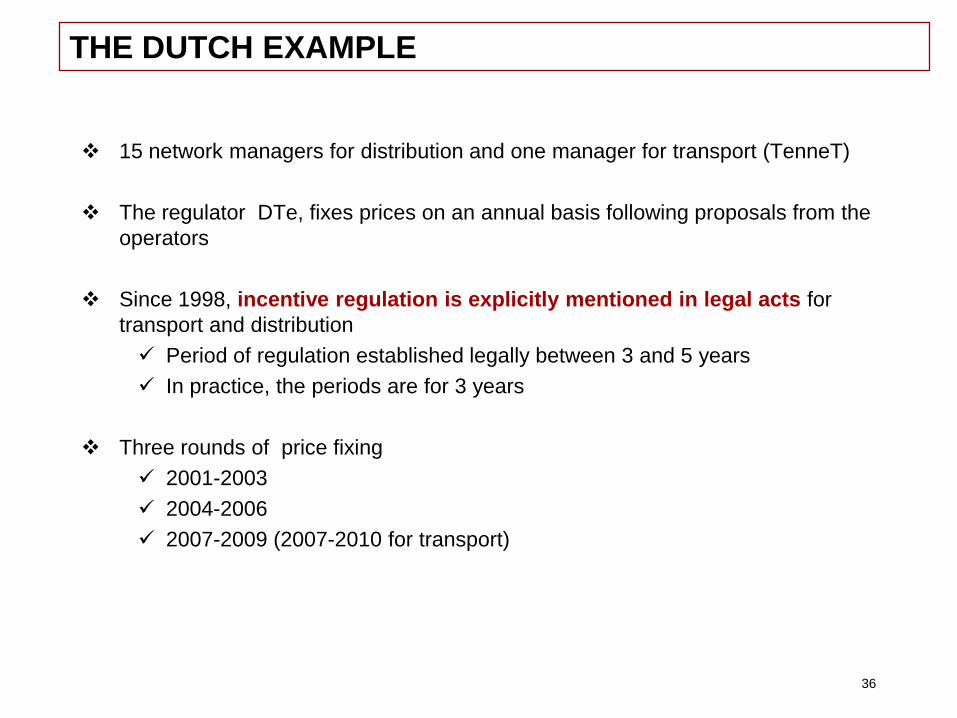
15 network managers for distribution and one manager for transport (TenneT)
The regulator DTe, fixes prices on an annual basis following proposals from the
operators
Since 1998, incentive regulation is explicitly mentioned in legal acts for
transport and distribution
Period of regulation established legally between 3 and 5 years
In practice, the periods are for 3 years
Three rounds of price fixing
2001-2003
2004-2006
2007-2009 (2007-2010 for transport)
THE DUTCH EXAMPLE
37
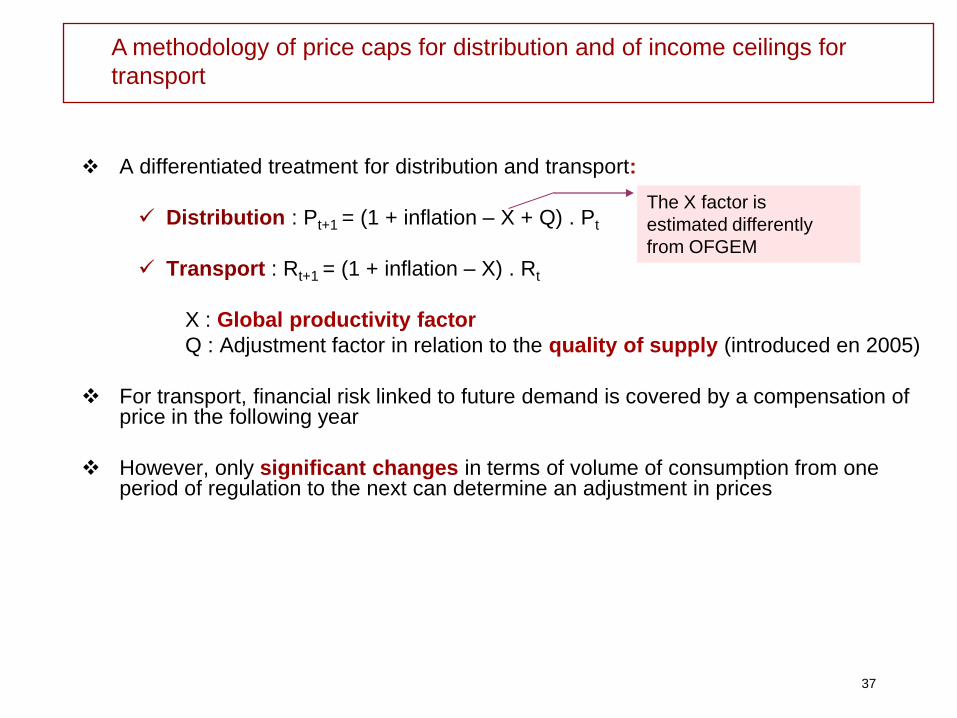
A differentiated treatment for distribution and transport:
Distribution : Pt+1 = (1 + inflation – X + Q) . Pt
Transport : Rt+1 = (1 + inflation – X) . Rt
X : Global productivity factor
Q : Adjustment factor in relation to the quality of supply (introduced en 2005)
For transport, financial risk linked to future demand is covered by a compensation of price in the following year
However, only significant changes in terms of volume of consumption from one period of regulation to the next can determine an adjustment in prices
A methodology of price caps for distribution and of income ceilings for
transport
The X factor is
estimated differently
from OFGEM
38
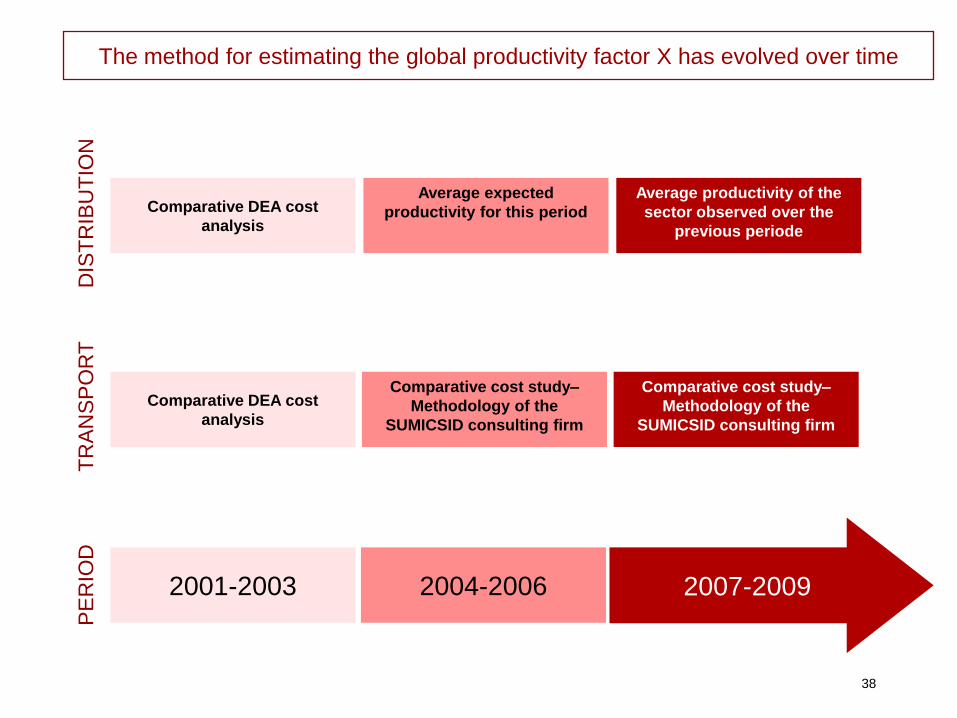
The method for estimating the global productivity factor X has evolved over time
Comparative DEA cost
analysis
Average expected
productivity for this period
2004-2006 2007-2009 2001-2003
Average productivity of the
sector observed over the
previous periode
DIS
TR
IBU
TIO
N
TR
AN
SP
OR
T
Comparative DEA cost
analysis
Comparative cost study–
Methodology of the
SUMICSID consulting firm
Comparative cost study–
Methodology of the
SUMICSID consulting firm
PE
RIO
D
39
ESTIMATING THE Q FACTOR
Period of regulation 2007-2009 : Q calculated depending on the improvement of
quality between 2000-2002 and 2003-2005
Indicator of quality used : average duration of power cut
The variation of technical performance is translated in economic terms by estimating
marginal willingness of pay of consumers for one minute less of power cuts
This value is differentiated by network manager and is expressed as a percentage of
income
Q is capped : –5%/+5%
INCENTIVE REGULATION FOR DISTRIBUTION
PRINCIPLE
Price ceilings are augmented (or reduced) with a Q factor if quality of supply improved
(deteriorated) over the previous period
40
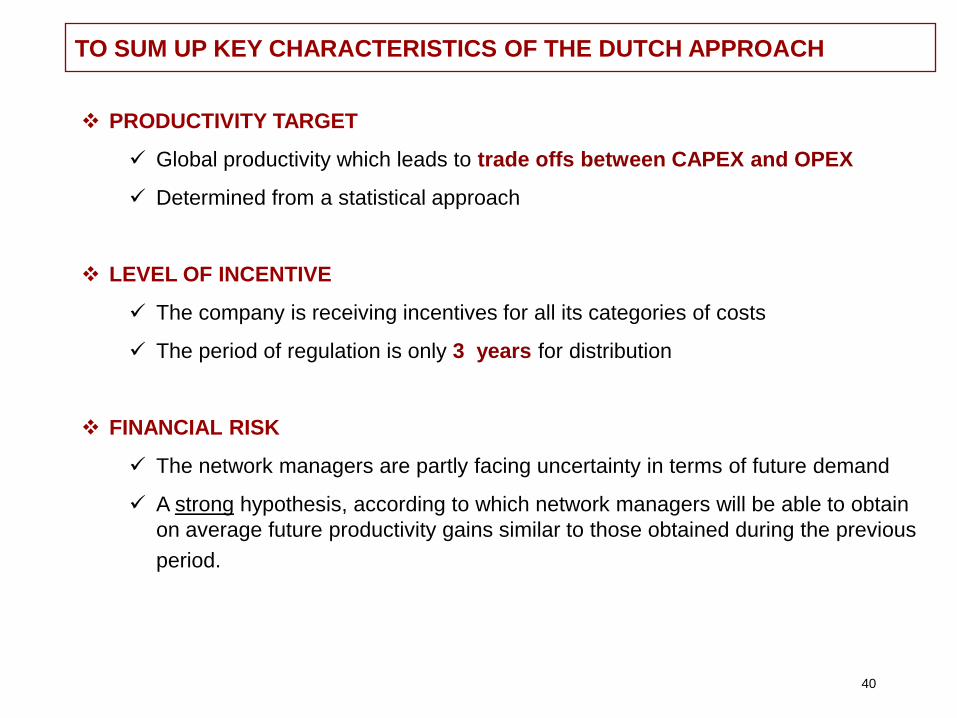
PRODUCTIVITY TARGET
Global productivity which leads to trade offs between CAPEX and OPEX
Determined from a statistical approach
LEVEL OF INCENTIVE
The company is receiving incentives for all its categories of costs
The period of regulation is only 3 years for distribution
FINANCIAL RISK
The network managers are partly facing uncertainty in terms of future demand
A strong hypothesis, according to which network managers will be able to obtain
on average future productivity gains similar to those obtained during the previous
period.
TO SUM UP KEY CHARACTERISTICS OF THE DUTCH APPROACH
41
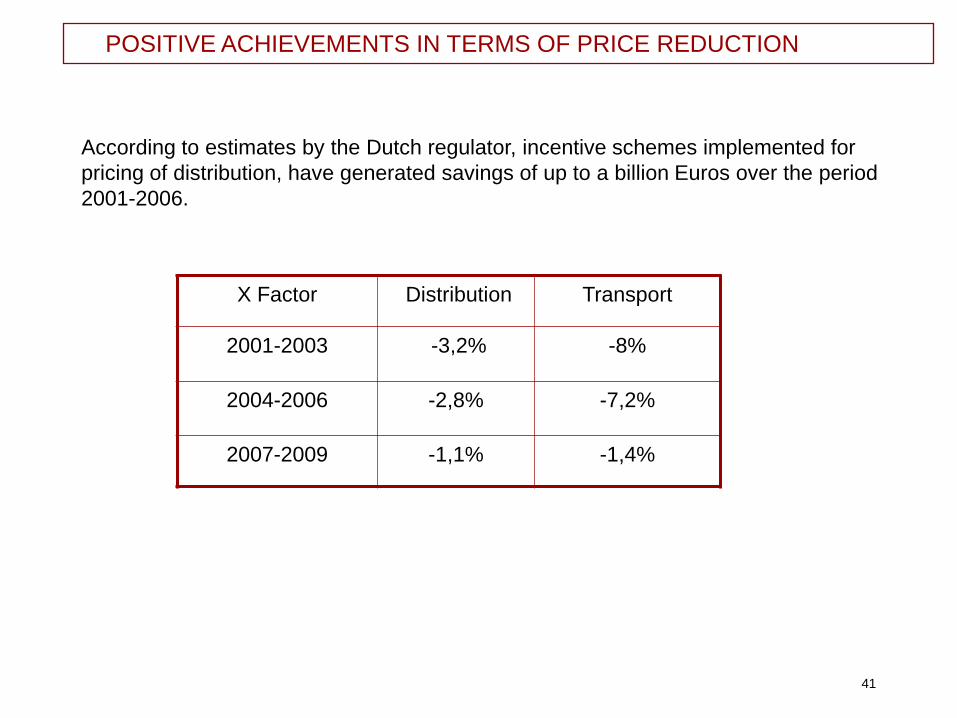
POSITIVE ACHIEVEMENTS IN TERMS OF PRICE REDUCTION
According to estimates by the Dutch regulator, incentive schemes implemented for
pricing of distribution, have generated savings of up to a billion Euros over the period
2001-2006.
X Factor Distribution Transport
2001-2003 -3,2% -8%
2004-2006 -2,8% -7,2%
2007-2009 -1,1% -1,4%
42
The process goes over 8 months
A process of consultation is organised with network managers and users
Several external studies are performed to determine :
The X factor (Tennet)
The cost of capital
The regulatory approach is not intrusive, as it does not require efficiency audits company by company, but relies on statistical methods
A TRANSPARENT AND NOT INTRUSIVE REGULATORY FRAMEWORK
43
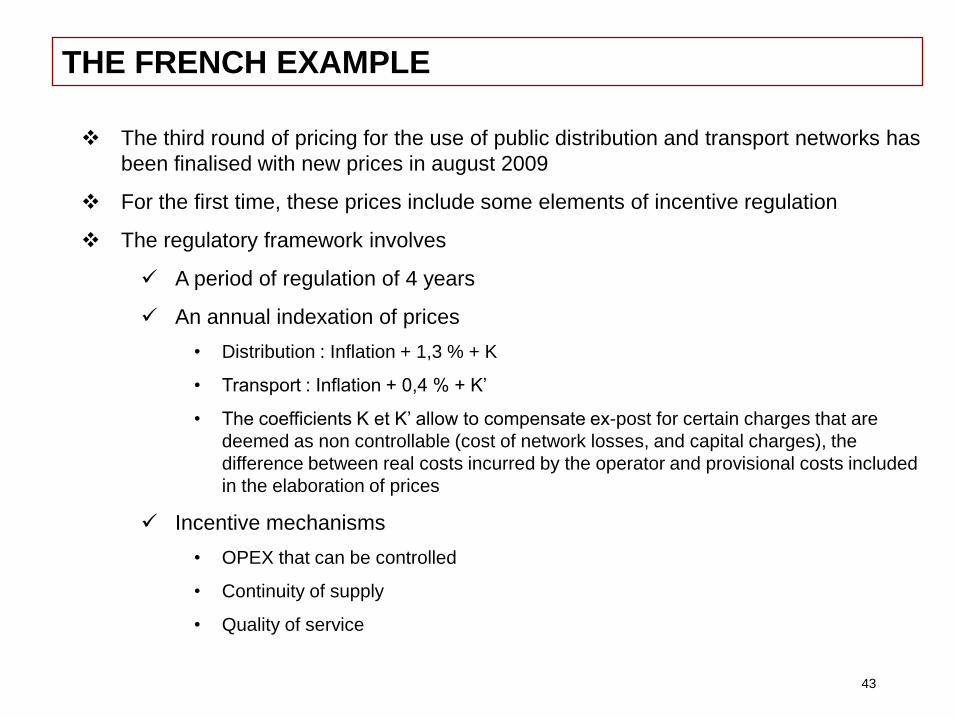
The third round of pricing for the use of public distribution and transport networks has
been finalised with new prices in august 2009
For the first time, these prices include some elements of incentive regulation
The regulatory framework involves
A period of regulation of 4 years
An annual indexation of prices
• Distribution : Inflation + 1,3 % + K
• Transport : Inflation + 0,4 % + K’
• The coefficients K et K’ allow to compensate ex-post for certain charges that are
deemed as non controllable (cost of network losses, and capital charges), the
difference between real costs incurred by the operator and provisional costs included
in the elaboration of prices
Incentive mechanisms
• OPEX that can be controlled
• Continuity of supply
• Quality of service
THE FRENCH EXAMPLE
44
Incentives for OPEX that can be controlled
If the OPEX that can be controlled are inferior to the amount defined ex-ante by the
regulator, the operator keeps 50 % of the difference defined in constant Euros 2009
About 1 billion Euros per year for RTE (transport manager) and 4 Billion Euros per
year for ERDF (distribution manager, significant reduction in recent years)
45
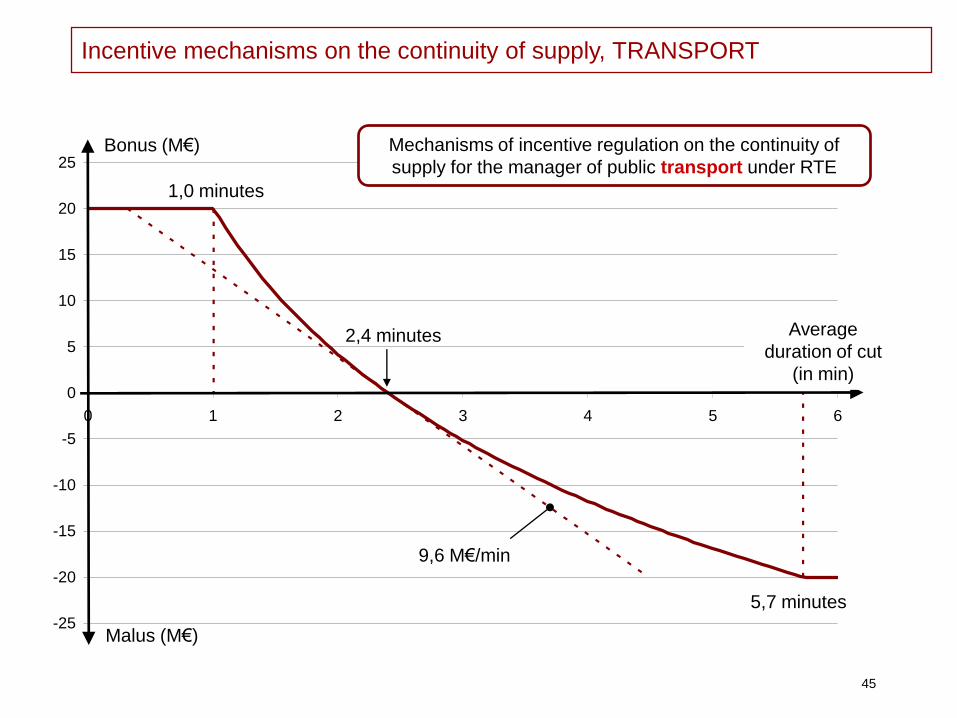
Incentive mechanisms on the continuity of supply, TRANSPORT
-25
-20
-15
-10
-5
0
5
10
15
20
25
0 1 2 3 4 5 6
Average
duration of cut
(in min)
Bonus (M€)
Malus (M€)
1,0 minutes
5,7 minutes
2,4 minutes
9,6 M€/min
Mechanisms of incentive regulation on the continuity of
supply for the manager of public transport under RTE
46
-60
-40
-20
0
20
40
60
40 45 50 55 60 65 70 75 80
Average duration of
cuts (not counting for
maintenance work
(in min)
Bonus (M€)
Malus (M€)
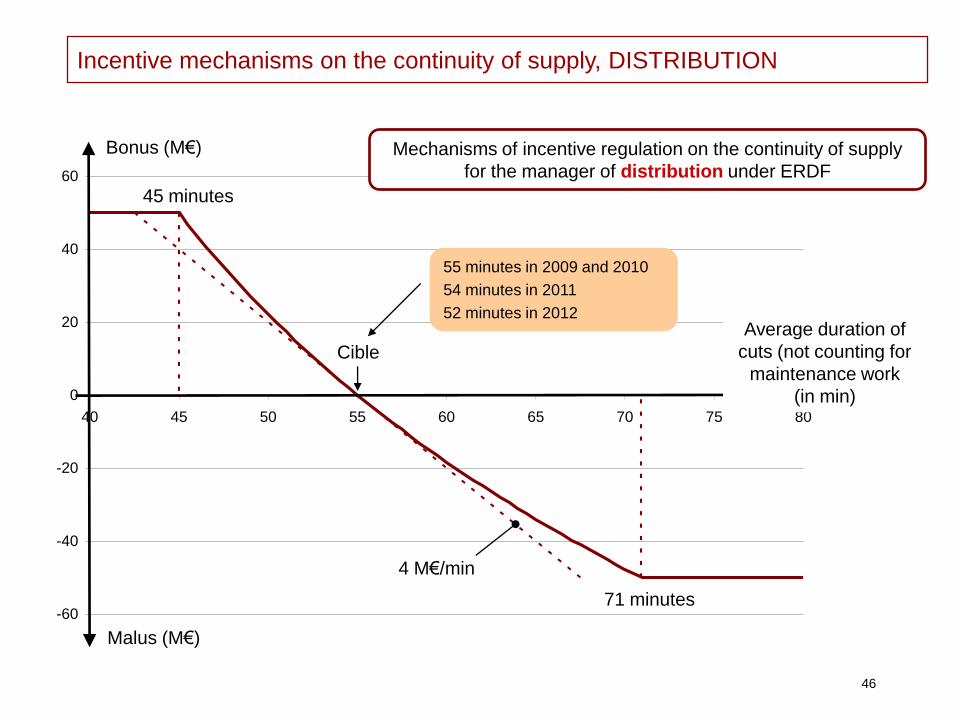
45 minutes
71 minutes
Cible
4 M€/min
Mechanisms of incentive regulation on the continuity of supply
for the manager of distribution under ERDF
55 minutes in 2009 and 2010
54 minutes in 2011
52 minutes in 2012
Incentive mechanisms on the continuity of supply, DISTRIBUTION
47
Incentive Mechanism for the quality of service
The incentive mechanism for the quality of service includes two types of indicators :
Indicators subject to monitoring by the French regulator CRE and financial incentives in
case of non compliance, or in case of reaching pre-agreed targets. These financial
incentives involve a system of bonus/malus, imputed on prices, or of financial
compensation for clients that require them.
The indicators are only monitored by CRE
Among the indicators subject to financial incentives:
• Number of complaints following scheduled appointments not respected by ERDF
• Rate of response to complaints within 30 days
• Number of connection proposals that have not been sent within agreed timetable
48
Reflection of the French experience
Gradual transition (slower than in some EU countries), EDF to be split with ERDF,
RTE and the generating capacity unit, separation from gas company: decade long
evaluation, preceded with management contracts for the company to provide
increased managerial autonomy
The regulator only “proposes” prices: minister can only accept, or reject, and has to
publicly motivate reason for rejection (limited discretion). (Future EU regulation:
pricing full responsibility of regulators, similar trends for telecoms).
Political acceptance: mainly ROR cost plus scheme as concerns about the possibility
of “over profits”
Elements of success: last round of pricing generally understood and well accepted
(supported by all parties)
Need to clarify the functions of the state : shareholder function (French treasury and
finance), representation for the interest of consumers (Minister for Energy and
sustainable development). (Healthier to clarify the functions of the state)
49
OVERALL CONCLUSIONS
Need for pragmatic approach (E.g. gradual understanding of the cost function by the
regulator took up to 8 years in France, to obtain a full and comprehensive
understanding)
E.g. Swedish example: theoretical network approach, 10 years of legal trials, gaps
with actual network
UK model very advanced, impressive gains in the first period, but requires a stable
environment, need to assess real usefulness of all the regulatory methodology
features, less potential for the current period, UK only with choice among a menu of
contractual option (but need to provide high premium to induce operators to take the
risk, costly).
Adapt to an emerging country condition: lack of visibility, higher macroeconomic
instability: shorter periods,
Incentive regulation less conflictual: more autonomy for the companies.
Need to find a model that suits technical conditions in the country, level of political
consensus,
Need capacity and institution building with the regulator