Embed Size (px)
Citation preview
OECD Economic Studies No. 32, 2001/I
183
© OECD 2001
REGULATION, MARKET STRUCTURE AND PERFORMANCE IN AIR PASSENGER TRANSPORTATION
By Rauf Gönenç and Giuseppe Nicoletti
TABLE OF CONTENTS
Introduction ................................................................................................................................. 184
Regulation trends in air passenger transportation ................................................................. 186
Comparing regulations and market structures across countries and routes ....................... 189Regulatory and market features of air passenger transport at the country level ........... 189Regulation and market structure at the route level............................................................ 192
Evaluating the effects of regulatory reform on performance in air passenger transport ... 197Effects on the efficiency of the domestic air transport industry ....................................... 199Effects on performance at the route level............................................................................ 203
Conclusions and directions for future research....................................................................... 215
Annex. Multilateral Regulations, Bilateral Air Service Agreements and RegionalAviation Markets........................................................................................................ 221
Bibliography ................................................................................................................................ 223
The authors wish to thank Michael P. Feiner, Jørgen Elmeskov and Paul Swaim for their help in improvingearlier versions of this paper. Useful comments were also provided by Ignazio Visco, Sally van Siclen andNick Vanston. Special thanks also go to Wolfgang Hübner, Michel Nicolas and Patrice Dubus for theirsupport as well as to Charles Dudley and Attilio Costaguta of ICAO, and Rebecca Rowland andJon Manning of IATA for their advice. Martine Levasseur and Anne-Claire Saudrais provided statisticaland technical assistance. The opinions expressed in the paper are those of the authors and do not reflectnecessarily the position of the OECD or its Member countries.

184
© OECD 2001
INTRODUCTION
The airline industry transports passengers and goods within and acrossnational borders on a scheduled and non-scheduled basis. In 1999, the worldscheduled air traffic amounted to a total of 1.5 billion passenger journeys and avolume of 26 million tonnes of freight and is growing at a higher rate than world-wide GDP growth. Scheduled transportation accounts for most of passenger traffic,with charter flights representing 15 per cent of total travel output. Even though itsshare in GDP is limited (between 0.5 and 1 per cent in OECD countries), airtransportation provides a critically important infrastructure to the global economy.
Until recently, scheduled passenger transportation has been heavilyregulated in most countries at both the domestic and international levels. Domes-tically, entry into the air passenger business, initiating service on specific routes,operating aircraft above given sizes, reducing or discontinuing services, investingin airlines, establishing and applying various categories of passenger fares havebeen subject to a detailed set of rules and regulations. International regulationscompound these domestic rules. They govern the conditions of entry and owner-ship, the selection of operable destinations, and the freedoms to set capacity andfares on international routes, which represent more than 60-70 per cent of allpassenger-kilometres performed in most countries, with the exception ofcontinental size countries.
The policies and regulations which have governed the air transport industry forseveral decades have various motivations (including safety, national prestige,national defence, regional and urban development, environmental sustainability,public service and other non-commercial objectives) specific to each country.However, there is growing consensus that unnecessarily restrictive regulations mayhave led to significant losses of economic efficiency, and thereby failure to securelow-cost air transportation to the largest possible proportion of the population – theultimate objective of air transport policies. Recognising these shortcomings, severalOECD governments have initiated reforms in the past two decades. Their aim was toimprove efficiency and reduce airfares by increasing competition, encouraging therationalisation of air networks, and enhancing airline governance.
A large literature on airline economics has supported reform policies in thepast two decades, but cross-country examinations of the relationship betweenregulatory frameworks, market structures and performance have been relatively

Regulation, Market Structure and Performance in Air Passenger Transportation
185
© OECD 2001
few. Most of the empirical research has concerned the United States, at firstinspiring the 1978 domestic airline reforms and later looking at the economicimplications of liberalisation and enhanced competition (Caves et al., 1983; Baileyet al., 1985; Liu and Lynk, 1999).1 US research also demonstrated that certain fearedoutcomes of liberalisation – such as declines in safety levels, or deprivation ofsmall communities of air service – did not materialise.2 Only a few quantitativeanalyses have documented the implications of airline competition for efficiencyand airfares in other parts of the OECD, such as the trans-Pacific routes (Gillenet al., 1998; Kissling, 1998) and the European internal market (Marin, 1995; Morrell,1998), while a monographic analysis looked at the productivity performances oflarge-sized international airlines (Oum and Yu, 1998).
This body of research has unveiled the peculiar competitive features of airtravel markets and documented the efficiency gains and fare changes that followedliberalisation.3 Results have been less clear-cut outside of the United Statesperhaps due to more limited liberalisation and the presence of exogenous factorsdamping competition – such as more intense airport congestion and social andpolitical constraints on airline restructuring (Marin, 1998; Lapautre, 2000). Researchalso helped identify those structural factors such as airport hub domination androute market concentration which may temper the benefits of reforms.4 Overall,these analyses focused on the effect of market concentration on performance, side-stepping the role of regulation per se and failing to distinguish the influence ofvarious kinds of regulatory and market arrangements.5 Moreover, no study haslooked at the effects on performance of the presence of “flag carrier airlines”, oftencontrolled by governments. Ultimately, few studies have accounted, within a unifiedframework, for influences on performance originating from regulation, marketstructure and infrastructure access conditions.
This paper attempts to fill some of these gaps by analysing the impact that dif-ferent types of regulatory and market arrangements have on the efficiency of supplyof scheduled air passenger travel services in the OECD area, controlling for “frame-work conditions” such as airport dominance and the role of government-controlledflag carriers.6 The analysis is based on a detailed set of indicators of regulation andmarket structure. It follows a top-down approach looking first at the impact of theoverall market and regulatory environment (represented by means of summaryindicators) and then turning to the impact of specific regulation and market features,such as rules on prices, capacity and entry on individual routes or the role of chal-lengers, third party carriers and airline alliances. The linkage between regulation,market structure and performance is studied both at the level of national industriessupplying domestic and international travel services, and at the level of individualroutes, focusing on a large set of international non-stop connections between theairports of the major OECD countries. Interactions between industry and routefeatures, such as pressures for overall network optimisation originating at both the
OECD Economic Studies No. 32, 2001/I
186
© OECD 2001
domestic and route level, are also accounted for. Two important dimensions of airtravel performance are considered: productive efficiency (in its two main dimen-sions of capital use efficiency and efficiency of use of all production factors) andairfares. By distinguishing among different classes of fares (business, standard econ-omy and discount), the disaggregated impacts of route-specific regulations, marketstructures and performance on business and leisure travel between individual city-pairs are highlighted. While price outcomes are studied in detail, limitations onavailable data made it impossible to consider the implications of liberalisation forservice quality and consumer convenience (e.g. differentiation of route supply, flightfrequency and time spent on connections).7
The rest of the paper has three main sections. The first overviews competitionissues and regulation trends in OECD air transport, providing the necessary back-ground for the empirical analysis. The second describes patterns of regulation andmarket structure in OECD countries and in a large sample of international routesin (or around) 1996, the reference year for subsequent regressions. In this section,detailed information about regulations and market structures is summarised bymeans of factor analysis techniques. Finally, the third section uses the resultingindicators to estimate the impact of several regulation and market features onindustry-wide and route-level performance.
REGULATION TRENDS IN AIR PASSENGER TRANSPORTATION8
The technology of the air travel industry involves economies of scale, butincreasing returns are exhausted at relatively low levels of output. Research on theeconomics of air transportation has shown that these economies do not hindercompetition within routes (White, 1979; Caves et al., 1984; Liu and Lynk, 1999).Furthermore, when airlines have free access to airports, they can exert potentialcompetition on each other’s routes because reallocating existing equipment(aircraft) and personnel (flying crew) to new destinations is relatively easy.
Competition between air carriers takes place in a multiplicity of separatemarkets. Passenger services between individual cities, and at different times, form aweb of markets that are generally characterised by little cross-substitutability ofdemand. Connections between cities can be further segmented into time-sensitive(i.e. business travel) versus non-time-sensitive (i.e. tourist travel) services, and oper-ations between individual end-points (i.e. airport-to-airport routes).9 In servicing thisweb of markets, airlines exploit a wide range of scope economies. The developmentof “hub-and-spoke” networks over the past two decades, which resulted from theexploitation of both scale and scope economies, has added new dimensions tocompetition in air transport (US Department of Transportation, 1999). In particular,two phenomena tended to increase the degree of competition in the airline

Regulation, Market Structure and Performance in Air Passenger Transportation
187
© OECD 2001
industry: higher total traffic on short-haul (spoke) and long-haul (trunk) routes raisedoutput levels on the constant-cost segments of supply curves, facilitating entrycompetition; and hub-and-spoke networks shifted competition from the route levelto the network level, with different hubs competing to attract passengers in transitto the same origin and/or destination cities.10
Obstacles to airport access and anticompetitive behaviour of incumbentcarriers may have restricted competition in the airline industry (Pera, 1989; Kahn,1993; OECD, 1998; Federal Aviation Administration, 1999). Anticompetitivebusiness practices often involve the use of “slot dominance” in an airport toforeclose competitors or raise rival costs on certain routes (e.g. by strategicallyincreasing flight frequencies).11 The quality of infrastructure access is particularlyimportant for efficiency and competition in hub-and-spoke networks where accessproblems are compounded when airport runways, terminals and traffic controlinfrastructures come in short supply and suffer congestion (under existing accessrules and prices).12
Air transport has been typically subject in OECD countries to strict domesticand international regulations concerning entry and exit, pricing and businessoperation.13 The regulation of international exchanges of air transport services isoften described by a typology of “freedoms” granted to carriers, which are estab-lished and enforced either multilaterally, bilaterally between individual countries,or regionally among groups of countries (see Annex). Domestic and internationalregulations on entry, pricing and service are often supplemented by restrictionsconcerning the ownership structures of airlines as well as corporate strategies(such as participation in domestic and international alliances). These restrictions,requiring carriers to be “owned and effectively controlled” by the locals ofconcerned countries, have been instrumental in creating the “flag carrier” conceptwhere government or nationally-owned airlines gain a de facto monopoly on thedomestic and international routes they service.
The regulatory straightjacket imposed on domestic and international air travelhas affected business strategies, industry organisation and market structures. Thelack of competitive pressures often resulted in high operation costs, a low utilisationrate of aircraft capacity, and relatively restricted output growth.14 In air routes wheremore than one incumbent competed, “quality of service competition” based on thefrequency and comfort of flights was the main outcome of price regulation. Entry,pricing and service regulations also have made the optimisation of networks diffi-cult, because individual airlines could not freely choose their hub locations, routestructures and flight frequencies according to economic considerations. Further-more, government ownership and “national ownership” rules did not permit adjust-ments in the capital structure of airlines, forcing airline companies to find indirectforms of external growth (not involving capital exchanges), such as commercial alli-ances and code-sharing agreements.

OECD Economic Studies No. 32, 2001/I
188
© OECD 2001
Reforms introduced in the past two decades aimed at exploiting the potentialfor free competition in air travel markets, encouraging network rationalisation andopening up the capital structures of airlines. Prominent reforms included thepioneering US domestic deregulation of 1978, the Australia-New Zealand CommonAviation area of 1992, the European Single Aviation Market of 1997 and a numberof Open Sky air agreements signed in the course of the 1990s (OECD, 1998; Gaudryand Mayes, 1999). Under these reforms, previously protected national, regionaland bilateral markets became potentially open to challenge by new entrants,which in principle may compete on fares, frequency of flights, degrees of comfort,connection paths etc., to the extent permitted by airport availability (US GeneralAccounting Office, 1996b).15 Within liberalised areas, mergers between companieshave been facilitated and airline privatisations, often part of liberalisationpackages, introduced new flexibility in capital and financing structures.16
However, with the bulk of international routes still governed by restrictive bilat-eral ASAs, liberalisations remained nationally or regionally fragmented relative to theinherently global aviation marketplace. Moreover, “local ownership and control” provi-sions remained across large regional zones, ruling out possible mergers, acquisitionsand equity financing.17 Even after liberalisation, network rationalisation has beenlimited outside the United States, either because reforms have covered narrowregional areas (such was the case of the Australia-New Zealand aviation integration) orbecause international air service agreements (ASAs) continue to constrain networkremodelling. Open Sky agreements are in all cases confined to bilateral markets andeffects are generally limited to long-haul point-to-point destinations (althoughconsumer welfare gains on these large trunk routes are important), giving limitedincentives to cross-country network redesign (for some aspects see Scott, 2000).18
Reforms therefore failed to fully exploit the potential for global competitionand trade specialisation and their impact on efficiency and welfare was locally(regionally) important but globally limited. In the US, efficiency and fare gains werefound to be concentrated on routes where true competition and network optimisa-tion unfolded, free from operational obstacles such as infrastructure congestion, hubdomination by incumbent carriers, and mergers foreclosing to competition the low-to-medium density ends of the networks (Morrison and Watson, 1989; Hurdle et al.,1989; Borenstein, 1989; US General Accounting Office, 1996b; Kim and Singal, 1993;Liu and Lynk, 1999; US Department of Transportation, 1999). In Europe, the benefitsof the European single market fell short of expectations, because of hindrances tothe free entry and growth of new competitors (European Commission, 1999), to thereorganisation of incumbent airlines (Marin, 1998; Neven et al., 1998), and to cross-country network optimisation (Lapautre, 2000). Finally, analyses focusing on theeffects of the liberal bilateral air agreements indicated that consumer benefits aremaximised when true competitors to incumbents can actually enter the markets(Caves and Higgins, 1993; Gillen et al., 1998).

Regulation, Market Structure and Performance in Air Passenger Transportation
189
© OECD 2001
COMPARING REGULATIONS AND MARKET STRUCTURES ACROSS COUNTRIES AND ROUTES
Air transportation reforms have been implemented at different times andunevenly across OECD countries and routes. Therefore, the variability of recentregulatory arrangements and market structures is large. To describe this variety ofcountry and route-level situations and investigate their impact on efficiency in theprovision of air services, it is useful to focus on a set of regulatory and marketstructure indicators for which comparative cross-country or cross-route informationis available. Using a variety of sources (including the replies of OECD countries toan ad hoc questionnaire) a total of 21 indicators have been developed at the aggre-gate level for 27 OECD countries, and a total of 23 additional indicators at themicro level for a set of 102 air routes connecting 14 major international airports.19
Underlying data for different indicators and countries generally refers tothe 1996-1997 air travel season.
Three main areas were covered by the indicators: regulation (including govern-ment control), market structure and infrastructure access. Regulatory indicators focus onentry conditions (including for charters), pricing rules and government control(focusing on public ownership, subsidies and governance rights). Market structureindicators cover market concentration at the route and country levels, thepresence of challenger and/or third party carriers, and the role of alliances.Indicators of infrastructure access conditions take into account both slot domi-nance and congestion. To make the analysis of differences in regulatory andmarket environments manageable, the large set of cross-country and cross-routeindicators was summarised by means of statistical techniques. Summary informa-tion on the methods used to describe and synthesise regulatory and marketstructures in different countries and routes is provided in the Annex to Boylaudand Nicoletti in this issue.20
Regulatory and market features of air passenger transport at the country level
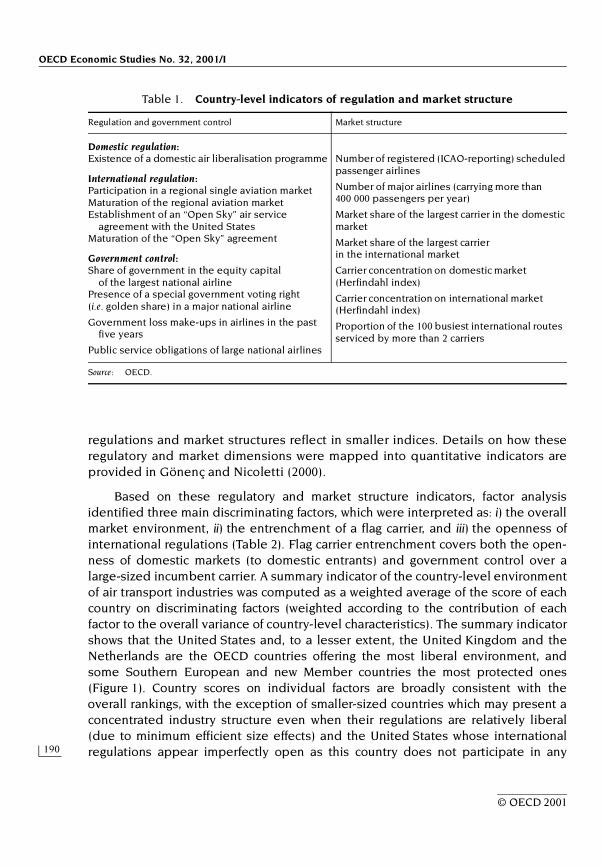
The regulatory and market environment of scheduled air passenger transpor-tation was measured along multiple dimensions (Table 1). Regulations includedboth domestic and international provisions (such as regional and/or open skyagreements) and government involvement in carriers’ operations (such as govern-ment ownership, subsidies and public service obligations). The time elapsedsince liberalisation, a proxy for the degree of maturation of its effects, was alsotaken into account. Regulatory information at the country level did not includepricing provisions, as these vary across routes. Market structure indicatorsincluded both the domestic and international dimensions, attempting to catch theoverall competitive pressures impinging on national carriers. All indicators havebeen expressed on a decreasing (1-0) scale where competition-friendly
OECD Economic Studies No. 32, 2001/I
190
© OECD 2001
regulations and market structures reflect in smaller indices. Details on how theseregulatory and market dimensions were mapped into quantitative indicators areprovided in Gönenç and Nicoletti (2000).
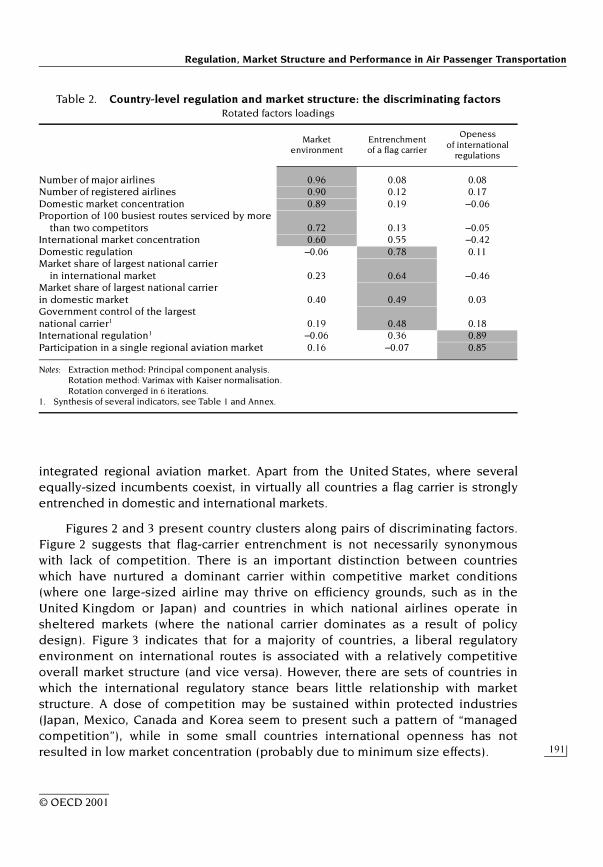
Based on these regulatory and market structure indicators, factor analysisidentified three main discriminating factors, which were interpreted as: i) the overallmarket environment, ii) the entrenchment of a flag carrier, and iii) the openness ofinternational regulations (Table 2). Flag carrier entrenchment covers both the open-ness of domestic markets (to domestic entrants) and government control over alarge-sized incumbent carrier. A summary indicator of the country-level environmentof air transport industries was computed as a weighted average of the score of eachcountry on discriminating factors (weighted according to the contribution of eachfactor to the overall variance of country-level characteristics). The summary indicatorshows that the United States and, to a lesser extent, the United Kingdom and theNetherlands are the OECD countries offering the most liberal environment, andsome Southern European and new Member countries the most protected ones(Figure 1). Country scores on individual factors are broadly consistent with theoverall rankings, with the exception of smaller-sized countries which may present aconcentrated industry structure even when their regulations are relatively liberal(due to minimum efficient size effects) and the United States whose internationalregulations appear imperfectly open as this country does not participate in any
Table 1. Country-level indicators of regulation and market structure
Source: OECD.
Regulation and government control Market structure
Domestic regulation:Existence of a domestic air liberalisation programme
International regulation:Participation in a regional single aviation marketMaturation of the regional aviation marketEstablishment of an “Open Sky” air service
agreement with the United StatesMaturation of the “Open Sky” agreement
Government control:Share of government in the equity capital
of the largest national airlinePresence of a special government voting right (i.e. golden share) in a major national airline
Government loss make-ups in airlines in the past five years
Public service obligations of large national airlines
Number of registered (ICAO-reporting) scheduled passenger airlines
Number of major airlines (carrying more than 400 000 passengers per year)
Market share of the largest carrier in the domestic market
Market share of the largest carrier in the international market
Carrier concentration on domestic market (Herfindahl index)
Carrier concentration on international market (Herfindahl index)
Proportion of the 100 busiest international routes serviced by more than 2 carriers
Regulation, Market Structure and Performance in Air Passenger Transportation
191
© OECD 2001
integrated regional aviation market. Apart from the United States, where severalequally-sized incumbents coexist, in virtually all countries a flag carrier is stronglyentrenched in domestic and international markets.
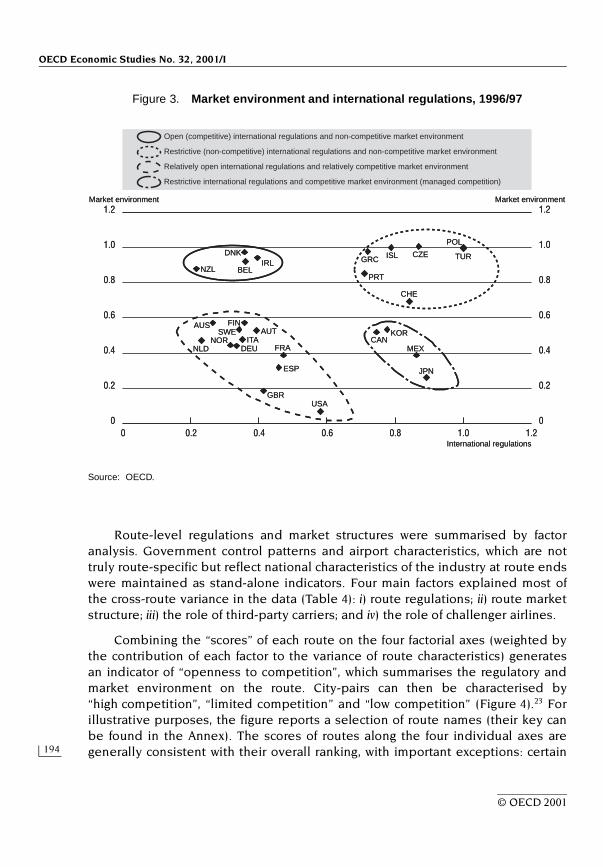
Figures 2 and 3 present country clusters along pairs of discriminating factors.Figure 2 suggests that flag-carrier entrenchment is not necessarily synonymouswith lack of competition. There is an important distinction between countrieswhich have nurtured a dominant carrier within competitive market conditions(where one large-sized airline may thrive on efficiency grounds, such as in theUnited Kingdom or Japan) and countries in which national airlines operate insheltered markets (where the national carrier dominates as a result of policydesign). Figure 3 indicates that for a majority of countries, a liberal regulatoryenvironment on international routes is associated with a relatively competitiveoverall market structure (and vice versa). However, there are sets of countries inwhich the international regulatory stance bears little relationship with marketstructure. A dose of competition may be sustained within protected industries(Japan, Mexico, Canada and Korea seem to present such a pattern of “managedcompetition”), while in some small countries international openness has notresulted in low market concentration (probably due to minimum size effects).
Table 2. Country-level regulation and market structure: the discriminating factors Rotated factors loadings
Notes: Extraction method: Principal component analysis. Rotation method: Varimax with Kaiser normalisation. Rotation converged in 6 iterations.
1. Synthesis of several indicators, see Table 1 and Annex.
Market environment
Entrenchment of a flag carrier
Openess of international
regulations
Number of major airlines 0.96 0.08 0.08Number of registered airlines 0.90 0.12 0.17Domestic market concentration 0.89 0.19 –0.06Proportion of 100 busiest routes serviced by more
than two competitors 0.72 0.13 –0.05International market concentration 0.60 0.55 –0.42Domestic regulation –0.06 0.78 0.11Market share of largest national carrier
in international market 0.23 0.64 –0.46Market share of largest national carrierin domestic market 0.40 0.49 0.03Government control of the largestnational carrier1 0.19 0.48 0.18International regulation1 –0.06 0.36 0.89Participation in a single regional aviation market 0.16 –0.07 0.85

OECD Economic Studies No. 32, 2001/I
192
© OECD 2001
Regulation and market structure at the route level
Differences in regulation and market structure at the route level are particu-larly strong in international air transport due to the overlap of domestic, bilateraland multilateral provisions. The main data source for regulation are bilateral airagreements applicable on the 102 routes included in the sample in (or around)1996. These provided detailed information about regulations concerning: thedesignation of carriers authorised to service the routes, route capacity limitations,the setting of airfares and the authorisation of charter flights on the route.21 Theregulatory information has been supplemented with data on the combined marketshare of publicly-controlled carriers on each route (defined as those in which thegovernment owns more than a third of the shares), as an indicator of the direct
Figure 1. Summary indicator of regulatory and market environment at country level, 1996/97
Increasingly anticompetitive
Source: Rauf Gönenç and Giuseppe Nicoletti, “Regulation, market structure and performance in air passengertransport”, OECD Economics Department Working Papers, 2000.
1.0
0.8
0.6
0.4
0.2
0
1.0
0.8
0.6
0.4
0.2
0
United
Sta
tes
Market environment Entrenchment of flag carrier Openness of international regulations
United
King
dom
Nethe
rland
s
Norway
Spain
Germ
any
Japa
n
Franc
e
Austri
a
Sweden
Austra
liaIta
ly
Mex
ico
Canad
a
Finlan
d
New Z
ealan
d
Korea
Irelan
d
Belgium
Switzer
land
Denm
ark
Portu
gal
Icelan
d
Greec
e
Czech
Rep
ublic
Turk
ey
Poland
1.0
0.8
0.6
0.4
0.2
0
1.0
0.8
0.6
0.4
0.2
0
United
Sta
tes
Market environment Entrenchment of flag carrier Openness of international regulations
United
King
dom
Nethe
rland
s
Norway
Spain
Germ
any
Japa
n
Franc
e
Austri
a
Sweden
Austra
liaIta
ly
Mex
ico
Canad
a
Finlan
d
New Z
ealan
d
Korea
Irelan
d
Belgium
Switzer
land
Denm
ark
Portu
gal
Icelan
d
Greec
e
Czech
Rep
ublic
Turk
ey
Poland

Regulation, Market Structure and Performance in Air Passenger Transportation
193
© OECD 2001
role of government. Market structure on each route has been analysed from theviewpoint of both the concentration of supply and its distribution between differ-ent categories of carriers. The taxonomy stresses different types and degrees ofcompetitive pressures exerted by different types of airlines and market arrange-ments: “challengers” (or limited-sized incumbents) are those which were nottraditional incumbents on a route, entered relatively recently, and succeeded incarving out a minimum market share; “third party” carriers are those that do notbelong to any of the countries signatories of the ASA on a particular route; airlinealliances are captured by the combined route market share of the airlines partici-pating in a strategic alliance. Finally, infrastructure access conditions included data onthe degree of congestion and slot concentration by incumbent carriers atroute-end airports.22
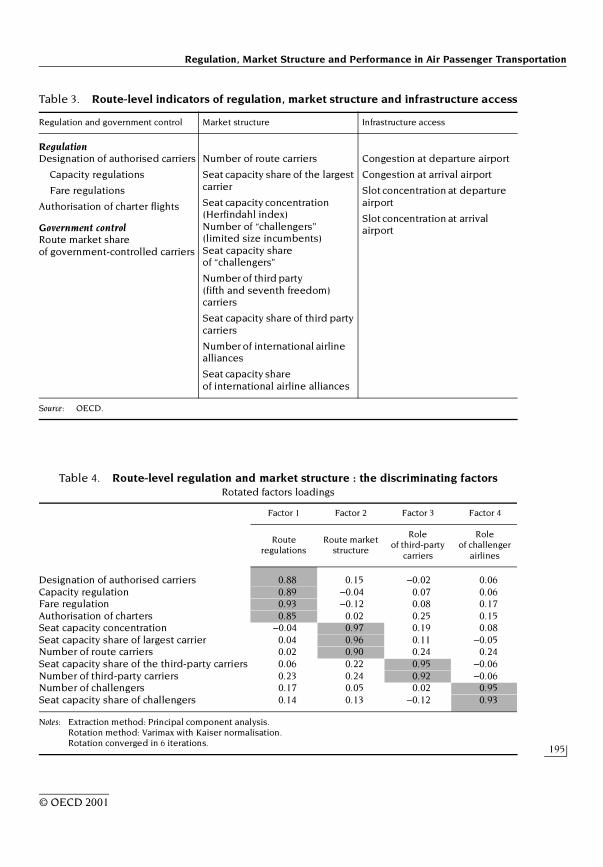
Table 3 summarises these route-level indicators. Following the sameapproach adopted for ranking countries, indicators are expressed on a decreasing(1-0) scale where more liberal regulatory and market arrangements generatesmaller indices (for details, see Gönenç and Nicoletti, 2000).
Figure 2. Flag carrier entrenchment and market environment, 1996/97
Source: OECD.
0
1.2
1.0
0.8
0.6
0.4
0.2
0
1.2
1.0
0.8
0.6
0.4
0.2
00.2 0.4 0.6 0.8 1.0 1.2
NZLIRL
BEL
DNK
ISL
PRT
GRC
POL
TUR
CZE
CAN
NLD
KOR
MEXJPN
GBR
NOR
AUSSWE
AUTGRC
CHE
FIN
ITA
FRAESP
USA
Strong flag carrier and non-competitive market environment
Strong flag carrier and competitive market environment
No flag carrier and competitive market environment
Market environment Market environment
Flag carrier entrenchment0
1.2
1.0
0.8
0.6
0.4
0.2
0
1.2
1.0
0.8
0.6
0.4
0.2
00.2 0.4 0.6 0.8 1.0 1.2
NZLIRL
BEL
DNK
ISL
PRT
GRC
POL
TUR
CZE
CAN
NLD
KOR
MEXJPN
GBR
NOR
AUSSWE
AUTGRC
CHE
FIN
ITA
FRAESP
USA
Strong flag carrier and non-competitive market environment
Strong flag carrier and competitive market environment
No flag carrier and competitive market environment
Market environment Market environment
Flag carrier entrenchment
OECD Economic Studies No. 32, 2001/I
194
© OECD 2001
Route-level regulations and market structures were summarised by factoranalysis. Government control patterns and airport characteristics, which are nottruly route-specific but reflect national characteristics of the industry at route endswere maintained as stand-alone indicators. Four main factors explained most ofthe cross-route variance in the data (Table 4): i) route regulations; ii) route marketstructure; iii) the role of third-party carriers; and iv) the role of challenger airlines.
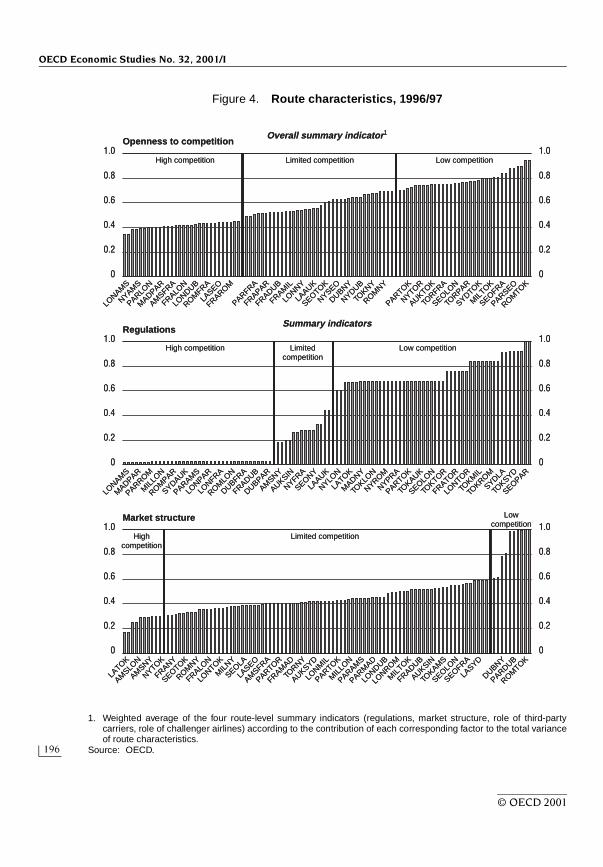
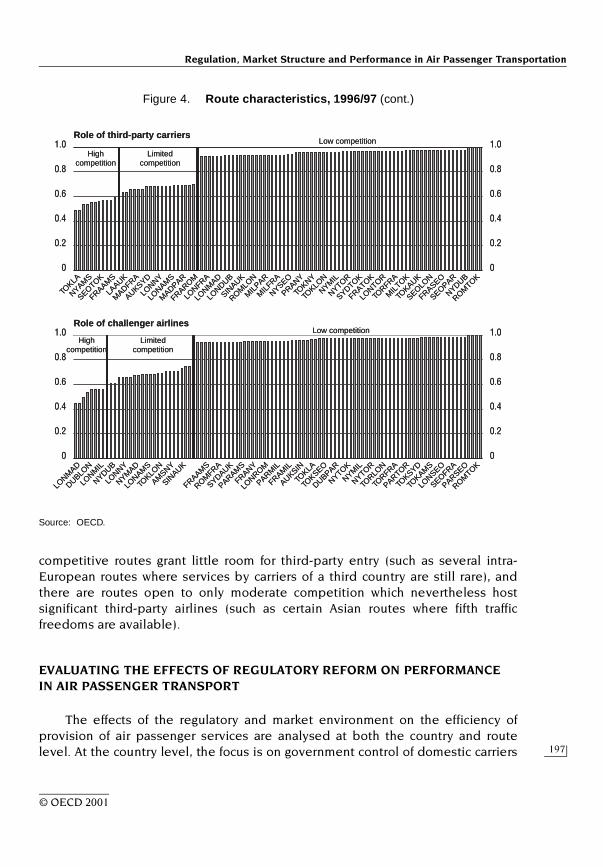
Combining the “scores” of each route on the four factorial axes (weighted bythe contribution of each factor to the variance of route characteristics) generatesan indicator of “openness to competition”, which summarises the regulatory andmarket environment on the route. City-pairs can then be characterised by“high competition”, “limited competition” and “low competition” (Figure 4).23 Forillustrative purposes, the figure reports a selection of route names (their key canbe found in the Annex). The scores of routes along the four individual axes aregenerally consistent with their overall ranking, with important exceptions: certain
Figure 3. Market environment and international regulations, 1996/97
Source: OECD.
0
1.2
1.0
0.8
0.6
0.4
0.2
0
1.2
1.0
0.8
0.6
0.4
0.2
00.2 0.4 0.6 0.8 1.0 1.2
NZL BEL
DNKIRL
AUS
PRT
GRC ISL CZE TUR
CHE
POL
KOR
NLD
FINSWE
NORAUT
ITADEU FRA
ESP
GBRUSA
CANMEX
JPN
Open (competitive) international regulations and non-competitive market environment
Restrictive (non-competitive) international regulations and non-competitive market environment
Relatively open international regulations and relatively competitive market environment
Market environment Market environment
International regulations
Restrictive international regulations and competitive market environment (managed competition)
0
1.2
1.0
0.8
0.6
0.4
0.2
0
1.2
1.0
0.8
0.6
0.4
0.2
00.2 0.4 0.6 0.8 1.0 1.2
NZL BEL
DNKIRL
AUS
PRT
GRC ISL CZE TUR
CHE
POL
KOR
NLD
FINSWE
NORAUT
ITADEU FRA
ESP
GBRUSA
CANMEX
JPN
Open (competitive) international regulations and non-competitive market environment
Restrictive (non-competitive) international regulations and non-competitive market environment
Relatively open international regulations and relatively competitive market environment
Market environment Market environment
International regulations
Restrictive international regulations and competitive market environment (managed competition)
Regulation, Market Structure and Performance in Air Passenger Transportation
195
© OECD 2001
Table 3. Route-level indicators of regulation, market structure and infrastructure access
Source: OECD.
Regulation and government control Market structure Infrastructure access
RegulationDesignation of authorised carriers
Capacity regulations
Fare regulations
Authorisation of charter flights
Government controlRoute market share of government-controlled carriers
Number of route carriers
Seat capacity share of the largest carrier
Seat capacity concentration (Herfindahl index)Number of “challengers” (limited size incumbents) Seat capacity share of “challengers”
Number of third party (fifth and seventh freedom) carriers
Seat capacity share of third party carriers
Number of international airline alliances
Seat capacity share of international airline alliances
Congestion at departure airport
Congestion at arrival airport
Slot concentration at departure airport
Slot concentration at arrival airport
Table 4. Route-level regulation and market structure : the discriminating factors Rotated factors loadings
Notes: Extraction method: Principal component analysis. Rotation method: Varimax with Kaiser normalisation. Rotation converged in 6 iterations.
Factor 1 Factor 2 Factor 3 Factor 4
Route regulations
Route market structure
Role of third-party
carriers
Role of challenger
airlines
Designation of authorised carriers 0.88 0.15 –0.02 0.06Capacity regulation 0.89 –0.04 0.07 0.06Fare regulation 0.93 –0.12 0.08 0.17Authorisation of charters 0.85 0.02 0.25 0.15Seat capacity concentration –0.04 0.97 0.19 0.08Seat capacity share of largest carrier 0.04 0.96 0.11 –0.05Number of route carriers 0.02 0.90 0.24 0.24Seat capacity share of the third-party carriers 0.06 0.22 0.95 –0.06Number of third-party carriers 0.23 0.24 0.92 –0.06Number of challengers 0.17 0.05 0.02 0.95Seat capacity share of challengers 0.14 0.13 –0.12 0.93
OECD Economic Studies No. 32, 2001/I
196
© OECD 2001
Figure 4. Route characteristics, 1996/97
1. Weighted average of the four route-level summary indicators (regulations, market structure, role of third-partycarriers, role of challenger airlines) according to the contribution of each corresponding factor to the total varianceof route characteristics.
Source: OECD.
1.0
0.8
0.6
0.4
0.2
0
1.0
0.8
0.6
0.4
0.2
0
1.0
0.8
0.6
0.4
0.2
0
1.0
0.8
0.6
0.4
0.2
0
1.0
0.8
0.6
0.4
0.2
0
1.0
0.8
0.6
0.4
0.2
0
Overall summary indicator1
Openness to competition
LONAM
S
Summary indicators
LATOK
LONAM
S
Market structure
Regulations
NYAMS
PARLON
MADPAR
AMSFRA
FRALON
LONDUB
ROMFRA
LASEO
PARFRA
FRAROM
FRAPAR
FRADUB
FRAMIL
LONNY
LAAUK
SEOTOK
NYSEO
DUBNY
NYDUB
TOKNY
ROMNY
PARTOK
NYTOR
AUKTOK
TORFRA
SEOLON
TORPAR
SYDTOK
MIL
TOK
SEOFRA
PARSEO
ROMTOK
MADPAR
PARROM
MIL
LON
ROMPAR
SYDAUK
PARAMS
LONPAR
LONFRA
ROMLO
N
DUBFRA
FRADUB
DUBPAR
AMSNY
AUKSIN
NYFRA
SEONY
LAAUK
NYLON
LATOK
MADNY
TOKLO
N
NYROM
NYPRA
PARTOK
TOKAUK
SEOLON
TOKTOR
FRATOR
LONTOR
TOKM
IL
TOKROM
SYDLA
TOKSYD
SEOPAR
AMSLO
N
AMSNY
NYTOK
FRANY
SEOTOK
ROMNY
FRALON
LONTOK
MIL
NY
SEOLA
LASEO
AMSFRA
PARTOR
FRAMAD
TORNY
AUKSYD
LONM
IL
PARTOK
MIL
LON
PARAMS
PARMAD
LONDUB
LONROM
MIL
TOK
FRADUB
AUKSIN
TOKAM
S
SEOLON
SEOFRA
LASYD
DUBNY
PARDUB
ROMTOK
Highcompetition
Limited competition
Lowcompetition
High competition Limitedcompetition
Low competition
High competition Limited competition Low competition1.0
0.8
0.6
0.4
0.2
0
1.0
0.8
0.6
0.4
0.2
0
1.0
0.8
0.6
0.4
0.2
0
1.0
0.8
0.6
0.4
0.2
0
1.0
0.8
0.6
0.4
0.2
0
1.0
0.8
0.6
0.4
0.2
0
Overall summary indicator1
Openness to competition
LONAM
S
Summary indicators
LATOK
LONAM
S
Market structure
Regulations
NYAMS
PARLON
MADPAR
AMSFRA
FRALON
LONDUB
ROMFRA
LASEO
PARFRA
FRAROM
FRAPAR
FRADUB
FRAMIL
LONNY
LAAUK
SEOTOK
NYSEO
DUBNY
NYDUB
TOKNY
ROMNY
PARTOK
NYTOR
AUKTOK
TORFRA
SEOLON
TORPAR
SYDTOK
MIL
TOK
SEOFRA
PARSEO
ROMTOK
MADPAR
PARROM
MIL
LON
ROMPAR
SYDAUK
PARAMS
LONPAR
LONFRA
ROMLO
N
DUBFRA
FRADUB
DUBPAR
AMSNY
AUKSIN
NYFRA
SEONY
LAAUK
NYLON
LATOK
MADNY
TOKLO
N
NYROM
NYPRA
PARTOK
TOKAUK
SEOLON
TOKTOR
FRATOR
LONTOR
TOKM
IL
TOKROM
SYDLA
TOKSYD
SEOPAR
AMSLO
N
AMSNY
NYTOK
FRANY
SEOTOK
ROMNY
FRALON
LONTOK
MIL
NY
SEOLA
LASEO
AMSFRA
PARTOR
FRAMAD
TORNY
AUKSYD
LONM
IL
PARTOK
MIL
LON
PARAMS
PARMAD
LONDUB
LONROM
MIL
TOK
FRADUB
AUKSIN
TOKAM
S
SEOLON
SEOFRA
LASYD
DUBNY
PARDUB
ROMTOK
Highcompetition
Limited competition
Lowcompetition
High competition Limitedcompetition
Low competition
High competition Limited competition Low competition
Regulation, Market Structure and Performance in Air Passenger Transportation
197
© OECD 2001
competitive routes grant little room for third-party entry (such as several intra-European routes where services by carriers of a third country are still rare), andthere are routes open to only moderate competition which nevertheless hostsignificant third-party airlines (such as certain Asian routes where fifth trafficfreedoms are available).
EVALUATING THE EFFECTS OF REGULATORY REFORM ON PERFORMANCE IN AIR PASSENGER TRANSPORT
The effects of the regulatory and market environment on the efficiency ofprovision of air passenger services are analysed at both the country and routelevel. At the country level, the focus is on government control of domestic carriers
Figure 4. Route characteristics, 1996/97 (cont.)
Source: OECD.
1.0
0.8
0.6
0.4
0.2
0
1.0
0.8
0.6
0.4
0.2
0
1.0
0.8
0.6
0.4
0.2
0
1.0
0.8
0.6
0.4
0.2
0
Role of third-party carriers
LONM
AD
Role of challenger airlines
DUBLON
LONM
IL
NYDUB
LONNY
NYMAD
LONAM
S
TOKLO
N
AMSNY
SINAUK
FRAAMS
ROMFRA
SYDAUK
PARAMS
FRANY
LONROM
PARMIL
FRAMIL
AUKSIN
TOKLA
TOKSEO
DUBPAR
NYTOK
NYMIL
NYTOR
TORLO
N
TORFRA
PARTOR
TOKSYD
TOKAM
S
LONSEO
SEOFRA
PARSEO
ROMTOK
Highcompetition
Limitedcompetition
Low competition
Highcompetition
Limitedcompetition
Low competition
TOKLA
NYAMS
SEOTOK
FRAAMS
LAAUK
MADFRA
AUKSYD
LONNY
LONAM
S
MADPAR
FRAROM
LONFRA
LONM
AD
LONDUB
SINAUK
ROMLO
N
MIL
PAR
MIL
FRA
NYSEO
PRANY
TOKNY
TOKLO
N
NYMIL
NYTOR
SYDTOK
FRATOK
LONTOR
TORFRA
MIL
TOK
TOKAUK
SEOLON
FRASEO
SEOPAR
NYDUB
ROMTOK
1.0
0.8
0.6
0.4
0.2
0
1.0
0.8
0.6
0.4
0.2
0
1.0
0.8
0.6
0.4
0.2
0
1.0
0.8
0.6
0.4
0.2
0
Role of third-party carriers
LONM
AD
Role of challenger airlines
DUBLON
LONM
IL
NYDUB
LONNY
NYMAD
LONAM
S
TOKLO
N
AMSNY
SINAUK
FRAAMS
ROMFRA
SYDAUK
PARAMS
FRANY
LONROM
PARMIL
FRAMIL
AUKSIN
TOKLA
TOKSEO
DUBPAR
NYTOK
NYMIL
NYTOR
TORLO
N
TORFRA
PARTOR
TOKSYD
TOKAM
S
LONSEO
SEOFRA
PARSEO
ROMTOK
Highcompetition
Limitedcompetition
Low competition
Highcompetition
Limitedcompetition
Low competition
TOKLA
NYAMS
SEOTOK
FRAAMS
LAAUK
MADFRA
AUKSYD
LONNY
LONAM
S
MADPAR
FRAROM
LONFRA
LONM
AD
LONDUB
SINAUK
ROMLO
N
MIL
PAR
MIL
FRA
NYSEO
PRANY
TOKNY
TOKLO
N
NYMIL
NYTOR
SYDTOK
FRATOK
LONTOR
TORFRA
MIL
TOK
TOKAUK
SEOLON
FRASEO
SEOPAR
NYDUB
ROMTOK
OECD Economic Studies No. 32, 2001/I
198
© OECD 2001
and the openness and competitive stance of domestic and international markets.These features of the domestic industry are related to proxies for overall industryefficiency. Route-level analysis is richer and more pertinent because data avail-ability makes it possible to concentrate on relevant markets (individual marketswith little cross-substitutability of demand, where carriers are direct competitors),and the price dimension is also brought into the picture. Therefore, the effects ofroute market structure and route regulations on route efficiency and airfares indifferent market segments (such as leisure and business travel) are looked at inmore detail: potentially important external influences, such as airport dominanceat route ends, are taken into account, and the differential impact of several kindsof regulations (price-setting rules, charter rights) or market arrangements (airlinealliances, presence of challenger carriers) is measured.
The econometric analysis followed a top-down approach. The effects ofregulation and market structure on performance were first sought at the countrylevel and, subsequently, at the route level. The analysis is based on ordinary leastsquares on a cross-section of 27 OECD countries or 100 major international routesin (or around) the 1996/1997 air travel season.24 At both the country and routelevels regulatory and market environments are summarised by the indicatorsdescribed in the previous section. The summary indicators constructed by meansof factor analysis are particularly appropriate for econometric analysis becausethey make it possible to specify parsimonious regression models, with syntheticexplanatory variables that approximate well the cross-country variance originallypresent in the detailed regulatory and market structure data. Summary indicatorsare subsequently unbundled into their main components to check the differentialimpact of various regulatory and market arrangements on route performance.
Interactions between country and route-level regulatory and market influencesare accounted for in the analysis. On the one hand, country-level factors such as publicownership of carriers, propensity of the population to travel by air or fleet structurecan have an impact on airline performance on individual routes; on the other hand,route-specific factors, such as competitive pressures faced by domestic carriers onindividual international routes, can contribute to shape the organisation of thedomestic industry (e.g. overall network features, technology choices, etc.). Empirically,the following interactions are accounted for: the combined effects of regulations con-cerning international routes on domestic industry efficiency; the combined effects ofgovernment control over route carriers on route efficiency and prices; the combinedeffects of the market environment faced by air transport industries in countries atroute ends on route efficiency and prices; the combined effects of economic and fleetstructure in industries at route ends on route efficiency and prices.
To facilitate the understanding of the empirical results, the discussion focuseson the distance of the country-level and route-level efficiency proxies from bestpractice. In this way, both the performance and the regulatory and market
Regulation, Market Structure and Performance in Air Passenger Transportation
199
© OECD 2001
environment variables are cast on a decreasing scale. Higher values reflect lowefficiency and restrictive environments, lower values reflect high efficiency andliberal environments. All estimated relationships between the indicators ofperformance and regulatory and market structure are therefore expected to bepositive if competition is to have beneficial effects on the air travel industry.
Effects on the efficiency of the domestic air transport industry
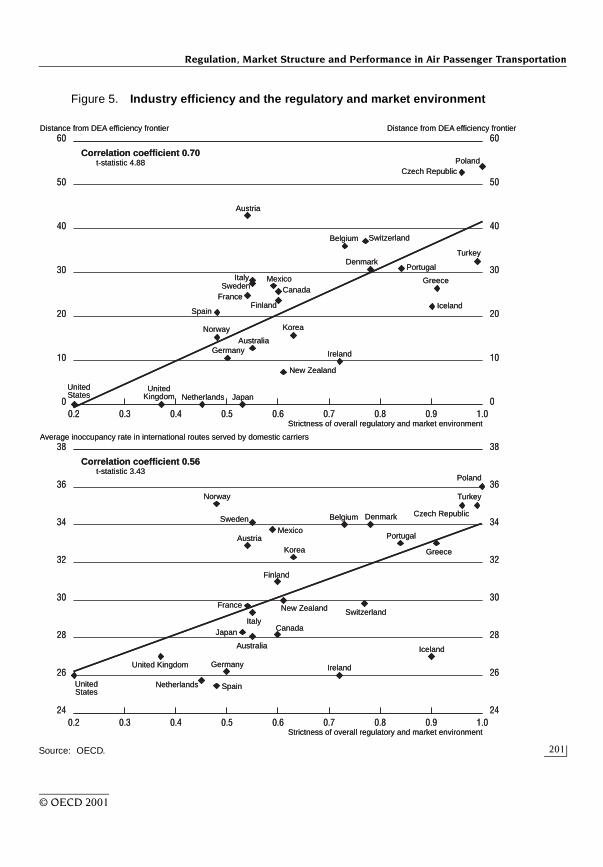
A useful starting point for the empirical analysis is to relate the summaryindicator of the overall regulatory and market environment (see Figure 1 above) totwo different proxies of industry efficiency across countries (see Box). Figure 5shows that a strong positive correlation exists between this indicator and both theaverage aggregate inoccupancy factor and the distance from the productionefficiency frontier. Thus, the air travel industries of countries in which the regula-tory and market environment is relatively friendly to competition appear to bemore efficient than industries facing a more protected environment.
To explore further this relationship, a reduced form multivariate model wasestimated on the cross-section of countries, relating the two measures of industryefficiency to their potential determinants (Table 5). The inoccupancy rate and thedistance from the efficiency frontier were related to the regulatory and marketstructure indicators as well as to a set of control variables expressing economicstructure and industry structure. Economic and industry structures were proxiedby the propensity of the population to travel by air, the average age of the fleetand the average size of planes in the fleet. Air travel propensities and fleet charac-teristics can be assumed to be exogenous to industry efficiency at any point intime, but they may be related to the regulatory and market structure indicatorsdue to the likely time-series correlation of regulatory and market arrangements.25
To avoid excessive multicollinearity and given the few degrees of freedom avail-able, a parsimonious specification was chosen. Policy and market influences weretherefore proxied by the overall indicator of the regulatory and market environ-ment (regression A) or by separate indicators for regulation and market structure(regression B).
The regression results suggest the presence of strong economies of scale anddensity related to market and aircraft size, respectively, and a significant impact ofthe market and regulatory environment on industry efficiency (Table 6): the morecompetitive this environment, the higher is industry efficiency – however mea-sured. The market environment alone has a significant impact in both regressions,with more competition (at home and on international routes) being associatedwith higher efficiency. Regulations on domestic and international routes per se playa lesser role and their effect is significant only in regressions based on the DEAmeasure of efficiency.
OECD Economic Studies No. 32, 2001/I
200
© OECD 2001
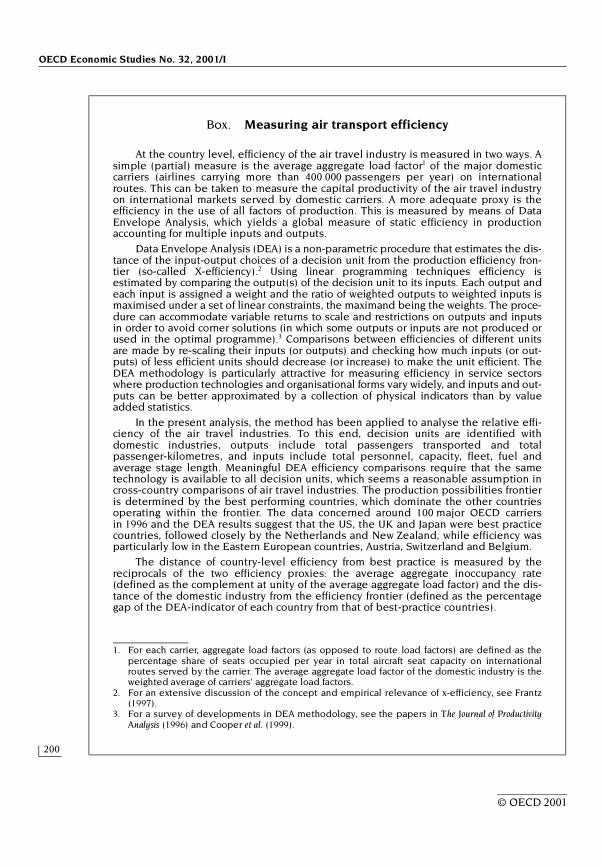
Box. Measuring air transport efficiency
At the country level, efficiency of the air travel industry is measured in two ways. Asimple (partial) measure is the average aggregate load factor1 of the major domesticcarriers (airlines carrying more than 400 000 passengers per year) on internationalroutes. This can be taken to measure the capital productivity of the air travel industryon international markets served by domestic carriers. A more adequate proxy is theefficiency in the use of all factors of production. This is measured by means of DataEnvelope Analysis, which yields a global measure of static efficiency in productionaccounting for multiple inputs and outputs.
Data Envelope Analysis (DEA) is a non-parametric procedure that estimates the dis-tance of the input-output choices of a decision unit from the production efficiency fron-tier (so-called X-efficiency).2 Using linear programming techniques efficiency isestimated by comparing the output(s) of the decision unit to its inputs. Each output andeach input is assigned a weight and the ratio of weighted outputs to weighted inputs ismaximised under a set of linear constraints, the maximand being the weights. The proce-dure can accommodate variable returns to scale and restrictions on outputs and inputsin order to avoid corner solutions (in which some outputs or inputs are not produced orused in the optimal programme).3 Comparisons between efficiencies of different unitsare made by re-scaling their inputs (or outputs) and checking how much inputs (or out-puts) of less efficient units should decrease (or increase) to make the unit efficient. TheDEA methodology is particularly attractive for measuring efficiency in service sectorswhere production technologies and organisational forms vary widely, and inputs and out-puts can be better approximated by a collection of physical indicators than by valueadded statistics.
In the present analysis, the method has been applied to analyse the relative effi-ciency of the air travel industries. To this end, decision units are identified withdomestic industries, outputs include total passengers transported and totalpassenger-kilometres, and inputs include total personnel, capacity, fleet, fuel andaverage stage length. Meaningful DEA efficiency comparisons require that the sametechnology is available to all decision units, which seems a reasonable assumption incross-country comparisons of air travel industries. The production possibilities frontieris determined by the best performing countries, which dominate the other countriesoperating within the frontier. The data concerned around 100 major OECD carriersin 1996 and the DEA results suggest that the US, the UK and Japan were best practicecountries, followed closely by the Netherlands and New Zealand, while efficiency wasparticularly low in the Eastern European countries, Austria, Switzerland and Belgium.
The distance of country-level efficiency from best practice is measured by thereciprocals of the two efficiency proxies: the average aggregate inoccupancy rate(defined as the complement at unity of the average aggregate load factor) and the dis-tance of the domestic industry from the efficiency frontier (defined as the percentagegap of the DEA-indicator of each country from that of best-practice countries).
1. For each carrier, aggregate load factors (as opposed to route load factors) are defined as thepercentage share of seats occupied per year in total aircraft seat capacity on internationalroutes served by the carrier. The average aggregate load factor of the domestic industry is theweighted average of carriers’ aggregate load factors.
2. For an extensive discussion of the concept and empirical relevance of x-efficiency, see Frantz(1997).
3. For a survey of developments in DEA methodology, see the papers in The Journal of ProductivityAnalysis (1996) and Cooper et al. (1999).
Regulation, Market Structure and Performance in Air Passenger Transportation
201
© OECD 2001
Figure 5. Industry efficiency and the regulatory and market environment
Source: OECD.
60
38
0.2
50
40
30
20
10
0
60
50
40
30
20
10
0
36
34
32
30
28
26
24
38
36
34
32
30
28
26
24
0.3 0.4 0.5 0.6 0.7 0.8 0.9 1.0
0.2 0.3 0.4 0.5 0.6 0.7 0.8 0.9 1.0
Distance from DEA efficiency frontier Distance from DEA efficiency frontier
Correlation coefficient 0.70t-statistic 4.88
Correlation coefficient 0.56t-statistic 3.43
Average inoccupancy rate in international routes served by domestic carriers
Strictness of overall regulatory and market environment
Strictness of overall regulatory and market environment
Austria
ItalySweden
France
Spain
Norway
MexicoCanada
Finland
Belgium Switzerland
Denmark
Czech RepublicPoland
Portugal
Turkey
Greece
Iceland
Korea
AustraliaGermany Ireland
New Zealand
JapanNetherlandsUnited
KingdomUnitedStates
UnitedStates
United Kingdom
Netherlands
Japan
New Zealand
Ireland
Iceland
Germany
Spain
Norway
Australia
CanadaItaly
France
Finland
Greece
Denmark
PortugalMexico
Sweden
AustriaKorea
Poland
Turkey
Czech RepublicBelgium
Switzerland
60
38
0.2
50
40
30
20
10
0
60
50
40
30
20
10
0
36
34
32
30
28
26
24
38
36
34
32
30
28
26
24
0.3 0.4 0.5 0.6 0.7 0.8 0.9 1.0
0.2 0.3 0.4 0.5 0.6 0.7 0.8 0.9 1.0
Distance from DEA efficiency frontier Distance from DEA efficiency frontier
Correlation coefficient 0.70t-statistic 4.88
Correlation coefficient 0.56t-statistic 3.43
Average inoccupancy rate in international routes served by domestic carriers
Strictness of overall regulatory and market environment
Strictness of overall regulatory and market environment
Austria
ItalySweden
France
Spain
Norway
MexicoCanada
Finland
Belgium Switzerland
Denmark
Czech RepublicPoland
Portugal
Turkey
Greece
Iceland
Korea
AustraliaGermany Ireland
New Zealand
JapanNetherlandsUnited
KingdomUnitedStates
UnitedStates
United Kingdom
Netherlands
Japan
New Zealand
Ireland
Iceland
Germany
Spain
Norway
Australia
CanadaItaly
France
Finland
Greece
Denmark
PortugalMexico
Sweden
AustriaKorea
Poland
Turkey
Czech RepublicBelgium
Switzerland

OE
CD
Econ
om
ic Stud
ies N
o. 32, 2
001/I
202
© O
EC
D 2001
Table 5. Empirical measures of country-level efficiency and its potential determinants
1. Regulatory and market environment indicators are expressed on a decreasing (1-0) scale, from most to least restritive of competition. Source: OECD.
Variable1 Definition/CommentNumber of
observationsMinimum Maximum Mean
Standard deviation
Coefficient of variation
Expected sign in
regression
Distance of domestic industry from efficiency frontier
Percentage gap from the efficiency frontier estimated using Data Envelope Analysis 27 0.00 54.22 22.79 14.99 0.66
Average inoccupancy rate on international routes served by domestic carriers
The inoccupancy rate is the complement to the load factor 27 25.45 36.00 30.59 3.46 0.11
Average aircraft size in national fleet
–27 104.00 257.62 163.11 39.35 0.24 –
Average aircraft age in national fleet
–27 6.20 14.10 10.45 2.42 0.23 +
National propensity to air travel Total number of air passengers per year over total population 27 0.00 4.54 1.09 1.03 0.94 –
Overall regulatory and market environment
Overall indicator based on factor analysis 27 0.20 1.00 0.64 0.20 0.31 +
Regulatory environment Summary indicator based on factor analysis 27 0.06 1.00 0.62 0.29 0.46 +
Market environment Weighted average of summary indicators based on factor analysis 27 0.33 1.00 0.67 0.18 0.27 +
Regulation, Market Structure and Performance in Air Passenger Transportation
203
© OECD 2001
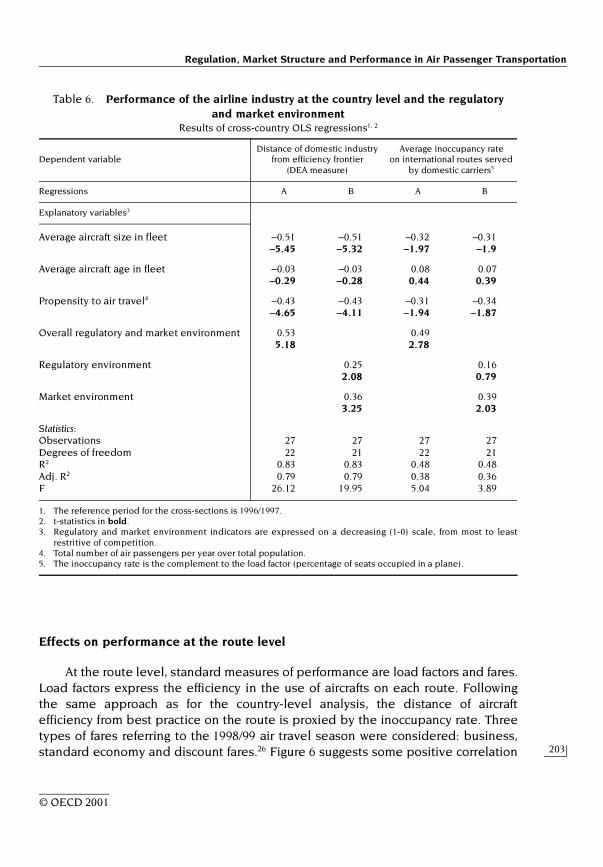
Effects on performance at the route level
At the route level, standard measures of performance are load factors and fares.Load factors express the efficiency in the use of aircrafts on each route. Followingthe same approach as for the country-level analysis, the distance of aircraftefficiency from best practice on the route is proxied by the inoccupancy rate. Threetypes of fares referring to the 1998/99 air travel season were considered: business,standard economy and discount fares.26 Figure 6 suggests some positive correlation
Table 6. Performance of the airline industry at the country level and the regulatoryand market environment
Results of cross-country OLS regressions1, 2
1. The reference period for the cross-sections is 1996/1997. 2. t-statistics in bold. 3. Regulatory and market environment indicators are expressed on a decreasing (1-0) scale, from most to least
restritive of competition. 4. Total number of air passengers per year over total population. 5. The inoccupancy rate is the complement to the load factor (percentage of seats occupied in a plane).
Dependent variableDistance of domestic industry
from efficiency frontier (DEA measure)
Average inoccupancy rate on international routes served
by domestic carriers5
Regressions A B A B
Explanatory variables3
Average aircraft size in fleet –0.51 –0.51 –0.32 –0.31–5.45 –5.32 –1.97 –1.9
Average aircraft age in fleet –0.03 –0.03 0.08 0.07–0.29 –0.28 0.44 0.39
Propensity to air travel4 –0.43 –0.43 –0.31 –0.34–4.65 –4.11 –1.94 –1.87
Overall regulatory and market environment 0.53 0.495.18 2.78
Regulatory environment 0.25 0.162.08 0.79
Market environment 0.36 0.393.25 2.03
Statistics:Observations 27 27 27 27Degrees of freedom 22 21 22 21R2 0.83 0.83 0.48 0.48Adj. R2 0.79 0.79 0.38 0.36F 26.12 19.95 5.04 3.89
OECD Economic Studies No. 32, 2001/I
204
© OECD 2001
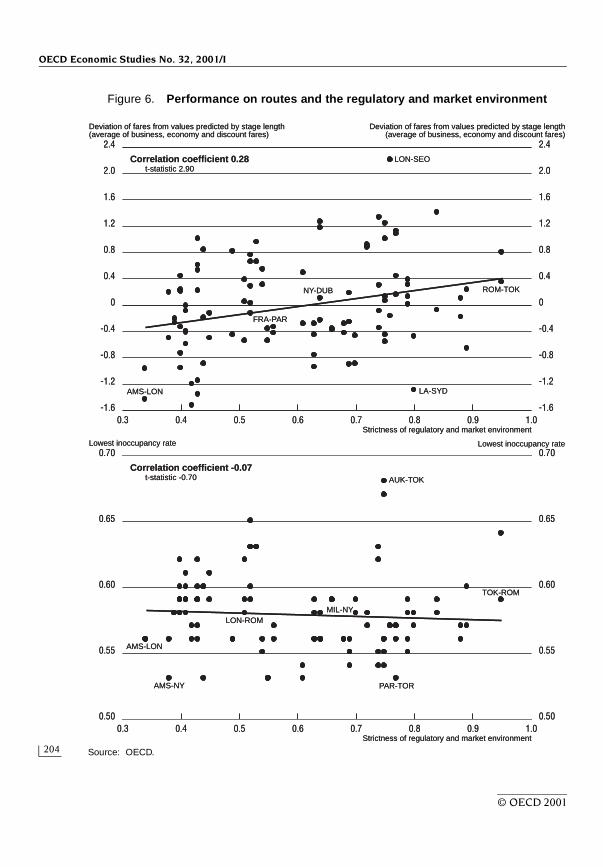
Figure 6. Performance on routes and the regulatory and market environment
Source: OECD.
2.4
0.70
0.3
1.6
0.8
0
-0.8
-1.2
-1.6
0.65
0.60
0.55
0.50
0.4 0.5 0.6 0.7 0.8 0.9 1.0
0.3 0.4 0.5 0.6 0.7 0.8 0.9 1.0
2.0
1.2
0.4
-0.4
2.4
1.6
0.8
0
-0.8
-1.2
-1.6
2.0
1.2
0.4
-0.4
0.70
0.65
0.60
0.55
0.50
Deviation of fares from values predicted by stage length(average of business, economy and discount fares)
Correlation coefficient 0.28t-statistic 2.90
Correlation coefficient -0.07t-statistic -0.70
Lowest inoccupancy rate
Strictness of regulatory and market environment
Strictness of regulatory and market environment
LON-SEO
Lowest inoccupancy rate
Deviation of fares from values predicted by stage length(average of business, economy and discount fares)
ROM-TOK
LA-SYD
NY-DUB
FRA-PAR
AMS-LON
AUK-TOK
TOK-ROM
MIL-NYLON-ROM
AMS-LON
AMS-NY PAR-TOR
2.4
0.70
0.3
1.6
0.8
0
-0.8
-1.2
-1.6
0.65
0.60
0.55
0.50
0.4 0.5 0.6 0.7 0.8 0.9 1.0
0.3 0.4 0.5 0.6 0.7 0.8 0.9 1.0
2.0
1.2
0.4
-0.4
2.4
1.6
0.8
0
-0.8
-1.2
-1.6
2.0
1.2
0.4
-0.4
0.70
0.65
0.60
0.55
0.50
Deviation of fares from values predicted by stage length(average of business, economy and discount fares)
Correlation coefficient 0.28t-statistic 2.90
Correlation coefficient -0.07t-statistic -0.70
Lowest inoccupancy rate
Strictness of regulatory and market environment
Strictness of regulatory and market environment
LON-SEO
Lowest inoccupancy rate
Deviation of fares from values predicted by stage length(average of business, economy and discount fares)
ROM-TOK
LA-SYD
NY-DUB
FRA-PAR
AMS-LON
AUK-TOK
TOK-ROM
MIL-NYLON-ROM
AMS-LON
AMS-NY PAR-TOR

Regulation, Market Structure and Performance in Air Passenger Transportation
205
© OECD 2001
between the overall route-specific regulatory and market environment (i.e. the“openness to competition” indicator of Figure 4) and airfares (adjusted for stagelength) in a cross-section of 100 routes connecting the main hubs of OECD countries.Competitive routes tend to be associated with lower fares. By contrast, no bivariatecorrelation can be observed between the openness to competition indicator andinoccupancy rates. However, inoccupancy rates and fares are affected by a numberof different factors and these need to be captured by multivariate analysis.
To put some structure on the specification of the multivariate model, airfarescan be assumed to depend on marginal costs and mark-ups (for a similar specifi-cation, see Graham et al., 1983). Marginal costs depend on the costs of inputs andvarious kinds of route-specific and industry-level economies (or diseconomies)proper to air transport, while mark-ups mainly depend on route-specific factors– such as regulatory restrictions, competitive pressures, and airport conditions atroute ends. A number of empirical proxies were chosen for these variables(Table 7). The costs of inputs were proxied by inoccupancy rates (productivity ofcapital), stage length (fuel) and an overall measure of the purchasing power of thecurrencies at route ends, which controls for exchange rate effects on input costs.27
No reliable data were available for labour costs at the route level. Economies (ordiseconomies) of scale were assumed to act through both capital productivity (seebelow) and other (unmeasured) cost components. Therefore, proxies for econo-mies of scale (the propensity to travel by plane at route ends), economies ofdensity (the average size of aircrafts in fleets at route ends) and diseconomies(difficulties of airport access, as reflected in the degree of slot concentration byincumbents and congestion) were included in the fare equation. Route regulationsand market structures were summarised by the indicators described in the previ-ous section. To account for the influence on mark-ups of the potential limitationsto competition implied by government ownership of incumbents, a summarymeasure of the share of the city-pair market jointly held by government-controlledcarriers was also included in the model.
Inoccupancy rates were assumed to depend on the structure of the fleet (aver-age size and age of planes), on economies of scale, density and stage length, and onpolicy and market influences shaping the x-efficiency of carriers. Influences onx-efficiency operate mainly by affecting competitive pressures and the governanceof firms (Frantz, 1997). In a network industry such as air transport, the efficient use ofcapital depends not only on competitive pressures at the route level but also, moregenerally, on pressures exerted at the industry level, which may enhance networkdesign and the allocation of capital over the network. For this reason, inoccupancyrates are assumed to depend on both route-specific regulations and marketstructures and the overall market environment faced by carriers in home industriesat route ends. The influence of governance on x-efficiency is proxied by the share ofthe city-pair market jointly held by publicly-controlled carriers.

OE
CD
Econ
om
ic Stud
ies N
o. 32, 2
001/I
206
© O
EC
D 2001
Table 7. Empirical measures of route-level performance and its potential determinants
1. Regulatory and market environment indicators are expressed on a decreasing (1-0) scale, from most to least restritive of competition. Source: OECD.
Variable1 Code Definition/CommentNumber
of observations
Minimum Maximum MeanStandard deviation
Coefficient of
variation
Expected Sign in
regression
Lowest inoccupancy rate on route LF Complement to highest load factor, adjusted for stage length
100 0.53 0.68 0.58 0.03 0.05
Business fare P Adjusted for stage length 100 –0.54 0.74 –0.04 0.29 –7.07
Standard economy fare P Adjusted for stage length 100 –0.53 0.69 –0.01 0.28 –19.75
Discount fare P Adjusted for stage length 100 –0.62 0.97 0.04 0.35 9.71
Average aircraft size in fleets at route ends SIZE Simple average of variables at route ends 100 151.27 250.80 185.80 23.01 0.12 –
Average aircraft age in fleets at route ends AGE Simple average of variables at route ends 100 8.22 13.85 11.17 1.32 0.12 +
Propensity to travel at route ends PROAIR Simple average of variables at route ends 100 0.47 2.35 1.15 0.49 0.42 –
Purchasing power at route ends PPP Simple average of variables at route ends 100 0.83 1.25 1.04 0.10 0.10 +
Route-specific regulatory and market environment
REGi Overall indicator based on factor analysis 100 0.34 0.95 0.60 0.16 0.27 +
Market environment at route ends COMP Simple average of factor analysis indicators at route ends
100 0.12 0.70 0.37 0.13 0.35 +
Infrastructure access conditions at route ends (airport dominance and congestion)
AIRPORT Composite indicator (see Table 3 and Annex)
100 0.12 0.81 0.57 0.16 0.28 +
Government control over route carriers GOV Capacity share of government-controlled carriers
100 0.00 1.00 0.29 0.32 1.10 +
Route-specific regulatory environment REGi Summary indicator based on factor analysis 100 0.02 1.00 0.42 0.35 0.84 +
Route-specific market environment MKTj Summary indicator based on factor analysis 100 0.48 1.00 0.69 0.12 0.17 +
Carrier designation rules on route REGi See Annex 100 0.00 1.00 0.33 0.34 1.04 +
Fare regulations on route REGi See Annex 100 0.00 1.00 0.55 0.48 0.87 +
Access rights for charters on route REGi See Annex 100 0.00 1.00 0.50 0.50 1.01 +
Capacity concentration on route MKTj – 100 0.13 1.00 0.44 0.19 0.43 +
Capacity share of challenger carriers on route MKTj – 100 0.77 1.00 0.97 0.06 0.06 +
Capacity share of airline alliances on route MKTj – 100 0.00 0.90 0.20 0.29 1.50 +
Regulation, Market Structure and Performance in Air Passenger Transportation
207
© OECD 2001
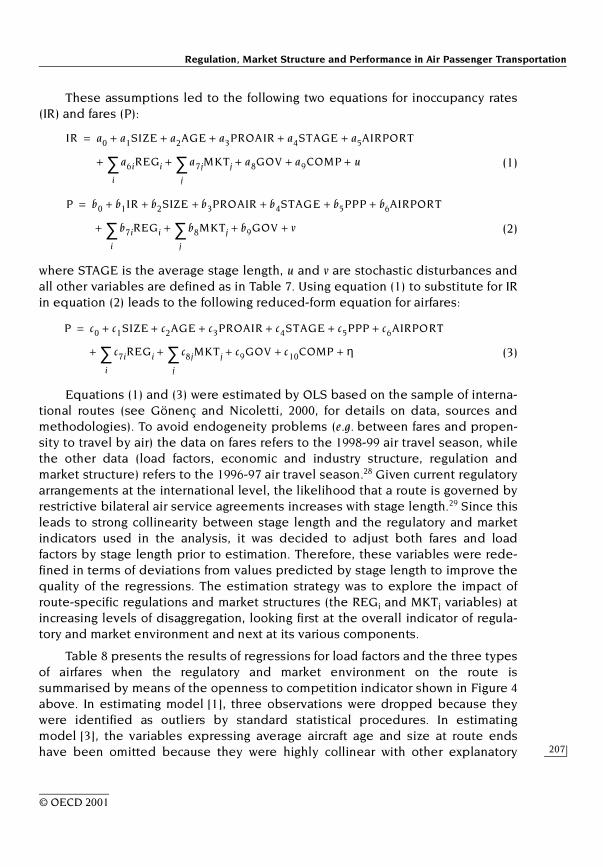
These assumptions led to the following two equations for inoccupancy rates(IR) and fares (P):
(1)
(2)
where STAGE is the average stage length, u and v are stochastic disturbances andall other variables are defined as in Table 7. Using equation (1) to substitute for IRin equation (2) leads to the following reduced-form equation for airfares:
(3)
Equations (1) and (3) were estimated by OLS based on the sample of interna-tional routes (see Gönenç and Nicoletti, 2000, for details on data, sources andmethodologies). To avoid endogeneity problems (e.g. between fares and propen-sity to travel by air) the data on fares refers to the 1998-99 air travel season, whilethe other data (load factors, economic and industry structure, regulation andmarket structure) refers to the 1996-97 air travel season.28 Given current regulatoryarrangements at the international level, the likelihood that a route is governed byrestrictive bilateral air service agreements increases with stage length.29 Since thisleads to strong collinearity between stage length and the regulatory and marketindicators used in the analysis, it was decided to adjust both fares and loadfactors by stage length prior to estimation. Therefore, these variables were rede-fined in terms of deviations from values predicted by stage length to improve thequality of the regressions. The estimation strategy was to explore the impact ofroute-specific regulations and market structures (the REGi and MKTj variables) atincreasing levels of disaggregation, looking first at the overall indicator of regula-tory and market environment and next at its various components.
Table 8 presents the results of regressions for load factors and the three typesof airfares when the regulatory and market environment on the route issummarised by means of the openness to competition indicator shown in Figure 4above. In estimating model [1], three observations were dropped because theywere identified as outliers by standard statistical procedures. In estimatingmodel [3], the variables expressing average aircraft age and size at route endshave been omitted because they were highly collinear with other explanatory
IR a0 a1SIZE a2AGE a3PROAIR a4STAGE a5AIRPORT+ + + + +=
a6iREGi
i
∑ a7jMKTj
j
∑ a8GOV a9COMP u+ + + + +
P b0 b1IR b2SIZE b3PROAIR b4STAGE b5PPP b6AIRPORT+ + + + + +=
a b7iREGi
i
∑ b8MKTj
j
∑ b9GOV v+ + + +
P c0 c1SIZE c2AGE c3PROAIR c4STAGE c5PPP c6AIRPORT+ + + + + +=
a c7iREGi
i
∑ c8jMKTj
j
∑ c9GOV c10COMP η+ + + + +
OECD Economic Studies No. 32, 2001/I
208
© OECD 2001
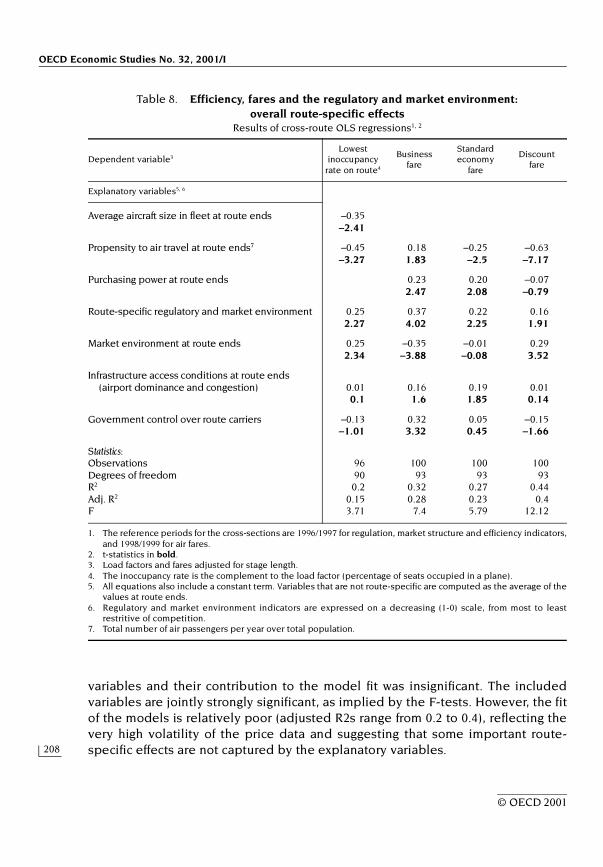
variables and their contribution to the model fit was insignificant. The includedvariables are jointly strongly significant, as implied by the F-tests. However, the fitof the models is relatively poor (adjusted R2s range from 0.2 to 0.4), reflecting thevery high volatility of the price data and suggesting that some important route-specific effects are not captured by the explanatory variables.
Table 8. Efficiency, fares and the regulatory and market environment:overall route-specific effects
Results of cross-route OLS regressions1, 2
1. The reference periods for the cross-sections are 1996/1997 for regulation, market structure and efficiency indicators,and 1998/1999 for air fares.
2. t-statistics in bold. 3. Load factors and fares adjusted for stage length. 4. The inoccupancy rate is the complement to the load factor (percentage of seats occupied in a plane). 5. All equations also include a constant term. Variables that are not route-specific are computed as the average of the
values at route ends. 6. Regulatory and market environment indicators are expressed on a decreasing (1-0) scale, from most to least
restritive of competition. 7. Total number of air passengers per year over total population.
Dependent variable3Lowest
inoccupancy rate on route4
Businessfare
Standard economy
fare
Discountfare
Explanatory variables5, 6
Average aircraft size in fleet at route ends –0.35–2.41
Propensity to air travel at route ends7 –0.45 0.18 –0.25 –0.63–3.27 1.83 –2.5 –7.17
Purchasing power at route ends 0.23 0.20 –0.072.47 2.08 –0.79
Route-specific regulatory and market environment 0.25 0.37 0.22 0.162.27 4.02 2.25 1.91
Market environment at route ends 0.25 –0.35 –0.01 0.292.34 –3.88 –0.08 3.52
Infrastructure access conditions at route ends (airport dominance and congestion) 0.01 0.16 0.19 0.01
0.1 1.6 1.85 0.14
Government control over route carriers –0.13 0.32 0.05 –0.15–1.01 3.32 0.45 –1.66
Statistics:Observations 96 100 100 100Degrees of freedom 90 93 93 93R2 0.2 0.32 0.27 0.44Adj. R2 0.15 0.28 0.23 0.4F 3.71 7.4 5.79 12.12
Regulation, Market Structure and Performance in Air Passenger Transportation
209
© OECD 2001
In general, regression results suggest that a) scale economies are a significantphenomenon in air travel; and b) the effects of regulation and market structure (atboth the route and industry levels) are at least as significant. The efficiency in theuse of capital increases with average aircraft size and the size of the market, andas the route-specific and country-specific regulatory and market environmentfaced by route carriers becomes friendlier to competition. By contrast, there is noevidence of adverse effects on productive efficiency of airport conditions at routeends or public control of route carriers.
A route-specific environment friendly to competition also tends to lower allcategories of fares, with the strongest effects observed in the business segment.However, the various types of fares react somewhat differently to the othereconomic and policy factors. As the size of the market expands, airlines use scaleeconomies for decreasing economy and discount fares, but at the same time busi-ness fares rise, increasing price discrimination on the route. Similarly, a competi-tive national market environment at route ends pushes up business fares, possiblybecause (mostly domestic) competitive pressures force airlines to shift the bulk ofprice discrimination onto international business travel, where competition isweaker. By contrast, competitive pressures on industries at route ends are thesingle most significant influence that reduces discount fares, possibly becausethese pressures force airlines to adopt better yield management strategies in asegment of the market where demand is highly elastic and competition bycharters may be vibrant. Fares also seem to react differently to airport conditionsat route ends. Airport dominance and congestion appear to push up prices intime-sensitive business and standard economy travel (although at 10 per centsignificance levels), while no effect can be detected on discount travel, which isnot time-sensitive. Finally, government control over route carriers tends to pushup business fares, perhaps because (mostly public-owned) flag carriers are oftenmore prone to compete for business travellers by increasing service quality, whileit tends to reduce discount fares (also at 10 per cent significance levels).
To explore further the separate contributions of the market structure andregulation variables to explaining differences in performance across routes,Table 9 shows the estimates of models [1] and [3] when the regulation component(i.e. the first factorial axis) of the overall route-specific summary indicator isisolated. The market structure components (market structure, role of third partycarriers and role of challenger carriers) are summarised by a single indicatorobtained by weighting the corresponding route scores by the contribution of eachfactorial axis to the overall variance of the data.
Overall the effects of the variables that are not route-specific are generallyconsistent with the previous regression, with the exception of the influence of thenational market environment at route ends on inoccupancy rates, which is now

OECD Economic Studies No. 32, 2001/I
210
© OECD 2001
Table 9. Efficiency, fares and the regulatory and market environment: separatingthe effects of route-specific regulation and market structure
Results of cross-route OLS regressions1, 2
1. The reference periods for the cross-sections are 1996/1997 for regulation, market structure and efficiency indicators,and 1998/1999 for air fares.
2. t-statistics in bold. 3. Load factors and fares adjusted for stage length. 4. The inoccupancy rate is the complement to the load factor (percentage of seats occupied in a plane). 5. All equations also include a constant term. Variables that are not route-specific are computed as the average of the
values at route ends. 6. Regulatory and market environment indicators are expressed on a decreasing (1-0) scale, from most to least
restritive of competition. 7. Total number of air passengers per year over total population.
Dependent variable3Lowest
inoccupancy rate on route4
Businessfare
Standard economy
fare
Discountfare
Explanatory variables5, 6
Average aircraft size in fleet at route ends –0.2–0.58
Propensity to air travel at route ends7 –0.28 0.15 –0.27 –0.64–2.32 1.52 –2.63 –7.14
Purchasing power at route ends 0.22 0.19 –0.072.41 2.02 –0.82
Route-specific regulatory environment –0.41 0.45 0.26 0.17–3.28 3.75 2.07 1.53
Route-specific market environment 0.7 –0.01 –0.01 0.026.22 –0.1 –0.05 0.2
Market environment at route ends –0.15 –0.23 0.06 0.32–1.3 –2.14 0.51 3.19
Infrastructure access conditions at route ends (airport dominance and congestion) –0.06 0.19 0.21 0.02
–0.58 1.97 2.02 0.26
Government control over route carriers –0.21 0.38 0.08 –0.13–1.95 3.75 0.72 –1.41
Statistics:Observations 97 100 100 100Degrees of freedom 89 92 92 92R2 0.41 0.35 0.28 0.44Adj. R2 0.36 0.3 0.23 0.4F 8.8 7 5.11 10.37
Regulation, Market Structure and Performance in Air Passenger Transportation
211
© OECD 2001
captured by the route-specific market structure. The regression results suggestthat a competitive route market structure is of the outmost importance for improv-ing efficiency in the use of aircrafts, but there is an inverse significant relationshipbetween the route-specific regulatory indicator and inoccupancy rates. Thus,relaxing route regulations appears to impact negatively on the efficiency of aircraftuse. Perhaps this reflects the effect of strategic behaviour of incumbents, whichreact to liberalisation by increasing flight frequencies to pre-empt new entry onthe route. At the same time, the inverse relationship between government controlover route carriers and inoccupancy rates is more difficult to explain.
Fares appear to be affected only by the route regulatory environment and thenational market environment at route ends. The summary indicator of route-specific market structure is insignificant in all fare regressions. This is consistentwith the so-called “potential entry” hypothesis, whereby route liberalisation per sesubmits incumbent carriers to the competitive pressure of other carriers thatcould easily enter the route. Another possible interpretation is that the presenceof several airlines on a route is effective in reducing fares only if route regulationsallow competitive pressures to unfold.
The conjectures about the differential effects of regulation and marketstructure on productive efficiency and different types of fares can be partiallychecked by looking at the effects on performance of individual components of theregulatory and market environment. The specific role of different regulatoryprovisions and market characteristics is highlighted in Table 10, which reports aselection of the results obtained in regressions that include the detailed indica-tors of regulation and market structure among the explanatory variables. Due tohigh collinearity between the detailed indicators, the strategy was to focus on themost significant regulatory and market influences on each of the performancemeasures. For brevity, the table omits the results concerning the variablesexpressing economic structure, which remained consistent with previous regres-sions.30 To explore the potentially different impact of various combinations ofregulation and market structure characteristics, two kinds of fare regressions wereperformed: i) with separate regulatory and market structure indicators(regression A); and ii) with an interaction term that allows for different effects ofmarket structure in strict and lax regulatory environments (regression B).31
While the efficiency of aircraft use is improved by both low concentration ofcapacity on the route and the presence of challenger airlines, the only significantregulatory influence is the extent of access rights for charters, with more extensiverights leading to lower capital efficiency. This result tends to corroborate thehypothesis that the negative relationship between liberalisation and efficiency inaircraft use is driven by the strategic reaction of incumbents to potential entry(such as charters). On routes where the impact of regulatory reforms on marketstructure has matured and carrier competition is effective, raising rival costs and
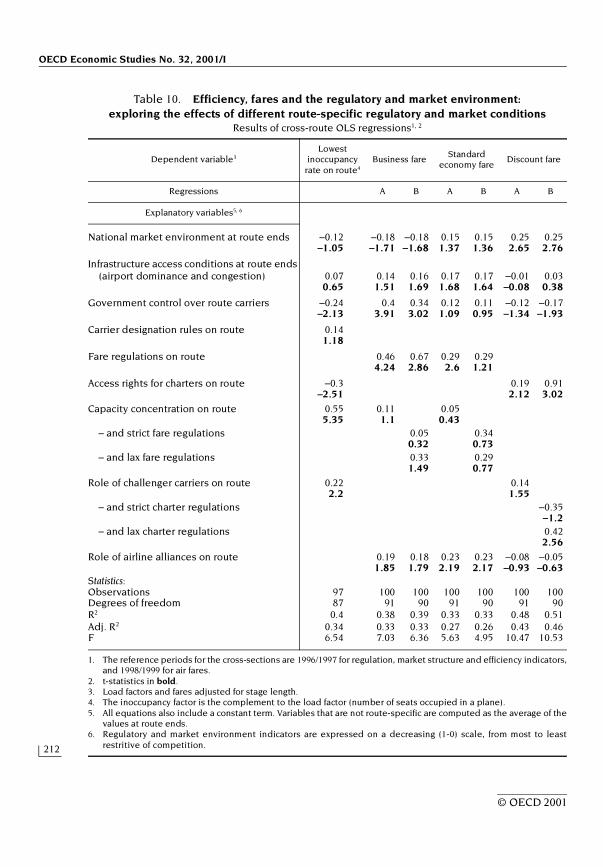
OECD Economic Studies No. 32, 2001/I
212
© OECD 2001
Table 10. Efficiency, fares and the regulatory and market environment:exploring the effects of different route-specific regulatory and market conditions
Results of cross-route OLS regressions1, 2
1. The reference periods for the cross-sections are 1996/1997 for regulation, market structure and efficiency indicators,and 1998/1999 for air fares.
2. t-statistics in bold. 3. Load factors and fares adjusted for stage length. 4. The inoccupancy factor is the complement to the load factor (number of seats occupied in a plane). 5. All equations also include a constant term. Variables that are not route-specific are computed as the average of the
values at route ends. 6. Regulatory and market environment indicators are expressed on a decreasing (1-0) scale, from most to least
restritive of competition.
Dependent variable3Lowest
inoccupancy rate on route4
Business fareStandard
economy fareDiscount fare
Regressions A B A B A B
Explanatory variables5, 6
National market environment at route ends –0.12 –0.18 –0.18 0.15 0.15 0.25 0.25–1.05 –1.71 –1.68 1.37 1.36 2.65 2.76
Infrastructure access conditions at route ends (airport dominance and congestion) 0.07 0.14 0.16 0.17 0.17 –0.01 0.03
0.65 1.51 1.69 1.68 1.64 –0.08 0.38
Government control over route carriers –0.24 0.4 0.34 0.12 0.11 –0.12 –0.17–2.13 3.91 3.02 1.09 0.95 –1.34 –1.93
Carrier designation rules on route 0.141.18
Fare regulations on route 0.46 0.67 0.29 0.294.24 2.86 2.6 1.21
Access rights for charters on route –0.3 0.19 0.91–2.51 2.12 3.02
Capacity concentration on route 0.55 0.11 0.055.35 1.1 0.43
– and strict fare regulations 0.05 0.340.32 0.73
– and lax fare regulations 0.33 0.291.49 0.77
Role of challenger carriers on route 0.22 0.142.2 1.55
– and strict charter regulations –0.35–1.2
– and lax charter regulations 0.422.56
Role of airline alliances on route 0.19 0.18 0.23 0.23 –0.08 –0.051.85 1.79 2.19 2.17 –0.93 –0.63
Statistics:Observations 97 100 100 100 100 100 100Degrees of freedom 87 91 90 91 90 91 90R2 0.4 0.38 0.39 0.33 0.33 0.48 0.51Adj. R2 0.34 0.33 0.33 0.27 0.26 0.43 0.46F 6.54 7.03 6.36 5.63 4.95 10.47 10.53
Regulation, Market Structure and Performance in Air Passenger Transportation
213
© OECD 2001
foreclosure (e.g. through the increase in flight frequencies) turn out to be moredifficult strategies and incumbents must compete on costs, including through abetter use of aircraft capacity.
Both business and economy fares are affected by fare regulations. Byhindering price competition, pricing rules requiring the double approval of thegovernments involved in bilateral air service agreements or the approval of thecountry to which the carrier belongs are conducive to higher fares. At the sametime, the route-specific market environment has an impact through airlinealliances, which also tend to increase fares (especially standard ones) as themarket share they cover on the route becomes larger. Apart from this effect,market structure appears to have no independent effect on fares. When theinteraction between market structure and fare regulations is accounted for, theregressions for business fares provide only very weak evidence that a low capacityconcentration on the route may have a sobering effect on fares when it is associ-ated with a relatively liberal price setting environment. Thus, the conjecture thatmarket structure affects business and economy fares when genuine price competi-tion is possible and the coexistence between several airlines on a route is not“managed” by the signatories of bilateral or multilateral service agreements is notclearly supported by the data.
In the regressions allowing for specific regulatory and market structure effects,overall competitive pressures in countries at route ends continue to exert signifi-cant market influence on discount fares. However, route-specific regulationsconcerning access rights for charters and (to a lesser extent) the presence ofchallengers on the route also play a role (Regression A). Charters are the maincompetitors of incumbents in the market for leisure travel and, therefore, it is notsurprising that liberal charter rights exert a downward pressure on discount fares.In addition, there is a close relationship between charter activity and the role ofchallengers on a route: challenger carriers may operate in the charter market inorder to compete with incumbents and, conversely, charter companies sometimesestablish themselves as challenger carriers over time. The existence of thisrelationship is confirmed by the results of the regression for discount fares thataccounts for the interaction between the role of challengers and the extent ofaccess rights for charters (Regression B). Challengers bring about a significantreduction in discount fares only when regulations concerning charters arerelatively liberal.
On the whole, the route-level empirical results can be summarised as follows.Actual competition at route ends and on the route is essential for improving effi-ciency and lowering discount-fares. Potential competition is helpful in discipliningbusiness and economy fares, but its effects are dampened as the role of airlinealliances on the route increases. The effects of actual competition on discount and(to a much weaker extent) business fares are more significant when the regulatory

OECD Economic Studies No. 32, 2001/I
214
© OECD 2001
Figure 7. The contribution of regulation, government control and market structure to air fares in selected routes
1. Percentage deviations of fares from sample average (100 routes), taking into account route stage length.Source: OECD.
40100 200-20-40-60806040200-20-40-60
Seoul-Los Angeles
London-Dublin
London-Amsterdam
Amsterdam-Frankfurt
Amsterdam-Paris
Sydney-Auckland
Madrid-London
Frankfurt-London
Sydney-Los Angeles
London-Paris
Frankfurt-Milan
Paris-Seoul
Paris-Rome
Tokyo-Sydney
New York-Tokyo
New York-Madrid
Paris-Tokyo
Paris-Toronto
Frankfurt-Tokyo
Paris-New York
Tokyo-Rome
New York-Rome
Tokyo-Milan
London-New York
Fares
Market structure Government control Other
Infrastructure Regulation
Business fares1 Discount fares1
New York-Paris
New York-London
New York-Amsterdam
New York-Rome
New York-Frankfurt
New York-Milan
Tokyo-Los Angeles
Sydney-Los Angeles
London-Rome
London-Milian
New York-Tokyo
Madrid-New York
Toronto-New York
Frankfurt-Paris
Frankfurt-London
Sydney-Tokyo
Tokyo-Auckland
Dublin-Frankfurt
London-Madrid
Seoul-Paris
Seoul-London
Paris-Amsterdam
Seoul-Frankfurt
Tokyo-Paris
Sydney-Auckland
Regulation, Market Structure and Performance in Air Passenger Transportation
215
© OECD 2001
environment encourages entry and price competition.32 There is some evidencethat difficulties in accessing infrastructures related to airport dominance andcongestion, as well as government control over route carriers increases fares intime-sensitive market segments. However, government control tends to increaseseat occupancy and moderate prices in market segments that are not time-sensitive. Perhaps this reflects management policies targeting capacity utilisationrather than profitability in non time-sensitive segments.
Based on the regression results shown in Table 9, the potential impact ofregulatory reform on airfares is illustrated graphically in Figure 7 for a selection ofinternational routes. In each route, the deviations of business and/or discountfares (adjusted by stage length) from their average values in the sample aredecomposed into the effects of regulation, market structure (including both theroute-specific and route-end dimensions), government control, infrastructureaccess and other factors (including both economic structure and the unexplainedresidual). In any given route, the sign and the size of the contribution of each ofthese elements to fares depends on its regression coefficient estimate and itsposition relative to the sample average.
In the routes selected, the combined impact of regulation and marketstructure is generally comparable to that of all other route characteristics takentogether. However, the effects of economic structure and unexplained factors aresizeable in many individual countries, especially in the non-time sensitivesegment of the market where the fit of the regression is weaker. The figure pointsout that on certain routes (such as several Northern European routes and somecompetitive Asian and Pacific routes) the combination of liberal regulatory envi-ronments and low government control (sometimes supplemented by relative easeof access to ground infrastructures) yields business fares that are between 20 and40 per cent lower than expected based on stage length. Conversely, restrictiveASAs, government control of route carriers and infrastructure access problemsappear to push fares more than 20 per cent above their expected levels in manyAtlantic and Europe-Asia routes. Discount fares are significantly affected by thedegree of competition at route ends: fares on routes originating or ending in theUnited States or in the United Kingdom, where competition is stronger, are ingeneral lower (relative to expected levels) than fares in other European and Asianor Pacific routes.
CONCLUSIONS AND DIRECTIONS FOR FUTURE RESEARCH
Despite the wide-ranging reforms implemented by OECD governments in thepast two decades, regulations affecting the air travel industry still vary a lot acrosscountries and routes. Until recently, most international (long-haul) routes were
OECD Economic Studies No. 32, 2001/I
216
© OECD 2001
exposed to very limited competition. This inhibited the creation of a globalaviation market and hindered network optimisation by air carriers. Because theycontinue to prevent competition from third party carriers, regional arrangementsand open sky policies constitute only a step towards a true opening of markets.
At both the national and route level there is clear evidence that productiveefficiency and fares are affected by regulatory and market arrangements. Overallefficiency and the rate of occupancy of aircraft seats tend to increase and allcategories of fares tend to decline as the regulatory and market environmentbecomes friendlier to competition. Industry and route (productive) efficiency isparticularly sensitive to actual competitive pressures (as proxied by low marketconcentration on individual routes and at the national level), while fares react tochanges in regulation independently from market structure, suggesting that poten-tial entry has a disciplining role on prices. However, the effect of liberalisation oncertain categories of fares is amplified by the existence of competitive marketconditions. In addition, both route efficiency and certain categories of fares are alsoaffected by overall market conditions prevailing in industries at route ends.
Different categories of fares are sensitive to different types of regulations andmarket arrangements. Business and economy fares are particularly sensitive topricing regulations and (when price competition is possible) market concentra-tion, while discount fares are affected mainly by charter regulations and (whencharter rights are extensive) the presence of challenger airlines, possibly reflectingthe use of these rights as an entry device for competitors wishing to establishthemselves on a route. There is also some evidence that economy and (to a lesserextent) business fares are higher in non-stop routes dominated by airline alliancesand that airport congestion and dominance tend to raise fares in the time-sensitive segments of the city-pair markets. The effects of government control areambiguous at both the industry and route level: business fares and the rate ofoccupancy of aircraft seats tend to increase with the role of government-controlledcarriers, while discount fares tend to decrease.
On the whole, these results confirm that air transport reforms aimed at liber-alising entry (e.g. by eliminating bilateral designation rules or extending charterrights) and prices involve significant benefits for all categories of travellers. Theempirical relevance of scale effects and the finding that both route and industryenvironments matter for performance point to the potential gains to be obtainedfrom the simultaneous liberalisation of domestic/regional markets and inter-national (long-haul) routes, which encourages network optimisation and cost-efficiency while reducing price-cost margins. For these policies to fully bear theirfruits, however, constraints on airport access must be relaxed and strategic behav-iour by incumbents (e.g. through alliances and slot dominance) must be kept incheck by appropriate competition policies.33
Regulation, Market Structure and Performance in Air Passenger Transportation
217
© OECD 2001
These conclusions could be refined by extending the analysis in two maindirections. First, the inclusion of indirect routes into the sample would make itpossible to study more accurately the potential benefits of network competition,possibly providing deeper insights on the role of Open Sky agreements in foster-ing competition (through fifth freedom provisions) and clarifying the implicationsof airline alliances for efficiency and airfares (which could be held back if networkeconomies were passed on to consumers). Second, the inclusion of proxies forservice quality (such as flight frequency and time spent on connections) wouldprovide a more complete picture of the repercussions of entry and price liberali-sation on consumer welfare.

OECD Economic Studies No. 32, 2001/I
218
© OECD 2001
NOTES
1. Derthick and Quirk (1985) provide a detailed account of how economic studies haveinspired and contributed to the US air transport reforms.
2. Certain negative effects were handled by pro-competitive regulations. Researchshowed that air services were discontinued in certain very small communities,inspiring a budget-funded “essential air services” programme. Surveys also helpeddetect the unsatisfactory safety performances of financially-strained small size airlines,justifying additional safety policies directed to this category of carriers.
3. Several studies were devoted to testing versions of the “contestable markets” hypoth-esis (for instance, Graham et al, 1983; Hurdle et al., 1989). Other studies showed thatprice differentials between business and discount fares widen under competition,raising in certain cases business fares and previously cross-subsidised short-distancefares to above pre-deregulation levels, but provoking a substantial overall decrease intotal travel costs for all passengers (see, among others, Borenstein, 1992; Evans andKessides, 1993; Morrison and Winston, 1999).
4. The effects of hub dominance on airfares are highlighted by Kahn (1993) and docu-mented empirically by Abramowitz and Brown (1993), Kim and Singal (1993) and USDepartment of Transportation (1999).
5. Among the studies focusing on specific kinds of regulatory and market arrangements,Dresner and Tretheway (1992) found that US “open sky” policies reduced airfares onNorth Atlantic routes; Hurdle et al. (1989) highlighted the role of “likely potentialentrants” (carriers whose entry in a route is not deterred by economies of scale andscope) in moderating airfares over US routes; and Kim and Singal (1993) suggestedthat airline mergers increased airfares in US routes in the late 1980s.
6. Regulations concerning charter flights affect competition and carrier performance inscheduled operations. Charters substitute for scheduled services in certain “non-timesensitive” demand segments, especially in European markets. Therefore, regulationswhich govern charter flights are also considered in this study as part of the regulatoryframework of scheduled services.
7. The exclusive focus on non-stop routes, which was dictated by data availability,also precludes the analysis of the network-enhancing benefits of competition(e.g. multiplication of alternative indirect routes).
8. A fuller discussion of competition issues in air travel can be found in Gönenç et al. (2000).
9. Transportation of business travellers from New York JFK to London Heathrow andtransportation of tourists from New York-New Jersey (Newark) to London Stansted viaAmsterdam do not take place in the same market.

Regulation, Market Structure and Performance in Air Passenger Transportation
219
© OECD 2001
10. Kleit and Maynes (1992) underscore this new dimension of airline competition andexplore its implications for the definition of relevant antitrust markets and competitionpolicy.
11. They also arise under privileged vertical relations between airlines and ancillary upstreamand downstream services, such as computer reservation systems, travel agents, groundhandling services etc. (Esperou and Subremon, 1997; Morrison and Winston, 1999).
12. The common international practice is to give incumbent carriers “grandfather” rights(i.e. the right to maintain control over slots that were controlled by them in previousyears). Remaining rights are sometimes reserved to new entrants and the trade ofexisting rights may or may not be authorised. For instance, the United States and EUMembers reserve a quota of spare slots for new entrants; the United States authorisesslot trading in some airports, and the EC only slot barters. In all instances incumbentairlines usually continue to control the wide majority of the airport utilisation rights.
13. This paper is not concerned with regulations addressing the external effects of air trans-portation, such as exhaustion gases, noise impacts, traffic congestion and air accidents. Itshould be noted, however, that these are often handled in OECD countries in ways thatmay curb competition. For instance, quantitative ceilings on airport movements (aimedat containing pollution, congestion and safety risks) often favour incumbents and hindernew entry. The use of economic instruments, such as slot pricing and taxes and tradablepermits for gas and noise emissions, is still rare even though they are likely to be morecompetitively neutral policies (see Gönenç et al., 2000).
14. As a by-product, OECD-area airlines have continuously focused on the safety andreliability of their services, making high safety standards a positive legacy of theregulated era.
15. In addition, price discrimination became possible, whereby flight fixed costs can befunded according to the price-elasticities of different groups of customers.
16. In the United States, the wave of new entries, mergers and acquisitions which followedthe 1978 deregulation brought about shake-ups in the ownership and governance of USairlines (including a number of bankruptcies), and led to sharp improvements in perfor-mance (Kole and Lehn, 1999). In Europe, privatisations and the establishment of the“community carrier” status waived national ownership constraints and opened the wayto trans-European mergers. The European Commission required that equity injectionsto government-owned airlines be subject to the “private market investor principle”whereby investments are not cleared when they are not justified from a businessperspective – therefore containing hidden subsidies. The Australia-New Zealandagreement liberalised ownership adjustments between two countries’ airlines.
17. In the United States, foreign investors are not authorised to acquire more than 25 percent of the voting capital of airlines and carrier boards must be controlled by UScitizens. European Union Member countries, and Australia-New Zealand, as well as allother OECD countries have similar foreign investment restrictions, generally at higherthresholds such as 49 per cent.
18. Open Sky air agreements may facilitate network optimisation when (standard) fifthfreedom traffic rights in connecting countries are available, but perfect matchingbetween independent agreements is rare. Furthermore, Open Sky agreements do notoffer seventh and eighth traffic freedoms that are important for network optimisation.
19. The data set includes the routes between the main national hub of 12 OECD countries tothe main hub of the United States, Japan, Germany, France and United Kingdom, withroute additions for the United States and Italy which have more than one national hub.

OECD Economic Studies No. 32, 2001/I
220
© OECD 2001
20. More detailed information on the OECD International Regulation Database, which includesthe data used in this paper, and on the statistical methodology for aggregating basicdata on individual regulatory provisions into summary indicators can be found inNicoletti et al. (1999). The database and its documentation are accessible on the OECDWebsite at www.oecd.org/subject/regdatabase/.
21. Designation rules may provide for either single or multiple carriers, with or withoutroute restrictions. Route capacity limitations may predetermine total capacity on theroute, or stipulate free capacity with ex post monitoring by signatory governments(as originally in Bermuda I agreements between the United Kingdom and theUnited States). Price setting rules may provide for free pricing or define approvalprocedures by the signatory governments (double approval, country of originapproval, double disapproval).
22. It is particularly difficult to measure congestion empirically. For the purposes of thispaper an airport was tagged as “congested” when it was reported as such to IATA bynational authorities.
23. The classification was determined by looking for “breaks” between route clusters inthe sample distribution of the indicators. The identification of breaks remains,however, somewhat arbitrary.
24. In cross-route regressions, two Asian routes were dropped due to missing data.
25. Standard empirical tests (based on variance inflation factors) did not provideevidence of this possible source of multicollinearity, which however may have biaseddownwards the significance of the coefficient estimates of the regulatory and marketstructure indicators.
26. Price data have been extracted from on line air ticket reservation systems, and coverthe business, fully flexible economy-class and Apex-type discount fares of the carrieroperating the largest number of flights on each route, as of 1 September 1999. Thesefares do not include corporate contract fares nor do they take account of frequent flyerprogramme redemptions.
27. Fares are expressed in US$ at current exchange rates and therefore are affected bydeviations of national currencies from their PPP values.
28. If these variables are autocorrelated over time, the introduction of a time lag onlypartially avoids this possible source of endogeneity bias.
29. For instance, the correlation between stage length and the summary indicator of routeregulations is close to 80 per cent.
30. Full regression results are available from the authors upon request.
31. For each kind of regulation and in each route, interaction terms were constructed bysubdividing countries into a “liberal” group and a “protectionist” group. The effect ofmarket structure in the two regulatory environments was isolated by using dummiesidentifying the two groups of countries.
32. Thus the results are consistent with those of Hurdle et al. (1989), who find that thepresence of competitors reduces fares over and above the mere effect of potentialentry in a study concentrating on liberalised US routes.
33. To be effective, these policies may involve co-operation and co-ordination at theinternational level.
Regulation, Market Structure and Performance in Air Passenger Transportation
221
© OECD 2001
Annex
MULTILATERAL REGULATIONS, BILATERAL AIR SERVICE AGREEMENTS AND REGIONAL AVIATION MARKETS
International regulations in civil aviation are determined either multilaterally at the glo-bal level, regionally among groups of countries, or bilaterally between pairs of governments.
Certain international rules for civil aviation, especially those concerning the professionallicensing of air crews and the safety certification of aircraft, and their gas and noise emissioneffects, are settled multilaterally, in the International Civil Aviation Organisation (ICAO).* SeveralOECD governments stress today the need for a more dependable enforcement of multilateralstandards, their adaptation to growing air traffic and multiplication of market participants, andto new aviation technologies – such as computer and software-based navigation which neces-sitate new maintenance procedures (Olster et al., 1992; Savage, 1999; ICAO, 1999).
The rules which most directly affect the organisation of the industry, such as thedesignation of authorised carriers, their entry on specific routes, their freedom to establishcapacity and prices, and the authorisation of charter flights are embedded in bilateral “airservice agreements” (ASAs) between governments. There are at present more than 3 000 ofthem in application. They spell-out the traffic rights between the two underwriting countriesand describe in detail the air routes operable, the names of carriers allowed to enter, theaircraft types and flight frequencies authorised, the types of fares applicable, and themechanisms available for fare settlement. ASAs traditionally granted only the first four trafficfreedoms described in the Box.
A new generation of ASAs called Open Sky agreements have been proposed by the USgovernment bilaterally as from early 1990s, and there are at present 47 of them in applica-tion. They imply: i) no limits on the number of airlines that may be designated by eithercountry; ii) unrestricted capacity and frequencies on all routes; iii) full fifth-freedom andsixth-freedom rights and unlimited “change of gauge” (change of aircraft type) on all routes;and iv) full pricing freedom unless fares are contested simultaneously by both governments(double disapproval regime). However, these agreements do not trigger full internationalcompetition because carriers continue to be designated by their respective governments,cross-country equity investments are not liberalised, and seventh (right of one country’sairlines to carry independent traffic between two other countries) and eighth (consecutiveservice into domestic market) traffic freedoms, which are essential for network optimisation,are generally not available.
* In the past certain international fare structures, fare levels and service norms were established bythe trade association of international airlines (IATA), to which governments delegated authority andgranted anti-trust immunities. This role of IATA has declined in the recent period in most of theOECD area.
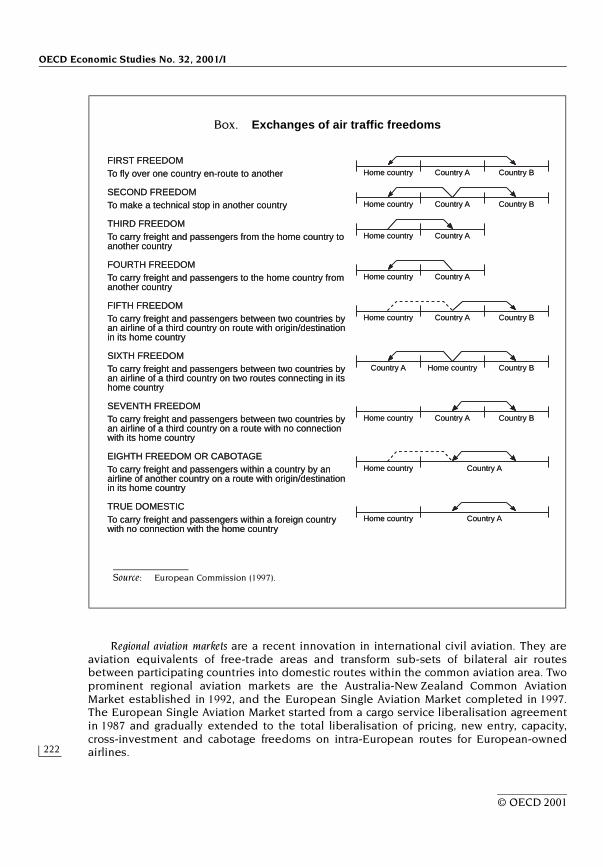
OECD Economic Studies No. 32, 2001/I
222
© OECD 2001
Regional aviation markets are a recent innovation in international civil aviation. They areaviation equivalents of free-trade areas and transform sub-sets of bilateral air routesbetween participating countries into domestic routes within the common aviation area. Twoprominent regional aviation markets are the Australia-New Zealand Common AviationMarket established in 1992, and the European Single Aviation Market completed in 1997.The European Single Aviation Market started from a cargo service liberalisation agreementin 1987 and gradually extended to the total liberalisation of pricing, new entry, capacity,cross-investment and cabotage freedoms on intra-European routes for European-ownedairlines.
Box. Exchanges of air traffic freedoms
Source: European Commission (1997).
FIRST FREEDOMTo fly over one country en-route to another Country BCountry AHome country
SECOND FREEDOMTo make a technical stop in another country
THIRD FREEDOMTo carry freight and passengers from the home country toanother country
FOURTH FREEDOMTo carry freight and passengers to the home country fromanother country
FIFTH FREEDOMTo carry freight and passengers between two countries byan airline of a third country on route with origin/destinationin its home country
SIXTH FREEDOMTo carry freight and passengers between two countries byan airline of a third country on two routes connecting in itshome country
SEVENTH FREEDOMTo carry freight and passengers between two countries byan airline of a third country on a route with no connectionwith its home country
EIGHTH FREEDOM OR CABOTAGETo carry freight and passengers within a country by anairline of another country on a route with origin/destinationin its home country
TRUE DOMESTICTo carry freight and passengers within a foreign countrywith no connection with the home country
Country BCountry AHome country
Country AHome country
Country AHome country
Country BCountry AHome country
Country BHome countryCountry A
Country BCountry AHome country
Country AHome country
Country AHome country
Regulation, Market Structure and Performance in Air Passenger Transportation
223
© OECD 2001
BIBLIOGRAPHY
ABRAMOWITZ, A.D. and S.M. BROWN (1993),“Market share and price determination in the contemporary airline industry”, Review ofIndustrial Organization, 8: 419-433.
AIR TRANSPORT ASSOCIATION NEWS (1999),“Approaching gridlock: Air traffic control delays”, Press Release, October.
AIRPORTS COUNCIL INTERNATIONAL (1998),“The economic impact of US airports”, ACI North America.
BAILEY, E.E., D.R. GRAHAM and D.P. KAPLAN (1985),Deregulating the Airlines, MIT Press.
BALTAGI, B.H., J.M. GRIFFIN and D.P. RICH (1995),“Airline deregulation: The cost pieces of the puzzle”, International Economic Review, Vol. 36,No. 1, February, pp. 245-260.
BARNETT, A. and M.K. HIGGINS (1989),“Airline safety: The last decade”, Management Science 35(1), pp. 1-21.
BASS, T.C. (1994),“Infrastructure constraints and the EC”, Journal of Air Transport Management, 1(3) pp. 145-150.
BORENSTEIN, S. and N.L. ROSE (1994),“Competition and price dispersion in the US airline industry”, Journal of Political Economy,Vol. 102, No. 4, August, pp. 653-683.
BORENSTEIN, S. (1988),“On the efficiency of competitive markets for operating licenses”, Quarterly Journal ofEconomics, 103(2), May, pp. 357-385.
BORENSTEIN, S. (1992),“The evolution of US airline competition”, Journal of Economic Perspectives, Vol. 6, No. 2,Spring, pp. 45-73.
CARTER, T. (1993),“Access to congested airports for regional services”, 7th European Forum, pp. 131-139.
CAVES, D.W., L.R. CHRISTENSEN and M.W. TRETHEWAY (1981),“US trunk air carriers, 1972-1977: A multilateral comparison of total factor productivity”,Productivity Measurement in Regulated Industries, pp. 47-76.
CAVES, D.W., L.R. CHRISTENSEN and M.W. TRETHEWAY (1983),“Productivity performance of US trunk and local service airlines in the era ofderegulation”, Economic Inquiry, Vol. XXI, July, pp. 312-324.

OECD Economic Studies No. 32, 2001/I
224
© OECD 2001
CAVES, D.W., L.R. CHRISTENSEN and M.W. TRETHEWAY (1984),“Economies of density versus economies of scale: Why trunk and local service airlinecosts differ”, Rand Journal of Economics, Vol. 15, No. 4, Winter, pp. 471-489.
CAVES, R. and C. HIGGINS (1993),“The consequences of the liberalised UK-Europe bilateral air service agreements”,International Journal of Transport Economics, Vol. XX, No. 1, February pp. 3-25.
CERNA & LET (1998),Études sur la gestion des créneaux aéroportuaires, Aéroports de Paris, Paris.
CHARNES, A., W.W. COOPER and E. RHODES (1978),“Measuring the efficiency of decision-making units”, The European Journal of OperationsResearch, Vol. 2, November.
COOPER, W.W., L. M. SEIFORD and K. TONE (1999),Data Envelopment Analysis, Kluwer Academic Publishers, Boston.
DEMSEY, P.S. and K. O’CONNOR (1999),“Air traffic congestion and infrastructure development in the Pacific Asia region”, AsiaPacific Air Transport; Challenges and Policy Reforms, Conference Proceedings.
DERTHICK, M. and P.J. QUIRK (1985),The Politics of Deregulation, Brookings Institutions Press, Washington DC.
DRESNER, M. and M. TRETHEWAY (1992),“Modelling and testing the effect of market structure on price: The case of internationalair transport”, Journal of Transport Economics and Policy, May, pp. 171-183.
ECKEL, C., D. ECKEL and V. SINGHAL (1997),“Privatization and efficiency: Industry effects of the sale of British Airways”, Journal ofFinancial Economics, 43, pp. 275-298.
EUROPEAN COMMISSION (1997),“Air transport”, The Single Market Review, Vol. 2.
EUROPEAN COMMISSION (1999),“The European airline industry: From single market to world-wide challenges”, ACommunication from the European Commission to the Council of Ministers andEuropean Parliament.
EVANS, W.N. and I. KESSIDES (1993),“Structure, conduct and performance in the deregulated airline industry”, SouthernEconomic Journal, Vol. 59, No. 3, January, pp. 450-466.
FEDERAL AVIATION ADMINISTRATION (1999),“Airport business practices and their impact on airline competition”, Task Force Study,October.
FRANTZ, R.S. (1997),X-efficiency: Theory, Evidence and Applications, Kluwer Academic Publishers.
GAUDRY, M. and R.R. MAYES (eds.) (1999),Taking Stock of Air Liberalization, Kluwer Academic Publishers.
GILLEN, D., R. HARRIS and T.H. OUM (1998),“A model for measuring economic effects of bilateral air transport liberalisation”, paperpresented at the International Colloquium on Air Transportation, Toulouse,November 17-19.
Regulation, Market Structure and Performance in Air Passenger Transportation
225
© OECD 2001
GÖNENÇ, R. and G. NICOLETTI (2000),“Regulation, market structure and performance in air passenger transportation”, OECDEconomics Department Working Papers, No. 254, Paris.
GÖNENÇ, R., M. MAHER and G. NICOLETTI (2000),“The implementation and the effects of regulatory reform: past experience and currentissues”, OECD Economics Department Working Papers, No. 251.
GRAHAM, D.R., D.P. KAPLAN and D.S. SIBLEY (1983),“Efficiency and competition in the airline industry”, Bell Journal of Economics, Spring,pp. 118-138.
GRIMM, C. and H. MILLOY (1993),“Australian domestic aviation deregulation: Impacts and implications”, Logistics andTransportation Review, September, pp. 250-273.
HURDLE, G., R.L. JOHNSON, A.S. JOSKOW, G.J. WERDEN and M.A. WILLIAMS (1989),“Concentration, potential entry, and performance in the airline industry”, Journal ofIndustrial Economics, No. 2, December, pp. 119-139.
ICAO SECRETARIAT (1998),“Rio Conference explores innovative approaches to financing and managing CNS/ATMsystems” ICAO Journal, Vol. 53, No. 5, June.
JOURNAL OF PRODUCTIVITY ANALYSIS (1996),see all the articles in the issue No. 7.
KAHN, A.E. (1993),“The competitive consequences of hub dominance: A case study”, Review of IndustrialOrganization 8, pp. 381-405.
KAPUR, A. (1995),“Airport infrastructure: The emerging role of the private sector”, World Bank TechnicalPaper, No. 313, The World Bank, Washington DC.
KIM, E.H. and V. SINGAL (1993),“Mergers and market power: Evidence from the airline industry”, The American EconomicReview, Vol. 83, No. 3, June, pp. 549-569.
KLEIT, A.N. and S.G. MAYNES (1992),“Airline networks as joint goods: Implications for competition policy”, Journal ofRegulatory Economics, Vol. 4, No. 2, pp. 175-186.
LAPAUTRE, R. (2000),“Libéralisation des transports aériens : quel bilan ?”, Problèmes économiques, No. 2.650,February 2000.
LEVINE, M. (1965),“Is regulation necessary? California air transportation and national regulatory policy”,The Yale Law Journal, Vol. 74.
LIU, Z. and E.L. LYNK (1999),“Evidence on market structure of the deregulated US airline industry”, Applied Economics,31, pp. 1083-1092.
MARIN, P.L. (1995),“Competition in European aviation: Pricing policy and market structure”, The Journal ofIndustrial Economics, Vol. XLIII, No. 2, June, 141-159.
OECD Economic Studies No. 32, 2001/I
226
© OECD 2001
MARIN, P.L. (1998),“Productivity differences in the airlines industry: Partial deregulation versus short runprotection”, International Journal of Industrial Organization., 16, pp. 395-414.
MEYER, J.R. and T.R. MENZIES (1999),“Airline deregulation: Time to complete the job”, Issues in Science and Technology.
MORRELL, P. (1998),“Air transport liberalisation in Europe: The progress so far”, Journal of Air TransportationWorld-wide, Vol. 3, No. 1.
MORRISON, S.A. (1986),“The equity and efficiency of runway pricing”, Department of Economics, NortheasternUniversity, Boston MA.
MORRISON, S.A. and C. WINSTON (1999),“Enhancing the performance of the deregulated air transportation system”, BrookingsPapers: Microeconomics, pp. 62-123.
MORRISON, S.A., T. WATSON and C. WINSTON (1998),“Fundamental flaws of social regulation: The case of airplane noise”, AEI-Brookings JointCenter for Regulatory Studies Working Papers, No. 98-2, September.
NASSER, T.O. (1998),“Congestion pricing and network expansion”, Policy Research Working Paper, The WorldBank, Private Sector Development Department.
NEVEN, D.J., L.H. ROLLER and Z. ZHANG (1998),“Union power and product market competition: evidence from the airline industry”,Center for Economic Policy Research Discussion Paper, June.
NICOLETTI, G., S. SCARPETTA and O. BOYLAUD (1999),“Summary indicators of product market regulation with an extension to employmentprotection legislation”, OECD Economics Department Working Papers, No. 226, Paris.
OECD (2000),“Airline mergers and alliances” [DAFFE/CLP(2000)1], Competition Policy Roundtables.
OECD (1998),“Competition policy and international airport services” [DAFFE/CLP(98)3], CompetitionPolicy Roundtables.
OECD (1997),The Future of International Air Transport Policy: Responding to Global Change, Paris.
OSTER, C.V. Jr., J.S. STRONG and C.K. ZORN (1992),“Why Airplanes Crash: Aviation Safety in a Changing World”, Oxford University Press.
OUM, T.H. and C. YU (1998),“Winning airlines: Productivity and cost competitiveness of the world’s major airlines”,Transportation Research, Economics and Policy.
PERA, A. (1989),“Deregulation and privatisation in an economy-wide context”, OECD Economic Studies,No. 12, Spring, Paris.
SCOTT, E. (2000),“Freer skies?”, Airline Business, July.

Regulation, Market Structure and Performance in Air Passenger Transportation
227
© OECD 2001
STARKIE, D. (1988),“Allocating airport slots, A role for the market?”, Journal of Air Transport Management, 4,pp. 111-116.
STARKIE, D. and D. THOMPSON (1985),“The airport’s policy white paper: Privatisation and regulation”, Fiscal Studies, Vol. 6,No. 4, pp. 30-42.
STOUFFER, V. (1992),“Commercial aviation safety and risk”, Public Sector Aviation Issues, TransportationResearch Record 1332, Transportation Research Board, Washington DC, pp. 40-47.
UNITED STATES DEPARTMENT OF TRANSPORTATION (1999),Competition in the US Domestic Airline Industry: The Need for a Policy to Prevent Unfair Practices,May.
UNITED STATES GENERAL ACCOUNTING OFFICE (1996a),Aviation Safety: New Airlines Illustrate Long-Standing Problems in FAA’s Inspection Program,October, Washington DC.
UNITED STATES GENERAL ACCOUNTING OFFICE (1996b),Airline Deregulation: Barriers to Entry Continue to Limit Competition in Several Key DomesticMarkets, October, Washington DC.
UNITED STATES GENERAL ACCOUNTING OFFICE (1996c),Airport Privatization: Issues Related to the Sale or Lease of US Commercial Airports, February,Washington DC.
UNITED STATES GENERAL ACCOUNTING OFFICE (1996d),Domestic Aviation: Changes in Airfares, Service and Safety Since Airline Deregulation, April,Washington DC.
WALKER, K. (1999),“Air traffic control: Free for all”, Airline Business, No. 41, November.
WHITE, L.W. (1979),“Economies of scale and the question of ‘natural monopoly’ in the airline industry”,Journal of Air Law and Commerce, pp. 545-573.
WINSTON, C. (1999),“You can’t get there from here: Government failure in US transportation”, BrookingsReview, June, pp. 37-49.