Embed Size (px)
Citation preview

Reinsurance in State Health ReformRandall R. Bovbjerg, A. Bowen Garrett, Lisa Clemans-Cope, and Paul Masi
Reinsurance Institute Project of the Urban Institute
May 2008
State Coverage Initiatives is a national program of the Robert Wood Johnson Foundation administered by AcademyHealth.
State Coverage Initiatives
The nonpartisan Urban Institute publishes studies, reports and books on timely topics worthy of public consideration. This report was funded by a grant from the State Coverage Initiatives program. Some information on Washington comes from complementary work funded by that state’s Office of Financial Management. The views expressed are those of the authors and should not be attributed to the Urban Institute, its trustees, or its funders.

2
Reinsurance in State Health Reform
Table of Contents
Executive Summary 1
How Reinsurance Works in Healthy NY and Other Programs 2
How the Reinsurance Institute Helped States 3
The Simulation Model 3
Baseline Medical Spending and Insurance Premiums for Individuals and Firms 3
Modeling Changes from Reinsurance 4
The Policy Contexts for Reinsurance in Three States 5
Findings from the State Baseline Data 5
Reinsurance Impacts Modeled for the Three States 7
Modeling and Complementary Qualitative Inputs 9
Strengths and Limitations of Modeling 9
Qualitative Inputs 10
Qualitative Assessment of Unmodeled Changes in Costs 10
Reduced Insurer Risk Premiums 10
Other Lower Costs in Targeted Insurance Market 11
Higher Administrative Costs 11
Increased Medical Claims Costs under Reinsured Primary Coverage 11
The Impacts of Reinsurance in Policy Perspective 12
Subsidy for Insurance Consumers 12
Effects on the Insurance Market 13
Market Stability 13
Risk Segmentation 13
Lessons from the Reinsurance Institute about Technical Assistance for States 13
About the Authors 14
Endnotes 14

1
Executive SummaryReinsurance provides insurance coverage for insur-ance carriers. Many health plans purchase private reinsurance to protect themselves from unexpect-edly large volumes of high-cost claims and for other business reasons. In 2001, New York began Healthy NY, a program of state-funded reinsur-ance, which has grown to cover almost 150,000 people. Healthy NY sought to attract new enroll-ees by having health maintenance organizations (HMOs) offer a new, streamlined and subsidized product for previously uninsured, low-income workers or their workplace groups. The state subsidy consists of reinsurance reimbursement to carriers of 90 percent of medical benefits costs in the “corridor” of $5,000–$70,000 in spending per person per year.
The Reinsurance Institute was a project that provided quantitative modeling and qualitative analytical support for states with strong interest in using reinsurance as an element of health cover-age reform. A rationale was that better advance information could help states avoid some of the trial-and-error determination of impacts illus-trated by Healthy NY’s experience. The project worked closely with state officials from Rhode Island, Washington, and Wisconsin to thoroughly understand state circumstances, to build a baseline dataset not previously available to simulate premi-ums, and to estimate the impacts of reinsurance. Such impacts included changes in premiums, in employer offer and enrollee take-up of coverage, in numbers of people insured, and in costs to the state of reimbursing primary carriers for claims under the state-specified terms of reinsurance. Throughout the project, the team consulted with states on related issues of program design within the prevailing market and regulatory context.
Because no existing data sources linked all state residents and their employers or contained socio-demographic information and medical spending by resident, employer characteristics, prevailing pre-miums in the state, and generally applicable state insurance rate-making rules, data from existing national and state sources were combined in such a way as to create a database for each state that contained these elements and reflected known state characteristics. Estimated premiums were bench-marked to prevailing state rates. Policy makers expressed considerable interest in baseline informa-tion, even before formal modeling, as it illustrated two key points. First, small numbers of very high spenders account for a large share of health spend-ing, but most spending nonetheless occurs in lower corridors of claims expense. As one example, almost 65 percent of Wisconsin’s insured spending
was estimated to occur under $10,000 per year per person. Second, medical spending varies widely across individuals and by age and health status. This systematic variation creates pressure for risk segmentation across health insurance pools.
The model then estimated how much insurance purchases were likely to change if reinsurance reduced insurers’ claims costs and insurers’ reduced premiums to a commensurate extent. The model simulated the extent to which enrollees would take up offers of insurance, from employment groups or in the non-group market, as well as the extent to which employers would add or drop offers of insurance. Modeling of individual and employer responses to premium changes was based on elas-ticities from economic literature.
In specifying configurations of reinsurance to be modeled, all participating states sought not only to expand health insurance coverage, but also to support existing coverage. A surprise was that none ultimately showed much interest in adapting Healthy NY’s approach of targeting only previ-ously uninsured people. Participants also wanted to focus help on small firms or non-group buyers of coverage. Many configurations of reinsurance were modeled—that is, different specifications of eligible populations, corridors, and percentages of costs in the corridor to be reimbursed by the state rather than retained by the carrier. Washington and Wisconsin both wanted to model the impact of state general funding, as in Healthy NY. Rhode Island wanted to use insurer assessments and rein-surance payouts to shift funds across carriers based on patterns of medical spending incurred.
Based upon formal modeling, other quantitative estimates, and qualitative assessments, project findings include the following:
• Reinsurance subsidy from state general funds or special funds (as opposed to carrier assess-ments) did expand coverage among the previ-ously uninsured. Modeled configurations of reinsurance often achieved premium reductions by about one-third. How much reinsurance reduced premiums and hence increased cover-age was a function of how much state funding was hypothesized. The amount of funding was much more important than the configuration of reinsurance; that is, whether corridors were set relatively lower or higher, and achieving large impacts required large state funding.
• Most of the impact occurred because of increased employer offers of coverage rather than increased employee take up of offers once made.
• Impacts of reinsurance differed somewhat by individual characteristics. One surprise for states was that reinsurance often disproportionately helped higher income rather than lower income residents—those with higher incomes remained more able to afford even cheaper coverage.
• Most reinsurance dollars served not to expand coverage but to solidify existing coverage by making it less likely that small employers would drop coverage and allowing some people with non-group to switch to group coverage.
• Eligibility targeting affects what share of the subsidy goes to newly covered individuals rather than already covered people.
• Reinsurance also can help ameliorate risk segmentation in small-group and non-group markets in states that desire to do so. However, reinsurance alone will not make coverage available to higher risk people unless regulation requires that they be offered coverage and pools losses so as to create affordable premiums.
Reinsurance Institute interactions with states also offered some insights into technical assis-tance processes, as discussed in the report.
An overall conclusion is that reinsurance is not cost-effective if intended solely to increase cover-age, unless it follows Healthy NY and targets the subsidy only to the previously uninsured. However, participating states’ modeling requests clearly reflected other goals, which included solidifying existing coverage and addressing risk segmentation. Greater clarity about the importance of other goals is needed in order to more rigorously assess ben-efits and costs of reinsurance.
A more complete analysis should also consider other mechanisms with similar goals. For insur-ance subsidies, these include vouchers, other premium subsidies, and public program expan-sion. To address risk segmentation, alternatives include expanded regulatory support for forms of community rating, risk-adjusted premium con-tributions paid in advance, ceding of identified high risk people or groups in advance (prospec-tive reinsurance), and withholds from premiums or pooling of assessments that are distributed at the end of the year according to the risks actually enrolled by an insurer. Many such alternatives call for more thoroughgoing public control or oversight of flows of insurance funds than does reinsurance. Indeed, state policymakers under this project frequently wanted to consider broad-er reform issues than reinsurance and many state reform proposals reflect the broadening of the coverage expansion discussion.

2
Reinsurance in State Health Reform
Reinsurance in State Health ReformReinsurance is insurance for insurance companies.1 Through reinsurance, some of the risk of health spending assumed by primary insurers is shared with others. Primary risk bearers include insur-ance companies, health maintenance organizations (HMOs), and self-insured large-employer groups. In the private sector, primary insurers have long bought reinsurance to protect themselves against the risk of unexpectedly high medical expenses of their enrollees. Part of states’ small-group insurance market reforms in the 1990s also included one form of publicly overseen but privately financed private reinsurance pooling.2
Interest has recently grown in using a new form of publicly funded reinsurance as one way to help maintain or expand private health insurance.3 This attention partly reflects greater state interest in health coverage reform.4 Massachusetts’ successful 2006 enactment of a particularly ambitious reform has further spurred other states’ efforts.5 Interest in reinsurance mainly derives from its success in subsidizing the Healthy New York (Healthy NY) expansion of 2001. Healthy NY uses tobacco-settlement funds to encourage previously unin-sured low-income workers to enroll in HMOs.6 Enrollment reached 147,530 Healthy NY members by October 2007.7 Sellers (carriers) receive substan-tial assistance in paying for the costs of enrollees with large annual medical spending, while buyers (non-group policyholders, as well as employers and employees) receive an indirect premium subsidy.8
Several other states have shown interest in rein-surance, most notably Kansas, where advanced health reform planning got under way in 2000–2001, supported by a Health Resources and Services Administration (HRSA) State Planning Grant and technical assistance available from the State Coverage Initiatives program (SCI).9 SCI responded to interest in this new approach to subsidizing coverage by creating a new mode of grant support to assist interested state policy-makers—the Reinsurance Institute. That Institute was designed to build a population-based micro-simulation model to estimate the benefits and costs of reinsurance and also to provide qualita-tive technical assistance.10
How Reinsurance Works in Healthy NY and Other ProgramsIn private markets, health plans and self-insured employer groups often pay reinsurers to assume most of the risks of very high claims. Reinsurance for employer groups and for HMOs is sometimes termed stop-loss cover-
age; Healthy NY uses that term as well. Because private carriers’ primary motivation for buying reinsurance is to protect their solvency against unforeseen fluctuation in losses, private rein-surance typically covers only very high claims and often covers the risk of all claims up to the same ceiling as applicable under the primary carrier’s underlying coverage. Private reinsur-ance may also serve other goals, such as allow-ing a carrier to underwrite a higher volume of business than otherwise possible, enter a new market, or obtain specialized reinsurer exper-tise.11 Reinsurance transactions are not visible to primary insurance enrollees, who deal only with their primary carrier.
Publicly funded reinsurance is a similar mecha-nism, but its motivations are different.12 It seeks to subsidize private insurance with outside funds so as to lower premiums and possibly also to help stabilize targeted insurance markets. Public reinsurance has not been observed as a stand-alone reform. Rather, it is part of a broad-er strategy to maintain or expand coverage.
The form of reinsurance addressed by the Reinsurance Institute reimburses a primary insurer for a designated share of individuals’ annual medical claims spending at year’s end. A specified reinsurance threshold operates as a kind of deductible for the primary insurer, and a ceiling limits the reinsurer’s obligations. In the “corridor” in between, the primary car-rier remains responsible for some percentage of claims expense incurred. This coinsurance obligation or insurer “retention” is meant to maintain some incentive for the primary carrier to manage care and spending, not simply to dump expensive cases into the reinsurance pool. Above the ceiling, the primary carrier is again responsible for 100 percent of claims, up to
whatever ceiling applies in the underlying policy. The latter feature also encourages continued case management by primary carriers.
For example, under Healthy NY, participating HMOs as primary risk bearers are responsible for all claims up to $5,000 for each member during each calendar year (Exhibit 1).13 Starting at $5,000 and continuing through $75,000 each year, the state reinsurance reimburses the health plans for 90 percent of their annual spending for any member’s cumulative claims. Above $75,000, the primary carriers again bear 100 per-cent of the cost of claim. The Healthy NY reinsurance corridor of $5,000–$75,000 per member per year covers a much lower range of expenditure than does private reinsurance, which starts higher and may go to the maximum claim level covered under the underlying primary policy. Possibly because its corridor is not high, New York does not appear to build in high-cost case management strategies such as are often offered or required by private reinsurers.14 New York’s low-corridor approach is geared more to providing a reliable subsidy than to protecting against the highest claims. Given HMO-style coverage and the pre-viously uninsured population enrolled, the risk of extremely high payouts may be quite low.
New York initially set its corridor at $30,000–$100,000 and was surprised to find that only a very low share of insured medical spending “penetrated” the per-person threshold and trig-gered subsidy for the HMO involved. Evidently enrollees were unexpectedly healthy. To increase the amount of state subsidy and its impact on premiums, both the threshold and the ceiling were decreased by $25,000. In response, the plans reduced premiums by about 17 percent.15
Source: Authors’ graphic, based on Healthy NY documents.
claims/person/year
$75K+
$5K-75K
$0-5K
end-of-year, per person
primary carrier pays 100%
celing
corridor:reinsurer pays 90%primary carrier 10%
threshold
primary carrier pays 100%
Exhibit 1. Simplified Sketch: Healthy NY
3
Reinsurance is only one feature of Healthy NY. Program eligibility specifications essentially limit enrollment to low-income workers uninsured for the previous 12 months and their small employers. Coverage is supplied only by HMOs, and their benefits are streamlined. Mental health services are not covered, for example, and buy-ers may also opt to omit prescription coverage. Other rules come from normal state regulation of carriers that also applies to Healthy NY plans. The state limits its budgetary commit-ment to reinsurance subsidy, but the program has never neared that limit. If, however, reinsur-ance claims ever exceeded available state funds, the program would reduce reinsurance payouts pro rata to stay on budget.
The reinsurance of Healthy NY is retrospective. Whose claims will be covered is not known until year’s end. Retrospective reinsurance is also pub-licly required for Medicaid managed care plans. Their reinsurance, however, is financed from a share of state capitation payments rather than run as a separate subsidy of otherwise private plans.16 State subsidized reinsurance of private plans was also a feature of Healthcare Group of Arizona (HGA) for about five years. HGA is meant to be funded by businesses’ own premiums, but the state subsidy was begun in 1999 as one response to the adverse selection experienced by HGA plans as the program grew more popular and which led some plans to drop out.17 The subsidy was ended after 2004, and other countermeasures were implemented to address adverse selection.18
How the Reinsurance Institute Helped StatesPrior SCI programs of technical assistance for state insurance reform helped one jurisdiction at a time. The Reinsurance Institute was designed to improve upon that format by creating a commu-nity of state policymakers interested in reinsurance, then giving detailed technical assistance to three of those states.19 Central to the assistance was detailed modeling of reinsurance costs and benefits, which would serve to lessen the likelihood of surprises like those faced by Healthy NY.
SCI convened an initial Institute meeting in Albany, NY, in September 2006, inviting 17 states to participate based upon how ready they were to benefit from the help available. At that meeting, New York policymakers described Healthy NY and its experience. Reinsurance Institute staff further described reinsurance and other roles it might play in reform, along with the quantitative modeling and qualitative assis-tance to be made available through the Institute. General discussion among attendees not only
helped state staff improve their understanding of the issues, but also helped Institute staff bet-ter appreciate state interests.
Three states were later selected from among 10 that submitted formal requests to SCI to receive technical assistance and modest additional fund-ing to facilitate their participation. The states were Rhode Island, Washington, and Wisconsin. Institute staff worked with state officials to thoroughly understand state circumstances and policy environments and to build a microsimu-lation model to estimate the effects of new rein-surance subsidies on insurance. State officials also specified how they wanted to structure the reinsurance options to be modeled.
The Reinsurance Institute project thus had two components. First, it developed a new microsim-ulation model tailored to estimating changes in insurance enrollment based on buyers’ responses to reinsurance-driven premium decreases. Second, it created a capable team for consulting with states on related issues of program design within the prevailing market and regulatory con-text.20 The simulation modeling was designed to address the new reforms using retrospective reinsurance subsidies like those of Healthy NY. Modeling also provided information relevant to other reforms, and a number of issues were addressed, mainly in qualitative ways.
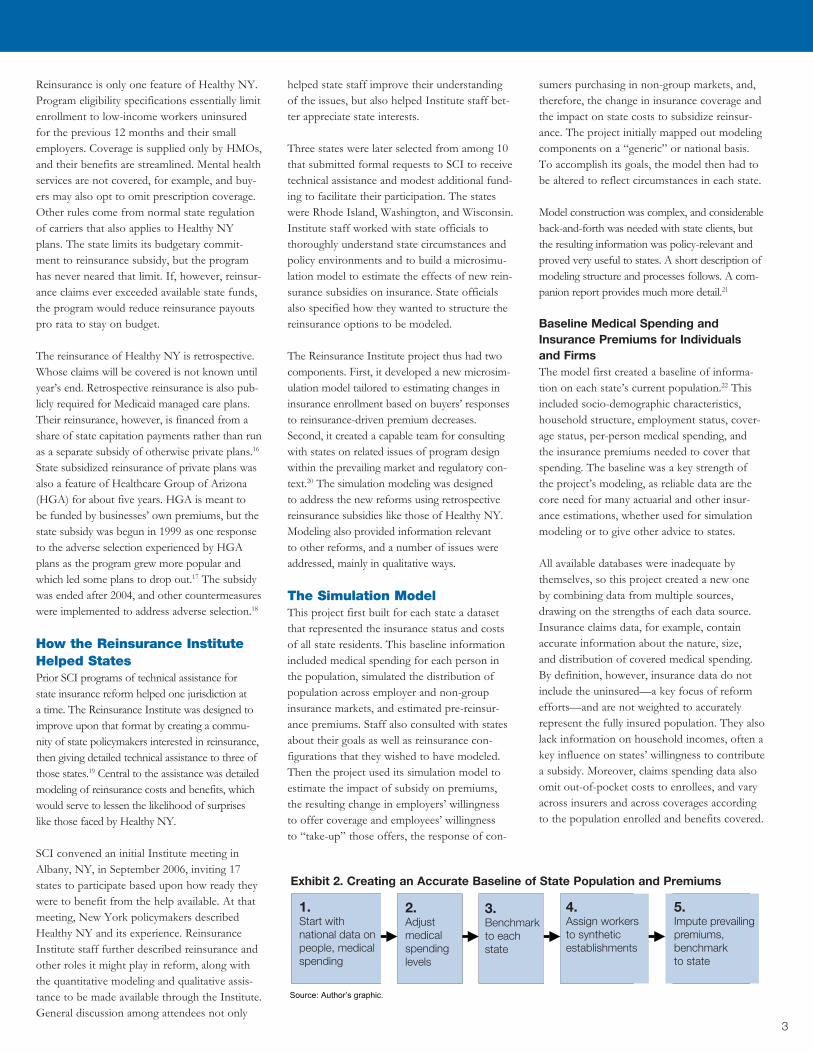
The Simulation ModelThis project first built for each state a dataset that represented the insurance status and costs of all state residents. This baseline information included medical spending for each person in the population, simulated the distribution of population across employer and non-group insurance markets, and estimated pre-reinsur-ance premiums. Staff also consulted with states about their goals as well as reinsurance con-figurations that they wished to have modeled. Then the project used its simulation model to estimate the impact of subsidy on premiums, the resulting change in employers’ willingness to offer coverage and employees’ willingness to “take-up” those offers, the response of con-
sumers purchasing in non-group markets, and, therefore, the change in insurance coverage and the impact on state costs to subsidize reinsur-ance. The project initially mapped out modeling components on a “generic” or national basis. To accomplish its goals, the model then had to be altered to reflect circumstances in each state.
Model construction was complex, and considerable back-and-forth was needed with state clients, but the resulting information was policy-relevant and proved very useful to states. A short description of modeling structure and processes follows. A com-panion report provides much more detail.21
Baseline Medical Spending and Insurance Premiums for Individuals and FirmsThe model first created a baseline of informa-tion on each state’s current population.22 This included socio-demographic characteristics, household structure, employment status, cover-age status, per-person medical spending, and the insurance premiums needed to cover that spending. The baseline was a key strength of the project’s modeling, as reliable data are the core need for many actuarial and other insur-ance estimations, whether used for simulation modeling or to give other advice to states. All available databases were inadequate by themselves, so this project created a new one by combining data from multiple sources, drawing on the strengths of each data source. Insurance claims data, for example, contain accurate information about the nature, size, and distribution of covered medical spending. By definition, however, insurance data do not include the uninsured—a key focus of reform efforts—and are not weighted to accurately represent the fully insured population. They also lack information on household incomes, often a key influence on states’ willingness to contribute a subsidy. Moreover, claims spending data also omit out-of-pocket costs to enrollees, and vary across insurers and across coverages according to the population enrolled and benefits covered.
Source: Author’s graphic.
1. Start with national data on people, medical spending
2. Adjust medicalspending levels
3. Benchmarkto eachstate
4. Assign workers to syntheticestablishments
5. Impute prevailingpremiums, benchmarkto state
Exhibit 2. Creating an Accurate Baseline of State Population and Premiums

4
Reinsurance in State Health Reform
There were five key steps in baseline data con-struction (Exhibit 2).
1. It began with national data from the federal Medical Expenditure Panel Survey, Household Component (MEPS-HC). This federal survey represents the entire non-institutionalized popu-lation and has information not available from insurance claims. MEPS-HC provides detailed data on individuals’ medical spending by source of payment, insurance coverage, income, nature of employment (industry, firm size, hourly wage, hours worked, insurance offer at work), and health status. These are all factors that states might want to use in designing alternative rein-surance plans, but the data are national rather than state-specific. We pooled three years’ worth of data to obtain a larger sample size that more fully reflects variation in characteristics, and we inflated spending to 2007 dollars.
2. The model then adjusted the reported expen-ditures to correct for known shortcomings in the data. In particular, MEPS-HC data are incomplete as to individual demograph-ics, and are known to understate total medical spending, especially for very large claims.23 After these first two steps, we had a population-based, generic, national data set that could be modified to correspond to the population characteristics of any state.
3. The next step was to re-weight these national data to match each of the three participat-ing states’ known demographics. The federal Current Population Survey (CPS) was used for this weighting because it offers an ideal comple-ment to MEPS-HC. The CPS provides large state-specific samples of population data that can be used to re-weight MEPS claims and spending information to resemble any state’s size and distribution of population by insur-ance status, income, age, family structure, and employment status. CPS also has the same type of detailed employment information as in the MEPS-HC. [For Washington only, most data on residents’ demographics and insurance status came from the Washington State Population Survey (WSPS)24 rather than the CPS, although CPS data were used in one instance where the WSPS response rate was insufficient.]
4. The succeeding step used information on business composition by state to assign each worker and any dependents to a set of “synthetic” employers whose composition matched each state’s establishment sizes and industry mix.25 For Washington only, the
generic model was also modified to focus on conventional small-group and non-group coverages, that is, to exclude people simu-lated as being enrolled in association health plans or the state high-risk pool, whose risks of high spending are systematically different.
5. Finally, the baseline estimated the insurance premium faced by each person in the rel-evant private markets. Premium levels mainly depend on expected health spending, the applicable insurance rating rules for spread-ing risk across insurance pools (e.g., modified community rating, “rate bands” for small-group coverage), and the size of any available workplace group. Employer size matters because very small groups’ premiums include very high administrative “loading” expense on top of medical claims costs, relative to the loads paid by larger small groups.26 Non-group loading is even higher. Loading covers non-medical expenses of insurance opera-tions, from sales to claims settlement and return on capital. The model’s initial premi-um estimates were benchmarked to reported premiums from another state-by-state federal survey, this one of employers.27 The results were then confirmed through interviews with insurers and others in each state.
The result of these five steps was a baseline of state-specific data of privately insured individu-als and households, along with the uninsured population, that well reflected known state char-acteristics. Unusually, the data combine demo-graphic detail at the individual and household
level with premium estimates made at the level of individuals and firms. This is the universe within which state initiatives might target rein-surance intervention.
Modeling Changes from ReinsuranceStarting from this baseline for each state, the model next simulated the changes in patterns of medical claims costs and insurance coverage that would be caused by a new state-funded reinsur-ance program (Exhibit 3). Again, the model went through five steps simulating such changes:
1. First, participating state officials specified hypothetical reinsurance program parameters of policy interest to them. This meant iden-tifying what population was to be targeted (e.g., small-firm workers and dependents), what dollar values of medical spending were to be reinsured (e.g., per person annual spending of $50,000–$100,000), and what percentage of that spending would be reim-bursed by the state program (e.g., 90 percent of claims in corridor).
2. Then the model estimated how much of insured medical spending would be reinsured and therefore how much premiums would be lowered by each set of parameters simulated.
3. Each simulated change in medical spend-ing and associated premiums in turn drives changes in insurance behavior, the next stage in the simulation. Here, the model estimated which additional employers would newly offer coverage at the new prices.
Baseline dataincluding initial
premiums
5. ComputeESI/NG premiumsfor new risk pool
1. Specifyreinsurance
policyparameters
2. RecomputeESI/NG premiums
3. ComputeESI offerchanges
4. Computechanges in
take-upof ESI/NG
Source: Authors’ graphic. Note: ESI is employer-sponsored insurance; NG is non-group insurance (also called “individual” of “direct-pay” coverage).
Exhibit 3. Modeling the Dynamics of Reinsurance: Iterative Flow of Simulated Impacts

5
4. In parallel fashion, given new offers or changed premiums, more employees can be expected to take up those offers. Similarly, reduced non-group premiums stimulate more purchase of coverage outside the workplace. This step of the model calculated the extent to which these changes would occur.
5. In the model, changes in who enrolls in turn change the composition of the insured risk pool—the aggregation of medical spending that premiums must cover (along with the associated loadings). This step also accounted for the amount by which medical spending can be expected to rise for the newly insured because they have improved access to care. In turn, premiums adjust for all enrollees, including those previously covered—a pro-cess of readjustment that occurs each year going forward. The simulation estimates the ultimate changes that can be expected to occur after successive responses to price shifts when all adjustments are complete.
Finally, from these results, the model estimated the number of people ultimately expected to enroll and the accompanying cost in state sub-sidy. Costs were estimated in 2007 dollars, and effects should be understood as occurring once the reinsurance subsidy program is fully imple-mented, and insurer and purchaser responses are complete. It should be noted that ensuring the same impacts in the future will require the state to continue funding reinsurance of the same relative magnitude, that is, to index sub-sidy to the underlying trend of medical spend-ing. Reinsurance in and of itself does nothing to moderate the underlying cost growth in health insurance.
The Policy Contexts for Reinsurance in Three StatesAll three participating states had been working on insurance reform for some time when the Reinsurance Institute began. In each, reinsur-ance had already become an important policy option. These histories were a major reason the states were interested in participation and selected to participate.
Rhode Island legislation that authorized a new, more affordable “wellness health benefit plan” had already been enacted.28 Lower premiums were to result mainly from a redesign of ben-efits—for example, to emphasize wellness and prevention—intended to achieve a 25 percent reduction in premium. Reinsurance subsidy for
low-wage individuals and employment groups was geared to save an additional 10 percent, with an estimated $24 million in subsidy.
The legislation passed without any funding source, but did contain a commitment to seek additional sources of funds in the future. No such funds had later been committed to reinsur-ance, and perhaps for that reason, policymakers did not want modeling to simulate new funding for reinsurance. Rather, they wanted to address issues of risk segmentation within their existing non-group and small-group markets. Institute interactions with Rhode Island benefited from the planning and research already under way there. 29 Quantitative outputs for the state thus focused only initially on how to model outside subsidy; final modeling addressed reinsurance as a way to share high-end costs in a merger of small-group and non-group markets (the latter is termed direct-pay coverage in Rhode Island and some other states).30
Washington state had a long-standing interest in reinsurance. In 2005, the Office of the State Insurance Commissioner developed a reinsur-ance proposal that was assessed by national experts but was never enacted.31 The state also had contracted for an actuarial analysis of a Healthy NY-style reinsurance approach for Washington.32 Even as the Reinsurance Institute and participating state officials were consulting on the appropriate scope of work for the state,33 developments continued along other fronts, including a Blue Ribbon commission report,34 a report from the Insurance Commissioner in response,35 and two new legislative enact-ments.36 Washington state contracted separately for additional input from the Reinsurance Institute in light of these developments. In Washington, as in Rhode Island, state policy-makers were interested in insurance for small firms and for non-group purchasers. They also wanted to adjust the reinsurance model to focus on people only with conventionally insured small-group or non-group coverage, omitting those covered under association plans or the high-risk pool, as noted earlier.
Wisconsin Governor Jim Doyle had for some time promoted health care reform as a major priority. One component announced in January 2006 was a Healthy Wisconsin policy proposal that was initially described as a version of Healthy NY. However, an implementing com-mission, the Healthy Wisconsin Council, deter-mined that the best approach was to focus on helping people with coverage to maintain that
coverage by keeping it more affordable. The Council’s final report of January 2007 proposed targeting state reinsurance subsidy to insurance for the smallest of small firms, those with two through 10 employees.37 For the Reinsurance Institute modeling, Wisconsin policymakers sought information on what reinsurance could accomplish for a set amount of state subsidy—some $100 million.38 Also of some interest was catastrophic reinsurance, as sketched out by Governor Doyle’s 2006 State of the State address. Its goal was to ensure that “no family should have to go bankrupt if they get sick.”39
Beginning on a site visit to Madison, the Reinsurance Institute focused on these propos-als. Staff first learned about Wisconsin’s policy and insurance market contexts, then modeled the types of reinsurance that could be funded with the available resources.
Findings from the State Baseline Data State policymakers were generally quite interest-ed in the baseline data for their states. Building upon prior surveys, the Reinsurance Institute model provided officials with a new perspective on insurance by combining information about population socio-demographics, employment, and insurance status with new estimates of likely insurance premiums. State officials took par-ticular interest in profiles of health spending for their targeted populations—workers and depen-dents with small-firm employers and people in the non-group market. In response, data were provided to states in an interactive spreadsheet that allowed state policymakers to extract and present the data as they liked.
Privately employed people in small-employer firms40 differed noticeably from the general population as well as from all private work-ers, according to the baseline simulations for these states: The individuals were younger, had lower incomes, and were less likely to receive an employer offer of insurance (data not pre-sented). Small-firm workers were also more likely to report fair or poor health than were other workers.
People who buy non-group insurance were the second group of interest. They are even more disadvantaged by high insurer cost load-ing, but their medical expenditures differ.41 In Washington state, for example, non-group enrollees averaged $3,200 per year in insured expenditure (2007$), compared with $3,900 for small-group enrollees.42

6
Reinsurance in State Health Reform
Within any group of insured or potentially insured individuals, medical spending varies sub-stantially by person and is highly concentrated among a small percentage of very expensive individuals, as has often been noted.43 Wisconsin baseline data for people insured through small employers showed this pattern clearly (Exhibit 4). Two-tenths (0.2) of 1 percent of the popula-tion were estimated to spend $100,000 or more per person in 2007, accounting for more than 6 percent of total spending. The top 1.2 percent of people were those spending $40,000 or more, and they accounted for 21 percent of spending. At the low end of spending, fully 93 percent of people spent under $10,000 a year, accounting for just over 45 percent of all insured medical spending for this set of people.44
From the perspective of Healthy NY-style rein-surance, it is more instructive to consider how often per person annual spending falls within defined corridors, because that is what a new program would cover. For example, insured spending of above $100,000 a year accounted for
barely 1 percent of total spending in Wisconsin’s small-group sector (Exhibit 5). In contrast, almost 65 percent of total dollars spent by insur-ance fell under $10,000 per year per person. The reason that only 1.3 percent of dollars exceeded $100,000, whereas total spending by people who exceeded $100,000 was 6.4 percent, is that most spending even for high-spending people occurs in lower corridors of expense.
These data provide an important policy insight: Even before formal modeling, it is clear that catastrophic reinsurance that covers only very high spending corridors cannot significantly reduce underlying claims costs borne by primary insurers and therefore will not significantly affect premiums charged to enrollees. Achieving a large difference in premiums requires a much lower threshold, or attachment point, for reinsurance.
The baseline data also confirmed the common knowledge that insured spending increases with age. For example, Washingtonians covered through small firms and aged 51 to 64 years
were estimated to average about $10,500 in health spending in 2007 (through insurance plus out-of-pocket). In contrast, those aged 0–18 averaged some $2,600 (data not presented). Health status also greatly affects health spend-ing, as less healthy people spend more.
Age and health status have independent effects: At any age, people rating themselves in fair or poor health spent more than those in good health, good more than very good, and very good more than excellent, in Washington and elsewhere (Exhibit 6).
Conversely, at any given level of health sta-tus, older cohorts of people spend more than younger ones. The combination of age and health leads to quite large divergences, even without taking into account exactly which health conditions are associated with lower health status. People under 18 in excellent health aver-aged annual insured spending of about $1,000, compared to about $10,000 for those in fair or poor health at upper ages. People in fair or
percentage of population
percentage of spending
100
90
80
70
60
50
40
30
20
10
0
Sh
are
of
Hea
lth
Exp
end
itu
res
and
of
Po
pu
lati
on
(%)
Maximum annual spending levels, in $10,000 increments
0-10 10-20 20-30 30-40 40-50 50-60 60-70 70-80 80-90 90-100 100+
45.5
12.0
7.3
13.8
6.0
0.7 2.3
45.5
2.6 2.90.6
6.4
Exhibit 4. Shares of Total Annual Insured Spending and of Population, by Expenditure Level(Wisconsin small group insured workers and dependents)
Source: Urban Institute estimates using Wisconsin-specific reinsurance model. Note: data are for 2007; spending categories show shares of total spending incurred by the people whose highest annual spending falls within that category of spending.

7
poor health also pay substantially more per year out-of-pocket than do those in better health.45
This wide variation in average spending levels has important implications. First, it illustrates one reason why health insurance is a risky busi-ness. An insurer needs to know what mix of risks can be expected to buy into each pool of risks the insurer creates in order to succeed in setting premiums that will cover incurred losses, and administrative expenses, and provide a return on capital. Insurers seek to make their risks predict-able through underwriting and pooling a large number of similar risks. Insurers, to some extent, build a higher “risk premium” into return on capital where risks are less predictable, and in theory reinsurance could reduce that risk.
Second, variation in expected spending across insured groups or individuals is the source of pressure for risk segmentation within markets where premium rate-making can take account of age and health status. That is, free markets tend to result in the separation of risk pools for relatively younger or healthier groups from risk
pools containing older and less healthy groups. Segmentation of the pools allows better insur-ance risks to obtain lower premiums. If state policy seeks broader pooling and less segmenta-tion, reinsurance may play a supportive role.
Finally, data like those in Exhibit 6 suggest that risk pools that contain more high-cost enrollees will benefit disproportionately from state-funded reinsurance that covers most of the spending in a high-cost corridor of annual claims expense. This expectation was tested in the modeling that followed the construction of the baseline dataset for each state.
Reinsurance Impacts Modeled for the Three StatesRhode Island. State policymakers were inter-ested in a different kind of reinsurance configu-ration for Rhode Island. They wanted to simu-late an intervention that aggregated the state’s small and non-group market experience and that shifted funding across enrollees and their insurers via reinsurance funded by a 5 percent assessment on these markets.
This assessment was estimated to generate approximately $24.4 million of revenue in 2007.46 These revenues were then used to simu-late two different reinsurance corridors, one higher than the other but each with the same 10 percent coinsurance rate. The rationale for this option was not to lower overall premiums by subsidy from state sources external to the insur-ance market, as under Healthy NY. Instead, it was to require cross-subsidy within a market to offset some of the market’s segmentation—the observed tendency of competing insurers to serve different numbers of people at high risk of high annual spending.
The model found that the hypothesized $24.4 mil-lion in funding would support only a very narrow reinsurance corridor if targeted at modestly high annual spending. The “affordable” corridor was estimated to be $5,000 to $6,427 for the aggregated small-group and non-group markets. The current non-group rating rules in Rhode Island divide that market into two pools of people based on health status. The reinsurance would result in net pre-mium increases for enrollees in good health (both
0-10 10-20 20-30 30-40 40-50 50-60 60-70 70-80 80-90 90-100 100+
64.7
Corridors of insured spending, in $10,000 increments
Sh
are
of
Tota
l In
sure
d H
ealt
h E
xpen
dit
ure
s (%
)
70
60
50
40
30
20
10
0
12.9
8.7
4.62.2 1.7 1.5 1.0 0.8 0.5 1.3
Exhibit 5. Shares of Insured Spending Falling within each Corridor of Annual Expenditure(Wisconsin small group insured workers and dependents, in 2007$)
Source: Urban Institute estimates using Wisconsin-specific reinsurance model. Note: data are for 2007; spending categories show shares of total spending that occur within each illustrated increment, or corridor, of spending.

8
small-group and non-group) and decreases for non-group enrollees in poor health. Alternatively, the same revenue could fund a somewhat broader corridor of higher per-person spending—some $20,000 to $28,076. The higher corridor would lead to different patterns of cross-subsidy: Both the healthy and the less-healthy non-group pools would subsidize small-group enrollees.
The reason for the different effects of the two rein-surance corridors is that expenditure distributions differ across these markets. Small-group enrollees have a higher proportion of their spending in high-er expenditure categories, and thus would receive a larger share of the dollars from a reinsurance policy with the higher reinsurance corridor. The bifurca-tion of the non-group market also affected the dis-tributional effects of the two different reinsurance configurations, as the two non-group pools had different expenditure distributions.
These results were unintended. Sharing reinsur-ance funding and payouts was not expected to disadvantage the non-group population. This surprising result illustrates the importance of
developing information about reforms before implementing them.
The impact of the simulated reforms on premiums was relatively small. In the reinsurance configura-tion with the lower corridor, we found that medical claims costs decreased by only 2.5 percent in the non-group pool of fair or poor health people, and decreased by 0.3 percent in the small-group mar-ket under the configuration with the higher cor-ridor. In each case, these decreases were offset by increases for the other groups.
The estimated changes from reinsurance were small largely because the simulated monetary shift of the reinsurance was small (the estimated $24.4 million). Putting more dollars into a reinsurance policy, especially from an external source, would further reduce premiums.
Washington. Modeling for the Reinsurance Institute simulated reinsurance for a range of spending corridors covering either all small-firm coverage, non-group coverage, or both. Twelve different configurations of reinsurance subsidy
were modeled, including narrow, broad, and cata-strophic forms of reinsurance.47 Formal simulation confirmed the baseline observation that having a relatively low attachment point for the reinsur-ance corridor—between $5,000 and $25,000—was necessary to achieve large reductions in health insurance premiums for the eligible population. For these low attachment points, however, estimated government costs were substantial.
Targeting the broadest population of eligibles (all small-firm and non-group coverage) and providing broad reinsurance that covers 90 per-cent of spending from $10,000–$90,000) could be expected to achieve the following:
• The number of uninsured Washingtonians would fall by about 15 percent.
• Small-firm premiums for single coverage would fall by 30.5 percent on average, 33.0 percent for family coverage; non-group premiums would fall by 38 percent for either coverage.
Reinsurance in State Health ReformA
vera
ge
Hea
lth
Exp
end
itu
res,
Per
Ind
ivid
ual
$16,000
$14,000
$12,000
$10,000
$8,000
$6,000
$4,000
$2,000
$0
out of pocket payments
insurance payments
Avg. Insurance Payment, All people: $2,663
HealthAge
% Pop.
EX
0-18
12.0%
VGD
0-18
6.1%
EX
19-34
13.3%
GD
19-34
5.6%
GD
0-18
3.5%
EX
35-49
7.6%
VGD
19-34
10.7%
VGD
35-49
9.9%
F/P
19-34
1.5%
EX
50-64
5.1%
GD
35-49
7.6%
F/P
0-18
0.4%
VGD
50-64
6.0%
GD
50-64
6.6%
F/P
35-49
2.2%
F/P
50-64
2.0%
Exhibit 6. Variation in Insured Annual Medical Spending per Person(by enrollee age and health status, small-firm workers and dependents, estimated for Washington state in 2007$)
Source: Urban Institute estimates using WA-specific reinsurance model. Note: Location of average insurance payment line is approximated. P = poor; F = fair; GD = good; VGD = very good; EX = excellent
9
• Increased employer offer in small firms would be the main driver of change, resulting in increased coverage among employees not previously offered coverage.
• Gains in coverage would be lower among lower income families; they are less able to afford even subsidized coverage.48
• Estimated annual reinsurance costs to the state would be more than $880 million, including some $530 million for small-firm coverage and $350 million for the non-group market.
Most of the new state spending would go to subsidize coverage of people who already have coverage, including some with non-group cov-erage who would switch to group. Among the reinsurance configurations simulated, those with wider corridors and lower carrier “retention” percentages (coinsurance obligations) had a greater impact on premiums. However, due to differences in the distribution of health expens-es by factors such as age and health status, there were differences in the change in premiums for singles and families in different markets, depending on the attachment point, the width of the reinsurance corridor, and enrollment within each pool. For example, in our simula-tions, those insured in the non-group market at baseline had a slightly larger share of their total insured dollars in the $10,000–$100,000 cor-ridor than those currently insured through small employers. Therefore, policies targeting this corridor tend to have a slightly larger percentage change in premiums for the non-group market relative to the small firm market.
A second set of reinsurance simulations targeted smaller populations—the conventional small-group and non-group markets. These simula-tions, done under state contract, thus excluded from reinsurance all coverage obtained from association health plans (AHPs) or the state’s high-risk pool (WSHIP).49 These simulations built upon the observations about differences between conventionally insured small-groups and AHPs or WSHIP. Conventional cover-ages contain more expensive enrollees than do AHPs, which may use medical underwriting, and WSHIP enrolls more higher spending peo-ple than do conventional non-group coverages.
The reconfigured simulations for non-group coverages were estimated to achieve nearly the same reduction in uninsurance as the paral-lel simulations for all of non-group. Expected state spending for reinsuring claims, however,
dropped substantially. The main reason for this is not the exclusion of the small WSHIP popu-lation but rather the exclusion of uninsured members of simulated AHP households from non-group reinsurance subsidy.50
By more tightly targeting the non-AHP small-group population, this new form of reinsurance was estimated to reduce uninsurance almost as much as the parallel prior reinsurance simulated for all small firms (including AHPs). Take-up was high because the premium drop was even higher than in the first simulations. Moreover, estimated government spending fell substantially. The reason for the savings was that the population eligible for subsidized coverage was only about half as large as under the prior simulations.
Comparing the new non-group versus small-group simulations, the former achieved greater impacts on premiums and on uninsurance, at lower expect-ed state spending—again, largely because the target population was smaller. Comparing the new versus the earlier simulations, the former achieved almost as much impact with fewer resources. The magni-tude of the difference was large enough to provide reasonable grounds for believing that the direction and nature of change between simulations are cor-rect. However, little is known about the differences between the populations in conventionally insured small groups and those in firms covered by AHPs, so the magnitudes of the simulated impacts should be seen as general estimates.51
Wisconsin. Modeling done for Wisconsin simulated reinsurance of all coverage bought by very small employers (2–9 employees) for work-ers and dependents. Three specifications costing $100 million each were modeled, at the request of policymakers. “Narrow” reinsurance was specified as coverage for a per-person annual corridor of $5,000–$17,500 with a 10 percent carrier retention. “Broad” reinsurance had a corridor of $15,000–$75,000, also with 10 per-cent retention. “Catastrophic” was defined as open-ended coverage—which started at $14,000 with coinsurance of 20 percent. Each of these configurations reflects the extent of reinsur-ance affordable within the $100 million budget, assuming no increases in insured spending as a result of reinsurance.
Each of the three configurations was estimated to increase coverage by almost 6,000 people. This figure is sizeable compared with the baseline of 49,000 uninsured small-firm work-ers and dependents. However, it is small (only about 1 percent) relative to the total number
of uninsured people in Wisconsin. The cost to the state would be very high per newly insured person, about $17,000, because a large majority of the total $100 million subsidy would flow to the 170,000 small-firm workers and dependents already insured.
Thus, at least within the very small-group market, reinsurance subsidy dollars targeted on any of the three different corridors would achieve roughly the same increase in coverage.52 However, the different corridors of reinsurance did have rather different distributional effects. For example, the “narrow” corridor decreased premiums about the same amount for both family and single coverage—by 19 and 20 per-cent, respectively. In contrast, the “broad” cor-ridor cut family premiums by 34 percent, and single premiums by only 7 percent.
The other type of catastrophic coverage of interest was protection against very high expenses that could bankrupt an individual or family. Such a program could not be formally modeled, as specifications were preliminary, key information was lacking, and full consideration would have gone beyond the scope of this proj-ect.53 Baseline descriptive data did suggest the order of magnitude of state spending needed: For all Wisconsin residents in 2007, an estimat-ed $492 million of insured medical expenditures were incurred above the threshold of $100,000 per person per year. This amount would surely be catastrophic for uninsured people, but not for well-insured people whose primary coverage has a maximum limit on out-of-pocket spend-ing. In any event, the dollars involved were much higher than the resources assumed to be available for small-firm reinsurance.
Modeling and Complementary Qualitative Inputs
Strengths and Limitations of ModelingModeling abstracts from reality, sufficiently sim-plifying complexities to clarify overall relationships and effects. Our reinsurance model provides reasonable estimates of the likely magnitudes of expected reinsurance costs and impacts across populations and subpopulations within each state. Substantial efforts were made to benchmark the models’ components to state characteristics, to prevailing premiums, and to documented employer and consumer responses to price change.
The model can assess the overall effect of reinsurance alternatives on premiums, cover-age, and costs; which firms offer coverage and

10
what people take up what coverage, when the benefits of reduced premiums are distributed in alternative ways; how the composition of insured risk pools change, with secondary impacts on premiums; and changes in the com-position of the uninsured population. While the model has data on out-of-pocket and insured costs to enrollees, we must simulate poten-tial health spending under insurance to those who are currently uninsured. Since our data include detailed health information from each individual, along with many other observable characteristics, we were able to predict insured health expenditures for the currently uninsured. A strength of the model already noted is that it contains good information on the uninsured and their circumstances—unlike insurance claims data, for example—which substantially increases the validity of estimates of expected reinsurance costs.
However, some uncertainty remains about the model’s findings on the magnitude of employ-ers’ and individuals’ behavioral effects from reinsurance. Moreover, the simulation results are not budgetary estimates, as actual program spending would also depend upon many design and implementation choices not yet specified. Thus, final planning for program implementa-tion calls for more detailed estimation as well as the ability to track early trends and make mid-course corrections.
The model simulates employers’ and individu-als’ behavior, not insurers’ behavior. In a sense, it estimates premiums for each market segment (here, non-group and small-group) as though there were competing insurers that act the same, and all coverage follows state rules. It is not possible to simulate every player in the insur-ance market that provides coverage to small firms or their employees. The model does not address issues of insurance market competitive-ness or estimate possible entry or exit from the markets. Similarly, it does not include variations in insurance benefits across carriers or market segments; in order to better estimate consumer response to premium change, it holds benefit design constant.
Finally, insurers’ different underwriting and pricing behaviors are not modeled, and results accordingly do not include how different insur-ers might respond differently to reinsurance in marketing and pricing. The model assumes that carriers pass through 100 percent of the reinsur-ance subsidy into lower premiums, and continue
to manage high-cost claims as before. Different assumptions could increase estimated govern-ment spending on reinsurance and/or reduce the impacts on coverage.
Model construction lacked information from which to simulate insurer underwriting; it assumed open enrollment into all available coverages (which is required by federal law for small-group coverage, but not for non-group insurance). Variations of premiums across sub-populations of people that arise from coverage through different insurers are not simulated, nor are differences across separate blocks of cover-age that an insurer may price separately based on factors other than underlying expenditures.54 In the case of Washington, there was no direct evidence on the difference in medical claims spending in two different market sectors for small-firm coverage that are regulated differ-ently. There, the simulations simply made rea-sonable assumptions based on qualitative input from key informants. The model for each state was constructed, however, to accurately reflect average premium for all small firms as well as the variation across firms observed among all small firms.
Qualitative InputsThe quantitative simulations leave a substantial role for qualitative analysis and program design to address uncertainties. Even in the course of this project, quantitative modeling needed to be informed by qualitative expertise and experience to understand the policy and market contexts within which reinsurance would apply. Such back-ground came from a literature review and discus-sions with project officials from the three states, as well as with other knowledgeable sources from government and insurers. These all contributed to the project’s ability to tailor the generic model to each state. For one state it was possible to make a site visit; for another, state staff came to Washington, D.C., for a consultation. Most information was obtained by telephone, Internet searches, and other off-site sources.
Qualitative inputs also added practical dimen-sions to the quantitative analyses. For example, insurance rating rules had to be specified and the face validity of modeled premiums checked in light of state-specific reports and interview information. At times, state policymakers also sought qualitative advice about policy. For example, the Reinsurance Institute staff was asked for input on a draft insurance report in Washington.55
Finally, qualitative assessment was needed to consider other goals sometimes cited for rein-surance, that is, to alter insurer and employer behavior so as to reduce risk selection and help stabilize markets for coverage over time. Quantitative modeling is not helpful here in part because the interventions and their goals are incompletely specified, in part because infor-mation is lacking about who is eligible for and who has certain types of coverage, and in part because insurer marketing and pricing strategies are not straightforward and easily modeled.
Qualitative Assessment of Unmodeled Changes in CostsThe reinsurance model estimated the effects on insurance premiums and coverage of reinsur-ance-reduced medical claims costs. The formal modeling did not take into account some new costs that will tend to reduce the effective size of the intended subsidy, nor some new sav-ings that might increase it. Our perspective is that the size of these additional factors is too uncertain to warrant formal modeling at this stage, and that the new costs and savings to some extent offset one another, so that it is not unreasonable to have omitted them. This section provides qualitative observations about these additional cost impacts of reinsurance.
Reduced Insurer Risk PremumsReinsurance should to some extent reduce the risk that insurers take in underwriting the target-ed population. It could thus lower insurers’ costs by the reduced extent of risk-based capital they need to hold or by the reduction in “risk premi-um” they need to charge in light of risk to their profit expectations or even their capital.56 The effect is similar to the interest savings achieved by borrowers with a higher bond rating.
Plausibly, the high loadings seen in premi-ums for small-group and non-group coverage reflects the higher risk premiums they contain; after all, risk is least predictable for these cover-ages. However, most of this higher administra-tive cost appears to consist of higher sales and commissions, bad debt and other factors.57 Similarly, some observers have suggested that the experience of Healthy NY shows that rein-surance achieves substantial savings by reducing carriers’ risk premiums. It is true that the initial premiums set by Healthy NY plans were lower than actuarially expected. Moreover, recent pre-miums have remained below prevailing prices in private, unsubsidized markets.
Reinsurance in State Health Reform

11
However, other explanations also apply. First, Healthy NY trims premiums relative to pri-vate coverage by reducing the benefit package. Second, Healthy NY could have attracted an unusually low-risk enrollee population. The latter hypothesis is that previously uninsured people in New York had disproportionately low risk of medical claims. Previously available cov-erages had to be priced under stringent require-ments of community rating, which reduced prices to high risks and increased them for low risks, thus encouraging higher risk people to enroll and discouraging lower risks. Higher risks who had previously bought coverage were ineli-gible for Healthy NY, but uninsured lower risks could enroll. There is evidence from current premiums and loss ratios that this hypothesis explains much of the premium differentials observed (see box).58
In sum, some level of risk premium savings probably can be achieved, but its size is not known with any certainty, and it is likely small.
Other Lower Costs in Targeted Insurance MarketCost savings of two types would also plausibly occur: First, reinsurance could reduce the need for medical underwriting in non-group or small-group markets because higher risks’ higher costs would be subsidized. Less underwriting would reduce insurers’ administrative costs, likely by a small amount, as other costs contribute more to insurance loading. Casual empiricism suggests that a middle range of reinsurance rather than catastrophic reinsurance would have greater impact on the incentives for medical underwrit-
ing. Actuaries generally believe that very high expenditures per year are mainly random, but that many chronic illnesses predictably generate above-average costs at lower levels.
Second, reinsurance subsidy could achieve savings if employers’ premiums were suf-ficiently lowered so that many fewer firms would shop for new coverage in a given year. Reduced marketplace “churning” would save on expenses for search, sales, and underwriting. Nationally, smaller firms are much more likely to change coverage from year-to-year than are large firms.59 Such savings would accrue both to insurers and to firms, in the form of lower search and transactions costs.
Higher Administrative CostsOne un-simulated new cost is administrative operating expenses. A new reinsurance program will require new activities both for the state and for primary carriers. Initially, there will be one-time, start-up costs. Once a program is under way, there will be operating and oversight expenses of several kinds.60
Public start-up costs can be substantial, although experience varies. Set-up activities include: creating a governance structure and mechanisms (e.g., board, plan of operations); contracting for administrative services and sys-tems; acquiring claims and accounting software; entering into contracts for professional services such as law and accounting; hiring or arranging for actuarial support; and establishing budgetary and financial systems, including holding of fis-cal reserves, and arranging for banking services
(e.g., negotiated line of credit). These will vary according to the design of a reinsurance pro-gram as well as by state and the extent of exist-ing capabilities within state agencies.
On an ongoing basis, primary insurers eligible to receive reinsurance will incur costs of claims documentation and submission, of cooperation with oversight and audit requirements, as well as for dispute resolution. State administrators will incur such costs as general administration, claims processing, monitoring of claims and insurers, retrospective auditing, and potentially collection of assessments. Using existing exper-tise within the administration or contracting out for specialized services could hold costs down, and the existence of substantial fixed costs likely creates economies of scale (that is, higher claims volume lowers the percentage load of administrative cost). Other influences on level of expense include: the complexity of reinsur-ance activities, the number of insurers in the program, audit frequency and scope, the extent of year-to-year changes in the program, and the requirements of a state’s administrative proce-dure act and budgeting processes.
Overall, administrative costs should not be large as a percentage of claims payouts. From other experience, we estimate that state administrative costs would amount to at most an additional 1 to 3 percent of claims costs, depending upon how active administrators are. Healthy NY may cost even less, although its costs appear to be spread across a number of administrative enti-ties.61 We have no basis for thinking that private costs would be any larger, but private costs will exist and will be higher for primary firms that do not already buy private reinsurance. They will be also be higher to the extent that the new state program varies from industry practice or imposes new verification or auditing require-ments because of the need for public account-ability. To the limited extent that private carriers might reduce or drop private reinsurance, the new administrative costs for public reinsurance would be offset by reduced expenses for private reinsurance.
Increased Medical Claims Costs under Reinsured Primary CoveragePeople’s behavior can be expected to change whenever they do not bear the full cost of their choices. One example is that previously uninsured people spend more on health care after they obtain insurance coverage because it costs less at the point of care.62 The reinsur-ance model therefore includes an “inducement”
Why Does Healthy NY Have Low Premiums?In 2005, premiums for Healthy NY were 45 to 51 percent lower than small group premiums in New York, and 69 to 71 percent lower than non-group HMO premiums in New York. Given these dramatically lower premiums, medical loss ratios (health claims divided by premiums) would be high if Healthy NY’s enrollees had similar levels of health risk as small-group and non-group enrollees. However, for Healthy NY plans between 2003 and 2005, unadjusted medical loss ratios (before reinsurance subsidy) ranged between 114 percent and 122 percent, and stop-loss adjusted medical loss ratios ranged between 89 percent and 92 percent (after subsidy). Further, fewer than 6 percent of Healthy NY enrollees reached the $5,000 reinsurance or stop-loss threshold in 2005. Together, these data suggest that Healthy NY enrollees have lower health risks, that is, they have lower levels of medical claims experience than do other small group and non-group enrollees. (All data come from the latest annual evaluation of the program.)

12
Reinsurance in State Health Reform
factor to account for this predictable shift. Insurance may increase individuals’ incentives to over-consume both cost-effective and unnec-essary health care. Additional spending under insurance is often termed “moral hazard,” but it is a normal response to incentives and may be desirable if the extra services consumed improve health.
A less desirable shift in incentives will occur to some extent after reinsurance: Primary carriers’ medical claims costs can be expected to increase in the reinsured corridor because carriers’ cost-containment efforts will be more helpful to the state than to the carriers. It is plausible that a lower corridor would have more effect on insurer behavior, as more claims would be cov-ered. The effect of reinsurance would extend even below the reinsured corridor, as primary insurers that better controlled costs, even below the threshold of reinsurance, would receive lower subsidy.
We lacked a basis for estimating the strength of insurers’ claims-handling responses to reinsur-ance and so did not estimate their size in the formal modeling. In our interviews, we did hear some complaints that Healthy NY-style reinsur-ance does not distinguish between high expen-ditures due to high health risks from those due to lax cost containment. Some political resis-tance to reinsurance can be expected as a result.
The prospect of reduced cost control is serious, and program countermeasures appear essential in a practical reinsurance program. Some coun-termeasures are built into the structure of rein-surance: Primary insurers’ coinsurance obliga-tions are a basic design feature that help main-tain some incentive to manage high-cost claims even in the reinsured corridor. The ceiling on reinsurance reimbursement provides additional incentive, as unmanaged cases that exceed the ceiling must be fully paid by the primary carrier. (This observation holds true only so long as the reinsurance ceiling is lower than the prevailing upper limits of the reinsured private market sector. If reinsurance goes to higher levels or is unlimited, private ceilings can be expected to rise, which will also somewhat expand heath spending.) To strengthen the incentive for pri-mary carriers to economize, it might be prefera-ble at any given level of state subsidy to increase the width of the corridor while also increasing the size of the carrier’s coinsurance requirement or retention.
Additional measures also seem desirable, includ-ing requirements of early reporting for impend-ing large claims and mandatory use of the same forms of disease management and high-cost case management an insurer uses in its fully private accounts. Private reinsurers have the advantage of raising premiums or dropping cov-erage if a primary insurer under-manages claims. An analogous mechanism can be imagined for a public subsidy program, but introducing uncertainty into insurers’ expectations of year-end reinsurance reimbursements would affect their willingness to reduce premiums up front. Less important, new controls would to some extent increase administrative complexity and expense. Further attention is needed to such cost controls during practical design of reinsur-ance programs.
The Impacts of Reinsurance in Policy PerspectiveMany different benefits have been cited for reinsurance programs.63 It is appropriate to clar-ify just what goals predominate in any state, so as to better assess how they may be addressed by reinsurance or other interventions. Two broad state policy goals can be distinguished. The first is to help residents obtain coverage by subsidizing its cost. This was the focus of the modeling done for this project. Second, some state policymakers are considering reinsurance as a way to improve the operation of insurance markets, especially to reduce risk segmentation, as an adjunct to regulatory approaches. This is a matter for qualitative consideration now that would benefit further work later.
Subsidy for Insurance ConsumersThe central issues for subsidy are how much benefit it achieves within its target population and at what cost. Healthy NY explicitly tar-geted only people without pre-existing cover-age. Accordingly, it has achieved high “target efficiency”64 in terms of the number of people newly insured for a limited amount of subsidy. Under the Reinsurance Institute, in contrast, there was strong state interest in doing more to help people who already had coverage, espe-cially from small employer groups. The Healthy Wisconsin Council, according to key infor-mants, explicitly rejected the Healthy NY model in favor of helping small firms that were strug-gling to help themselves by buying costly insur-ance. It can be seen as simply unfair to help the uninsured but not those who have previously scrimped to buy coverage and who are similar in income or work status.
Small firms are a familiar target for special gov-ernment help of many types. Moreover, small firms are what have been called the “bleeding edge” of health care problems65: They have always been less able than large firms to offer insurance, especially if they can pay only low wages, because they face high internal admin-istrative costs as well as high insurance premi-ums in light of such factors as high employee turnover and adverse selection.66 Firms with many low-wage workers are less able to pass costs back to workers through either lower wages or higher out-of-pocket costs. Subsidies to small firms in the amounts modeled for Washington or Wisconsin can be seen as offset-ting small-firms’ disadvantage relative to large firms in percentage of insurance loading costs. Policymakers there were most interested in options that lowered targeted insurance premi-ums by about one-third.
However, there is a cost to forgoing target effi-ciency in favor of broader equity or help to small employer populations. Funding a subsidy for a broader population obviously costs more than for a narrower one. For a broad configuration of reinsurance in Washington, the total estimated state cost was almost $900 million, or nearly $10,000 per newly insured person.67 In Wisconsin the cost was even higher per newly insured per-son, although total estimated state spending was held down by targeting only very small groups (those with between two and nine employees).
The reason for high spending under broad reinsurance is that so much of the subsidy goes to people already insured. Most of the latter are people with existing group coverage, who can be seen as solidifying their coverage by having it made more affordable. Some are people induced by reinsurance to “upgrade” from non-group to small-group coverage, which offers richer and newly affordable benefits. In the Washington simulation just noted, existing insureds receiving subsidy outnumbered newly insureds by 10-to-1. The subsidy for the already insured was thus almost $900 per person, enough to reduce pre-existing insurance premi-ums by about one-third.
Thus, broad reinsurance subsidy is not cost-effective relative to more targeted subsidies, if considered solely as a tool for increasing cover-age. Its value must lie in the benefits of helping small firms afford coverage, as just noted, or in the broader effects on insurance markets, as considered next.

13
Effects on the Insurance MarketBroader effects of reinsurance include the pros-pect of greater year-to-year stability in insurance premiums and reducing risk segmentation or offsetting its effects.
Market Stability. Small employers and non-group coverage lack the stable risk pools that characterize large employment groups. Risks are hard to predict because group size is small and insurers fear adverse selection. High-cost claims in any one year are said to cause sudden rate increases for small groups in the following year, and insurance enrollment patterns and prices can change quickly as employers seek better terms elsewhere.68 To the extent that reinsurance can avoid sudden price shifts, it would enhance the peace of mind of small-business owners, a notable although unmeasurable benefit.
Kansas and Wisconsin policymakers have argued that reinsurance would reduce year-to-year price shifts and increase market stability.69 This project was unable to produce any quan-titative estimates of how large such benefits might be or to consider whether low-corridor or catastrophic reinsurance would do more to enhance stability. Information was lacking on the extent and costs of churning after high-claims experience, on insurer pricing models, and on how much insurance-purchasing firms value price stability apart from price level.
Risk Segmentation. Outside of large employer group insurance pools, the incentives for risk segmentation are large, as noted above. Individuals and groups that expect below-average medical spending are highly motivated to seek lower cost plans, and an insurer is rewarded with their business if it pools them with only with other lower risk applicants.70 Pressures for insurance markets to segment themselves into different plans by level of risk are inevitable whenever there is such variation in costs across potential insureds together with private risk bearing.
Risk segmentation can make insurance unaf-fordable for older people and those with chronic illness or other risk factors, and increase medical underwriting costs even for those able to obtain coverage. One regulatory response in many states has been to limit underwriting or constrain variation in rates. However, even if insurance rules require issue of coverage to all comers and community rating of premiums is perfectly enforced, selection can occur as lower
risks chose to self-insure or go bare, or as firms or individuals choose to buy different plans as a result of differential attractiveness of dif-ferent benefit packages to people with different levels of risk.
Publicly funded reinsurance subsidizes a layer of high costs, thus acting to pool those costs to be funded by a source independent of the premi-um each enrollee has paid. Reinsurance thus has the potential to reduce pressures for selection or to offset its effects on premiums. In effect, reinsurance reduces the benefits of selection relative to the costs of achieving it. Reinsurance can thus serve as a kind of risk-adjustment mechanism, one that is based upon actually incurred medical costs rather than prediction of costs as for risk-adjusted premiums. This potential makes reinsurance of interest to state policymakers seeking to avoid the distributional and social impacts of selection.
Conceptually, the design and targeting of rein-surance will affect its ability to reduce pressures for risk segmentation. Conventional actuarial wisdom suggests that very high-end or cata-strophic reinsurance will not have much impact, as costs in that range occur almost randomly, with little predictability. Reinsurance of much lower corridors of annual spending plausibly will more greatly reduce expected costs for peo-ple with chronic illnesses or otherwise identifi-ably high risks. Thus, the lowered Healthy NY threshold of $5,000 seems likely to have greater impact on selection pressure than the higher original threshold of $30,000, or the even higher thresholds common in private reinsurance meant to protect an insurer’s solvency. Even so, some incentive for risk selection remains, as insurers must cover below-threshold spending plus the retention percentage of spending within the reinsured corridor. As an extreme example, New York requires both that insurers accept all applicants and that they charge the same com-munity rate to all. The reinsurance tends to off-set the costs of adhering to those rules.
Two of the Reinsurance Institute’s participat-ing states requested modeling of reinsurance designs that would be similarly supportive of other rules that seek to help higher risk people. Rhode Island wanted to model the use of insurer assessments to make insurers with lower expenditures in a reinsured corridor subsidize insurers with higher such spending. Among other configurations, Washington wanted to model reinsurance only for conventional small-group coverage, for which insurers may not use
medical underwriting and must use modified community rating for all enrollees. This sector competes with AHPs that may consider health status in deciding whether to offer coverage and how much premium to charge. Reinsurance appears better suited to complement other approaches than to serve as a stand-alone strat-egy. More information is needed about patterns of selection and analysis of policies designed to change them than was feasible under this project.71
Lessons from the Reinsurance Institute about Technical Assistance for StatesSome concluding observations can be made about Reinsurance Institute interactions with the three participating states. Benchmarking to state data was very important for the credibility of our modeling among knowledgeable people in each state. Washington was so concerned about in-state perceptions about the accuracy of baseline data that it was willing to pay for using state socio-demographic survey data in lieu of federal CPS information. Beyond that, for targeted simulations, it was essential to benchmark to state counts of target populations of particular interest, notably the conventional small-group market in Washington, and both the non-group and small-group markets in Rhode Island.72 Indeed, simply “knowing the territory” helped build credibility and institutional knowledge even when it did not offer direct inputs into modeling.
Early specifications of reinsurance parameters often needed reformulation over time, and states sometimes needed to refine their model-ing requests to focus on their highest priorities. Frequent give-and-take with participating state staff was very helpful throughout the project. It began with the useful interactions at the kick-off meeting that included all interested states.
State policymakers often thought about cover-age and its impacts in terms of very specific types of existing insurance. In contract, the generic Reinsurance Institute model was built to be very specific about population characteristics but general about insurance plans. The initial model had baseline data on non-group cover-age, for example, but had no basis for knowing which of that coverage came from special state programs like the Washington Basic Health Plan, state high-risk pools, or either of the two different pools of private non-group coverage offered in Rhode Island. Some analyses of inter-est therefore required substantial repartitioning

14
Reinsurance in State Health Reform
of the baseline data to simulate targeting of reinsurance of interest to states.
State officials liked quick-turnaround estimates. They also greatly appreciated the ability to perform their own rough estimates of likely reinsurance costs. To give them the flexibility to select corridors of their own choice, each state was provided with an interactive spreadsheet that allowed its users to calculate the amount of baseline-insured expenditures within different expenditure corridors for non-group coverage and groups of different sizes. This provided them with estimates of approximate dollar values of different reinsurance configurations, based on selected reinsurance corridor and coinsurance rate.
As intended, modeling can help avoid surprises during actual implementation, such as Healthy NY’s finding that little medical spending and hence little reinsurance subsidy occurred in the initially set high corridor for reinsurance. For example, Rhode Island modeling found that sharing reinsurance funding and payouts between non-group and small-group markets actually disadvantaged the non-group popula-tion. Washington modeling found that reinsur-ance provided more help to upper income peo-ple. Such potentially unintended or surprising results illustrate the importance of developing substantial information about reforms before implementing them.
Modeling’s demand for clear specifications of parameters appeared to encourage more careful thinking among involved state officials about the need to clarify policy goals and a logic model of how reinsurance might help achieve them. Interactions with state clients also tended to clarify that reinsurance is not one thing, but rather a family of interventions. For example, the retrospective Healthy NY-style reinsurance modeled here was quite different from the prospective reinsurance mechanism created by many small-group market reforms of the 1990s. Moreover, different designs or targeting of rein-surance subsidy can serve different policy goals.
Finally, reinsurance is better seen as a comple-ment to other reforms than as a stand-alone reform. Reinsurance Institute modeling had to take into account what other reform rules applied to the target populations and coverages. Indeed, state policymakers under this project frequently wanted to consider broader reform issues than reinsurance and many state reform
proposals reflect the broadening of the coverage expansion discussion.
About the AuthorsRandall R. Bovbjerg is a principal research associate in the Health Policy Center of the Urban Institute in Washington, D.C. and served as principal investigator (PI) of this reinsur-ance project. Health reform has long been one of his research interests, and he helped lead the District of Columbia’s State Planning Grant. Before coming to the Institute, he was a state insurance regulator. A. Bowen Garrett is a senior research associate in the Center and served as co-PI. Microsimulation modeling is one of his specialties, and he is also leading the Urban Institute’s broader effort to model health insurance reforms. Lisa Clemans-Cope is a research associate in the Center and also a specialist in health insurance and simulations. She helped generate Health Insurance Reform Simulation Model results for Massachusetts, for example, to help policymakers predict results prior to that state’s universal health reform. Paul Masi is a research assistant whose work in the Center primarily helps evaluate state coverage expansions. He provides quantitative support to senior researchers, working with numerous large databases.
Endnotes1 Vaughan, E. J. and T.M. Vaughan. Fundamentals
of Risk and Insurance, New York: John Wiley & Sons, January 1999; American Academy of Actuaries, “Medical Reinsurance: Considerations for Designing a Government-Sponsored Program,” Issue Brief, January 2005, http://www.actuary.org/pdf/health/reinsurance_jan05.pdf.
2 Bovbjerg, R. “Reform of Financing for Health Coverage: What Can Reinsurance Accomplish?” Inquiry 29(2):158-175, Summer 1992; Chollet, D. “The Role of Reinsurance in State Efforts to Expand Coverage,” Washington, DC: AcademyHealth, State Coverage Initiatives, Issue Brief, Vol. V, No. 4, October 2004, http://www.statecoverage.net/pdf/issuebrief1004.pdf. See also discussion below.
3 American Academy of Actuaries. “Medical Reinsurance: Considerations for Designing a Government-Sponsored Program,” Issue Brief, January 2005, http://www.actu-ary.org/pdf/health/reinsurance_jan05.pdf; Swartz, K. Reinsuring Health: Why More Middle-class People Are Uninsured and What Government Can Do, New York: Russell Sage Foundation Publications, 2006.
4 State Coverage Initiatives. State of the States 2007: Building Hope, Raising Expectations, Washington, DC: AcademyHealth, January 2007, http://statecoverage.net/pdf/StateofStates2007.pdf.
5 Holahan, J., and L. Blumberg. “Massachusetts Health Care Reform: A Look At The Issues,” Health Affairs 25, No. 6: w432-w443 (published online September 14, 2006; doi: 10.1377/hlthaff.25.w432).
6 State Coverage Initiatives. Profiles in Coverage: Healthy New York, January 2005, http://statecoverage.net/newyork-profile.htm. The Healthy NY Web page is www.ins.state.ny.us/website2/hny/english/hny.htm. For an overview of early experience, see Swartz, K. Reinsurance: How
States Can Make Health Coverage More Affordable for Employers and Workers, New York, NY: Commonwealth Fund, 2005, http://www.commonwealthfund.org/publi-cations/publications_show.htm?doc_id=286904.
7 Powell, Y.L., S. Van Tassell, and E. Juhl. Report on the Healthy NY Program 2007, prepared for the State of New York Insurance Department, Washington, DC: EP&P Consulting, Inc., January 2008, http://www.ins.state.ny.us/website2/hny/reports/hnyepp2007.pdf.
8 This report, like many others, uses “non-group” to describe insurance bought by individuals rather than employer groups. Such insurance is also called “individu-al” or “direct-pay” coverage. However, “individual” cov-erage also means coverage only of a single worker under employer-sponsored insurance, as opposed to “family” coverage. Non-group is used here to avoid that ambiguity.
9 Kansas Insurance Department. “Finding and Filling the Gaps: Developing a Strategic Plan to Cover All Kansans,” HRSA State Planning Grant Report to the Secretary, Grant Period October 1, 2000–September 29, 2001, http://www.statecoverage.net/statereports/ks.pdf. Reinsurance was only part of Kansas’s planning; other options being considered were expansion of public pro-grams (Medicaid, HealthWave); facility-based insurance; enhanced small employer tax credit program; expanding access to employer-sponsored health insurance through Medicaid and HealthWave; regulatory changes; and state employee health plan expansions.
10 State Coverage Initiatives (SCI), “Reinsurance Institute,” http://www.statecoverage.net/reinsuranceinstitute.htm.
11 See discussions in Bovbjerg, R. “Reinsurance,” 1992, op cit. and Vaughan and Vaughan, Fundamentals, 1999, op cit.
12 Chollet, “The Role of Reinsurance,” 2004, op cit.13 All HMOs in New York must participate in Healthy NY.
Among plans participating throughout 2006, 16 were HMOs and one was an EPO. Chu and Van Tassell, 2006 Report, op cit.
14 See, for example, the list of services offered by Summit Reinsurance Services, Inc., http://www.summit-re.com/managedcare.asp.
15 EP&P Consulting, Inc. Report on the Healthy NY Program 2004, Washington, DC: EP&P Consulting, December 31, 2004, http://www.ins.state.ny.us/website2/hny/reports/hnyepp2004.pdf.
16 Lutzky, A.W., and R. Bovbjerg. The Role of Reinsurance in Medicaid Managed Care, Princeton, NJ: Center for Health Care Strategies, Inc., Resource Paper under the Robert Wood Johnson Foundation’s Medicaid Managed Care Program, October 2003, http://www.chcs.org/usr_doc/reinsurance.pdf. Some states withhold a share of capita-tion and provide the reinsurance themselves; others require the plans to buy private reinsurance from the capi-tation received.
17 Adverse selection occurs when a given insurance policy attracts less healthy enrollees. The resulting higher claims experience raises premiums, which discourages even lower-risk enrolment forces yet higher premiums. In the extreme, selection effects can cause a “death spiral” that makes coverage unaffordable for most and drives carriers out of the affected line of business. Vaughn and Vaughn, Fundamentals, 1999, op cit. For an illustrative discus-sion in one policy context, see “Illustrating the Potential Impacts of Adverse Selection on Health Insurance Costs in Consumer Choice Models,” in series Snapshots: Health Care Costs, Washington, DC: Kaiser Family Foundation, November 2006, http://www.kff.org/insurance/snap-shot/index.cfm.
18 Healthcare Group (HCG) is the state’s framework for helping small businesses buy managed care on the afford-able model created by the Arizona’s Health Care Cost Containment System (AHCCCS), the state’s Medicaid program. HCG also begun in the mid-1980s, and its private plans are ones that also serve AHCCCS. In addition to offsetting adverse selection, the reinsurance subsidy protected the plans’ bottom lines by promising that medical costs would never exceed an agreed share of the private premiums, about 60 percent. This plan-level

15
protection provided during 1999-2004 was a form of “aggregate” reinsurance, which covers claims in excess of a share of premium each year, whereas Healthy NY features “specific” reinsurance that covers losses above a per-person annual threshold. Some private reinsurance arrangements feature both types of protection, under which the specific coverage bears a larger share of risk. Since 2004, HCG plans have been required to buy private reinsurance to protect their solvency, and the state puts a share of premium into a “stop loss” fund available as an aggregate backstop. See Office of the Auditor General. Arizona Health Care Cost Containment System—Healthcare Group Program, Special Audit, Performance Audit Division, Report No. 06–02, February 2006, http://www.ahcccs.state.az.us/Contracting/OpenRFPs/YH07-0023/Q&A_Attach3HCGAuditorsReport100506.pdf; State Coverage Initiatives. Profiles in Coverage: Healthcare Group of Arizona, Washington, DC: AcademyHealth, April 2007, http://statecoverage.net/arizonaprofile.pdf.
19 The Reinsurance Institute was “a new technical assistance offering” of 2006-2007 that brought “states together that are seriously considering the development and design of a state public reinsurance program [in part] to create a network of interested states that can exchange knowledge about this strategy,” http://www.statecoverage.net/rein-suranceinstitute.htm. The project was led by The Urban Institute in collaboration with Pool Administrators, Inc., and Actuarial Research Corporation, along with insurer and academic consultants.
20 The microsimulation model of reinsurance constructed for this project benefited from prior Urban Institute expe-rience with HIRSIM. See Blumberg, L.J., et al. The Health Insurance Reform Simulation Model (HIRSM), Urban Institute Research Report, July 31, 2003, http://www.urban.org/UploadedPDF/410867_HIRSM_Report.pdf. Qualitative capabilities came from prior Urban Institute work, for example, Bovbjerg, R. “Implementing Reinsurance: Health Insurance Reform in Missouri,” St. Louis: Missouri Foundation for Health, Cover Missouri Project Report 11, 2006, accessible at http://www.mffh.org/CoverMo11.pdf; as well as from the experience of subcontractors Actuarial Research Corporation and Pools Administrators, Inc., in public and private insurance and practical operation of state pools.
21 Garrett, A.B., et al. The Urban Institute’s MicroSimulation Model for Reinsurance: Model Construction and State-Specific Application, Companion Report to this document.
22 For much more detail on the model, see Garrett, A.B., et al. The Urban Institute’s MicroSimulation Model for Reinsurance: Model Construction and State-Specific Application, Urban Institute Report to the State Coverage Initiatives Program AcademyHealth, Washington, DC, April 2008. On Washington-specific baseline construction, see Clemans-Cope, L., et al. “Washington Specific Requests of Reinsurance Institute,” Memorandum to Jenny Hamilton (Office of Financial Management) and Pete Cutler (Office of the Insurance Commissioner), December 17, 2007, revised January 8, 2008.
23 The reported spending is made consistent with the two other sources: (1) the National Health Accounts maintained by federal actuaries (http://www.cms.hhs.gov/NationalHealthExpendData/), using methods similar to those of Sing, M., et al. “Reconciling Medical Expenditure Estimates from the MEPS and NHEA,” Health Care Financing Review 28(1): 25-40, Fall 2006; and (2) high-cost claims data maintained by actuaries. See Society of Actuaries, “Medical Large Claims Experience Study,” Web page with hyperlinked publications and data-bases at http://www.soa.org/research/health/research-medical-large-claims-experience-study.aspx.
24 The model reflects the 2006 findings of the WSPS from the Office of Financial Management; see http://www.ofm.wa.gov/sps/default.asp. WSPS staff provided survey output in the format appropriate to feed into construc-tion of the model’s baseline dataset. The model’s baseline microdata do not match the WSPS exactly because the simulation methodology requires benchmarking to many
other important distributions as well, such as the distribu-tion of employment by firm size.
25 Data on businesses come from the federal survey Statistics of United States Business (SUSB) for 2004, Accessible at http://www.census.gov/epcd/susb/introusb.htm.
26 Our approach counted claims-handling expenses as part of insurance loading; other approaches to loading may count them as part of benefits cost.
27 This federal survey is also part of MEPS, but the Insurance Component, or MEPS-IC, rather than the Household Component described above.
28 The Rhode Island Health Care Affordability Act of 2006, Ch. 258 enacted July 3, 2006. http://www.rilin.state.ri.us/PublicLaws/Law06/law06258.htm, accessed Feb 18, 2008. Many other relevant materials are posted at Office of the Health Insurance Commissioner of Rhode Island, “HEALHPact RI,” http://www.ohic.ri.gov/HealthPactPlans.php, accessed Feb 18 2008. The program was renamed HealthPact RI in May 2007.
29 See, for example, Department of Human Services State of Rhode Island, “Rhode Island Pilot Project Planning Grant: Interim Report to U.S. Department of Health and Human Services,” Health Resources and Services Administration, State Planning Grant No.1 P09 OA 01678-01-00, September 2006, http://www.statecover-age.net/hrsa/winter06/rhodeisland_annual.pdf; Plan Design Comparison: Medicaid, Commercial plan designs, December 4, 2006 [unpublished internal document]; Hinckley, Allen & Tringale, LP, and DeWeese Consulting, Inc. The Effectiveness of the Small Employer Health Insurance Availability Act in Promoting Rate Stability, Product Availability, and Coverage Affordability, Report to Health Insurance Commissioner, December 2006, http://www.dbr.state.ri.us/documents/divisions/health-insurance/070419%20small%20group%20Policy%20Report%20Final.pdf.
30 Details appear in Masi, P., et al. “Summary of Reinsurance Institute Work with Rhode Island and Final Modeling Results,” Memorandum to Office of the Health Insurance Commissioner, November 28, 2007.
31 See “Pooling Risk, Reducing Cost” Web page of Washington State Office of the Insurance Commissioner (OIC), updated March 2005, http://www.insurance.wa.gov/legislative/factsheets/pooling_risk.shtml, accessed January 8, 2008; Watts, C., et al. Pooling and Reinsurance in Washington State Health Insurance Markets: Review of the OIC Proposal, report of February 25, 2005, http://www.insurance.wa.gov/legislative/reports/CommonwealthPRCCreport.pdf.
32 Barclay, T.S. Milliman, letters of analysis to Washington State Health Care Authority on Healthy Washington pro-posal June 22 and August 2, 2006.
33 See Bovbjerg, R. “Public Reinsurance and Technical Assistance to Washington State from the SCI Reinsurance Institute,” draft of January 26, 2007, and Washington Office of Financial Management and Office of the Insurance Commissioner, “Reinsurance Institute: Washington State’s Participation,” February 2007 (a March 2007 revision was included as an appendix in Chollet, D. The Affordability of Coverage for High-Cost Individuals: Options for Washington State, April 30, 2007, www.insurance.wa.gov/publications/health/2118-Report_Reinsurance5.pdf.
34 Blue Ribbon Commission on Health Care Costs and Access, Final Report, January 2007. Available at http://www.governor.wa.gov/priorities/healthcare/BlueRibbon_FinalReport.pdf. This called for an assessment of replac-ing the state’s non-group high-risk pool with a form of reinsurance.
35 Chollet, D. 2007, above note 33. Reinsurance Institute staff Bovbjerg and Ideman reviewed a draft of this report and made suggestions for revision to OIC.
36 House Bill 1569 (reinsurance under new Health Insurance Partnership) and Senate Bill 5930 (study and recommen-dation called for), 60th Legislature, 2007 Regular Session.
37 Much of this policy history is accessible at Department of Health & Family Services, “Healthy Wisconsin,” http://www.dhfs.state.wi.us/HealthyWisconsin/ accessed February 18, 2008.
38 This amount was noted in Health Wisconsin Council Report: Reducing Wisconsin’s Uninsured Rate and Lowering Health Care Costs for Businesses and Families, January 9, 2007, at p. 6, accessible from DHFS Web page, op cit. Above note 37.
39 Office of the Governor Jim Doyle, “2006 State of the State Address: An Affordability Agenda for Middle-Class and Working Families,” January 17, 2006, http://www.wisgov.state.wi.us/journal_media_detail.asp?locid=19&prid=1648, accessed December 8, 2007.
40 For our estimations, small firms were those with 2 through 49 employees; data limitations made it infeasible to follow the insurance regulatory definition of 2-50 employees. Based upon the distribution of firms and employees by firm size, we estimate that only a few thou-sand people work in firms of exactly 50 employees and are therefore unrepresented in our data on small firms—a very small fraction of the total. No simple correction is possible, as characteristics of these people are unknown.
41 See Garrett, A.B., et al. above note 21.42 Estimates are for a standardized package of benefits,
which serves to make spending comparable across the pri-vately insured populations; these figures include enrollees’ out-of-pocket spending.
43 Berk, M.L., and A.C. Monheit. “The Concentration of Health Care Expenditures, Revisited,” Health Affairs 20(2):9-18, 2001. Blumberg, L., and J. Holahan. “Government as Reinsurer: Potential Impacts on Public and Private Spending,” Inquiry 41(2):130–43, Summer 2004.
44 Exhibit 5 shows a somewhat uneven pattern of decline in estimated shares of spending incurred within successively higher corridors of per-person annual spending. Larger samples result in smoother patterns of decline. It should also be noted that the exact shape of this distribution varies somewhat by segment of the insured population examined.
45 Their higher out of pocket spending might reflect that less healthy people can only afford less rich benefits or that insurance benefit design better matches consumption preferences of the majority of enrollees, who are healthier.
46 Findings were reported to the state in Masi, P., et al. Memo to Rhode Island, op cit. Above note 29.
47 This set of simulations was done under the SCI grant that supported the Reinsurance Institute project. Findings were reported to the state in Clemans-Cope, L., et al. Washington December Memo, op cit.
48 This finding of non-group variation in response by income is consistent with Henry J. Kaiser Family Foundation, “How Non-Group Health Coverage Varies With Income,” No. 7737, February 2008, http://www.kff.org/insurance/upload/7737.pdf.
49 This set of simulations was done under a Washington contract. Findings were reported to the state in Bovbjerg, R., et al. “Reinsurance in Washington State,” Report to the Washington Office of Financial Management and Office of the Insurance Commissioner, February 2008. That report’s executive summary closely resembles this section of this report.
50 The rationale is that it would be inconsistent with excluding AHPs from reinsurance subsidy to allow AHP households to selectively enroll some family members in reinsurance-subsidized non-group coverage.
51 For detail, see Bovbjerg, R., et al. Reinsurance in Washington, 2008. op. cit. Above note 49.
52 Findings were reported to the state in Garrett, A.B., et al. “Summary of Reinsurance Institute Work with Wisconsin and Final Modeling Results,” Memorandum to Department of Health and Family Services, December 26, 2007.

16
Reinsurance in State Health Reform
53 For example, it had not yet been made clear whether all ages were meant to be included, nor whether bankruptcy protection meant something different for insured and uninsured people or for people of different levels of income and assets. Data were also lacking on assets and other factors that influence bankruptcy.
54 We also appreciate that not all coverage provided to small firms is always subject to small group rating rules; this was most clearly the case in Washington. Association and franchise coverages may be exceptions, and rules may have differing effects where applied separately within each book of business maintained by an insurer. Again, overall our pricing matches what is reported by buyers within each state, just not within every insurance category that may exist in a state.
55 Bovbjerg, R. and K. Ideman. Memorandum on Draft Report, to Office of the Insurance Commissioner, Washington State, April 13, 2007.
56 These issues were discussed in a cyber seminar with state officials hosted by State Coverage Initiatives, “Risk Premium in Private Insurance Rates,” http://statecover-age.net/cyberseminar1206.htm. Primary insurers, especial-ly smaller firms, are risk averse, which is shown when they voluntarily buy private reinsurance, paying substantially more than the cost of high-end claims that they transfer to the reinsurer—to cover the reinsurer’s administrative loading and profit margin.
Public reinsurance might also achieve a savings for pri-
mary insurers if it makes private reinsurance unnecessary. To do so, however, the public reinsurance would have to have two features not present in Healthy NY or any of the plans modeled for this project’s participating states: (a) very high ceilings of reinsured medical claims, possibly to the policy limits of coverage and (b) protection against high aggregate losses from an accumulation of high-per-person spending.
57 Evidence appears to be limited. See estimates made by Hay/Huggins (now Hay Group) for House Committee on Education & Labor. “Costs and Effects of Extending Insurance Coverage,” Committee Print 100-EE, Library of Congress, Congressional Research Service, October 1988, discussed in Williams, C. and J. Lee. “Are Health Insurance Premiums Higher for Small Firms?” Robert Wood Johnson Foundation, Policy Brief No. 2, September 2002, http://www.rwjf.org/pr/synthesis/reports_and_briefs/pdf/no2_policybrief.pdf.
58 The initial premium estimate was made by Actuarial Research Corporation and assumed a standard-risk enrollee population for Healthy NY (ARC, personal communication); data in the box come from Chu, R. and S. Van Tassell. Report on the Healthy NY Program 2006, prepared for the State of New York Insurance Department. Washington, DC: EP&P Consulting, Inc., January 2007, http://www.ins.state.ny.us/website2/hny/reports/hnyepp2006.pdf.
59 Long. S.H. and M.S. Marquis. “Trends in Offering Employer-Sponsored Coverage,” Data Bulletin No. 15, Center for Studying Health System Change, Fall 1998, http://www.hschange.com/CONTENT/47/.
60 This section draws upon prior writing, e.g., Bovbjerg, R. “Reinsurance ... in Missouri,” 2006. op cit. Above note 22, as well as the experience of Pool Administrators, Inc., in operating reinsurance pools for states under prior small group market reforms.
61 Swolak, P. “Healthy NY: How Does the Program Work and Why Does It Work?” Presentation to SCI meeting, September 12, 2006, http://www.statecoverage.net/kick-offmeeting.htm.
62 In insurance and finance this phenomenon is called “moral hazard.” Only in extreme cases, however, is such behavior immoral, as where fraudulent claims are submit-ted to obtain higher reimbursement. Typically, spending more where spending is subsidized is merely a normal and predictable response to a fiscal incentive. One goal of pri-mary insurance is to enable insured people to spend more on health services; that is one reason that insured people have better health and live longer than the uninsured. Reinsurance, however, is not meant to increase spending by primary insurers.
63 See, for example, Washington Office of the Insurance Commissioner. “Pooling Risk, Reducing Cost,” 2005, http://www.insurance.wa.gov/legislative/factsheets/pooling_risk.shtml; Swartz, K. Reinsuring Health: Why More Middle-Class People Are Uninsured and What Government Can Do. New York: Russell Sage Foundation Publications, 2006; Chollet, D. “The Role of Reinsurance in State Efforts to Expand Coverage,” State Coverage Initiatives, Issue Brief, AcademyHealth 5.4, 2004, www.statecoverage.net/pdf/issuebrief1004.pdf.
64 Garfinkel, I. and R. Haveman. “Earnings Capacity and the Target Efficiency of Alternative Transfer Programs,” American Economic Review, 64(2):196-204, 1974, http://www.jstor.org/view/00028282/di950137/95p0075z/0. Blumberg, L.J. “Balancing Efficiency and Equity in the Design of Coverage Expansions for Children,” The Future of Children, 13(1):205-211, http://www.future-ofchildren.org/usr_doc/tfoc13-1n.pdf.
65 Office of the Health Insurance Commissioner, State of Rhode Island. “Small Business Health Insurance & Prospects for Reform,” Presentation to Joint Health Care Oversight Committee, February 27, 2006, http://www.dbr.ri.gov/documents/divisions/healthinsur-ance/HI-legupdateFe06_27_final_060228.ppt, accessed February 8, 2008; see also U.S. General Accounting Office [now Government Accountability Office], “Private Health Insurance: Small Employers Continue to Face Challenges in Providing Coverage,” Washington, DC: GAO, GAO-02-8, October 2001.
66 Actuarial Research Corporation. “Study of the Administrative Costs and Actuarial Values of Small Health Plans,” report to the SBA Office of Advocacy, January 2003, http://www.sba.gov/advo/research/rs224tot.pdf, accessed February 8, 2008.
67 The configuration was 90 percent reinsurance reimburse-ment of per-person annual insured costs of $10,000 to $90,000 for all small-firm and non-group coverages. See Bovbjerg, R., et al. Reinsurance in Washington, 2008. op. cit. Above note 49, exhibits 11 and 16.
68 Freudenheim, M. “Small Businesses’ Premiums Soar After Illness,” New York Times, May 5, 2007, http://www.nytimes.com/2007/05/05/business/05insure.html.
69 Freudenheim, M. “Small Businesses’ Premiums Soar After Illness,” New York Times, May 5, 2007; “Healthy Wisconsin” final report at p. 12, see note 38 above.
70 Zellers, W.K., C.G. McLaughlin, and K.D. Frick. “Small-Business Health Insurance: Only The Healthy Need Apply,” Health Affairs, 11(1):174-80, 1992; Merlis, M. Fundamentals of Underwriting in the Non-group Health Insurance Market: Access to Coverage and Options for Reform, Washington DC: National Health Policy Forum, NHPF Background Paper, April 13, 2005, http://nhpf.ags.com/pdfs_bp/BP_Underwriting_04-13-05.pdf.
71 Risk segmentation is a very broad topic, and retrospective reinsurance like Healthy NY is only one alternative for addressing it. As noted in Bovbjerg, R. et al. Reinsurance in Washington, 2008. op. cit. [above note 49], more extensive analysis of selection needs to investigate other mechanisms with similar goals: more regulatory support for forms of open enrollment and modified community rating, risk-adjustment of subsidies for primary premiums, ceding of identified high risk people or groups in advance (prospective reinsurance), and withholds from premiums as paid to be distributed at the end of the year according to the risks actually enrolled by competing plans. All of these mechanisms call for substantial managerial informa-tion and control over funding flows and may or may not be feasible outside of a large employment group or absent full systems reform for all of health coverage. Chollet, D. 2007, op. cit. [above note 33], also noted many of these interventions related to risk segmentation and differential premiums, also without drawing firm conclusions.
72 Washington had enrollment counts from regular state reporting. Rhode Island had more detail because it had just done a market conduct examination. See Hinckley, Allen & Tringale and DeWeese Consulting, The Effectiveness of the Small Employer Health Insurance Availability Act in Promoting Rate Stability, Product Availability, and Coverage Affordability, report to the Health Insurance Commissioner and associated insurer reports, December 2006, www.dbr.state.ri.us/documents/divisions/health-insurance/070419%20small%20group%20Policy%20Report%20Final.pdf, accessed November 28, 2007.

17


![WELCOME [] Solutions Group Investment Office Property & Casualty reinsurance Life & Health reinsurance Asset management Specialty Lines Global Product Lines Investment Partners SCOR](https://img.pdfslide.net/doc/110x75/5b0c81a37f8b9a02508c4476/welcome-solutions-group-investment-office-property-casualty-reinsurance-life.jpg)