Embed Size (px)
Citation preview
Relation between subduction megathrust earthquakes, trenchsediment thickness and upper plate strain
A. Heuret,1,2 C. P. Conrad,3 F. Funiciello,1 S. Lallemand,2 and L. Sandri4
Received 21 December 2011; revised 3 February 2012; accepted 7 February 2012; published 3 March 2012.
[1] Giant earthquake (moment magnitude Mw ≥ 8.5)forecasts for subduction zones have been empirically relatedto both tectonic stresses and geometrical irregularities alongthe subduction interface. Both of these controls have beensuggested as able to tune the ability of rupture to propagatelaterally and, in turn, exert an important control on giantearthquake generation. Here we test these hypotheses, andtheir combined influence, by compiling a dataset of trenchfill thickness (a proxy for smoothing of subducting platerelief by sediment input into the subduction channel) andupper plate strain (a proxy for the tectonic stresses appliedto the subduction interface) for 44 segments of the globalsubduction network. We statistically compare relationshipsbetween upper plate strain, trench sediment thicknessand maximal earthquake magnitude. We find that thecombination of both large trench fill (≥1 km) and neutralupper plate strain explains spatial patterns of giantearthquake occurrence to a statistically significant degree. Infact, the concert of these two factors is more highlycorrelated with giant earthquake occurrence than either factoron its own. Less frequent giant earthquakes of lowermagnitude are also possible at subduction zones with thinnertrench fill and compressive upper plate strain. Extensionalupper plate strain and trench fill < 0.5 km appear to beunfavorable conditions, as giant earthquakes have not beenobserved in these geodynamical environments during the last111 years. Citation: Heuret, A., C. P. Conrad, F. Funiciello, S.Lallemand, and L. Sandri (2012), Relation between subductionmega-thrust earthquakes, trench sediment thickness and upper plate strain,Geophys. Res. Lett., 39, L05304, doi:10.1029/2011GL050712.
1. Introduction
[2] Giant earthquakes (GEQ; moment magnitude Mw ≥8.5) usually occur on plate-bounding faults between thesubducting and overriding plates of converging margins.Despite an obvious relevance to seismic hazard, it remainsunclear which, if not all, of Earth’s subduction zones canproduce such devastating events [e.g., Ruff and Kanamori,1980; Jarrard, 1986; Ruff, 1989; Pacheco et al., 1993;Conrad et al., 2004; McCaffrey, 2008; Heuret et al., 2011;Normile, 2011]. Recent analysis of the Gutenberg-Richterlaw applied to worldwide subduction thrust faults, however,
shows that energy release by interplate seismicity differsamong convergent margins, and some appear more prone toGEQ production than others [Marzocchi et al., 2011]. Oneof the most striking and consistent characteristics of GEQs,when compared to smaller interplate events, is the largetrench-parallel length over which they rupture (250 km to>1000 km [e.g., Kostoglodov, 1988; McCaffrey, 2008]).Enhancing a rupture’s ability to propagate in the trench-parallel direction, breaking an increasingly larger number ofthrust fault “segments”, thus amplifies the magnitude of aseismic event. This process was recently illustrated by theTohoku earthquake [e.g., Meng et al., 2011].[3] The spacing and nature of geometrical irregularities
along the interplate contact, controlled primarily by subduct-ing sediments and subducting plate relief, seems to regulatethe ability of the rupture to propagate laterally. Severalauthors have indeed demonstrated that subducting seamountsor ridges may either act as seismic asperities triggeringearthquakes (e.g., off Costa-Rica [Bilek et al., 2003]) or asseismic barriers (e.g., along the Nankai margin [Kodaira,2000; Wang and Bilek, 2011]). Spring-block, gelatin-sandpaper analogue models of subduction thrust faults have con-firmed the important role of interface geometrical irregulari-ties for controlling both static and non-static friction, the lattershowing negative values (i.e., seismic behavior) only forspecific roughness amplitudes and spacings [Corbi et al.,2011]. On a subducting plate interface, relief may be dimin-ished where abundant sediments are subducting. If lower platerelief is smaller than subduction channel thickness, trenchsediment may form a homogenous layer between the upperand lower plates that smoothes subducted seafloor andstrength-coupling asperities. As first proposed by Ruff [1989],such a homogeneous interface favors long trench-parallelpropagation of the rupture and large earthquakes magnitudes.[4] Because subduction channel sediments are difficult to
observe seismically, their influence on GEQs must be testedindirectly by assuming that trench sediments are representa-tive of those in the subduction channel at seismogenic depths(Figure 1a). This basic assumption, however, must still besubstantiated in the light of the various tectonic processes thatthe sediment layer encounters during its travel at depth. In fact,trench fill thickness may differ substantially from valuespresent in the seismogenic zone, either because trench fill mayaccrete frontally into the wedge (e.g., the southern RyukyuIslands [Schnürle et al., 1998]) or because thin trench sedi-ments may be associated with a thick subduction channelwhen tectonic erosion occurs [von Huene and Lallemand,1990; Lallemand et al., 1994]. In the latter case, the addi-tional material eroded from the upper plate into the subductionchannel may be 5 to 10 times larger than the input sediments[e.g., Lallemand, 1995; Clift and Vannucchi, 2004], i.e., thethinnest trench sediments may be associated with the thickest
1Dipartimento Scienze Geologiche, Università “Roma TRE,” Rome,Italy.
2Géosciences Montpellier, CNRS, Université Montpellier 2,Montpellier, France.
3Department of Geology and Geophysics, University of Hawaii atManoa, Honolulu, Hawaii, USA.
4Istituto Nazionale di Geofisica e Vulcanologia, Bologna, Italy.
Copyright 2012 by the American Geophysical Union.0094-8276/12/2011GL050712
GEOPHYSICAL RESEARCH LETTERS, VOL. 39, L05304, doi:10.1029/2011GL050712, 2012
L05304 1 of 6
subduction channels. Furthermore, subduction history mayintroduce additional bias. For instance, the Southern Chilemargin was erosional until glaciation introduced largevolumes of new trench sediments 3 Ma ago [Lamb and Davis,2003]. Given convergence rates, sediments at seismogeniczone depths may thus be thinner than indicated by currentlarge trench fill. Under such conditions, it is not surprising thatthe few high-resolution images of subduction interfaces at the�10 km upper limit of seismogenic zone depths (e.g., offJapan [von Huene et al., 1994], Colombia-Ecuador [Agudeloet al., 2009] or Andaman-Sumatra [Singh et al., 2008]) haveimaged subduction channels with large thickness variabilities.Despite these potential biases, Scholl et al. [2011] demon-strated that trench sectors with axial deposits thicker than1.0 km are associated with the occurrence of an unusually highnumber of GEQ (52% ofMw > 8.0, 57% ofMw > 8.3, and 67%ofMw > 8.5), suggesting that trench sediments provide usefulinformation about subduction channel smoothing. Alternativeinterpretations for sediment influence on GEQ genesis (e.g.,the role of fluids, the nature of subducted material, the role ofmetamorphism) cannot be ruled out.[5] Tectonic stresses applied on the subduction interface,
which may be inferred from deformation in the back-arc[Lallemand et al., 2008], may also affect the earthquakemagnitude potential. Uyeda and Kanamori [1979] suggestedthat compressive back-arcs promote larger earthquake mag-nitudes because they are associated with greater couplingacross the subduction interface, and in particular strongerstress accumulations along larger asperities [Ruff andKanamori, 1980]. However, Heuret et al. [2011] show thatinstrumentally-recorded GEQs are instead most often
associated with neutral back-arcs, only secondarily with upperplate compression, and never with extensional domains. Therelative lack of GEQs in compressive zones may be attributedto the large critical stresses needed to rupture individualasperities under strong compression. Thus, even if rupture ofan initial asperity releases relatively large seismic moment, thepropagation of this rupture to neighboring asperities may behindered by compressive tectonics, thus diminishing the pos-sibility for GEQ generation [Heuret et al., 2011]. The oppositescenario occurs with extensional UPS, where asperities areexpected to be smaller and can be ruptured by lower criticalstresses. However, the smaller seismic moment released byinitial rupture may limit the possibility for propagating ruptureof multiple asperities in a single mega-event. Thus, the statis-tical association of GEQs with neutral subduction zones mayresult from a favorable interplay between a large initial seismicmoment release at individual asperities and a low critical stressrequired for lateral rupture propagation [Corbi et al., 2011].[6] Thus, it is not clear whether subduction channel sedi-
ments or tectonic stresses on the plate interface regulateearthquake potential size (Figure 1a). In the present study, weexplore the plate interface conditions for GEQ genesis bystatistically analyzing, for worldwide subduction zones, therelations between upper plate strain (UPS), sediment thick-ness at the trench (Tsed), and the maximum yet-observedearthquake magnitude (Mmax).
2. Dataset
[7] We have described Mmax, Tsed and UPS for a set of44 trench sections identified as exhibiting homogeneous
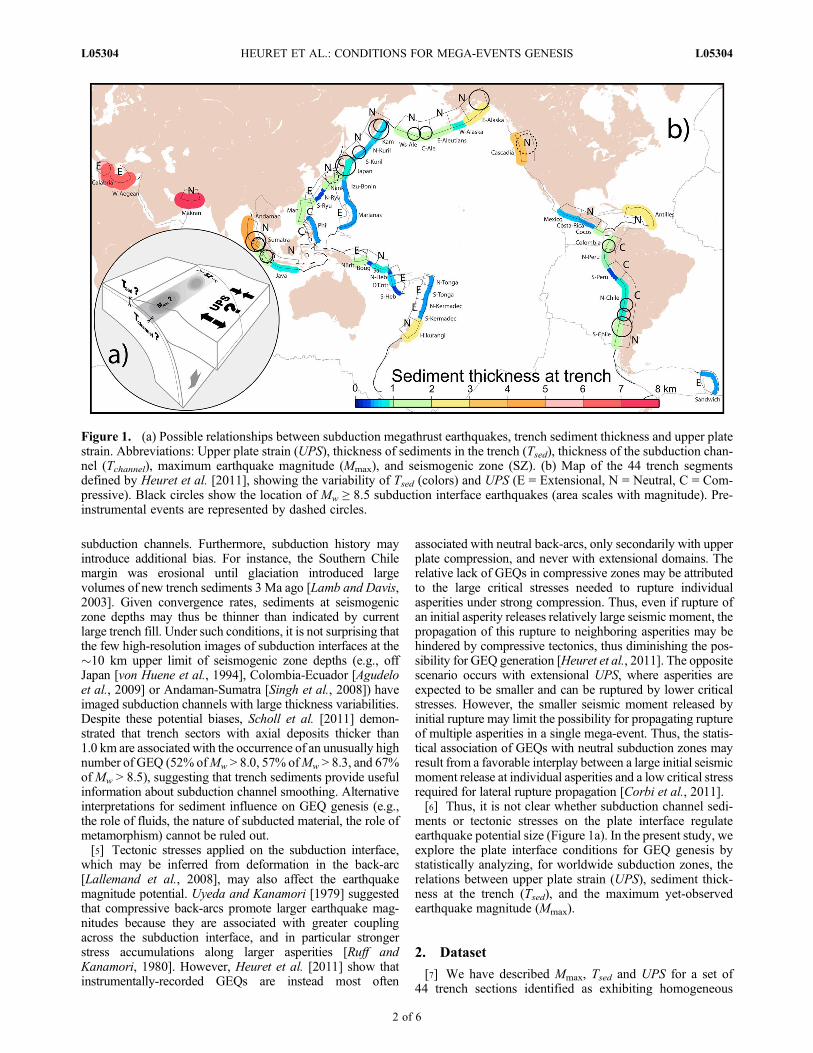
Figure 1. (a) Possible relationships between subduction megathrust earthquakes, trench sediment thickness and upper platestrain. Abbreviations: Upper plate strain (UPS), thickness of sediments in the trench (Tsed), thickness of the subduction chan-nel (Tchannel), maximum earthquake magnitude (Mmax), and seismogenic zone (SZ). (b) Map of the 44 trench segmentsdefined by Heuret et al. [2011], showing the variability of Tsed (colors) and UPS (E = Extensional, N = Neutral, C = Com-pressive). Black circles show the location of Mw ≥ 8.5 subduction interface earthquakes (area scales with magnitude). Pre-instrumental events are represented by dashed circles.
HEURET ET AL.: CONDITIONS FOR MEGA-EVENTS GENESIS L05304L05304
2 of 6
along-strike megathrust seismogenic zone behavior byHeuret et al. [2011] (Figure 1b). Narrow subduction zones(e.g., Yap, Palau, Puysegur), trench sections with too lowseismic activity (e.g., Patagonia, Venezuela, Panama, Muer-tos) and those without available Tsed data (e.g., Wetar, Flores)were removed from the original set of 62 trench sections. The44 selected trench sections were systematically sampledevery 1� of trench, resulting in a total of 399 sampled points.[8] Subduction parameter datasets have been previously
published for Mmax and UPS data. We improved the 1900–2007 Mmax dataset of Heuret et al. [2011] by extending thetime period analysis to 2011 and by considering pre-instru-mental events from the Nankai, Cascadia, Sumatra [Satakeand Atwater, 2007], and Antilles [USGS Historic WorldEarthquakes list] trench sections. For UPS, we have used asimplified version of the classification described by Heuretand Lallemand [2005], based on earthquake focal mechan-isms occurring less than 40 km beneath the surface of theupper plate, far from the subduction interface: extensional(E; extension, primarily characterized by the occurrence ofactive back-arc spreading or rifting), compressive (C;compression, primarily characterized by significant short-ening on lithospheric back-arc thrusts) and neutral (N;strike-slip, no significant deformation, low extension orcompression).[9] To estimate trench sediment thicknesses, we devel-
oped an original dataset by compiling 160 independent local
reflection seismic lines (Table S1 in the auxiliary material),which comprise �40% of the total length of subductionzones (Figure S1 in the auxiliary material).1 This dataset notonly provides Tsed, the mean trench sediment thickness foreach of the 44 trench sections, but also some constraints onthe lateral variability observed along each trench section(Table S2 in the auxiliary material). This database, as well asassociated references and discussions, are detailed in theauxiliary material.
3. Analysis and Results
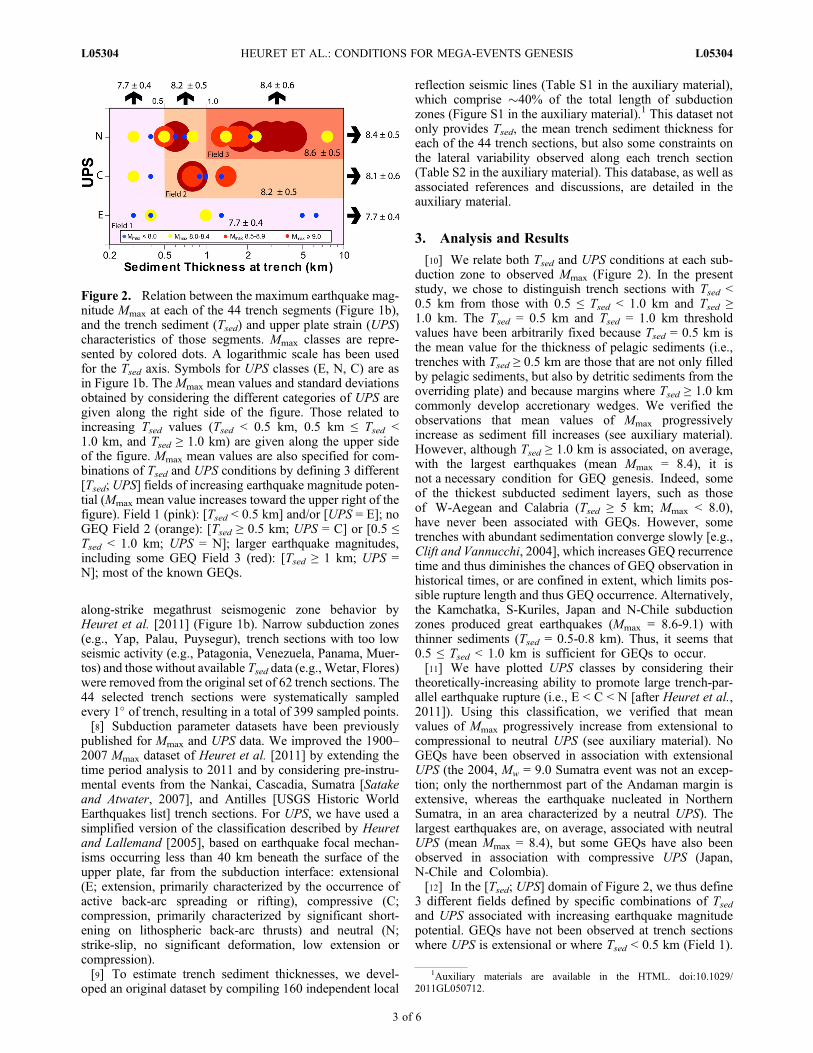
[10] We relate both Tsed and UPS conditions at each sub-duction zone to observed Mmax (Figure 2). In the presentstudy, we chose to distinguish trench sections with Tsed <0.5 km from those with 0.5 ≤ Tsed < 1.0 km and Tsed ≥1.0 km. The Tsed = 0.5 km and Tsed = 1.0 km thresholdvalues have been arbitrarily fixed because Tsed = 0.5 km isthe mean value for the thickness of pelagic sediments (i.e.,trenches with Tsed ≥ 0.5 km are those that are not only filledby pelagic sediments, but also by detritic sediments from theoverriding plate) and because margins where Tsed ≥ 1.0 kmcommonly develop accretionary wedges. We verified theobservations that mean values of Mmax progressivelyincrease as sediment fill increases (see auxiliary material).However, although Tsed ≥ 1.0 km is associated, on average,with the largest earthquakes (mean Mmax = 8.4), it isnot a necessary condition for GEQ genesis. Indeed, someof the thickest subducted sediment layers, such as thoseof W-Aegean and Calabria (Tsed ≥ 5 km; Mmax < 8.0),have never been associated with GEQs. However, sometrenches with abundant sedimentation converge slowly [e.g.,Clift and Vannucchi, 2004], which increases GEQ recurrencetime and thus diminishes the chances of GEQ observation inhistorical times, or are confined in extent, which limits pos-sible rupture length and thus GEQ occurrence. Alternatively,the Kamchatka, S-Kuriles, Japan and N-Chile subductionzones produced great earthquakes (Mmax = 8.6-9.1) withthinner sediments (Tsed = 0.5-0.8 km). Thus, it seems that0.5 ≤ Tsed < 1.0 km is sufficient for GEQs to occur.[11] We have plotted UPS classes by considering their
theoretically-increasing ability to promote large trench-par-allel earthquake rupture (i.e., E < C < N [after Heuret et al.,2011]). Using this classification, we verified that meanvalues of Mmax progressively increase from extensional tocompressional to neutral UPS (see auxiliary material). NoGEQs have been observed in association with extensionalUPS (the 2004, Mw = 9.0 Sumatra event was not an excep-tion; only the northernmost part of the Andaman margin isextensive, whereas the earthquake nucleated in NorthernSumatra, in an area characterized by a neutral UPS). Thelargest earthquakes are, on average, associated with neutralUPS (mean Mmax = 8.4), but some GEQs have also beenobserved in association with compressive UPS (Japan,N-Chile and Colombia).[12] In the [Tsed; UPS] domain of Figure 2, we thus define
3 different fields defined by specific combinations of Tsedand UPS associated with increasing earthquake magnitudepotential. GEQs have not been observed at trench sectionswhere UPS is extensional or where Tsed < 0.5 km (Field 1).
1Auxiliary materials are available in the HTML. doi:10.1029/2011GL050712.
Figure 2. Relation between the maximum earthquake mag-nitude Mmax at each of the 44 trench segments (Figure 1b),and the trench sediment (Tsed) and upper plate strain (UPS)characteristics of those segments. Mmax classes are repre-sented by colored dots. A logarithmic scale has been usedfor the Tsed axis. Symbols for UPS classes (E, N, C) are asin Figure 1b. TheMmax mean values and standard deviationsobtained by considering the different categories of UPS aregiven along the right side of the figure. Those related toincreasing Tsed values (Tsed < 0.5 km, 0.5 km ≤ Tsed <1.0 km, and Tsed ≥ 1.0 km) are given along the upper sideof the figure. Mmax mean values are also specified for com-binations of Tsed and UPS conditions by defining 3 different[Tsed; UPS] fields of increasing earthquake magnitude poten-tial (Mmax mean value increases toward the upper right of thefigure). Field 1 (pink): [Tsed < 0.5 km] and/or [UPS = E]; noGEQ Field 2 (orange): [Tsed ≥ 0.5 km; UPS = C] or [0.5 ≤Tsed < 1.0 km; UPS = N]; larger earthquake magnitudes,including some GEQ Field 3 (red): [Tsed ≥ 1 km; UPS =N]; most of the known GEQs.
HEURET ET AL.: CONDITIONS FOR MEGA-EVENTS GENESIS L05304L05304
3 of 6
These subduction zones produce the lowest Mmax meanvalues. Conversely, the conditions that are most associatedwith the largest GEQs are neutral back-arcs and Tsed ≥1.0 km (Field 3). In between, i.e., trench sections wherecompressive UPS is associated with Tsed ≥ 0.5 km, orwhere a neutral UPS is associated with 0.5 ≤ Tsed < 1.0 km(Field 2), GEQs are possible, although with smaller meanMmax than in Field 3.[13] To quantify the robustness of these observed corre-
lations, we performed a set of statistical Monte Carlo simu-lations to determine the probability that the above-described
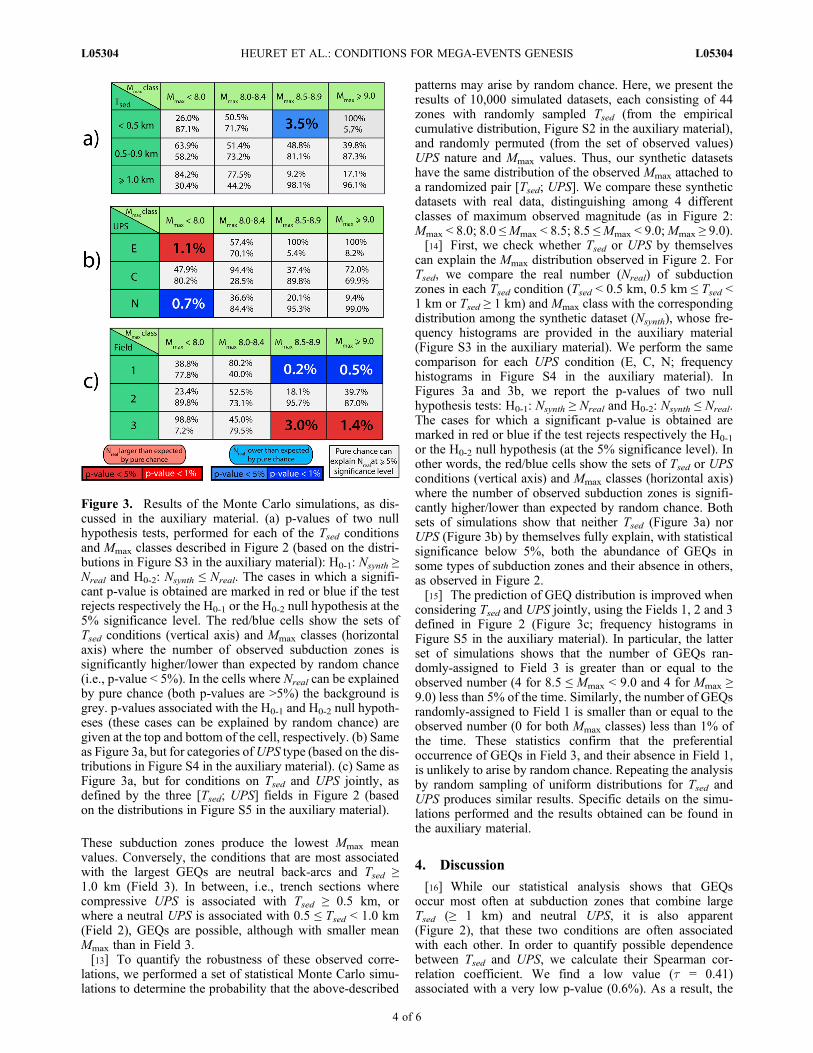
patterns may arise by random chance. Here, we present theresults of 10,000 simulated datasets, each consisting of 44zones with randomly sampled Tsed (from the empiricalcumulative distribution, Figure S2 in the auxiliary material),and randomly permuted (from the set of observed values)UPS nature and Mmax values. Thus, our synthetic datasetshave the same distribution of the observed Mmax attached toa randomized pair [Tsed; UPS]. We compare these syntheticdatasets with real data, distinguishing among 4 differentclasses of maximum observed magnitude (as in Figure 2:Mmax < 8.0; 8.0 ≤Mmax < 8.5; 8.5 ≤Mmax < 9.0;Mmax ≥ 9.0).[14] First, we check whether Tsed or UPS by themselves
can explain the Mmax distribution observed in Figure 2. ForTsed, we compare the real number (Nreal) of subductionzones in each Tsed condition (Tsed < 0.5 km, 0.5 km ≤ Tsed <1 km or Tsed ≥ 1 km) and Mmax class with the correspondingdistribution among the synthetic dataset (Nsynth), whose fre-quency histograms are provided in the auxiliary material(Figure S3 in the auxiliary material). We perform the samecomparison for each UPS condition (E, C, N; frequencyhistograms in Figure S4 in the auxiliary material). InFigures 3a and 3b, we report the p-values of two nullhypothesis tests: H0-1: Nsynth ≥ Nreal and H0-2: Nsynth ≤ Nreal.The cases for which a significant p-value is obtained aremarked in red or blue if the test rejects respectively the H0-1
or the H0-2 null hypothesis (at the 5% significance level). Inother words, the red/blue cells show the sets of Tsed or UPSconditions (vertical axis) and Mmax classes (horizontal axis)where the number of observed subduction zones is signifi-cantly higher/lower than expected by random chance. Bothsets of simulations show that neither Tsed (Figure 3a) norUPS (Figure 3b) by themselves fully explain, with statisticalsignificance below 5%, both the abundance of GEQs insome types of subduction zones and their absence in others,as observed in Figure 2.[15] The prediction of GEQ distribution is improved when
considering Tsed and UPS jointly, using the Fields 1, 2 and 3defined in Figure 2 (Figure 3c; frequency histograms inFigure S5 in the auxiliary material). In particular, the latterset of simulations shows that the number of GEQs ran-domly-assigned to Field 3 is greater than or equal to theobserved number (4 for 8.5 ≤ Mmax < 9.0 and 4 for Mmax ≥9.0) less than 5% of the time. Similarly, the number of GEQsrandomly-assigned to Field 1 is smaller than or equal to theobserved number (0 for both Mmax classes) less than 1% ofthe time. These statistics confirm that the preferentialoccurrence of GEQs in Field 3, and their absence in Field 1,is unlikely to arise by random chance. Repeating the analysisby random sampling of uniform distributions for Tsed andUPS produces similar results. Specific details on the simu-lations performed and the results obtained can be found inthe auxiliary material.
4. Discussion
[16] While our statistical analysis shows that GEQsoccur most often at subduction zones that combine largeTsed (≥ 1 km) and neutral UPS, it is also apparent(Figure 2), that these two conditions are often associatedwith each other. In order to quantify possible dependencebetween Tsed and UPS, we calculate their Spearman cor-relation coefficient. We find a low value (t = 0.41)associated with a very low p-value (0.6%). As a result, the
Figure 3. Results of the Monte Carlo simulations, as dis-cussed in the auxiliary material. (a) p-values of two nullhypothesis tests, performed for each of the Tsed conditionsand Mmax classes described in Figure 2 (based on the distri-butions in Figure S3 in the auxiliary material): H0-1: Nsynth ≥Nreal and H0-2: Nsynth ≤ Nreal. The cases in which a signifi-cant p-value is obtained are marked in red or blue if the testrejects respectively the H0-1 or the H0-2 null hypothesis at the5% significance level. The red/blue cells show the sets ofTsed conditions (vertical axis) and Mmax classes (horizontalaxis) where the number of observed subduction zones issignificantly higher/lower than expected by random chance(i.e., p-value < 5%). In the cells where Nreal can be explainedby pure chance (both p-values are >5%) the background isgrey. p-values associated with the H0-1 and H0-2 null hypoth-eses (these cases can be explained by random chance) aregiven at the top and bottom of the cell, respectively. (b) Sameas Figure 3a, but for categories ofUPS type (based on the dis-tributions in Figure S4 in the auxiliary material). (c) Same asFigure 3a, but for conditions on Tsed and UPS jointly, asdefined by the three [Tsed; UPS] fields in Figure 2 (basedon the distributions in Figure S5 in the auxiliary material).
HEURET ET AL.: CONDITIONS FOR MEGA-EVENTS GENESIS L05304L05304
4 of 6
positive correlation between these parameters can be con-sidered weak but not random. Thus, we cannot rule out apossible dependence between Tsed and UPS. Indeed, it isnoteworthy that Tsed ≥ 1 km is rarely associated withcompressive UPS (Figure 2). The only two examples arethe Colombia and Manila trench sections for which Tsedremains < 1.5 km, with large lateral variability that exhi-bits trench sediment thickness < 0.5 km observable overwide along-trench distances. All trench sections withtrench sediment thickness ≥ 1.0 km continuous over largetrench distances have neutral (or, in a few cases, exten-sional) UPS.[17] It is difficult to conclude that thick trench sediments
cause neutral UPS, or vice versa (or if both are controlled byother parameters), especially because such relationshipshave been poorly investigated by mathematical and physicalmodels. However, there are possible explanations for cau-sation in both directions. UPS should control the sedimentsupply at trenches through generation of relief and associ-ated erosion (expected larger for compressive UPS) or bytuning the space available for channel sediments (assumedcorrelated to Tsed) to accumulate (expected larger for neutralor extensive UPS). Alternatively, a large thickness of sedi-ments at seismogenic zone depths may not only promotelateral rupture continuation by smoothing the slippinginterface [Ruff, 1989], but may also modify the transmissionof tectonic stresses across the plate interface [Lamb andDavis, 2003]. Interplate stresses partly result from inter-plate pressure [Chemenda et al., 2000], which is thought tobe caused by differential motion between the trench and theupper plate [Lallemand et al., 2008; Arcay et al., 2008]. Theobserved correlation may thus indicate that thick subductionchannel sediments should promote neutral UPS by decreas-ing the intensity of interplate pressure, i.e., the efficiency ofcompressive stress transmission to the upper plate. Thismechanism would thus set up a positive feedback that pro-motes GEQs for thick sediment environments. Although therelationship between the plate interface nature and UPS hasbeen analyzed [De Franco et al., 2008; Kostoglodov, 1988],the associated influence of interplate pressure has not, andphysical investigations are required.
5. Conclusion
[18] We explored the plate interface conditions for GEQgenesis by statistically analyzing, for worldwide subductionzones, the relations between UPS, Tsed, and Mmax. We foundthat the most favorable conditions for GEQ occurrence areTsed ≥ 1 km combined with neutral UPS. Neutral UPS orTsed ≥ 1 km separately give mean Mmax values of 8.4whereas the mean Mmax value is 8.6 when these char-acteristics are combined together (Figure 2). Less frequentand lower magnitude (on average) GEQs are also possiblefor compressive UPS, at subduction zones with 0.5 km ≤Tsed < 1.0 km (e.g., Kamchatka, Colombia, S-Kuriles,N-Chile and Japan; Table S2 in the auxiliary material) andin areas that combine compressive UPS and Tsed < 1 km(N-Chile and Japan, although in these cases trench sedi-ment thicknesses are locally greater than 1 km over severalten of kilometres along the trench; Table S2 in the auxiliarymaterial). The only conditions for which GEQs have notbeen observed – and that might be inhibiting conditions –are extensional UPS or Tsed < 0.5 km. We thus verified that
GEQs are more likely where the [Tsed; UPS] conditionsthat promote trench-parallel earthquake rupture combine:1- subduction of a continuous section of thick trenchsediment (Tsed ≥ 1 km) that could construct, with elevatedpressure at depth, a strong and laterally-homogenous layerthat smoothes subducted sea-floor relief and strength-cou-pling asperities, and 2- moderate tectonic compressivestresses applied to the subduction interface (i.e., UPSneutral) that are high enough to allow frictional stresses tobuild-up, while low enough to avoid inhibition of rupturepropagation along the plate interface.
[19] Acknowledgments. We thank Roland von Huene and DaveScholl who helped to improve the quality of the original manuscript bytheir constructive suggestions. This research was supported as part ofthe Eurohorcs/ESF—European Young Investigators Awards Scheme(resp. F.F.), by funds from the National Research Council of Italy andother National Funding Agencies participating in the 3rd Memorandumof Understanding, as well as from the EC Sixth Framework Programmeand NSF grant EAR-0914712 (C.P.C.).[20] The Editor thanks Roland von Huene and David W. Scholl for their
assistance in evaluating this paper.
ReferencesAgudelo, W., A. Ribodetti, J.-Y. Collot, and S. Operto (2009), Joint inver-
sion of multichannel seismic reflection and wide-angle seismic data:Improved imaging and refined velocity model of the crustal structure ofthe north Ecuador-south Colombia convergent margin, J. Geophys.Res., 114, B02306, doi:10.1029/2008JB005690.
Arcay, D., S. Lallemand, and M.-P. Doin (2008), Back-arc strain in subduc-tion zones: Statistical observations vs numerical modelling, Geochem.Geophys. Geosyst., 9, Q05015, doi:10.1029/2007GC001875.
Bilek, S. L., S. Y. Schwartz, and H. R. DeShon (2003), Control of seafloorroughness on earthquake rupture behaviour, Geology, 31(5), 455–458,doi:10.1130/0091-7613(2003)031<0455:COSROE>2.0.CO;2.
Chemenda, A., S. Lallemand, and A. Bokun (2000), Strain partitioningand interplate friction in oblique subduction zones: Constraints pro-vided by experimental modeling, J. Geophys. Res., 105(B3), 5567–5581,doi:10.1029/1999JB900332.
Clift, P., and P. Vannucchi (2004), Controls on tectonic accretion versuserosion in subduction zones: Implications for the origin and recyclingof the continental crust, Rev. Geophys., 42, RG2001, doi:10.1029/2003RG000127.
Conrad, C. P., S. Bilek, and C. Lithgow-Bertelloni (2004), Great earth-quakes and slab pull: Interaction between seismic coupling and plate-slabcoupling, Earth Planet. Sci. Lett., 218, 109–122, doi:10.1016/S0012-821X(03)00643-5.
Corbi, F., F. Funiciello, C. Faccenna, G. Ranalli, and A. Heuret (2011),Seismic variability of subduction thrust faults: Insights from laboratorymodels, J. Geophys. Res., 116, B06304, doi:10.1029/2010JB007993.
De Franco, R., R. Govers, and R. Wortel (2008), The nature of the plate con-tact and subduction zones diversity, Earth Planet. Sci. Lett., 271(1–4),245–253, doi:10.1016/j.epsl.2008.04.019.
Heuret, A., and S. Lallemand (2005), Plate motions, slab dynamics and back-arc deformation, Phys. Earth Planet. Inter., 149, 31–51, doi:10.1016/j.pepi.2004.08.022.
Heuret, A., S. Lallemand, F. Funiciello, C. Piromallo, and C. Faccenna(2011), Physical properties of subduction-type seismogenic zonesrevisited, Geochem. Geophys. Geosyst., 12, Q01004, doi:10.1029/2010GC003230.
Jarrard, R. D. (1986), Relations among subduction parameters, Rev. Geo-phys., 24, 217–284, doi:10.1029/RG024i002p00217.
Kodaira, S., N. Takahashi, A. Nakanishi, S. Miura, and Y. Kaneda (2000),Subducted seamount imaged in the rupture zone of the 1946 Nankaidoearthquake, Science, 289, 104–106, doi:10.1126/science.289.5476.104.
Kostoglodov, V. (1988), Sediment subduction: A probable key for seismic-ity and tectonics at active plate boundaries, Geophys. J., 94, 65–72.
Lallemand, S. (1995), High rates of arc consumption by subduction pro-cesses: Some consequences, Geology, 23(6), 551–554, doi:10.1130/0091-7613(1995)023<0551:HROACB>2.3.CO;2.
Lallemand, S., P. Schnürle, and J. Malavieille (1994), Coulomb theoryapplied to accretionary and nonaccretionary wedges: Possible causesfor tectonic erosion and/or frontal accretion, J. Geophys. Res., 99(B6),12,033–12,055, doi:10.1029/94JB00124.
HEURET ET AL.: CONDITIONS FOR MEGA-EVENTS GENESIS L05304L05304
5 of 6

Lallemand, S., A. Heuret, C. Faccenna, and F. Funiciello (2008), Subduc-tion dynamics as revealed by trench migration, Tectonics, 27, TC3014,doi:10.1029/2007TC002212.
Lamb, S., and P. Davis (2003), Cenozoic climate change as a possiblecause for the rise of the Andes, Nature, 425, 792–797, doi:10.1038/nature02049.
Marzocchi, W., L. Sandri, A. Heuret, and F. Funiciello (2011), On thefrequency-magnitude distribution of converging boundaries, AbstractS34A-06 presented at 2011 Fall Meeting, AGU, San Francisco, Calif.,5–9 Dec.
McCaffrey, R. (2008), Global frequency of magnitude 9 earthquakes, Geol-ogy, 36(3), 263–266, doi:10.1130/G24402A.1.
Meng, L., A. Inbal, and J.-P. Ampuero (2011), A window into the complex-ity of the dynamic rupture of the 2011 Mw 9 Tohoku-Oki earthquake,Geophys. Res. Lett., 38, L00G07, doi:10.1029/2011GL048118.
Normile, D. (2011), Devastating earthquake defied expectations, Science,331, 1375–1376, doi:10.1126/science.331.6023.1375.
Pacheco, J. F., L. R. Sykes, and C. H. Scholz (1993), Nature of seismic cou-pling along simple plate boundaries of the subduction type, J. Geophys.Res., 98, 14,133–14,159, doi:10.1029/93JB00349.
Ruff, L. J. (1989), Do trench sediments affect great earthquake occur-rence in subduction zones?, Pure Appl. Geophys., 129, 263–282,doi:10.1007/BF00874629.
Ruff, L. J., and H. Kanamori (1980), Seismicity and the subduction process,Phys. Earth Planet. Inter., 23, 240–252, doi:10.1016/0031-9201(80)90117-X.
Satake, K., and B. F. Atwater (2007), Long-term perspectives on giantearthquakes and tsunamis at subduction zones, Annu. Rev. Earth Planet.Sci., 35, 349–374, doi:10.1146/annurev.earth.35.031306.140302.
Schnürle, P., C.-S. Liu, S. Lallemand, and D. L. Reed (1998), Structuralinsights into the south Ryukyu margin: Effects of the subducting Gaguaridge, Tectonophysics, 288, 237–250, doi:10.1016/S0040-1951(97)00298-9.
Scholl, D. W., S. H. Kirby, and R. von Huene (2011), Exploring a linkbetween great and giant megathrust earthquakes and relative thicknessof sediment and eroded debris in the subduction channel to roughnessof subducted relief, Abstract TI4B-01 presented at 2011 Fall Meeting,AGU, San Francisco, Calif., 5–9 Dec.
Singh, S. C., et al. (2008), Seismic evidence for broken oceanic crust in2004 Sumatra earthquake epicentral region, Nat. Geosci., 1, 777–781,doi:10.1038/ngeo336.
Uyeda, S., and H. Kanamori (1979), Back-arc opening and the modeof subduction, J. Geophys. Res., 84, 1049–1061, doi:10.1029/JB084iB03p01049.
von Huene, R., and S. Lallemand (1990), Tectonic erosion along the Japanand Peru convergent margins, Geol. Soc. Am. Bull., 102, 704–720,doi:10.1130/0016-7606(1990)102<0704:TEATJA>2.3.CO;2.
von Huene, R., D. Klaeschen, B. Cropp, and J. Miller (1994), Tectonicstructure across the accretionary and erosional parts of the Japan Trenchmargin, J. Geophys. Res., 99(B11), 22,349–22,361, doi:10.1029/94JB01198.
Wang, K., and S. Bilek (2011), Do subducting seamounts generate or stoplarge earthquakes?, Geology, 39, 819–822, doi:10.1130/G31856.1.
C. P. Conrad, Department of Geology and Geophysics, University ofHawaii at Manoa, 1680 East–West Rd., Honolulu, HI 96822, USA.F. Funiciello and A. Heuret, Dipartimento Scienze Geologiche,
Università “Roma TRE,” Largo San Leonardo Murialdo 1, I-00146Rome, Italy. ([email protected])S. Lallemand, Géosciences Montpellier, CNRS, Université Montpellier 2,
CC 60, Place E. Bataillon, F-34095 Montpellier CEDEX 5, France.L. Sandri, Istituto Nazionale di Geofisica e Vulcanologia, Sezione di
Bologna, Via D. Creti 12, I-40128 Bologna, Italy.
HEURET ET AL.: CONDITIONS FOR MEGA-EVENTS GENESIS L05304L05304
6 of 6


![10 subduction [Kompatibilitätsmodus] - Universität Hamburg · Subduction Marshall, 1986 Subduction Williams et al., 1995 In this Lagrangian frame, the subduction rate into the main](https://img.pdfslide.net/doc/110x75/5e163615ccb0b1775b4f3262/10-subduction-kompatibilittsmodus-universitt-hamburg-subduction-marshall.jpg)


![Slip segmentation and slow rupture to the trench during ...shearer/mahi/PDF/2016/Melgar_2016.pdf · shallow parts of the megathrust [Melgar and Bock, 2015]. This is further exemplified](https://img.pdfslide.net/doc/110x75/6061d62a0e2cdf33d2099b7b/slip-segmentation-and-slow-rupture-to-the-trench-during-shearermahipdf2016melgar2016pdf.jpg)


![Slip segmentation and slow rupture to the trench during ...seismo.berkeley.edu/~rallen/pub/2016melgar1/Melgar... · shallow parts of the megathrust [Melgar and Bock, 2015]. This is](https://img.pdfslide.net/doc/110x75/5e30bab426ee3d0bc92d9d12/slip-segmentation-and-slow-rupture-to-the-trench-during-rallenpub2016melgar1melgar.jpg)


![Interface locking along the subduction megathrust from ...geophysics.eas.gatech.edu/people/anewman/research/... · b-value is 1 [e.g., Stein and Wysession, 2003], meaning a 10-fold](https://img.pdfslide.net/doc/110x75/608574c0894f1e3a0916cf6f/interface-locking-along-the-subduction-megathrust-from-b-value-is-1-eg-stein.jpg)


![Slip segmentation and slow rupture to the trench during the ...wenyuanfan/Melgaretal_GRL_2016.pdfshallow parts of the megathrust [Melgar and Bock, 2015]. This is further exemplified](https://img.pdfslide.net/doc/110x75/60e29fb0a14e386afa486f11/slip-segmentation-and-slow-rupture-to-the-trench-during-the-wenyuanfanmelgaretalgrl2016pdf.jpg)