Embed Size (px)
Citation preview
i
RELATIONSHIP BETWEEN BRANDING PRACTICES AND MARKET
PERFORMANCE OF SMEs IN NAIROBI CITY COUNTY
BY
JOHN MORIRA
SUPERVISOR: DR. MUYA NDAMBUKI
A RESEARCH PROJECT PRESENTED IN PARTIAL FULFILMENT OF THE
REQUIREMENTS FOR THE AWARD OF MASTERS OF SCIENCE-MARKETING,
UNIVERSITY OF NAIROBI
OCTOBER, 2019
ii
DECLARATION
I, undersigned, declare this as my original work and not been submitted to any other college,
institution or university.
Signed: Date
____________________
NAME: JOHN MORIRA
D65/10541/2018
This Proposal has been presented for examination with my approval as the appointed Supervisor
Signed: Date
____________________
NAME: DR. MUYA NDAMBUKI
Senior Lecturer
Department of Business Administration
School of Business
University of Nairobi

iii
DEDICATION
The project is dedicated to my family and friends whose reassurance and support enabled me on.
They inspire me every day.

iv
ACKNOWLEDGEMENT
I would like to express my gratitude everyone who supported and assisted me. In particular,
would like to thank Dr. Muya Ndambuki, my supervisor for being patient and guiding me from
the beginning to the end. I would like to thank family and friends for being understanding,
patience and supportive at the time I was undertaking my project. I cannot forget to recognize
reference of different scholars for their work that helped me come up with the project. Most
notably I would like to thank Almighty God for availing me resources and energy to make this
project a reality
v
ABSTRACT
The research attempted investigating Small and medium-sized enterprises (SMEs) which form
primary enterprises in many nations, creating employment opportunities for many. Moreover, they
contribute to enhancing and promoting improvements. The Study Outline how small and medium
enterprises use branding practices in enhancing their effectiveness in market. Research addressed
study problems: How have SMEs use branding practices; what factors have influenced the use of
branding practices; and which approaches can SMEs use in ensuring better use of branding
practices? Descriptive research design was used, where population intended were SMEs in
Nairobi, 6000 in total. This study employed random sampling study, which meant samples were
taken from various SMEs and sample size in research as 98 participants. Primary data, gathered
using surveys, garnered 98 participants in total, in which descriptive analysis was used.
Statistical Package for Social Sciences (SPSS) was used in analyzing statistics, which entailed
mean, standard deviation and percentage, and subsequent correlation analysis to assess
associations among research variables. Inferential statistics assessed variance of individual
factors for research. Outcomes highlighted firm owners‟ perception of branding; as crucial to
growth of their businesses. Moreover, use of these practices also hinged on nature and type of
industry in question. Lack of firm resources prevented firms from deriving gains of these
practices. This work also showed firms reduced charges to get more clients, whereas some
established significant associations with their clients to offer better promotions and offers. The
research endorses SMEs to use branding to handle client, competitor and handle firm outcomes,
as well as solicit client data to inform future business actions. It stresses the need for executives
and SMEs in incorporating changes in tech, and the business environment to handle human
needs.
vi
TABLE OF CONTENTS
DECLARATION ............................................................................................................................ ii
DEDICATION ............................................................................................................................... iii
ACKNOWLEDGEMENT ............................................................................................................. iv
ABSTRACT .................................................................................................................................... v
TABLE OF CONTENTS ............................................................................................................... vi
LIST OF TABLES ......................................................................................................................... ix
LIST OF FIGURES ........................................................................................................................ x
LIST OF ACRONYMS ................................................................................................................. xi
CHAPTER ONE: INTRODUCTION ........................................................................................ 1
1.1 Background of the Study .......................................................................................................... 1
1.1.1 Branding Practices.............................................................................................................. 2
1.1.2 Market Outcomes ............................................................................................................... 4
1.1.3 SMEs in Nairobi ................................................................................................................. 5
1.2 Research Problem ..................................................................................................................... 5
1.3 Objectives of Study ................................................................................................................... 7
1.4 Value of Study .......................................................................................................................... 7
CHAPTER TWO: LITERATURE REVIEW ............................................................................ 8
2.1 Introduction ............................................................................................................................... 8
2.2. Theoretical Literature Review ................................................................................................. 8
2.2.1 Signaling Theory ................................................................................................................ 8
2.2.2 Behavioral Theory ............................................................................................................ 10
2.3 Empirical Review.................................................................................................................... 10
2.3.1 Location Branding and Market Outcomes ....................................................................... 11
2.3.2 Destination branding and Market Performance ............................................................... 12
vii
2.3.3 Internal Branding and Market Outcomes ......................................................................... 12
2.3.4 Branding new ventures and market performance ............................................................. 13
2.5 Summarization ........................................................................................................................ 16
CHAPTER THREE: RESEARCH METHODOLOGY ......................................................... 17
3.1 Introduction ............................................................................................................................. 17
3.2 Research Design...................................................................................................................... 17
3.3 Population of the study ........................................................................................................... 17
3.4 Sample Design and Sample size ............................................................................................. 18
3.5 Data Collection ....................................................................................................................... 18
3.6 Data Analysis .......................................................................................................................... 19
CHAPTER FOUR: ANALYSIS, RESULTS AND DISCUSSION ......................................... 20
4.1 Introduction ............................................................................................................................. 20
4.2 Response Rate ......................................................................................................................... 20
4.3 Demographic Information ....................................................................................................... 20
4.3.1 Years of Firm Operation .................................................................................................. 21
4.3.2 The number of Workers ................................................................................................... 22
4.3.3 The number of business branches .................................................................................... 23
4.3.4 Approximate revenue generation ..................................................................................... 24
4.3.5 Revenue generation .......................................................................................................... 24
4.4 Descriptive Statistics ............................................................................................................... 24
4.4.1 Branding practices ............................................................................................................ 25
4.4.2 Marketing Performance .................................................................................................... 26
4.5 The descriptive statistics on marketing performance .............................................................. 27
4.6 Correlation Analysis ............................................................................................................... 28
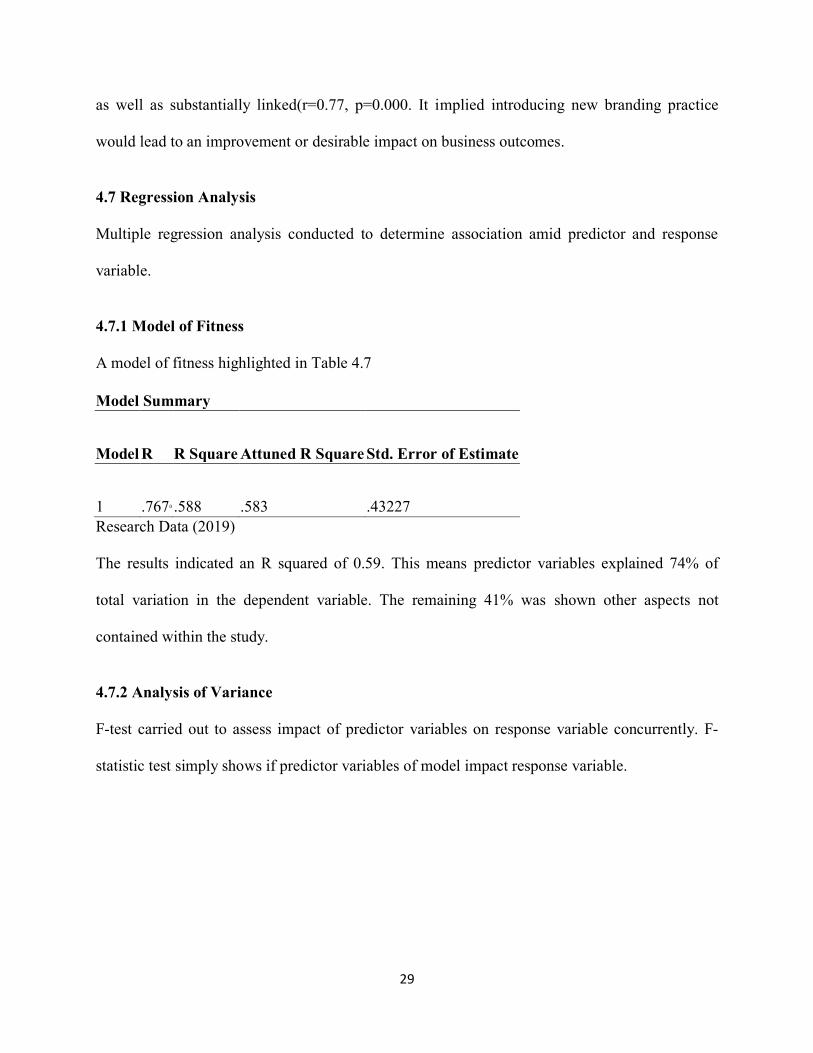
4.7 Regression Analysis ................................................................................................................ 29
viii
4.7.1 Model of Fitness ............................................................................................................... 29
4.7.2 Analysis of Variance ........................................................................................................ 29
4.8: Regression of Coefficients ..................................................................................................... 30
4.9: Discussion of the findings...................................................................................................... 31
CHAPTER FIVE: SUMMARY, INFERENCES AND RECOMMENDATIONS ............... 33
5.1 Introduction ............................................................................................................................. 33
5.2 Summarization ........................................................................................................................ 33
5.2.1 Relationship of branding practices and marketing performance ...................................... 33
5.3 Conclusion .............................................................................................................................. 34
5.4 Recommendations ................................................................................................................... 34
5.5 Limitations of Study ............................................................................................................... 35
5.6 Recommendations for More Research .................................................................................... 35
REFERENCES ............................................................................................................................ 36
APPENDICES ............................................................................................................................. 40
Appendix 1:Part A. Demographics of the business ...................................................................... 40
ix
LIST OF TABLES
Table 4.1: Response Rate ............................................................................................................. 20
Table 4.2 Presented the findings. ................................................................................................. 21
Table 4.3: Respondents‟ number of business branches ............................................................... 23
Table 4.4: Descriptive Statistics for branding practices .............................................................. 25
Table 4.5: Descriptive Statistics for marketing Outcomes .......................................................... 27
Table 4.6 presented the correlation analysis results. .................................................................... 28
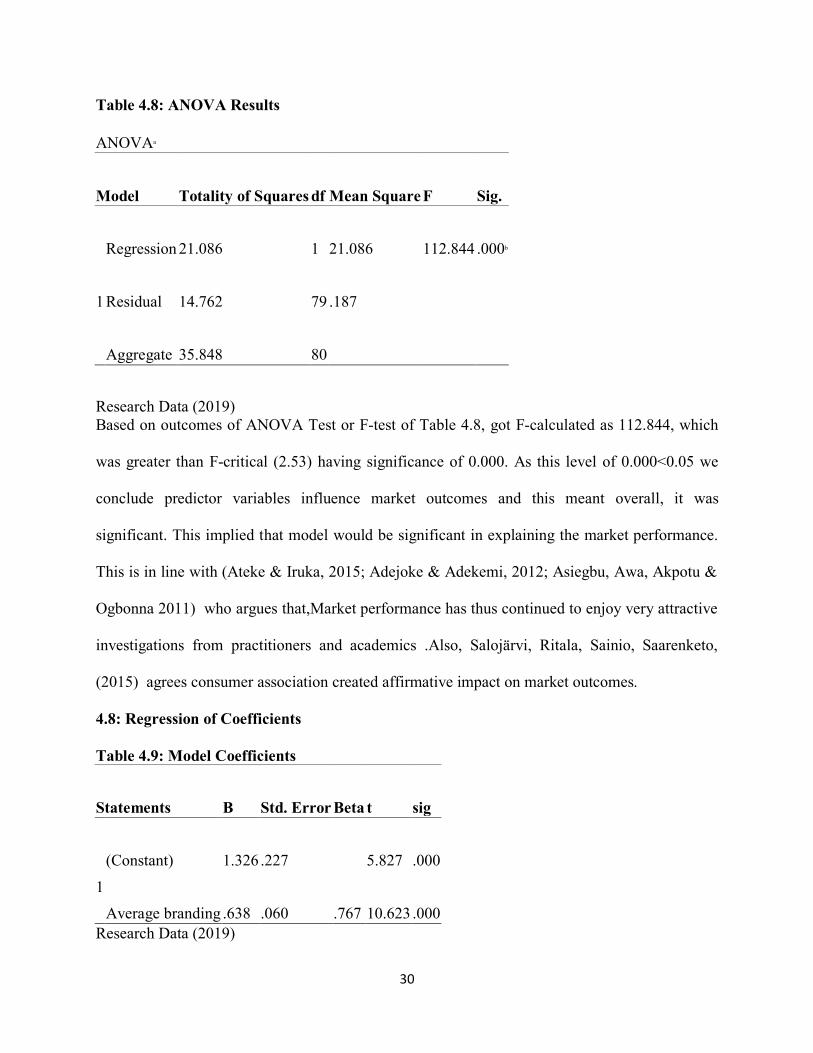
Table 4.8: ANOVA Results ......................................................................................................... 30
Table 4.9: Model Coefficients ...................................................................................................... 30
x
LIST OF FIGURES
Figure 2.1 The conceptual framework is as shown in.................................................................. 15
Figure 4.1: Respondents‟ number of employees within business ................................................ 22
Figure 4.2 showed the results of the data that was obtained regarding the Approximate revenue
generated. ...................................................................................................................................... 24
xi
LIST OF ACRONYMS
SMEs: Small and Medium Enterprises
MSEs: Micro and Small Enterprises (MSEs)
DMOs: Destination Management Organizations
CEOs: Chief Executive officers
SPSS: Statistical Package for Social Sciences
Std.Dev: Standard Deviation
1
CHAPTER ONE: INTRODUCTION
1.1 Background of the Study
The desire of firms to improve their performance in the market is the paramount push behind all
marketing decisions and programmes, because the outputs of enterprises is cardinal to corporate
wellbeing in business undertakings and also determines the continued existence of the firm in the
business landscape (Ateke & Iruka, 2015). Market performance has thus continued to enjoy very
attractive investigations from practitioners and academics (Ateke & Iruka, 2015; Adejoke &
Adekemi, 2012; Asiegbu, Awa, Akpotu & Ogbonna 2011). Marketers have realized that it is no
longer enough to just provide a value offering to the marketplace, and amass tangible assets; but
they must also consider their brands as significant intangible assets (Liu, Hu & Grimm, 2010).
Branding as a concept has been extensively researched by the academia and business
practitioners (Marakarun and Panjakajornak, 2017; Kilie, et al., 2016; Cetin, etal.,2016; Park
and Bai, 2014) examining its impact on other market performance measures.
This study is grounded on Aron and Aron‟s (1986) self-expansion prototype arguing people
become enticed into close associations for growth of their assets, standpoints, as well as
individualities of others leading to intellectual restructuring that makes the other‟s possessions,
outlooks, and individualities seem as one‟s own. Certo and Trevis (2011) signaling Theory
shows consumers evaluate inklings showing how to try products or service. Plausible
enlightenment show different dimensions send out detailed indications of varying significance to
businesses. Ivan Pavlov (1890-1930) behavioral theory is more concerned with the decision
making process that influence decision-makers on the need for branding of the SMEs rather than
production costs, profitability, prices and revenues. Grant (1991) Resource Based View theory
offers insight into strategy, and whose fundamental principle is that the basis for relative gain of
2
an organization depends predominantly on deployment of bundled resources. This will support
the study from the perspective of the extent upon which SMEs have invested resources towards
branding practices.
In Kenya, companies have adopted the much cheaper branding mechanisms based on the web,
social media and other digital platforms. Gordon (2009) reported that for Kenyan companies,
social media gives insights things surpassing time and space. The infiltration of smartphones and
mobile technology has allowed companies get records of events as they happen (Communication
Authority, 2015). Majority of the Kenyan companies have adopted social media and have full
functioning social media accounts which they use as tools for branding. This has been used for
gathering or sharing info. Social media is not the panacea of branding in Kenya but is alternative
approach for communication. (Communication Authority, 2015). Branding has affected
communication practices both desirably and undesirably, but the good is more than the bad.
1.1.1 Branding Practices
Branding practices is the process of enabling the business to stand out, live its brand and deliver
the value that matter most to customers. These practices may take the form of giving your brand
definition, creation of brand presence, logo definition and customer communication. Hankinson
(2001) show despite being relevant, branding has never been applied correctly. This research
offers information on important aspects affecting use of places in branding, with primary issues
being organizational structure, managing collaborations, good variance and victory indicators.
However, Anholt shows „branding is ethical in nature: evaluating present frameworks in
complying with established ideas or not. (Anholt, 2006, p. 2). Nevertheless, site branding as an
idea is „walking on thin ice‟ as it solicits many concerns due to integrating many concepts. As
shown for the research, present descriptions don‟t consider ethical concerns.
3
Sabrina and Martin, (2010) sheds information on branding policies for small firms, as it is
essential to their triumph and survival because it makes the process of getting customers easier.
Branding practices commonly adopted by SMEs include those that have a product (Cruz-Ros
2012) or consumer orientation (Baldauf 2013), or strategies that differentiate themselves from
other businesses based on these orientations. It is also a well-recognized proposition in literature
(Craig et al., 2008; Flören, Jansen and Berent-Braun 2015) differentiation-competitive
orientation applies for effective branding practices. Craig et al., (2008, 355) assert competitive
orientation and product differentiation competitive orientation are the strategies most often used
by SMEs. For this reason, the branding practices examined in the research as client and product
differentiation. Researchers (Memili et al, 2010) showed promoting firms with distinct image,
impacted how SMEs performed. Similarly, many others (Craig et al. 2008; Gundala and
Khawaja 2014; Zellweger et al. 2012) contend that business branding can influence business
success. Against this background, several relationships are hypothesized.
Brendan (2010) states, proper branding facilitated triumph as quality of the brand depended on
certain key practices: capitalizing on advertising communication in enhancing awareness of the
firm‟s brand, taking part in communal associations to increase status, bettering communication
processes within the firm, as well as raising quality of customer care in the organization. Ojaso
(2008) shows many SMEs ought to emphasize more on enhancing knowledge of their brand as a
long-term approach.
From such perspectives, branding as a concept for Business has been
extensively researched by the academia and business practitioners (Marakarun and
Panjakajornak, 2017; Kilie, et al., 2016; Cetin, etal.,2016; Park and Bai, 2014), examining its
impact on SMEs financial performance.

4
1.1.2 Market Outcomes
This is achievement of an organization, measurable by profit margins, client satisfaction, client
loyalty, revenue from sales and upper hand in the market. Salojärvi, Ritala, Sainio, Saarenketo,
(2015) argued client associations created desirable impact on the outcomes of the business, and
technology had non-substantial yet desirable impact on the same. These impacts were amplified
when collaboration amid marketing and Research and Development was great, giving insight on
relative impacts of these procedures. Martin (2012) shows better market frameworks ensure
optimum outcomes, and that organizational attitudes contribute significantly to branding. But
also more competitive market structures ensure better outputs, and that firm conduct and
industry-specific factors play independent roles. Alexander (1986).
Basing on Biais (1993), I found venture capitalist got better prices for their offering when
business markets were uneven. As shown, risk-averse traders employ other approaches when
markets are more open and transparent as different quotations removes doubt regarding price
offering by others, decreasing need for intensive competition. Moreover, more openness creates
negative impact on liquidity within the firm. Manzano (2002). Nevertheless, Vivien et al., (2017)
suggest that, cueing in corporate entrepreneurship scopes of innovativeness, carefree and
independence create desirable impact in how markets perform in calls, as outcomes in markets
created an undesirable impact, even as proactiveness showed no impact.
Market performance can be measured using the marketing inputs. This refers to marketing
actions like assessment, application, as well as alignment creating outcomes like client
contentment, loyalty, as well as brand equity, ensuring greater monetary outcomes. Other
immediate results are useful for ensuring better monetary outcomes. (Srivastava, Shervani &
Fahey 2013)
5
1.1.3 SMEs in Nairobi
Many SMEs doubt e-marketing use as they entail great initial incorporation charges. Some don‟t
comprehend the importance of this in improving profits of their businesses. Njau, Karugu (2014).
Waweru and Ngugi (2014). (MSEs) can greatly impact financial growth in the country, and
inadequate information on market dynamics as well as qualms within business settings has
restricted their growth, and affected their outcomes in the country. Karanja (2013) showed
inventiveness affected development of these enterprises. Ability of executives in supporting
better initiatives, creativity, invention and development of new substantially affected how these
firms performed. In Kenya companies have adopted the much cheaper branding mechanisms
based on the web, social media and other digital platforms. Gordon (2009) reported that for
Kenyan companies, web platforms avail better methods of carrying out activities beyond time
and space limitations. The infiltration of smartphones and mobile technology has allowed
companies right to use to speech, photos and cinematic during events or afterwards.
(Communication Authority, 2015). Majority of the Kenyan companies have adopted social
media and have full functioning social media accounts which they use as tools for branding. This
has been important in collecting or sharing data. Web platforms are alternative tool of
communicating, sending as well as receiving statistics (Communication Authority, 2015).
1.2 Research Problem
Despite extensive discussion of benefits of having proper market outcomes, available reviews
show varying outcomes. Charles and Noble (2002) assess how varying practices affect aspects of
market outcomes, employing longitudinal method, with letters to investors for yearly reports.
Furthermore, He examines relative impact of varying strategies and approaches which show

6
differing priorities in the organization. Hankinson (2010) showed branding being applicable
despite being misunderstood. Research gives bits on issues influencing using sites as branding.
Carmen Blain et al., (2005) Argues that, despite branding being used in many goods, it was risen
in tourism matters. Destination branding isn‟t well highlighted in present studies, being restricted
to destination management organizations (DMOs). Basing on this, research has three aims: to
assess theoretical studies pertaining branding, to review and improve definitions of destination
branding in relation to present trends in, as well as enhance knowledge in existing destination
branding activities among DMOs. Outcomes shows despite widespread understanding,
participants only apply chosen aspects of these ideas, especially dealing with creating logos.
Ceridwyn et al., (2007) assesses varying impacts internally oriented initiatives create in labor,
basing on worker‟s standpoint. In-depth interviews done with workers on varying services avail
information on worker brand commitment.
In Kenya, there exist more micro and small enterprises but most of them do not grow to medium
sized enterprises. As suggested in studies by Monk (2010) in Kenya, lack of branding affects the
size of market share that SMEs command. On the other hand while increasing worldwide trade
has benefited SMEs, many SMEs have not been able to gain competitive advantage from the
globalization process (Forbes, 2015). At the moment, small SME industries can find, use and
exploit available and counter tests. Moya (2011) linked inability among SMEs to adapt to the
changing business environment to poor branding awareness to gain a share in the market. Khan
(2013) argues that in today‟s business environment, products are not differentiated by quality but
rather by consumer perception regarding particular products. This makes branding one of the
basic tools to gain market share and realize sustainable growth. However, despite the underlying
problem, as pointed by Wong (2005), despite numerous studies on branding, few have targeted
7
SME and brand administration. Merrilees (2007) showed lately, only big firms researched brand
management, focusing entirely on end users. Gilmore and Cummins, (1999) showed this as
restricted, and not influencive of marketing ideologies. Though, the concept of branding has been
extensively researched, little or none has been published on its nexus with market
performance in SMEs and present literature does not adequately answer this important
question: What impact does branding activities create on SMEs in market outcomes?
1.3 Objectives of Study
Goal of the research entails determining association amid branding practices and market
outcomes of SMEs of Nairobi City County.
1.4 Value of Study
Managing SMEs would profit from outcomes of research seeing their knowledge on how brand
practices has influence on market outcomes among SMEs, both for operations and profitability.
Government would also gain through knowing the relationship in branding practices and market
performance of SMEs and also the benefits it has to the society. The study will help the
Academic institutions to utilize outcomes in more studies in branding practices in SMEs.
Business students would comprehend impact of brand in SMEs and growth Market performance.
8
CHAPTER TWO: LITERATURE REVIEW
2.1 Introduction
It mainly deals with evaluation of related literature relevant to objectives presented. It covers
these topics; Branding as a concept, customer service orientation, product orientation and its
effect on market performance and effect on market performance, distinct name as a branding
practice, effect of promotion of the SME as a business to stakeholders on market performance.
2.2. Theoretical Literature Review
This theoretical framework deals with theories which have contributed to the relevance of
branding in growth of SMEs. The theories include institutional as well as technology acceptance
models.
2.2.1 Signaling Theory
The Signaling Theory attempts to explain how consumers reflect upon the attractiveness of an
organization. As mentioned before, the corporate brand can be used to convey symbolic traits or
characteristics of an organization, which are known as organizational attributes (Backhaus 2010). The
Signaling Theory “suggests that consumers look for clues to indicate what it would be like to try a
product of service from a company. As a possible explanation it can be assumed that each dimension
sends out specific signals and values which have different importance to the participants” (Liz, 2012) .
Organizational attributes are characteristics and clues about the organization which potential buyers
receive as predictors of buying conditions and intentions. For example, innovativeness or prestige might
be symbolic attributes that prospective buyers find attractive within branding (Backhaus et al, 2002;
Backhaus & Tikoo, 2004; Bakanauskiene et al., 2011; Lievens & Highhouse, 2003).
This is essential as buyers need accurate information about a firm in order to evaluate if the company‟s
product offerings match their needs and requirements (Backhaus et al, 2002).
9
However, in most cases the information gained buyers are limited and therefore they need to use
the available parts of the communication they can get from the organization which for example is
the brand associations (Backhaus et al, 2002). Moreover, previous studies show significance of
the figurative traits surges when the practical aspects of a product or service are hard to
differentiate. To avoid the problem discussed above, the Signaling Theory is a good concept to
consider. The Signaling Theory is used by prospective buyers to improve their ability to make
rational choices when evaluating potential organizations by their characteristics. The Signaling
Theory is trying to explain how organizational branding is used to convey the symbolic benefits
gained from buying form the organization and how this can be distributed by the image
(Backhaus et al.,
2004; Bakanauskiene et al., 2011). Lievens and Highhouse (2003) and later Bakanauskiene et al.,
(2011) identified two main categories of characteristics in firm allure; instrumental and figurative
attributes. The instrumental qualities entail the utilitarian and functional aspects of a brand
whereas the symbolic attributes concerns the self-expressive features.
Lievens and Highhouse (2003) have found that implications on symbolic traits within companies
have an incredible value in relation to the instrumental attributes when looking at organizational
attractiveness. Together these instrumental and symbolic attributes shape the organization's
brand image and brand attractiveness of an organization (He & Lai, 2014). Hence, these are the
attributes a prospective buyer uses when deciding which organization to buy from.
Through the signaling theory, the organization brand attractiveness has been discussed. This
shows how the signaling theory is relevant to the current study.
10
2.2.2 Behavioral Theory
The behavioral theory, the approach is more concerned on choice procedures impacting decision-
makers in growth of SMEs rather than production costs, profitability, prices and revenues. Firms
are assumed to be hyperopic and tied to their operating standard procedures. They possess
capabilities and differential characteristics and can make long-term investment decisions thus
have unique potential to grow (Hayter, 2007). Basing on behavioral theory as well as studies of
SME internationalization, it shows SMEs strengthen spreads when stressed on working with
restricted resources, or when properly set for great slack levels. restrained levels of slack result in
a domestic focus by SMEs ( Andreea N. Kiss 2018). Behavioral theory also pinpoint the
behavioral roots of superior performance, where "behavioral" denotes "being about mental
processes." Such roots are identified in behavioral deviations from market efficiency. The causes
of these deviations are behavioral factors that bound firms' ability to pursue and compete for
superior, Gavetti (2012).
2.3 Empirical Review
It is well supported in literature that the branding practices adopted by a business influence the
marketing performance of that business (Blombäck and Botero 2013; Kotler and Armstrong
2010). Branding practices commonly adopted by SMEs include those that have a product Cruz &
Cruz-Ros (2012) or consumer orientation Samanta (2011), or strategies that differentiate
themselves from other businesses based on these orientations. From the conceptual framework, it
can be seen that “Location branding”, “Destination branding” and “Internal branding” serve as
predictor variables, and “Marketing performance” is response variable. Each aforementioned
variable will be elaborated in an experiential works review.
11
2.3.1 Location Branding and Market Outcomes
Hankinson (2010) propose branding as significant despite being misunderstood or misinterpreted
differently. His research shows perceptions into crucial aspects affecting creation and
development of strategic places in branding. Chosen factors included firm complication,
supervising enterprises, good involvedness and success evaluation. It settles, nevertheless,
branding of locations as achievable, suggesting creation of agenda for more research in
addressing factors identified. Jonathan Hall (2004) shows principles of approach, team structure,
procedure detail and approach for strategic resolve and inventive implementation, as well as
providing deeper deductions pertaining site branding initiatives.
Peter Van (2002) suggests various instances of location being used in branding, showing how it
has become trendy. Pertaining place branding with some strands of constructivist thoughts and
exploring likely outcomes in studying patriotism and democracy. Cold branding with liquid
nitrogen as a coolant appears to have an excellent potential for producing a durable recognizable
mark on fish. The most frequent complaint voiced against cold branding has been a high
variability in the quality and subsequent recognition of the mark. Four aspects of cold branding
were tested and found to be effective in reducing variability in the quality of the brands. These
are: use of branding tips with open simple designs and thin clean lines, application of the brand
to selected locations on the fish for a controlled period of time,
and utilization of the ability of fish to change hues during subsequent examinations for marks, R.
F. Raleigh et al., (1973). In so, this hypothesis is formulated: H1: A desirable association exists
amid use of a “Location branding” as well as “Marketing performance” in SMEs.

12
2.3.2 Destination branding and Market Performance
Despite branding being used widely in many products, tourism endpoint branding as
comparatively new spectacle. Most especially, it rests barely defined to many practitioners in
destination administration firms (DMOs) and is not well represented in the tourism literature.
Carmen Blain et al.,(2005) However, Morgan (2007) Sheds light by suggesting that, Present
competitive marketplace, many destinations are incorporating branding methods like those of
'Coca Cola', 'Nike' and 'Sony' in an effort to differentiate their identities and stress exclusivity of
their offering. Steven pike (2005) argues that, whereas interest in using brand theory to practice
in tourism is increasing, there is a paucity of published research with which to guide DMOs.
Only little discussion on complexity involved in capturing essence of a multi‐attributed
destination with a succinct and focused brand position, in a way that is both meaningful to
multiplicity of intended audiences of interest to shareholders and efficiently distinguishes
destination from rivals.
Based on literature, this study hypothesis has been formulated: H2 Desirable association exist
amid use of a “product differentiation” and “marketing performance” in SMEs.
2.3.3 Internal Branding and Market Outcomes
Ceridwyn et al., (2007) showed effects of oriented enterprises within a firm‟s labor, as well as its
corresponding effect on its brand, basing on the workers angle. Detailed interviews were done
with staff of varying service firms, outcomes providing understanding on staff brand
commitment. Carley (2010) argues that, business branding impression emphasized workers
commitment and behavior in the organization. It led to growth of internal and proprietor
branding, arguing for deep orientation amid staff values and business brand. Despite this, various
studies have availed platforms for synergizing present concepts for realizing dependable,
13
steadfast business brand. The research tries exploring and linking the three concepts of branding
basing on a new outline.
The rise in business marketing and corporate branding created awareness of the importance of
workers in corporate marketing and corporate branding procedures. Historical analysis of
corporate-level constructs from 1950s by Balmer1 shows various ideas like image, identity, as
well as branding and corporate reputation, Punjaisri K., Wilson A. (2017) .
Given aforementioned mentions, these hypotheses articulated and were exposed to empirical
testing: H3 An desirable association exists amid “promotion of SMEs” as well as “marketing
performance” in SMEs.
2.3.4 Branding new ventures and market performance
Sabrina and Martin (2010) show summary of present practices as well as foundation of brand
building undertakings choices; highlighting emblematic drawbacks pertaining branding. It
suggests that young companies should not be forced to compare their branding strategies to
multinational firms and proposes a framework and key guidelines for start‐up branding. Leitch
and Richardson (2003) on their piece proposes “brand web” model for creating and analyzing
corporate brands and its associations. It is especially relevant in new undertakings resulting from
alliances. To deploy brand web model, marketers ought to consider power associations amid
corporate brands; their identities and subsequent values; goals of each; and comparative
approaches useful in achieving these goals. Queries posed in context of the semiotic model of
corporate identity. However, Abimbola, T. (2001) argues that the work attempts to establish
branding as marketing approaches pertaining business missions in creating demand and
subsequent relative gain. It shows relevance of branding in SMEs, highlighting appropriate
frameworks these SMEs could follow to create fruitful brand. Kippenberger (2000) shows co-
14
branding (the bringing together of two or more independent brand names in support of a new
product, service or venture) as substantial factor in branding. States co‐branding may create
significant gain among workers involved. Due to the literature summary, this study hypothesis
has been formulated: H4 shows desirable association amid use of a “Branding new ventures” and
the “marketing performance” of SMEs.
15
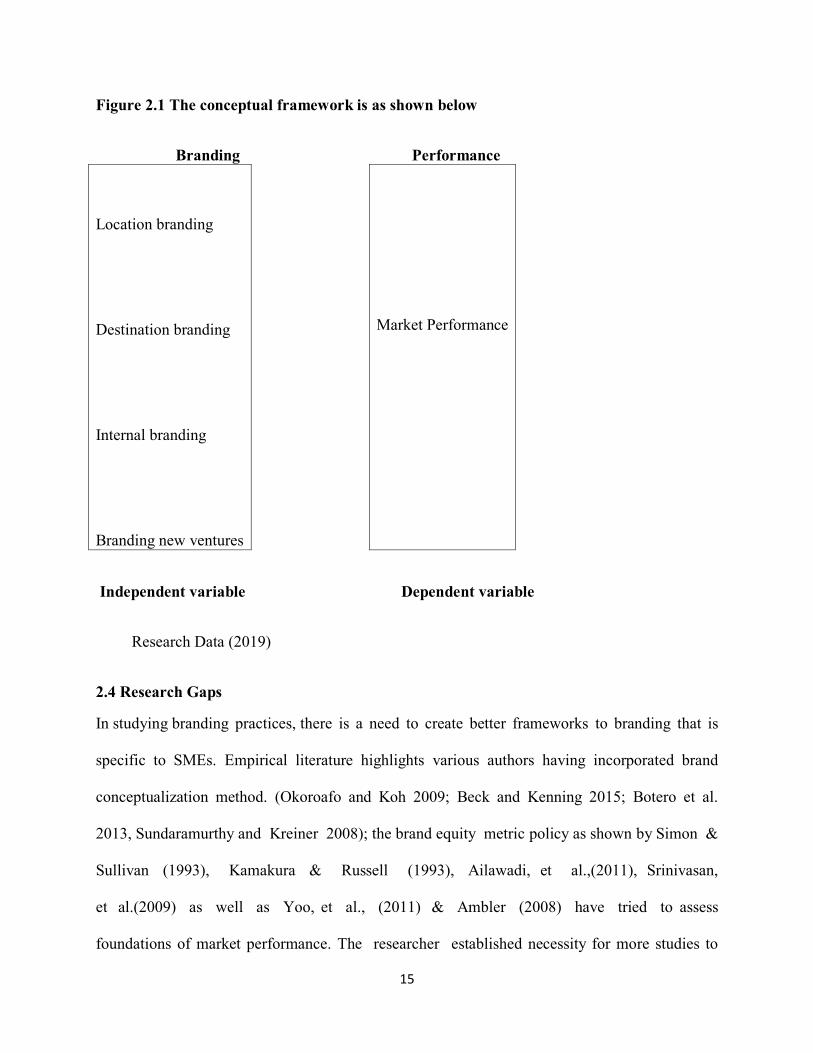
Figure 2.1 The conceptual framework is as shown below
Branding Performance
Location branding
Destination branding
Internal branding
Branding new ventures
Market Performance
Independent variable Dependent variable
Research Data (2019)
2.4 Research Gaps
In studying branding practices, there is a need to create better frameworks to branding that is
specific to SMEs. Empirical literature highlights various authors having incorporated brand
conceptualization method. (Okoroafo and Koh 2009; Beck and Kenning 2015; Botero et al.
2013, Sundaramurthy and Kreiner 2008); the brand equity metric policy as shown by Simon &
Sullivan (1993), Kamakura & Russell (1993), Ailawadi, et al.,(2011), Srinivasan,
et al.(2009) as well as Yoo, et al., (2011) & Ambler (2008) have tried to assess
foundations of market performance. The researcher established necessity for more studies to
16
elicit greater comprehension of precursors in market performance as relates to branding
practices for SMEs and more so in the Kenyan context. As a whole this research fills the gap and
takes this further to determine how those branding practice variables affect marketing
performance for SMEs in Kenya
2.5 Summarization
It highlighted association amid branding practices and market performance metrics. The
literature showed that whereas existing data pertaining brand practice measures had positive
impact on market performance and firm performance, many studies assessed associations amid
branding practices and its outcome. For instance, Srinivasan et al., (2004) calculated impact of
customer decision probability in buying, as well as brand‟s influence margin in the business,
Kim et al., (2009) investigated purchase intentions of customers in relation to family businesses.
Other researchers used regression methods to show links amid seeming quality and share prices,
while others highlighted how attitude impacted business share value as well as future incomes
from the same. The results from the studies discussed in literature provided credible data on links
amid branding practice and market performance. Despite this, many reviews were chiefly
descriptive, covering other jurisdictions not specific to Kenyan context and for the SMEs
perspective. Research didn‟t avail data on how branding practices impacted brand‟s market
outcomes in the SME sector, thereby providing scanty information on what executives perform
(like branding choices) in improving equality in services sector.
17
CHAPTER THREE: RESEARCH METHODOLOGY
3.1 Introduction
The section presents narrative of chosen research design, entailing approaches and methods used
i.e. what was done and how was done. It comprises various sections highlighted in a certain
order.
3.2 Research Design
As per Kothari (2007), this is as the planning of conditions in gathering and analyzing statistics
to create significance as per the purpose of research. A research design is theoretical
configuration upon which research bases; comprising plan for gathering, measuring and
analyzing data. Research will adopt descriptive research design as was not limited to gathering
and describing but also investigated existence of links amid business‟ branding practices
strategies with its growth. Other minor variables will include the value of the firm after adoption
of branding practices strategy, and profitability, risk and growth.
Descriptive research design was used for specific and properly defined problems. Data collection
exercise was not flexible but rigidly specified. One of the major importance of this on assessing
rate at which it occurred or extent to which variables are taken.
3.3 Population of the study
Intended populaces were small and micro enterprises (SMEs) located within Nairobi. As per
Nairobi County Licensing Department (2018), 6000 licensed businesses existed among SMEs
within Nairobi. It formed populace used in research.
18
3.4 Sample Design and Sample size
This study employed random sampling techniques in choosing firms. Based on the Yamane‟s
formula, 98 owners of SMEs of licensed enterprises formed the sample size where deductions of
populace were established. Yamane (1967) arithmetical plan was employed to find sample size
from business enterprises operating in Nairobi City County.
n= N/{1+(N)*(E*E) }
n –sample size, N – Population Size, E – 0.1, at 90% confidence level.
n=6000/1+ 6000(0.1*0.1); n=98
Study therefore selected 98 SMEs to participate in the study; it is from these SMEs that data was
collected
3.5 Data Collection
Data was gathered using closed ended surveys.
The Questionnaire had three parts where part A business demographics, part B branding
practices and part C market performance.
The respondents were the owner‟s managers, CEOs, Finance managers whose opinions reflect
the practices on how branding affected market outcomes. Survey was used in gathering needed
data. 98 respondents who was the Owners managers of the SMEs were included in questionnaire,
employing drop and collect technique, researcher administered surveys and then was collected
19
within 5 days. Additional letters were added to survey to increase the rate of responses,
highlighting what needed to be done.
3.6 Data Analysis
As per Cooper and Schindler (2008), descriptive analysis entails altering raw data to tables,
having frequency distribution percentages for better data interpretation, because of this, surveys
gathered are assessed for wholeness. Gathered data is then analyzed by Statistical Package for
Social Sciences (SPSS). Data pertaining participants‟ and firms‟ demographic information firm
is assessed by frequencies and percentages.
Correlation analysis was useful in assessing substantial issues by p value of 0.05 as base.
Inferential statistics including regression analysis examined proportion of variance due to
singular issues.
20
CHAPTER FOUR: ANALYSIS, RESULTS AND DISCUSSION
4.1 Introduction
The segment was on assessments of results portrayed after analyses of the raw data. The findings
were provided in terms of themes that were reflected in the objectives and presented in charts,
graphs and tables.
4.2 Response Rate
The scholar distributed 98 tools as corresponded with the sample size. Some of the
questionnaires were not filled up while some were partly filled or had errors. Of this 98
distributed, 81 were completely responded to. This was 89% rate of response. This response rate
is very good as asserted by Babbie (2004) who indicated response rate of 50% is acceptable,
60% as good whereas more than 70% as extremely good. Table 4.1 highlights tabulated reply
rate.
Table 4.1: Response Rate
Response Frequency Percent Returned 81 89%% Unreturned 17 11% Total 98 100% Research Data (2019)
4.3 Demographic Information
The researcher collected information regarding the SMEs, such date including years firm was
operating, number of workers and branches, as well as revenue gathered. The segment presented
scrutiny of demographic information.
21
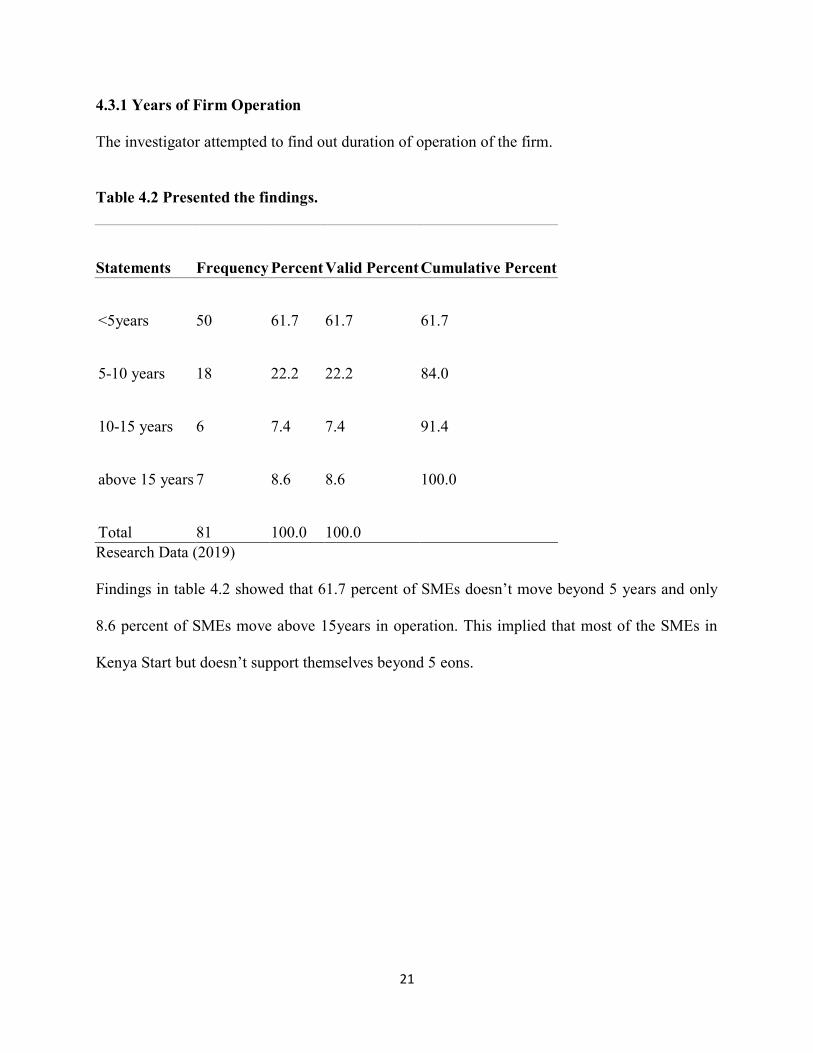
4.3.1 Years of Firm Operation
The investigator attempted to find out duration of operation of the firm.
Table 4.2 Presented the findings.
Statements Frequency Percent Valid Percent Cumulative Percent
<5years 50 61.7 61.7 61.7
5-10 years 18 22.2 22.2 84.0
10-15 years 6 7.4 7.4 91.4
above 15 years 7 8.6 8.6 100.0
Total 81 100.0 100.0
Research Data (2019)
Findings in table 4.2 showed that 61.7 percent of SMEs doesn‟t move beyond 5 years and only
8.6 percent of SMEs move above 15years in operation. This implied that most of the SMEs in
Kenya Start but doesn‟t support themselves beyond 5 eons.
22
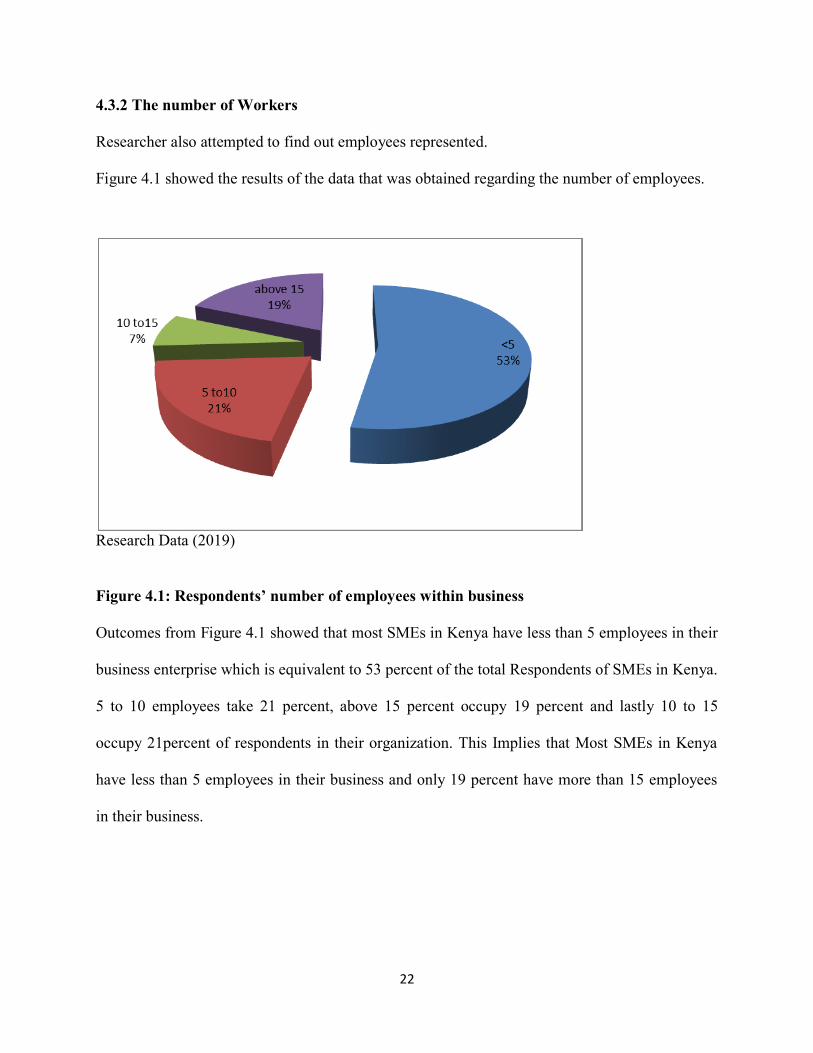
4.3.2 The number of Workers
Researcher also attempted to find out employees represented.
Figure 4.1 showed the results of the data that was obtained regarding the number of employees.
Research Data (2019)
Figure 4.1: Respondents’ number of employees within business
Outcomes from Figure 4.1 showed that most SMEs in Kenya have less than 5 employees in their
business enterprise which is equivalent to 53 percent of the total Respondents of SMEs in Kenya.
5 to 10 employees take 21 percent, above 15 percent occupy 19 percent and lastly 10 to 15
occupy 21percent of respondents in their organization. This Implies that Most SMEs in Kenya
have less than 5 employees in their business and only 19 percent have more than 15 employees
in their business.
23
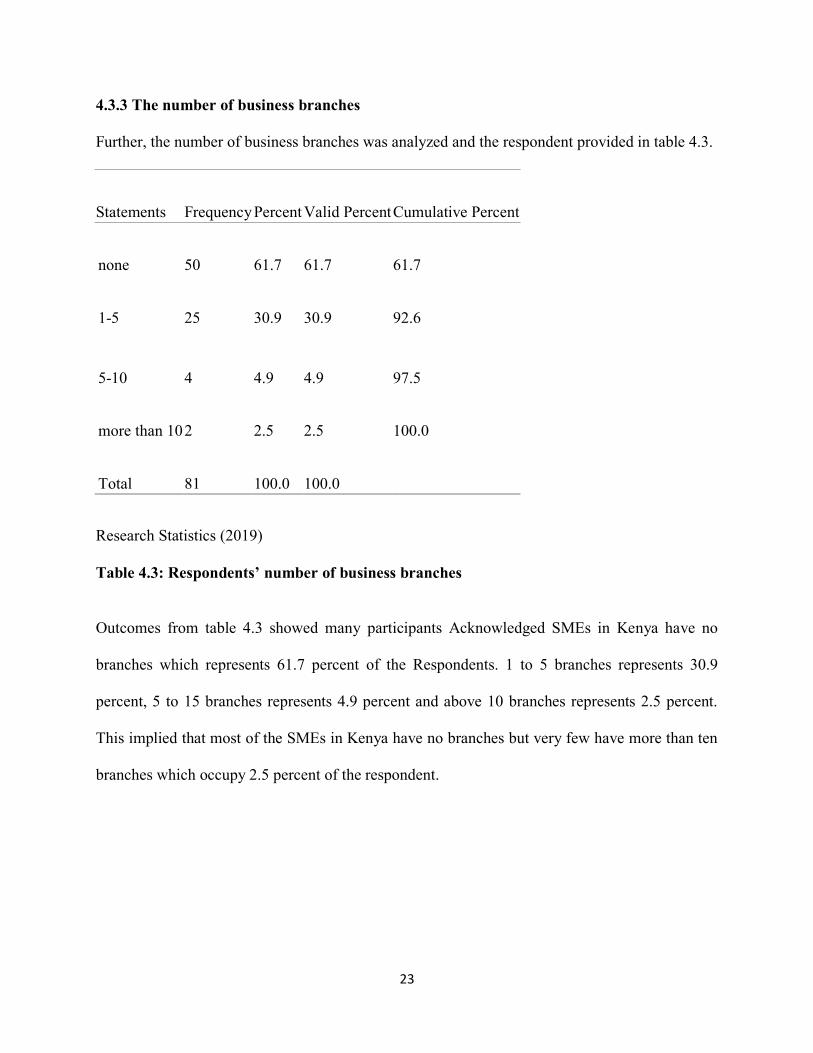
4.3.3 The number of business branches
Further, the number of business branches was analyzed and the respondent provided in table 4.3.
Statements Frequency Percent Valid Percent Cumulative Percent
none 50 61.7 61.7 61.7
1-5 25 30.9 30.9 92.6
5-10 4 4.9 4.9 97.5
more than 10 2 2.5 2.5 100.0
Total 81 100.0 100.0
Research Statistics (2019)
Table 4.3: Respondents’ number of business branches
Outcomes from table 4.3 showed many participants Acknowledged SMEs in Kenya have no
branches which represents 61.7 percent of the Respondents. 1 to 5 branches represents 30.9
percent, 5 to 15 branches represents 4.9 percent and above 10 branches represents 2.5 percent.
This implied that most of the SMEs in Kenya have no branches but very few have more than ten
branches which occupy 2.5 percent of the respondent.
24
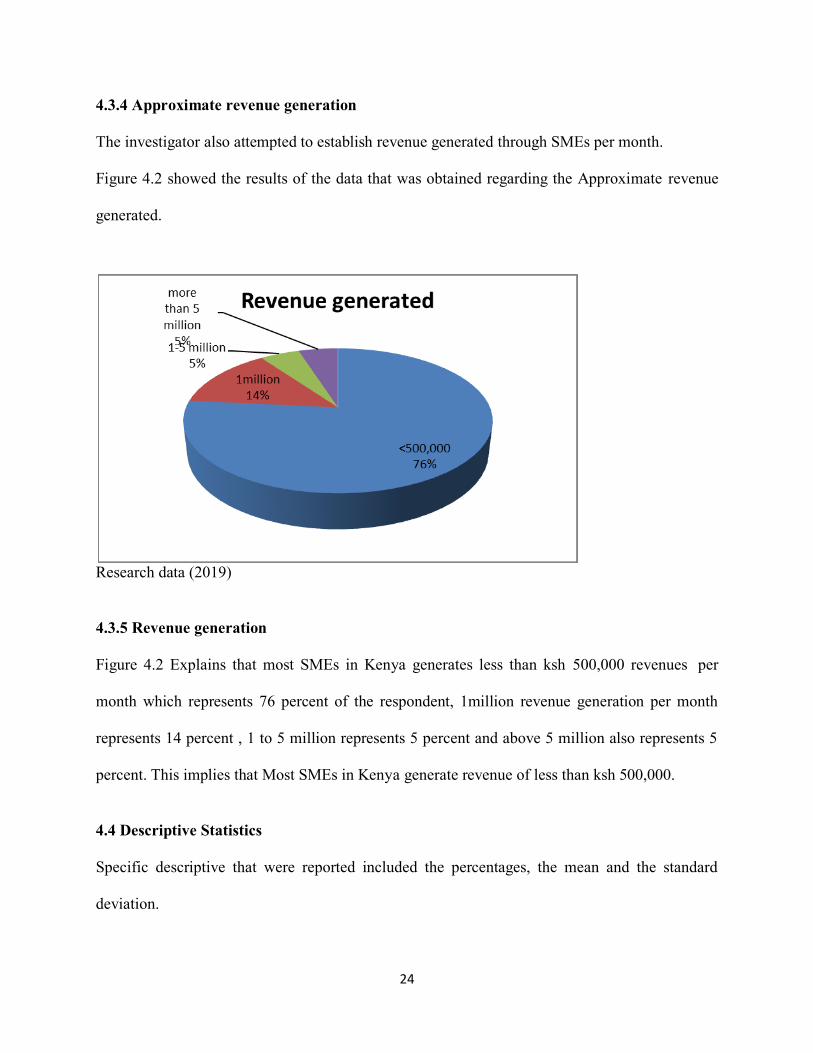
4.3.4 Approximate revenue generation
The investigator also attempted to establish revenue generated through SMEs per month.
Figure 4.2 showed the results of the data that was obtained regarding the Approximate revenue
generated.
Research data (2019)
4.3.5 Revenue generation
Figure 4.2 Explains that most SMEs in Kenya generates less than ksh 500,000 revenues per
month which represents 76 percent of the respondent, 1million revenue generation per month
represents 14 percent , 1 to 5 million represents 5 percent and above 5 million also represents 5
percent. This implies that Most SMEs in Kenya generate revenue of less than ksh 500,000.
4.4 Descriptive Statistics
Specific descriptive that were reported included the percentages, the mean and the standard
deviation.

25
4.4.1 Branding practices
The participants were requested to show extent of agreement regarding the choice of branding
practices. The responses provided were on a Likert scale of 1= never, 2= rarely, 3= sometimes,
4= often, 5= always.
Table 4.2 showed descriptive statistics on branding practices.
Table 4.4: Descriptive Statistics for branding practices
Statements never Rarely sometimes often always Mean Standard
Deviation We use pricing for branding 13.58% 9.88% 18.52% 19.75% 38.27% 3.59 1.43 We use colour for branding 13.58% 1.23% 13.58% 9.88% 61.73% 4.05 1.43 We belief state of birth impacted
buyer choice in consumers 3.70% 11.11% 19.75% 35.80% 29.63% 3.77 1.11 According to us linking of
products with group of company
created preference for such
product 11.11% 8.64% 25.93% 40.74% 13.58% 3.37 1.17
We believe customers buy only
branded products 9.88% 8.64% 16.05% 24.69% 40.74% 3.78 1.33 We belief products endorsed by
celebrities are better branded 4.94% 8.64% 27.16% 33.33% 25.93% 3.67 1.11 We feel company
Sponsorship create stronger
brands 2.47% 2.47% 29.63% 30.86% 34.57% 3.93 .98
We invest in outdoor Marketing 9.88% 4.94% 24.69% 14.81% 45.68% 3.81 1.33 We invest in Advertisement 14.81% 9.88% 11.11% 17.28% 46.91% 3.72 1.50 We use place for branding 11.11% 11.11% 24.69% 40.74% 12.35% 3.32 1.17 Average 3.70 1.26 Research Data (2019)
The findings on Table 4.4 showed many participants who 58.02% settled on using pricing for
branding in their business. The results also showed many participants, 71.61% settled to only
using color for branding to improve their market performance. Additionally, 65.43% of the
26
respondents agreed that they belief state of birth impacted buyer choices among customers.
Further, those who agreed that linking products with firms created inclination for chosen goods
were 54.32% Furthermore, 65.43% agreed that customers buy only branded products. However,
59.26% belief products endorsed by celebrities are better branded and those who feel company
sponsorship create stronger brands were 65.43%.Some agreed to invest in outdoor marketing as
branding practices were 60.49%.Some respondents also agreed to invest in advertisement as a
way of branding their business.
Finally, some decided to use place for branding their enterprises in order to influence marketing
performance and these were 53.09%.
Mean of the respondents was 3.70 further supporting the agreement to the statements regarding
the branding practices. More so, the std.Dev of 1.26 showed that there were variances although
the variation was low.
4.4.2 Marketing Performance
The respondents were requested to show extent of their agreements regarding the Marketing
performance. The responses provided on Likert scale 1= strongly disagree, 2= disagree, 3= not
sure, 4= agree, 5= strongly agree .
27
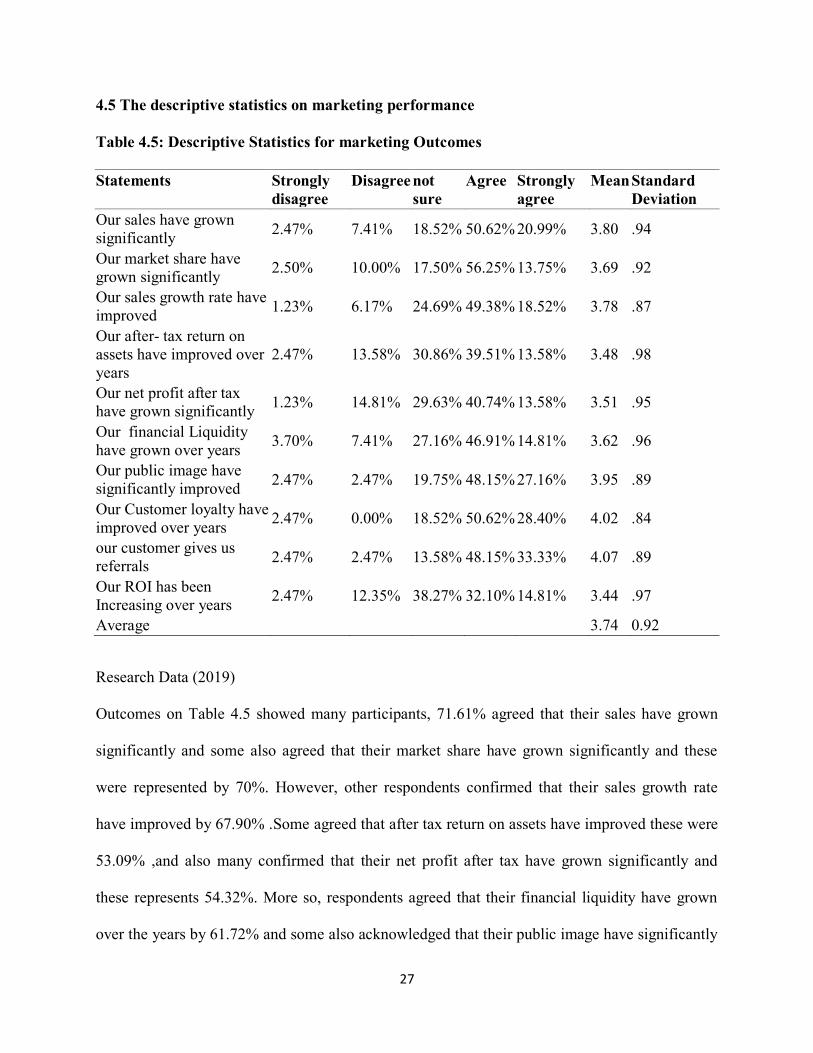
4.5 The descriptive statistics on marketing performance
Table 4.5: Descriptive Statistics for marketing Outcomes
Statements Strongly
disagree Disagree not
sure Agree Strongly
agree Mean Standard
Deviation Our sales have grown
significantly 2.47% 7.41% 18.52% 50.62% 20.99% 3.80 .94 Our market share have
grown significantly 2.50% 10.00% 17.50% 56.25% 13.75% 3.69 .92 Our sales growth rate have
improved 1.23% 6.17% 24.69% 49.38% 18.52% 3.78 .87 Our after- tax return on
assets have improved over
years 2.47% 13.58% 30.86% 39.51% 13.58% 3.48 .98
Our net profit after tax
have grown significantly 1.23% 14.81% 29.63% 40.74% 13.58% 3.51 .95 Our financial Liquidity
have grown over years 3.70% 7.41% 27.16% 46.91% 14.81% 3.62 .96 Our public image have
significantly improved 2.47% 2.47% 19.75% 48.15% 27.16% 3.95 .89 Our Customer loyalty have
improved over years 2.47% 0.00% 18.52% 50.62% 28.40% 4.02 .84 our customer gives us
referrals 2.47% 2.47% 13.58% 48.15% 33.33% 4.07 .89 Our ROI has been
Increasing over years 2.47% 12.35% 38.27% 32.10% 14.81% 3.44 .97 Average 3.74 0.92
Research Data (2019)
Outcomes on Table 4.5 showed many participants, 71.61% agreed that their sales have grown
significantly and some also agreed that their market share have grown significantly and these
were represented by 70%. However, other respondents confirmed that their sales growth rate
have improved by 67.90% .Some agreed that after tax return on assets have improved these were
53.09% ,and also many confirmed that their net profit after tax have grown significantly and
these represents 54.32%. More so, respondents agreed that their financial liquidity have grown
over the years by 61.72% and some also acknowledged that their public image have significantly
28
improved by 75.31%.Other Respondent also agreed that their customer loyalty have improved
over years representing 79.02%. Nevertheless, many respondents agreed that their customers
gives them referrals and this represented 81.48%. Finally, some respondents also agreed that
their ROI has been increasing over the years this represented 46.91%. The responses mean was
3.74 which further supported the agreement to the statements regarding marketing performance.
More so, the standard deviation 0.92 showed replies varied although variation was low.
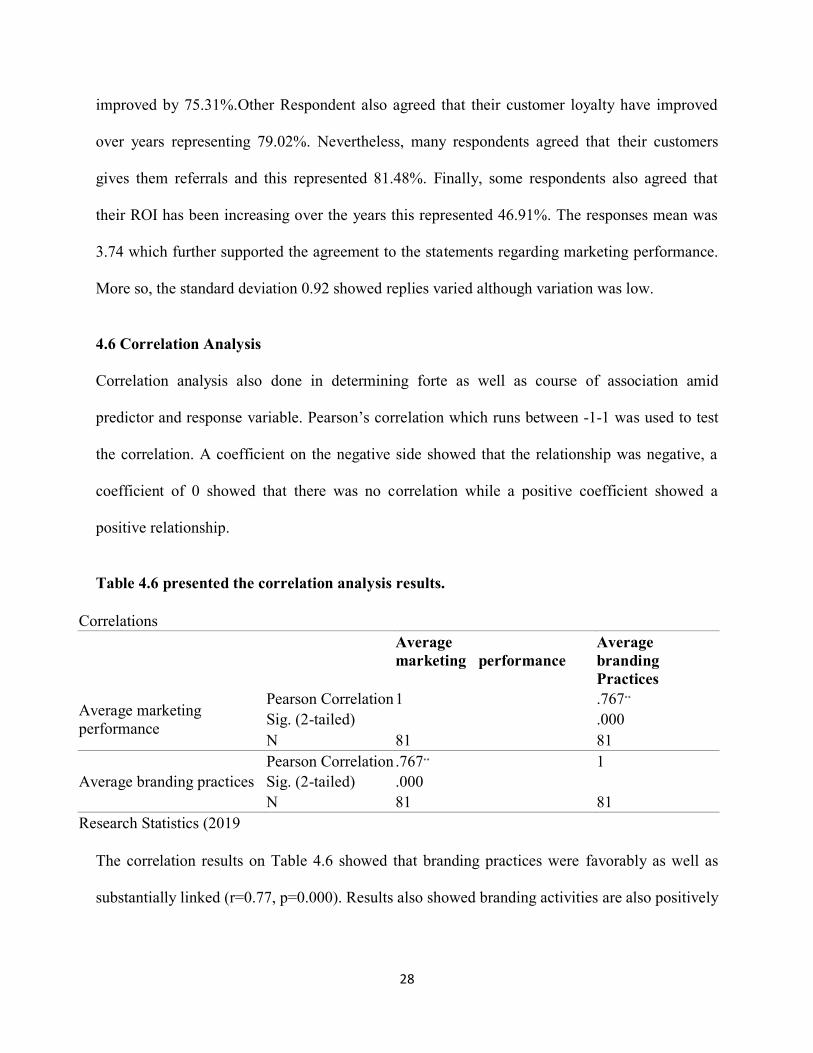
4.6 Correlation Analysis
Correlation analysis also done in determining forte as well as course of association amid
predictor and response variable. Pearson‟s correlation which runs between -1-1 was used to test
the correlation. A coefficient on the negative side showed that the relationship was negative, a
coefficient of 0 showed that there was no correlation while a positive coefficient showed a
positive relationship.
Table 4.6 presented the correlation analysis results.
Correlations
Average
marketing performance Average
branding
Practices Average marketing
performance Pearson Correlation 1 .767** Sig. (2-tailed)
.000 N 81 81
Average branding practices Pearson Correlation .767** 1 Sig. (2-tailed) .000
N 81 81 Research Statistics (2019
The correlation results on Table 4.6 showed that branding practices were favorably as well as
substantially linked (r=0.77, p=0.000). Results also showed branding activities are also positively
29
as well as substantially linked(r=0.77, p=0.000. It implied introducing new branding practice
would lead to an improvement or desirable impact on business outcomes.
4.7 Regression Analysis
Multiple regression analysis conducted to determine association amid predictor and response
variable.
4.7.1 Model of Fitness
A model of fitness highlighted in Table 4.7
Model Summary
Model R R Square Attuned R Square Std. Error of Estimate
1 .767a .588 .583 .43227 Research Data (2019)
The results indicated an R squared of 0.59. This means predictor variables explained 74% of
total variation in the dependent variable. The remaining 41% was shown other aspects not
contained within the study.
4.7.2 Analysis of Variance
F-test carried out to assess impact of predictor variables on response variable concurrently. F-
statistic test simply shows if predictor variables of model impact response variable.
30
Table 4.8: ANOVA Results
ANOVAa
Model Totality of Squares df Mean Square F Sig.
1
Regression 21.086 1 21.086 112.844 .000b
Residual 14.762 79 .187
Aggregate 35.848 80
Research Data (2019) Based on outcomes of ANOVA Test or F-test of Table 4.8, got F-calculated as 112.844, which
was greater than F-critical (2.53) having significance of 0.000. As this level of 0.000<0.05 we
conclude predictor variables influence market outcomes and this meant overall, it was
significant. This implied that model would be significant in explaining the market performance.
This is in line with (Ateke & Iruka, 2015; Adejoke & Adekemi, 2012; Asiegbu, Awa, Akpotu &
Ogbonna 2011) who argues that,Market performance has thus continued to enjoy very attractive
investigations from practitioners and academics .Also, Salojärvi, Ritala, Sainio, Saarenketo,
(2015) agrees consumer association created affirmative impact on market outcomes.
4.8: Regression of Coefficients
Table 4.9: Model Coefficients
Statements B Std. Error Beta t sig
1 (Constant) 1.326 .227
5.827 .000
Average branding .638 .060 .767 10.623 .000 Research Data (2019)
31
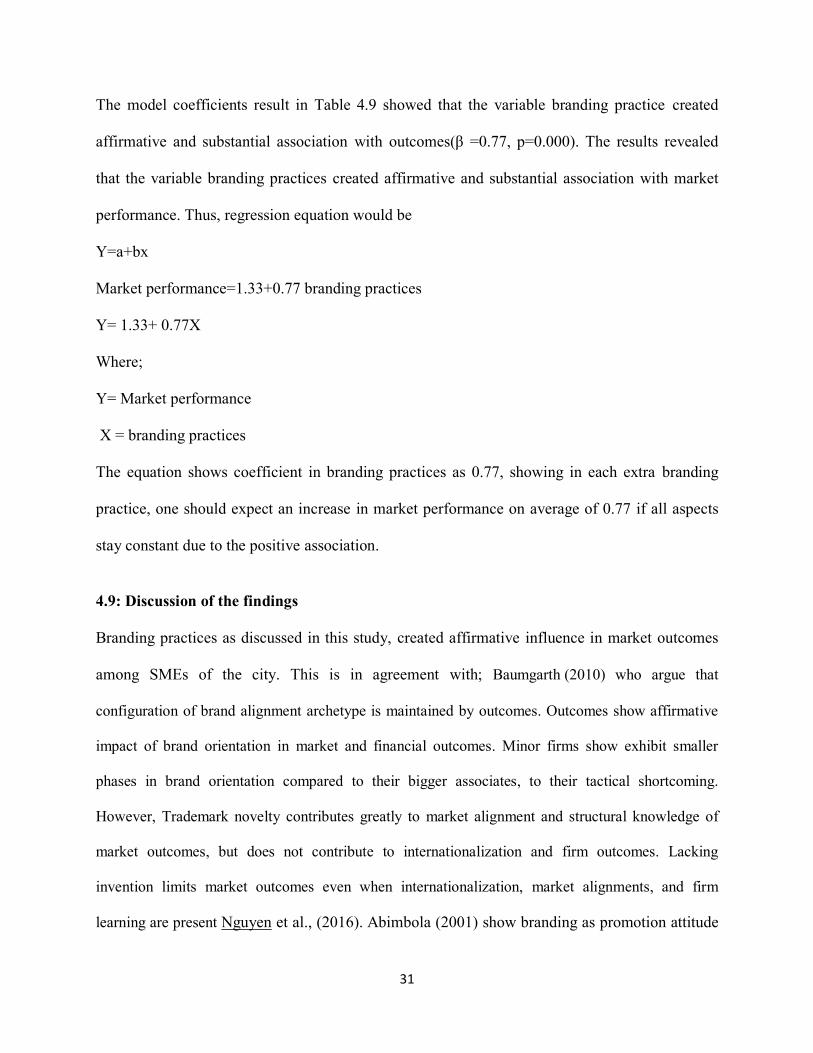
The model coefficients result in Table 4.9 showed that the variable branding practice created
affirmative and substantial association with outcomes(β =0.77, p=0.000). The results revealed
that the variable branding practices created affirmative and substantial association with market
performance. Thus, regression equation would be
Y=a+bx
Market performance=1.33+0.77 branding practices
Y= 1.33+ 0.77X
Where;
Y= Market performance
X = branding practices
The equation shows coefficient in branding practices as 0.77, showing in each extra branding
practice, one should expect an increase in market performance on average of 0.77 if all aspects
stay constant due to the positive association.
4.9: Discussion of the findings
Branding practices as discussed in this study, created affirmative influence in market outcomes
among SMEs of the city. This is in agreement with; Baumgarth (2010) who argue that
configuration of brand alignment archetype is maintained by outcomes. Outcomes show affirmative
impact of brand orientation in market and financial outcomes. Minor firms show exhibit smaller
phases in brand orientation compared to their bigger associates, to their tactical shortcoming.
However, Trademark novelty contributes greatly to market alignment and structural knowledge of
market outcomes, but does not contribute to internationalization and firm outcomes. Lacking
invention limits market outcomes even when internationalization, market alignments, and firm
learning are present Nguyen et al., (2016). Abimbola (2001) show branding as promotion attitude

32
relevant to entrepreneurial mission in enhancing demand thus leading to relative gain. It aims to
show suitability of branding among SME, as well as recognize applicable strategies SMEs follow
to create fruitful brand.

33
CHAPTER FIVE: SUMMARY, INFERENCES AND RECOMMENDATIONS
5.1 Introduction
It outlines summary of outcomes, inferences and endorsements, done as per study goals. Its
purpose was to establish the relationship of branding activities market outcomes among SMEs in
Nairobi city through descriptive analysis. Specifically, it attempted solving problem; Association
in branding practices relating to market outcomes among SMEs? Does branding practices
influence market performance? It used a descriptive research design and targeted business
owners, marketing managers and directors whereby survey was adopted to gather data. This was
scrutinized using descriptive and inferential statistics.
5.2 Summarization
Specific factors considered for this study were branding practices and marketing performance.
Analysis was done by Statistical Package for Social Sciences (SPSS). Statistics gathered on
demographic data, participants as well as form was assessed basing on rates and proportions.
Correlation analysis attempted to assess substantial issues using p value of 0.05 as base.
Inferential statistics including regression analysis assessed extent of variance due to individual
issues.
5.2.1 Relationship of branding practices and marketing performance
One research objectives entailed determine association of branding practices with market
outcomes in SMEs. It showed branding practices exhibited affirmative and substantial
association with market outcomes of SMEs. It based on
34
(Memili et al, 2010) who has fruitfully shown promoting firms with distinct brand contributed to
research outcomes among SMEs. However, Branding as a concept has been
extensively researched by the academia and business practitioners
(Marakarun and Panjakajornak, 2017; Kilie, et al., 2016; Cetin, etal.,2016; Park and Bai, 2014)
examining its impact on other market performance measures.
5.3 Conclusion
The outcomes of research settled branding practices created positive association with market
performance. The branding practices that influence marketing performance include; colour,
pricing, outdoor marketing, advertising, place branding and location branding
Management should focus on branding practices since some customers consider only branded
products. For that reason business owners should embrace branding practices so that their
business can stand out in the market of many competitors.
5.4 Recommendations
Following the outcomes of the research, this study makes these endorsements;
It recommended the management of the SMEs to consider the prices of their products invest in
outdoor marketing and also consider a lot of advertisements. The Management also should
consider other branding practices that can positively influence their businesses for instance place
branding, location branding, internal branding and branding new venture. It fronts executives and
SME operators to appreciate and expect variations in technological setting, using expertise to
meet human desires.
35
5.5 Limitations of Study
The research was restricted in various ways. First, the researcher encountered limitations while
distributing the questionnaires with some respondents being reluctant of providing the responses.
Nevertheless, researcher guaranteed respondents their data would remain private and only used
for academic purpose. Researcher was restricted basing on respondents taking too long to
respond to the questionnaire and return. To solve this, the researcher made some reminders to the
respondents. Time and costs were also some of the limitations encountered during the study
process.
5.6 Recommendations for More Research
Current research was restricted on branding practices influencing market performance.
Therefore, future researchers could consider furthering this study by focusing on other factors
that can influence market performance of SMEs. Other researchers could also work on other
industries apart from the SMEs.

36
REFERENCES
Adejoke, K. B., & Adekemi, A. O. (2012). Relationship marketing and bank performance: An
applied study on commercial banks in southwestern Nigeria. European Journal of
Business and Management, 4(10), 102-110.
Adjei, M. T., Noble, S. M., & Noble, C. H. (2010). The influence of C2C communications in
online brand communities on customer purchase behavior. Journal of the Academy of
Marketing Science, 38(5), 634-653.
Aron, A., & Aron, E. N. (1986). Love and the expansion of self: Understanding attraction and
satisfaction. Hemisphere Publishing Corp/Harper & Row Publishers.
Ateke, B. W., & Iruka, C. H. (2015). Investigating the relationship between customer
involvement management and marketing performance in the manufacturing industry.
International Journal, 22.
Backhouse, R. E., & Boianovsky, M. (2012). Transforming modern macroeconomics: exploring
disequilibrium microfoundations, 1956–2003. Cambridge University Press.
Baddeley, A., & Lewis, V. (2017). Inner active processes in reading: The inner voice, the inner
ear, and the inner eye. In Interactive processes in reading (pp. 107-129). Routledge.
Beck, S., & Kenning, P. (2015). The influence of retailers‟ family firm image on new product
acceptance: An empirical investigation in the German FMCG market. International
Journal of Retail & Distribution Management, 43(12), 1126-1143.
Benhabib, R. J., Iwens, R. P., & Jackson, R. L. (1981). Stability of large space structure control
systems using positivity concepts. Journal of Guidance and Control, 4(5), 487-494.
Blombäck, A., & Ramírez-Pasillas, M. (2012). Exploring the logics of corporate brand identity
formation. Corporate Communications: An International Journal, 17(1), 7-28.
Blumberg, B., Cooper, D. R., & Schindler, P. S. (2008). Business research methods (Vol. 2).
London: McGraw-Hill Higher Education.
Brendan J. Gray (2006) Benchmarking Services Branding Practices, Journal of Marketing
Management, 22:7-8, 717-758
Bresciani, S., & Eppler, M. J. (2010). Brand new ventures? Insights on start-ups' branding
practices. Journal of Product & Brand Management, 19(5), 356-366.
Bright, T. J., Wong, A., Dhurjati, R., Bristow, E., Bastian, L., Coeytaux, R. R., ... & Wing, L.
(2012). Effect of clinical decision-support systems: a systematic review. Annals of
internal medicine, 157(1), 29-43.
37
Carter, E. E. (1971). The behavioral theory of the firm and top-level corporate decisions.
Administrative Science Quarterly, 16(4).
Connelly, B. L., Certo, S. T., Ireland, R. D., & Reutzel, C. R. (2011). Signaling theory: A review
and assessment. Journal of management, 37(1), 39-67.
Costello, E. K., Lauber, C. L., Hamady, M., Fierer, N., Gordon, J. I., & Knight, R. (2009).
Bacterial community variation in human body habitats across space and time. Science,
326(5960), 1694-1697.
Fan, M., Bai, M. Y., Kim, J. G., Wang, T., Oh, E., Chen, L., ... & Wang, Z. Y. (2014). The
bHLH transcription factor HBI1 mediates the trade-off between growth and pathogen-
associated molecular pattern–triggered immunity in Arabidopsis. The Plant Cell, 26(2),
828-841.
Farrington, S., Venter, E., & Richardson, B. (2018). The influence of selected marketing and
branding practices on the financial performance of family SMEs. Southern African
Business Review, 22(1).
Farrington, S., Venter, E., & Richardson, B. (2018). The influence of selected marketing and
branding practices on the financial performance of family SMEs. Southern African
Business Review, 22(1).
Feltz, D. L., Chow, G. M., & Hepler, T. J. (2008). Path analysis of self-efficacy and diving
performance revisited. Journal of Sport and Exercise Psychology, 30(3), 401-411.
Gilmore, A., & Carson, D. (2018). SME marketing: efficiency in practice. Small Enterprise
Research, 25(3), 213-226.
Grant, R. M. (1991). The resource-based theory of competitive advantage: implications for
strategy formulation. California management review, 33(3), 114-135.
Highhouse, S., Lievens, F., & Sinar, E. F. (2003). Measuring attraction to organizations.
Educational and psychological Measurement, 63(6), 986-1001.
Horsfall, H., & Mac-Kingsley, I. Brand Equity and Market Performance: An Empirical Study of
Food and Beverage Firms in Rivers State. Isenhower, L., Urban, E., Zhang, X. L., Gill, A. T., Henage, T., Johnson, T. A., ... & Saffman, M.
(2010). Demonstration of a neutral atom controlled-NOT quantum gate. Physical review
letters, 104(1), 010503.
Kombo, D. K., & Tromp, D. L. (2006). Proposal and thesis writing: An introduction. Nairobi:
Paulines Publications Africa, 5, 814-30.
Kothari, S. P., & Warner, J. B. (2007). Econometrics of event studies. In Handbook of empirical
corporate finance (pp. 3-36). Elsevier.
38
Kotler, P., & Armstrong, G. (2010). Principles of marketing. Pearson education.
Liu, X., Hu, M. Y., & Grimm, P. E. (2010). Affect transfer in brand extensions: the role of
expectancy and relevancy. Journal of Product & Brand Management, 19(5), 317-326.
Memili, E., Eddleston, K. A., Kellermanns, F. W., Zellweger, T. M., & Barnett, T. (2010). The
critical path to family firm success through entrepreneurial risk taking and image.
Journal of Family Business Strategy, 1(4), 200-209.
Njau, J. N., & Karugu, W. (2014). Influence of E-Marketing on the performance of Small and
Medium enterprises in Kenya: a Survey of Small and medium enterprises in the
Manufacturing Industry in Kenya. International Journal of Business & Law Research,
2(1), 62-70.
Okotoh, M. A. (2015). The Perceived Effect of Reward Management Practices On Factors
Influencing Employee Retention at Communications Authority of Kenya a Research
Project Submitted in Partial Fulfilment of the Requirements for The Award of the Degree
of Master of Science in Human Resource Management. School of Business, University of
Nairobi.
Pace, K. M., Fediuk, T. A., & Botero, I. C. (2010). The acceptance of responsibility and
expressions of regret in organizational apologies after a transgression. Corporate
communications: An international journal, 15(4), 410-427.
Pérez-Cabañero, C., González-Cruz, T., & Cruz-Ros, S. (2012). Do family SME managers
value marketing capabilities' contribution to firm performance?Marketing
Intelligence & Planning, 30(2), 116-142.
Pérez-Cabañero, C., González-Cruz, T., & Cruz-Ros, S. (2012). Do family SME managers value
marketing capabilities' contribution to firm performance?Marketing Intelligence &
Planning, 30(2), 116-142.
Stephens, P. J., Tarpey, P. S., Davies, H., Van Loo, P., Greenman, C., Wedge, D. C., ... & Yates,
L. R. (2012). The landscape of cancer genes and mutational processes in breast cancer.
Nature, 486(7403), 400.
Sundaramurthy, C., & Kreiner, G. E. (2008). Governing by managing identity boundaries: The
case of family businesses. Entrepreneurship Theory and Practice, 32(3), 415-436.
Tanakinjal, G. H., Deans, K. R., & Gray, B. J. (2010). Third screen communication and the
adoption of mobile marketing: A Malaysia perspective. International Journal of
Marketing Studies, 2(1), 36.
39
Warner, J. W., Liu, Z. H., Abraham, S., Krishnaprasad, M., Arora, G., Murthy, R., ... & Arora,
N. S. (2010). U.S. Patent No. 7,853,573. Washington, DC: U.S. Patent and Trademark
Office.
Waweru, C., & Ngugi, K. (2014). Influence of financial management practices on the
performance of micro and small enterprises in Kenya. European Journal of Business
Management, 1(11), 141-161.
Yew Wong, K. (2005). Critical success factors for implementing knowledge management in
small and medium enterprises. Industrial management & Data systems, 105(3), 261-279.
Yin Wong, H., & Merrilees, B. (2008). The performance benefits of being brand-orientated.
Journal of Product & Brand Management, 17(6), 372-383.
Zachary, R. K. (2011). The importance of the family system in family business. Journal of
Family Business Management, 1(1), 26-36.
40
APPENDICES
Appendix 1
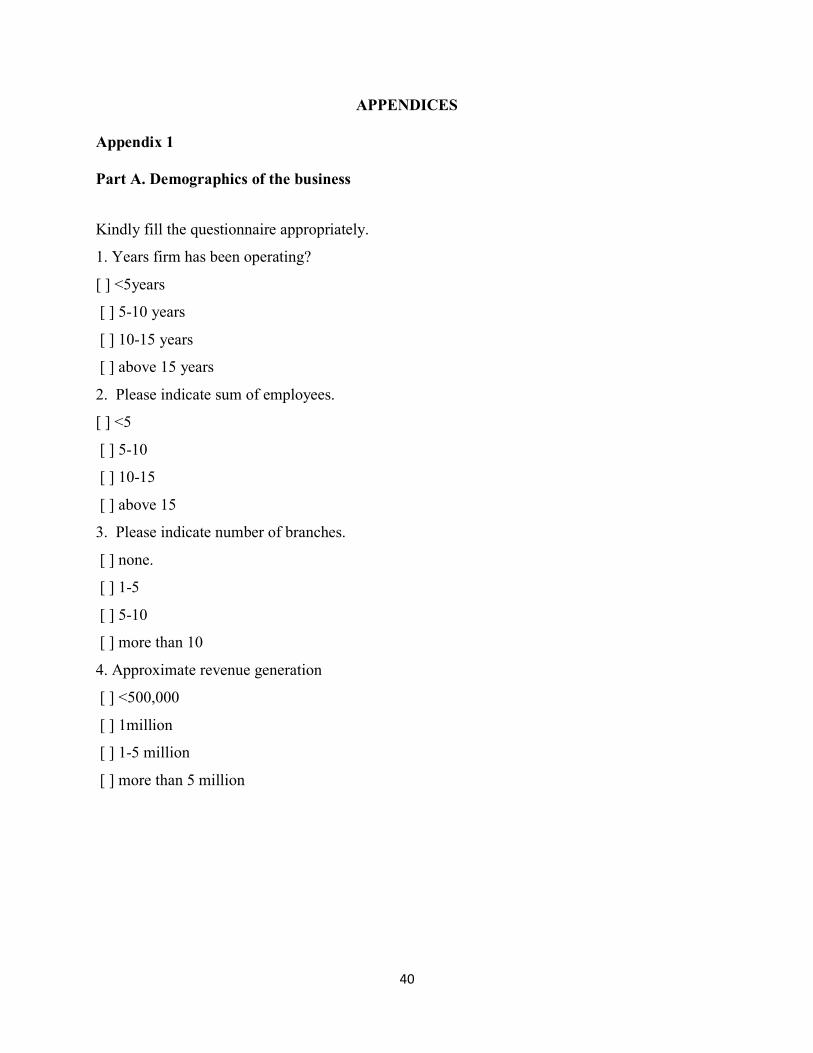
Part A. Demographics of the business
Kindly fill the questionnaire appropriately. 1. Years firm has been operating? [ ] <5years [ ] 5-10 years [ ] 10-15 years [ ] above 15 years 2. Please indicate sum of employees. [ ] <5 [ ] 5-10 [ ] 10-15 [ ] above 15 3. Please indicate number of branches. [ ] none. [ ] 1-5 [ ] 5-10 [ ] more than 10 4. Approximate revenue generation [ ] <500,000 [ ] 1million [ ] 1-5 million [ ] more than 5 million
41
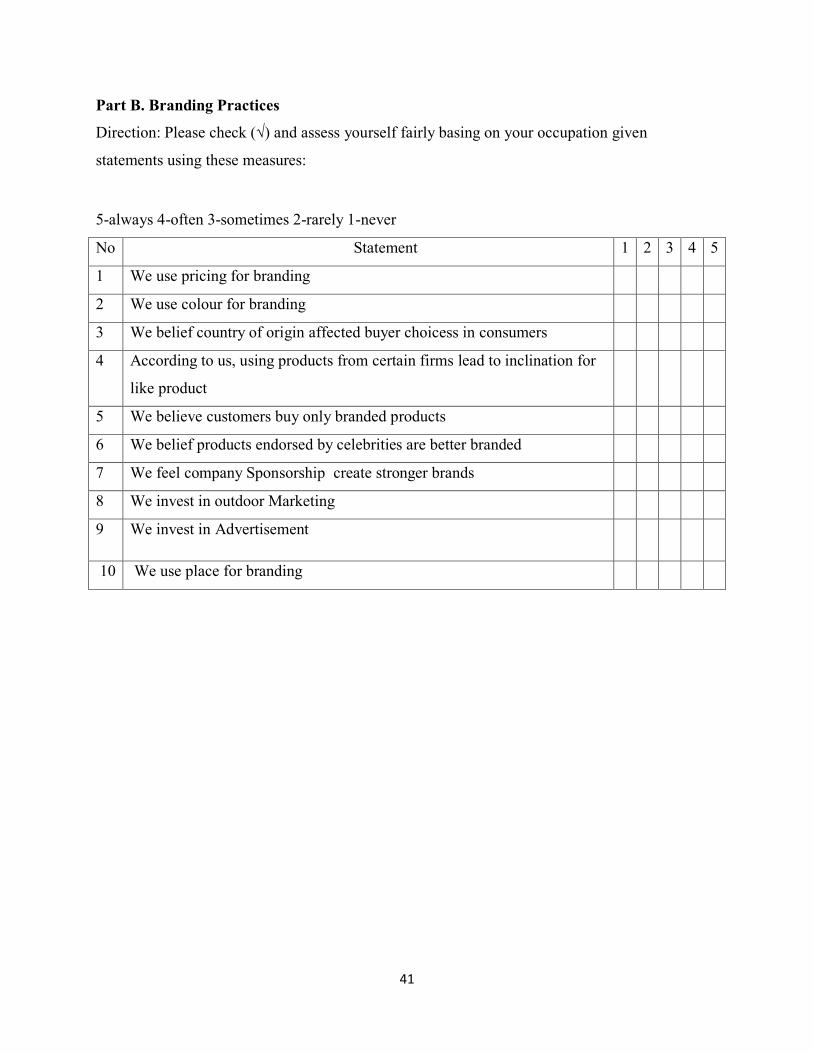
Part B. Branding Practices Direction: Please check (√) and assess yourself fairly basing on your occupation given
statements using these measures:
5-always 4-often 3-sometimes 2-rarely 1-never No Statement 1 2 3 4 5 1 We use pricing for branding 2 We use colour for branding 3 We belief country of origin affected buyer choicess in consumers 4 According to us, using products from certain firms lead to inclination for
like product
5 We believe customers buy only branded products 6 We belief products endorsed by celebrities are better branded 7 We feel company Sponsorship create stronger brands 8 We invest in outdoor Marketing 9 We invest in Advertisement
10 We use place for branding
42
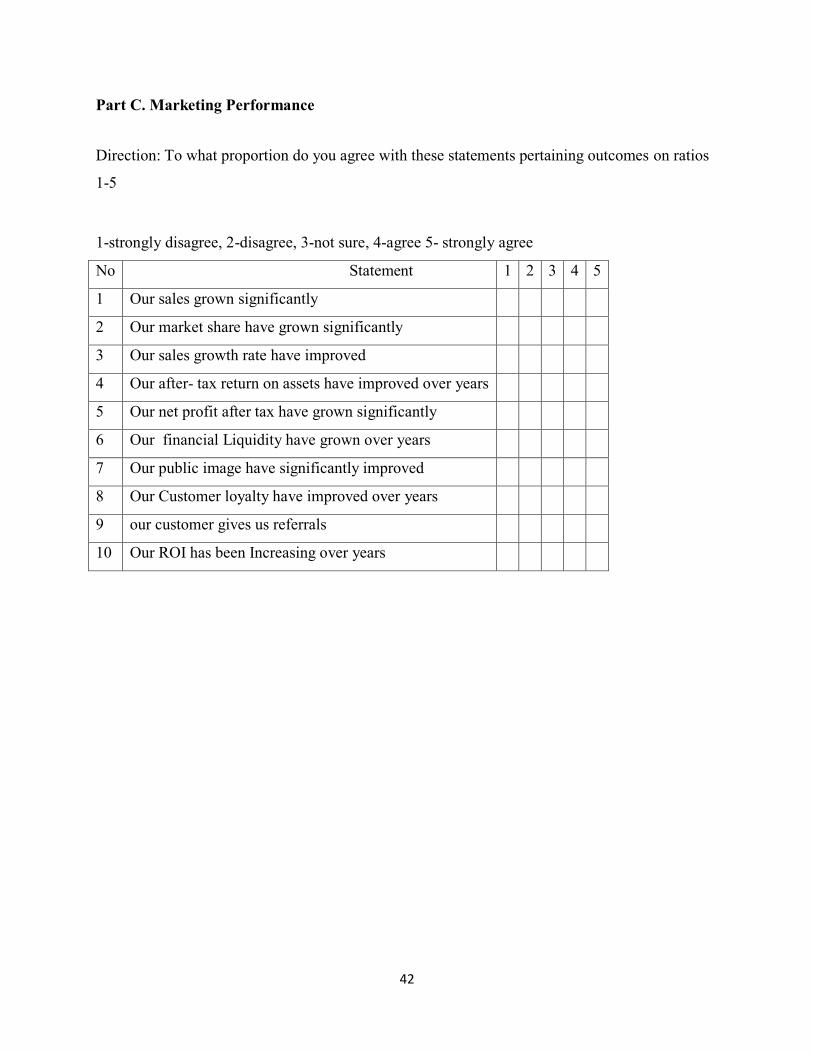
Part C. Marketing Performance
Direction: To what proportion do you agree with these statements pertaining outcomes on ratios
1-5
1-strongly disagree, 2-disagree, 3-not sure, 4-agree 5- strongly agree No Statement 1 2 3 4 5 1 Our sales grown significantly 2 Our market share have grown significantly 3 Our sales growth rate have improved 4 Our after- tax return on assets have improved over years 5 Our net profit after tax have grown significantly 6 Our financial Liquidity have grown over years 7 Our public image have significantly improved 8 Our Customer loyalty have improved over years 9 our customer gives us referrals 10 Our ROI has been Increasing over years