Embed Size (px)
Citation preview

Swedish University of Agricultural Sciences Faculty of Veterinary Medicine and Animal Science
Relationship between Natural Antibody levels and Somatic Cell Count in Dairy Cattle Jyothy Sreedharan
Examensarbete / Swedish University of Agricultural Sciences, Department of Animal Breeding and Genetics,
382
Uppsala 2012
Master’s Thesis, 30 HEC
Erasmus Mundus Programme – European Master in Animal Breeding and Genetics


Swedish University of Agricultural Sciences Faculty of Veterinary Medicine and Animal Science Department of Animal Breeding and Genetics
Relationship between Natural Antibody levels and Somatic Cell Count in Dairy Cattle Jyothy Sreedharan Supervisor: Katja Grandinson, SLU, Department of Animal Breeding and Genetics Henk Bovenhuis and Jan van der Poel, WU, Austria Examiner: Erling Strandberg, SLU, Department of Animal Breeding and Genetics Credits: 30 HEC Course title: Degree project in Animal Science Course code: EX0556 Programme: Erasmus Mundus Programme - EMABG Level: Advanced, A2E Place of publication: Uppsala Year of publication: 2012 Name of series: Examensarbete / Swedish University of Agricultural Sciences,
Department of Animal Breeding and Genetics, 382 On-line publication: http://epsilon.slu.se Key words: mastitis, somatic cell score, natural antibodies, relationship, heritability

1
Relationship between Natural Antibody levels and Somatic Cell Count in Dairy Cattle
Jyothy Sreedharan
Abstract
At present mastitis in dairy cattle is detected by using somatic cell count and various
bacterial diagnostic tests. Still it is difficult to understand the exact health status of the animal
by mere observation of the test results, since there maybe presence of sub-clinical cases.
There are indications in other species like poultry that natural antibodies might be used as
indicators for the identification of (more) disease resistant individuals (Wijga, 2009). The
present study focuses on the relationship between the natural antibody titres collected at a
single sampling moment and the somatic cell count later inn the lactation. If proven, natural
antibodies can be used as indicators for the immune status of the animal. For the present
research the preliminary analysis of the fixed effects were analysed using the SAS software
and the genetic parameters were estimated using the ASReml software. The results from the
analyses show that relationships between the NAb titres and SCS after the sampling moment
exists, but with a trend expressing a positive correlated response. The study shows that the
NAb levels do not show a protective effect on the animal as the cell counts later in the
lactation increased when the NAb levels increased. Hence NAb titre measured in milk
samples may not be useful as a tool against mastitis selection Keywords: Mastitis, somatic cell score, Natural antibodies, relationship, heritability.
Introduction
Mastitis is an economically important disease in dairy cattle caused mainly by
bacteria, but also by viral or fungal pathogens, leading to inflammation and subsequent
pathological changes in the udder. It still remains a major cause for economic loss in the
dairy industry. A much desired preventive measure against mastitis is selection of mastitis
resistant animals. Improving the immune status of the animal is one way in this direction.
Until now most research has focussed on selection based on somatic cell count of milk.
(Miller and Paape, 1985, Kehrli and Shuster, 1994, Smith, 1996).The somatic cell count
(SCC) in milk is affected by the infection status of the mammary gland and hence reflects the
health condition of the animal (Miller and Paape, 1985). These cells include lymphocytes,
macrophages, polymorphonuclear (PMN) cells and some epithelial cells (Pillai, et al, 2001),

2
which shows elevated levels during infectious condition, indicating an active immune
response. During infection the number of inflammatory cells increase considerably, for
example, PMN cells increase from 5-12 percent to 90 percent (Kehrli and Shuster, 1994).
The genetic correlation between lactation mean SCC and clinical mastitis (CM) is observed to
be positive (Philipsson et al., 1995) and ranges from 0.3 (Weller et al., 1992) to 0.79
(Philipsson et al., 1995). Smith (1996) proposed that cows with somatic cell count more than
300,000 cells/ml are probably clinically infected.
Natural antibodies (NAbs) are a part of innate humoral defence mechanism. The four
bovine natural antibodies are the immunoglobulins – IgA, IgG1, IgG2, and IgM. NAbs
provide an initial broad protection against micro-organisms (Rainard & Riollet, 2006). NAbs
have a regulatory function in initiating immune system (Ochsenbein et al., 1999) and react to
initial infection by detection of certain pathogen-associated molecular patterns (PAMPs)
(Bannerman et al., 2004). It was demonstrated by van Knegsel et al. (2007), that NAbs can be
determined in milk. It is hypothesized that animals with high NAbs have an increased
immunity and thus less susceptible to mastitis (Grabar, 1983, Tomer and Shoenfeld Y., 1988,
Ochsenbein et. al., 1999).
de Weerd (2009) showed that IgM levels in milk was negatively correlated with the
probability of incidence of mastitis within 90 days after the sampling moment. This is an
indication that a cow low in IgM, is more susceptible to infection. de Weerd also observed
that the IgG1 level was positively correlated to SCC later in lactation, suggesting that IgG1
can be used as early predictor for the probability of infection. This indicates that a cow
having a high IgG1 titre would have a high SCC, indicating presence of infection. The IgM
level was found to be predictive for resistance against mastitis within 90 days after sampling.
In the above study, family relations that existed in the data were not accounted for. Wijga
(2008) studied the relation between somatic cell count and NAbs measured in the same milk
sample. Wijga (2008) showed moderate genetic correlations of –0.48 between the antigen
peptidoglycan (PGN) and SCS (somatic cell scores, which are the natural logarithms of SCC)
to a positive genetic correlation of 0.35 between SCS and the antigen lipoteichoic acid
(LTA). The results from by de Weerd (2009) and Wijga (2008) are promising, and more
exploration can be done by incorporating the pedigree information which was not used in the
studies. So the results may help to identify and utilize more reliable predictors indicating the
immune status of the animal. The present study utilizes the same dataset used by de Weerd

3
and Wijga, where the present work concentrates more on the relationship between the NAb
titres at a sampling moment and the SCS later stages of lactation.
The aim of the present study is to estimate the relationship between the natural
antibody level collected at one sampling moment and the somatic cell count later in that
lactation.
Materials and methods
The total dataset consisted of 2025 cows in their first parity originating from 398
farms. These animals were part of the Milk Genomics project that emphasizes on the genetics
of milk composition. The farms took part in the Milk Production Registration (MPR) which
is a system for recording milk production and udder health status of the cows. Milk samples
are collected at regular intervals of 3, 4 or 6 weeks and analyzed for somatic cell count, fat
and protein percentage. Information available on milk samples are NAb titres at a single
sampling moment, the routine SCC measurements, dates of sample collection, calving
season, the calving dates, the calving age and days in lactation.
Milk samples collected from the cows are analyzed at regular intervals of 3, 4 or 6
weeks for SCC. The somatic cell count is converted to their respective somatic cell score
(SCS) by using the natural logarithm values. An aliquot of the milk sample was taken during
the regular milk recording and used to measure NAbs binding to specific pathogen associated
molecular patterns (PAMP). NAb binding was determined by using an indirect ELISA
technique (van Knegsel et al., 2007). The NAbs binding to keyhole limpet hemocyanin
(KLH), lipopolysaccharide (LPS) from E. coli, lipoteichoic acid (LTA) from S. aureus and
peptidoglycan (PGN) from S. aureus were determined in individual samples. The moment at
which the sample is taken for the analysis of the NAb levels is referred to as the “sampling
moment.” These observations are used to determine the relationship between the natural
antibody titres measured at one test-day and the somatic cell counts later in that lactation. It is
also analysed whether the cell count at the sampling moment had significant effects on the
before and after cell counts in the lactation and compared with the effect of the NAb titres on
the cell counts after the sampling moment.
The LTA antibodies are classified into different immunoglobulin isotypes as LTAG1
for IgG1, LTAG2 for IgG2, LTAA for IgA and LTAM for IgM. There is also a measurement
of IgG1, IgG2, IgA and IgM together denoted as LTA. For the LPS, PGN and KLH, the

4
measurement of the total antibodies are observed and represented as LPS, PGN and KLH
respectively.
Cell count traits
Cell count traits analysed include include the average SCS before (b4scs), SCS at
(SCSsample), the average SCS after the sampling moments (afscs), the standard deviation of
the SCS before (b4stdscs) and the standard deviation of SCS after the sampling moment
(afstdscs). Traits are defined as:
SCS at the sampling moment:
( )scc/1000LnSCSsample =
SCS before the sampling moment:
( )∑ ==
n
1i/nLnb4sccb4scs
SCS after the sampling moment:
∑ ==
n
1in(Lnafscc)/afscs
Standard deviation of the SCS before the sampling moment:
2n
1i)b4scs(b4scs1)1/(nb4stdscs ∑ =
−−=
Standard deviation of the SCS after the sampling moment
2n
1i)afscs(afscs1)1/(nafstdscs ∑ =
−−=
where n corresponds to the number of test days contributing to the mean or standard
deviation.
Data editing
The number of days in lactation beyond 400 days is eliminated in the lactation days
after the sampling moment. The number of samples per animal before and after the sampling
moments is also calculated. The mean values of the somatic cell score before, at and after the
sampling moment are calculated with the minimum value per animal being more than 1. The
standard deviations for SCS before (b4stdscs) and after (afstdscs) sampling moment were
calculated and the minimum number of samples per animal was taken as 4.
Statistical analysis
The general linear model (SAS, PROC GLM procedure) is used for statistical
analysis. The statistical analysis to estimate the relationship between natural antibody titres

5
and the somatic cell count later during the lactation are performed in ASREML. Depending
upon the trait analysed, slightly different models were used. The base model is:
yijkl = μ + b1NAbijkl + b2(NAb)2ijkl + b3lacstijkl + b4e-0.05lacst
ijkl + b5caijkl + b6ca2ijkl + seasoni
+ sirecodej + herdk + Ul + eijkl (1)
yijkl- dependent variable corresponding μ – overall mean. lacst- the lactation stage in
days. e-0.05lacst- variable which explains the lactation in days modelled with a Wilmink curve
(Wilmink, 1987) ca- the calving age in days, ca2-the squared value of ca. NAb is the
logarithm base 2 values of natural antibody titre for either LTAG1, LTAG2, LTAA, LTAM,
LTA, LPS, PGN or KLH. b- regression coefficient for the respective variables. A linear and a
quadratic component was modelled. herd, represents random effect of the herd with a
distribution, herd ~ N(0, Iσ2herd). sirecode is the fixed sire effect taking possible differences
between daughters of proven bull and the test bulls into account. season is the fixed effect for
the season of calving, which includes three classes: summer, autumn and winter (June to
August 2004, September to November 2004 and December 2004 to February 2005
respectively). Ur, random additive genetic effects of animal r with U ~ N(0, Aσ2U), eijklmnopq,
random residual effect with e ~ N(0, Iσ2e/wt), where wt- number of observations that
contributed for the mean and standard deviations of the SCS before and after; for the SCS at
the sampling moment no weighted analysis was used. The random residual effect for the
SCS at the sampling moment was e ~ N(0, Iσ2e).
Description of the model
Linear and quadratic relationships between each NAb and the SCS at different periods
are estimated one at a time. For the SCSsample, there was a single observation for each
animal and the lacst and e-0.05lacst were used in the model. For the afscs and afstdscs, the
aftlacst and afCOUNT were used for the model instead of the lacst and e-0.05lacst. For the
b4scs and b4stdscs, the b4lacst and the b4COUNT were used in the model. The
corresponding days in lactation and the number of samples were used for the mean and
standard deviations of SCS before and after. The season, sire and herd are the class variables
and the number of samples taken per animal after the sampling moment (afCOUNT) and
before the sampling moment (b4COUNT) are used for weighted analysis for the ASReml
estimations.

6
Model (1) without the effect of the NAb titres as co-variable was used to estimate
heritabilities for the different cell count traits. Here, again the same basic model without the
NAb titres was used for the different cell count traits. For the mean cell count traits before
and the after the sampling moment, the lactation stage in days and the number of test days per
animal was considered accordingly. For the standard deviation of the cell counts before and
after, their corresponding lactation stage in days and the corresponding number of test days
taken to find the standard deviations were accounted in the above model as well. For the cell
counts at the sampling moment, the lactation in days for that moment was changed in the
model accordingly without the number of the test days. Heritabilities (h2) were estimated
using a univariate analyses and were calculated as:
(2)
where is the additive genetic variance and is the residual variance.
Results
The exploratory analysis were performed using the general linear model. The fixed
effects were corrected using SAS software and the statistical genetic analysis were run using
the ASReml software. The estimates obtained from the analysis from SAS were used to find
the phenotypic correlations and also to find out the relation between the NAbs at the
sampling moment and the cell counts taken after the sampling moment later in the lactation.
The table 1 shows the number of animals, mean and the standard deviations observed for the
different cell count traits. Table 1. number of animals, mean and standard deviations for the mean SCS before, at and after and also for the
standard deviation of the SCS before and after sampling moment.
No. of animals Mean Standard
deviation b4scs* 1900 4.02 0.82 SCSsample 1939 3.77 1.09 afscs 2025 4.34 0.87 b4stdscs 1893 0.62 0.42 afstdscs 1921 0.46 0.34
b4scs*= the mean somatic cell score before the sampling moment
SCSsample = somatic cell score at the sampling moment
afscs = the mean somatic cell score after the sampling moment
b4stdscs = Standard deviation of the somatic cell score before the sampling moment
afstdscs = Standard deviation of the somatic cell score after the sampling moment

7
Relations of NAb titres with mean SCS before, at and after
The analysis show that, somatic cell scores of the cows taken before, at and after the
sampling moment showed significant relations with the antibody titres (Table 2). The
sqLTAG1 (p<0.0001), LTAG2, sqLTAG2, sqLTAM, sqLTAA, sqLTA, KLH and sqPGN all
showed significant relationships on the SCS before. The lactation in days and the NAb tires
of LTAG2 (p<0.0001), sqLTAG2 (p<0.0001), sqLTAM, sqLTAA and LTA had significant
effects on the SCS recorded at the sampling moment. For the SCS after the sampling moment
the significant effects were observed for the lactation in days (p<0.0001), sqLTAG1,
sqLTAG2, sqLTAM, sqLTAA and the sqLTA. It was also analysed whether the SCS at the
sampling point had significant effects on the before and after SCS and was found to have
significant relations.
Relations of NAb titres with standard deviation of SCS before and after
The significance of effects for the standard deviations of the SCS before sampling
moment are shown (table 2) by days in lactation (p<0.0001) and sqLTAG2, PGN and sqPGN.
Significant effects for standard deviation of SCS after the sampling moment were observed
for days in lactation and calving season. For standard deviation of SCS before and after
sampling moment, the days in lactation showed very significant effects. The effect of
lactation days in the SCS before the sampling moment was observed to be negative, whereas
the estimated effect of the lactation in days for the SCS after the sampling moment was
observed to be positive (estimates not shown).

8
Table 2. The significance of the effect of lactation stage, season of calving and natural antibodies on the traits mean and standard deviation of SCS before, at and after the
sampling moment. bLactati
on
stage
season cLTAG1 LTAG2 LTAM LTAA LTA KLH LPS PGN SCSsample
Ld
Q L Q L Q L Q L Q L Q L Q L Q L Q
ab4scs *** ** * * ** ** * ** ***
SCS-
sample
* *** *** ** ** ** - -
afscs *** ** * * ** ** *** *
b4stdscs *** ** ** ** *** ***
afstdscs ** ** * *** ***
ab4scs- SCS before sampling moment, SCSsample- SCS at sampling moment, afscs- SCS after sampling moment, b4stdscs- standard deviation of b4scs, afstdscs- standard deviations of afscs. blactation stage - days in lactation for the before, at and after sampling moments. cLTAG1, LTAG2, LTAM, LTAA, LTA, KLH, LPS and PGN- linear and quadratic expressions of NAb titres binding to respective molecular antigens. significant effects p <0.05=*, <0.005=**. <0.0001=***
Ld – Linear (L) and quadratic (Q) components of the NAB titires at the sampling moment
9
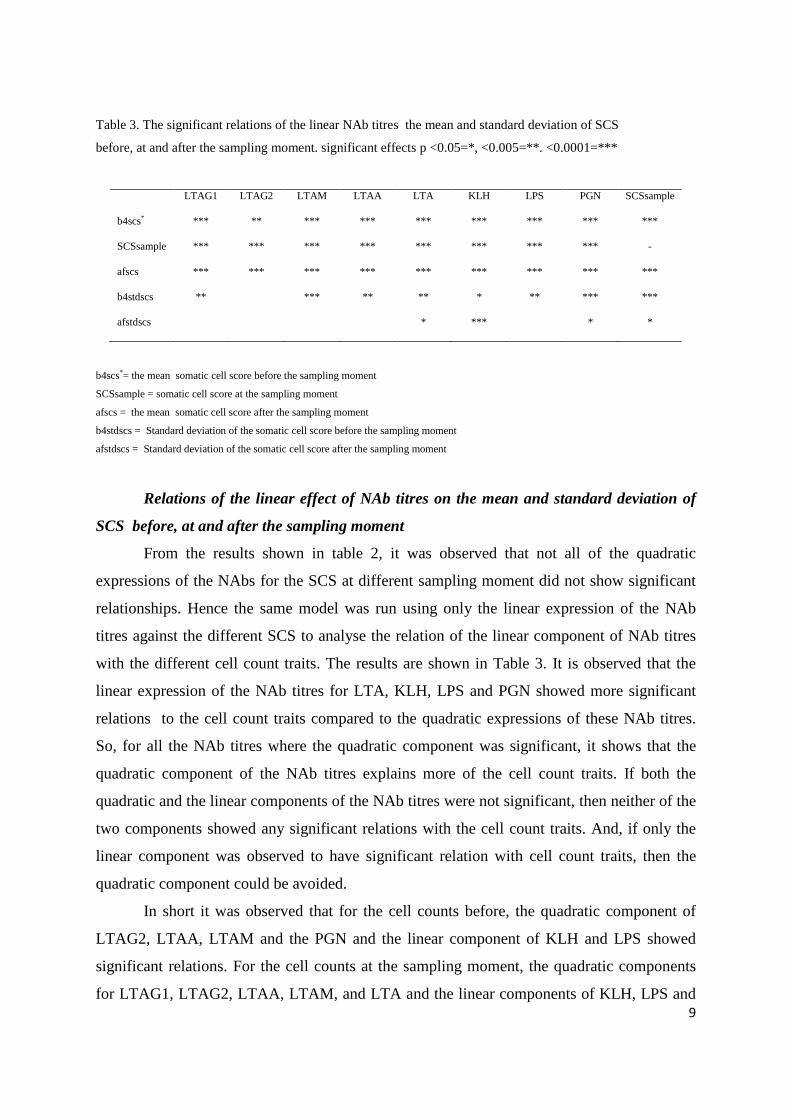
Table 3. The significant relations of the linear NAb titres the mean and standard deviation of SCS
before, at and after the sampling moment. significant effects p <0.05=*, <0.005=**. <0.0001=***
b4scs*= the mean somatic cell score before the sampling moment
SCSsample = somatic cell score at the sampling moment
afscs = the mean somatic cell score after the sampling moment
b4stdscs = Standard deviation of the somatic cell score before the sampling moment
afstdscs = Standard deviation of the somatic cell score after the sampling moment
Relations of the linear effect of NAb titres on the mean and standard deviation of
SCS before, at and after the sampling moment
From the results shown in table 2, it was observed that not all of the quadratic
expressions of the NAbs for the SCS at different sampling moment did not show significant
relationships. Hence the same model was run using only the linear expression of the NAb
titres against the different SCS to analyse the relation of the linear component of NAb titres
with the different cell count traits. The results are shown in Table 3. It is observed that the
linear expression of the NAb titres for LTA, KLH, LPS and PGN showed more significant
relations to the cell count traits compared to the quadratic expressions of these NAb titres.
So, for all the NAb titres where the quadratic component was significant, it shows that the
quadratic component of the NAb titres explains more of the cell count traits. If both the
quadratic and the linear components of the NAb titres were not significant, then neither of the
two components showed any significant relations with the cell count traits. And, if only the
linear component was observed to have significant relation with cell count traits, then the
quadratic component could be avoided.
In short it was observed that for the cell counts before, the quadratic component of
LTAG2, LTAA, LTAM and the PGN and the linear component of KLH and LPS showed
significant relations. For the cell counts at the sampling moment, the quadratic components
for LTAG1, LTAG2, LTAA, LTAM, and LTA and the linear components of KLH, LPS and
LTAG1 LTAG2 LTAM LTAA LTA KLH LPS PGN SCSsample
b4scs* *** ** *** *** *** *** *** *** ***
SCSsample *** *** *** *** *** *** *** *** -
afscs *** *** *** *** *** *** *** *** ***
b4stdscs ** *** ** ** * ** *** ***
afstdscs * *** * *
10
PGN showed significant relations. The quadratic expression of the NAb titres for LTAG1,
LTAG2, LTAA, LTAM, LTA and the linear expression for KLH, LPS and PGN were
significant related to the cell counts after the sampling moment. For the standard de3viation
of the cell counts before the sampling moment, the quadratic component for LTAG2 and
PGN and the linear components for LTAA, LTAM, LTA, KLH and LPS were found to be
significantly related. Only the linear components of LTA, KLH and PGN showed significant
relations with the standard deviations of the cell counts after the sampling moment.
Significant relationship between the Natural antibodies at the sampling moment
and the SCS after the sampling moment
The estimated relationship between the significant NAb titres collected at the
sampling moment and the SCS after the sampling moment are shown in figure 1. Only those
variables which showed significant effects on the SCS after the sampling moment are shown.

11
Figure 1. The relationship between the NAb titres at the sampling moment and the SCS after (afscs) the
sampling moment is shown below.
0
0.5
1
1.5
2
2.5
3
0 1 2 3 4 5 6 7
LTAG1
afsc
s
0
0.5
1
1.5
2
2.5
3
-6 -4 -2 0 2 4 6
LTAG2
afsc
s
0
0.5
1
1.5
2
2.5
3
0 1 2 3 4 5 6
LTAA
afsc
s
0
0.5
1
1.5
2
2.5
3
0 1 2 3 4 5 6 7
LTAM
afsc
s
0
0.5
1
1.5
2
2.5
3
0 1 2 3 4 5 6 7
LTA
afsc
s
0
0.5
1
1.5
2
2.5
3
0 1 2 3 4 5 6
SCSsample
afsc
s
The curves depicting the relationship between the NAb titres and the SCS after the
sampling moment which showed significant effects on the SCS recorded after the sampling
moment, all show a trend for the cell counts later in the lactation in such a way that the SCS
after the sampling moment increase with increase in NAb titres.
Heritability
Natural antibody titres and SCS at the sampling moment
The heritability for the antibodies and the SCS at different sampling moment ranges
from 0.53 for LTAA to 0.01 for b4stdscs before the sampling moment. Among the NAb titres

12
the highest heritability was observed for LTAA NAb titres (0.53)and the lowest for LTAG2.
Among the different SCS heritability estimates the highest was observed for afscs (0.30) and
lowest for the b4stdscs (0.01)
Table 3. Phenotypic variance (σ2P) and the heritability (h2) for the SCS at the sampling moment and the NAbs
LTAG1, LTAG2, LTAM, LTAA, KLH, LPS, LTA and PGN
σ2P h2
LTAG1 1.40 (0.05) 0.10 (0.06)
LTAG2 3.32 (0.13) 0.09 (0.05)
LTAM 0.70 (0.03) 0.47 (0.09)
LTAA 1.07 (0.05) 0.53 (0.11)
KLH 0.49 (0.02) 0.42 (0.09)
LPS 0.83 (0.03) 0.16 (0.06)
LTA 0.72 (0.03) 0.32 (0.08)
PGN 0.80 (0.03) 0.13 (0.06)
SCS 1.05 (0.04) 0.08 (0.05)
afstdscs 0.32 (0.03) 0.16 (0.04)
afscs 1.65 (0.14) 0.30 (0.06)
b4scs 2.45 (0.20) 0.08 (0.03)
b4stdscs 0.86 (0.04) 0.01 (0.01) 1standard errors are in parentheses
Discussion
Natural antibody titres and SCS
In the present study it was observed that the natural antibodies showed significant
relations with the SCS before, at and after the sampling moment. It is evident from the
estimates (not shown) and from figure 1, that the NAbs and the SCS share a relation which is
positive. The studies by Knegsel et. al. (2009) confirmed that NAbs showed a relation to the
SCC, which indicates trends for relations between increased NAb concentrations and
mammary infections. The KLH antigen is from the sea mollusc and is usually not
encountered in the environment of the dairy cattle. Therefore, KLH is a totally new antigen to
the animal. Antibodies to KLH therefore are expected to give an idea about the level of NAbs
present in the animal. The LTA, PGN and LPS are from bacteria and unlike the KLH antigen,
these antigens are normally present in the environment, so the antibody titres against these
antigens give an idea of the active status of the immune system (van Knegsel et al., 2007).

13
Natural antibody titres and the SCS later in lactation
The focus of the study was to observe the relation of the NAb titres collected at the
sampling moment and the somatic cell score later in the lactation. This was compared to the
relation between the NAb titres with the SCS before and the SCS at the sampling moment.
The tables 2 and 3 show that there was not much difference in the significant relationships
between the NAb titres and the different cell count traits. There was difference in the
heritabilities for the different cell count traits where the cell count traits after the sampling
moment was higher (0.30) than the cell count traits at and before the sampling moment (0.08
for both).
Estimates show that when NAb titres increase, the SCS after the sampling moment
also tends to increase (figure 1). Similar results were observed in the study by de Weerd
(2009), where IgG1 and IgA binding to LTA were found to be positive related to the SCC
afterwards. But de Weerd also found that IgM had a negative relationship with clinical
mastitis afterwards within 90 days after sampling, indicating a protective action by IgM.
Unlike de Weerd’s study which included details regarding mastitis incidence, the present
study did not incorporate mastitis incidence and also the number of animals were more in this
study.
Researches (Grabar, 1983, Tomer and Shoenfeld , 1988, Ochsenbein et. al., 1999)
suggest NAb play a role in initiating an immune response. So it could be that NAbs help in
reducing infections and help to maintain health. Results from the present study do not
support this; cows with high NAbs do not have lower but higher SCS levels later in lactation.
It maybe because the NAbs in milk may not have much role for immunity against infection,
compared to the NAbs which are present in the plasma. Also, the present study used samples
from cows where the health state of the animal was not known, in the sense that whether the
animal had any pre-existing illness or not. All the animals present in the dataset were first
parity animals, so the incidence of previous exposure to mastitis could be ruled out. But, if
the animal had any other existing disease previously present, then the natural antibody levels
will already be higher before the sampling was done. Studies have shown the presence of the
expression of the FcRn receptor expression which is a neonatal IgG transporter, present in the
small intestine of adult cows (Kacskovics, 2000).This neonatal transporter helps in carrying
the antibodies to the young calves. Hence, future research can be also compared with similar
analysis using plasma NAb titres of animals.

14
Days in lactation and calving season
Analyses showed significant effects of the days in lactation for both the mean SCS at
and after and also for the standard deviation for the before and after SCS. The data used for
this study did not have details regarding the infection status of the animal. Busato et.al.
(2000) and Dohoo and Morris (1993) had observed for cases in subclinical mastitis that the
effect of age and the days in milk of cows were important factors for subclinical mastitis. It
was observed by Honkanen-Buzalski et al, (1981) that the somatic cell count increased
immediately after parturition and then lowered during the first two months of lactation before
increasing again towards the end of lactation. Erdem et al (2010) observed that the somatic
cell counts were higher during the later stages in lactation. These changes maybe due to the
effect of dilution of the somatic cells by the milk thereby leading to changes in the cell counts
(Raubertas and Shook, 1982). It is also observed that there is a significant relation of the
effect of season, which is the season in which the animal calved, on the standard deviation
after the sampling moment. Dohoo et al, (1982) and Vliegher et al, (2004) observed higher
somatic cell counts in summer compared to the other seasons, which also was related to the
increased incidence of clinical mastitis during the summer period.
SCS at the sampling moment and SCS after
The analysis of the SCS at the sampling moment against the mean and standard
deviations before and after SCS (table 2) also showed significant relationships which
demonstrate the potential of SCS at a moment to predict the SCS later in the lactation. This
shows that the SCS at the sampling moment can also be used to predict the SCS later in the
lactation.
Heritability
The heritability for the NAbs and the SCS at the sampling moment which is not
corrected for the NAb titre is similar as observed in a study by Wijga (2008) vusing the same
data. Small differences in the estimated values maybe because of the difference in the number
of animals. In a study by Buitenhuis et al (2004) in chicken a heritability for the antibody
response for KLH of 0.15 was observed. A study by Siwek et al (2004) estimated heritabilies
for NAb titres to LTA, LPS and KLH antigens and observed as 0.17 for LPS, 0.07 for KLH
and 0.03 for LTA at 5 weeks and 0.23 for LPS, 0.42 for LTA and 0.11 for KLH at 38 weeks
of age.

15
From the heritability estimates it was observed for the SCS after the sampling
moment the average heritability was 0.30 and for the SCS at the sampling moment the
average heritability was 0.08. Koivula et al (2004) in the study in Ayrshire cattle that the
heritability of the log SCC changed from 0.086 in days 5-20 to 0.072 in days 301 -330; while
in Holsein-Fresians the log SCC changed from 0.087 to 0.09 during the same time period.
The increase of the heritability estimate for the corrected SCS after compared to the SCS at
the sampling moment can be explained as a result of repeated measurements. The heritability
for the SCS before the sampling moment was 0.08. It was observed that the SCS before the
sampling moment had a reduced additive genetic variance compared to the SCS after the
sampling moment which may have lead to a reduced heritability of the SCS before than the
SCS after the sampling moment. The same pattern is observed for the standard deviation of
the after SCS where the average heritability is 0.16 and the standard deviation of the before
SCS is 0.01.
Conclusion
Mastitis in the dairy industry is of great economic constraint both in the large scale
dairy farming as well as the small scale household systems. Present methods of mastitis
detection relies on the observation of physiological or bacteriological changes evident from
the milk samples which most often is known only after the presence of infection. Research
shows that the use of natural antibodies for selection for disease resistance in poultry shows a
positive correlation with innate immune response (Wijga, 2009). The present study analyzed
the relationship between NAb titres recorded at a single sampling moment with the somatic
cell score measured later in the lactation. The results indicated a significant effect of the NAb
titres on the SCS after the sampling moment. The trend for the SCS after was positive for
increase in the Nab titre, which would not be useful for utilizing NAb titre as a protective
measure against clinical mastitis infections. It was also observed that the days in lactation
showed significant relations with the mean somatic cell score after the sampling moment and
the standard deviation of the somatic cell score before the sampling moment. The calving
season was also significant for the standard deviation of the somatic cell score after. The
results, in future studies, can be compared with a similar approach with samples collected
from plasma Natural antibody titres which may offer more conclusive results.

16
References
Bannerman, D.D., Paape, M.J., Goff, J.P., Kimura, K., Lippolis, J.D., Hope, J.C., 2004,
Innate immune response to intramammary infection with Serratia marcescens and
Streptococcus uberis, Vet. Res., 35, 681-700.
Buitenhuis, A. J., Rodenburg, T. B., Wissink, P. H., Visscher, J., Koene, P., Bovenhuis, H.,
Ducro, B. J. and van der Poel, J. J., 2004, Genetic and Phenotypic Correlations Between
Feather Pecking Behavior, Stress Response, Immune Response, and Egg Quality
Traits in Laying Hens, Poultry Science 83:1077–1082. Busato, A., Trachsel, P., Schällibaum, M. and Blum, J. W. 2000, Udder health and risk
factors for subclinical mastitis in organic dairy farms in Switzerland, Prev. Vet. Med.
Volume 44, Issues 3-4, 28 April 2000, 205-220.
Casali, P., Schettino, E.W., 1996, Structure and function of natural antibodies, Current Topics
in Microbiology and Immunology, 210, 167-179.
de Weerd, Marieke. 2009 Natural antibody isotypes as parameters for resistance to mastitis in
dairy cows. Thesis Adaptation Physiology Group, Wageningen University.
Erdem, H., S. Atasever and E. Kul, 2010. A study on somatic cell count of jersey cows. Asian
J. Anim. Vet. Adv., 5: 253-259.
Dohoo, I. R., and A. H. Meek. 1982. Somatic cellcounts in bovine milk. Can. Vet. J. 23:119.
Dohoo, I.R. and Morris, R.S., 1993. Somatic cell count pattern in Prince Edward Island dairy
herds. Prev. Vet. Med. 15, pp. 53–65.
Grabar, P., 1983, Autoantibodies and the physiological role of immunoglobulins,
Immunology Today, vol. 4, 12, pp. 337-340.
Honkanen-Buzalski, T., Kangasniemi, R., Atroshi, F. and Sandholm, M. 1981. Effect of
lactation stage and number on milk albumin (BSA) and somatic cell count.
Zentralblattfür Veterinarmedizin 28: 760-767.
Kacskovics, I., Z. Wu, N. E. Simister, L. V. Frenyo, and L. Hammarstrom. 2000. Cloning and
characterization of the bovine MHC class I-like Fc receptor. J. Immunol. 164:1889–
1897.
Kehrli, M. E., and D. E. Shuster. 1994. Factors affecting milk somatic cells and their role in
health of the bovine mammary gland. J.Dairy Sci. 77:619–627.
17
Knegsel, van, A.T.M., de Vries Reilingh, G., Meulenberg, S., Van den Brand, H., Dijkstra,
J.,Kemp, B., Parmentier, H.K., 2007, Natural antibodies related to energy balance in
early lactation dairy cows, Journal of Dairy Science, 90, 5490-5498.
Knegsel, A.T.M., van and Vries Reilingh, G., de and Lammers, A. and Kemp, B. and
Parmentier, H.K., 2009, T1 Natural autoantibodies in milk and their role in the
development of mastitis in dairy cows, Journal of Dairy Science 92 (2009)E-Suppl. 1.
- ISSN 0022-0302.
Koivula M.,, Negussie, E.,and. Mäntysaari, E. A., (2004) Genetic parameters for test-day
somatic cell count at different lactation stages of Finnish dairy cattle. Livestock
Production ScienceVolume 90, Issues 2-3, Pages 145-157.
Larson BL (1992) Immunoglobulins of the mammary secretions. In Advanced Dairy
Chemistry 1-Proteins, pp. 231±254 [PF Fox, editors]. London: Elsevier Science
Publishers.
Miller, R. H., and M. J. Paape. 1985. Relationship between milk somatic cell count and milk
yield. Page 60 in Proc. Natl. Mastitis Counc.
Ochsenbein A. F, Fehr, T., Lutz, C., Suter, M., Brombacher F., Hengartner, H., .
Zinkernagel, R. M., 1999, Control of Early Viral and Bacterial Distribution and
Disease by Natural Antibodies Science, 10,: Vol. 286. no. 5447, pp. 2156 – 2159. Philipsson, J., G. Ral, and B. Bergland. 1995. Somatic cell count as a selection criterion for
mastitis resistance in dairy cattle. Livest. Prod. Sci. 41:195–200.
Pillai S.R., Kunze E., Sordillo L.M., Jayarao B.M., Application of differential inflammatory
cell count as a tool to monitor udder health, J. Dairy Sci. 84 (2001) 1413–1420.
Raubertas, R. F. and Shook, G. E., (1982) Relationship Between Lactation Measures of
Somatic Cell Concentration and Milk Yield, J. Dairy Sci. Vol. 65 No. 3 419-425.
Rainard, P., Riollet, C., 2006, Innate immunity of the bovine mammary gland, Veterinary
Research, 37, 369-400.
Siwek, M., Buitenhuis, B., Cornelissen, S., Nieuwland, M., Knol, E. F., Crooijmans, R.,
Groenen, M., Parmentier, H. and van der Poel, J. J., 2006, Detection of QTL for
innate: Non-specific antibody levels binding LPS and LTA in two independent
populations of laying hens Developmental & Comparative Immunology, Vol. 30, 7,
659-666.

18
Smith, K. L. 1996. Standards for somatic cells in milk: physiological and regulatory.
International Dairy Federation Mastitis Newsletter, September, p. 7
Tomer, Y. and Shoenfeld Y., 1988, The Significance of Natural Autoantibodies,
Immunological Investigations, Vol. 17, 5, pp. 389-424.
Vliegher S. D., Laevens, H., Barkema, H. W., Dohoo, I. R., Stryhn, H., Opsomer, G. and de
Kruif A. (2004) Management Practices and Heifer Characteristics Associated with
Early Lactation Somatic Cell Count of Belgian Dairy Heifers, J. Dairy Sci. 87:937-
947.
Weller, J. I., A. Saran, and Y. Zeliger. 1992. Genetic and environmental relationships among
somatic cell count, bacterial infection and clinical mastitis. J. Dairy Sci. 75:2532–
2540.
Wijga, Susan, 2008. Parameters for natural resistance in bovine milk. Thesis Cell Biology
and Immunology Group, Wageningen University.
Wijga, S., Parmentier, H. K.,. Nieuwland, M. G. B, and Bovenhuis, H., (2009) Genetic
parameters for levels of natural antibodies in chicken lines divergently selected for
specific antibody response, Poult. Sci. 88:1805-1810.
Wilmink, J.B.M., 1987, Adjustment of test-day milk, fat and protein yield for age, season and
days-in-milk, Livestock Production Science, 16, 335-348.
19
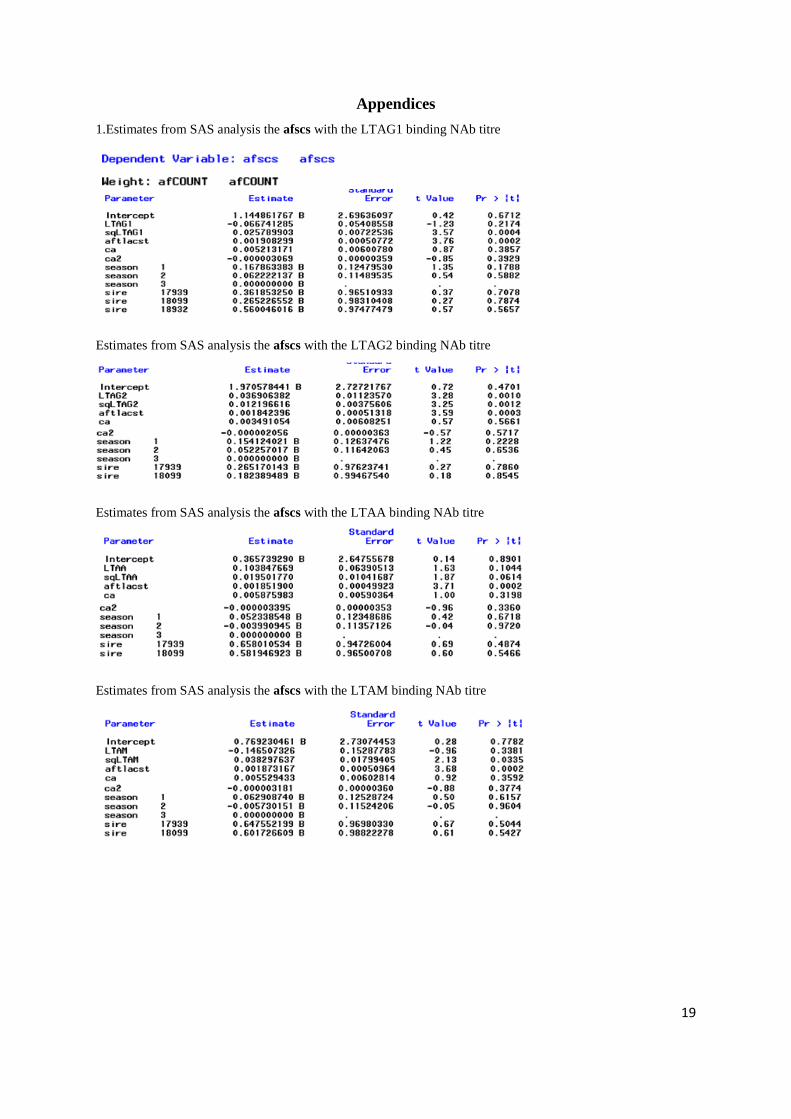
Appendices 1.Estimates from SAS analysis the afscs with the LTAG1 binding NAb titre
Estimates from SAS analysis the afscs with the LTAG2 binding NAb titre
Estimates from SAS analysis the afscs with the LTAA binding NAb titre
Estimates from SAS analysis the afscs with the LTAM binding NAb titre

20
Estimates from SAS analysis the afscs with the LTA binding NAb titre
Estimates from SAS analysis the afscs with the KLH binding NAb titre
Estimates from SAS analysis the afscs with the LPS binding NAb titre
Estimates from SAS analysis the afscs with the PGN binding NAb titre
21
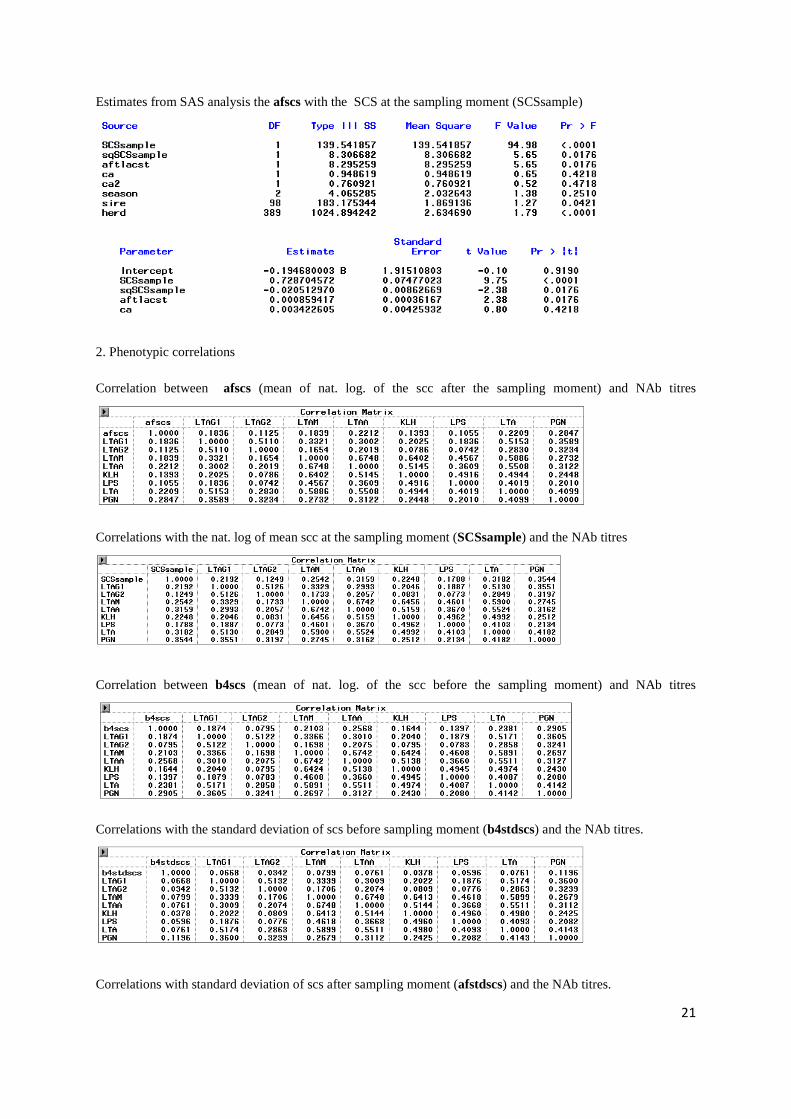
Estimates from SAS analysis the afscs with the SCS at the sampling moment (SCSsample)
2. Phenotypic correlations
Correlation between afscs (mean of nat. log. of the scc after the sampling moment) and NAb titres
Correlations with the nat. log of mean scc at the sampling moment (SCSsample) and the NAb titres
Correlation between b4scs (mean of nat. log. of the scc before the sampling moment) and NAb titres
Correlations with the standard deviation of scs before sampling moment (b4stdscs) and the NAb titres.
Correlations with standard deviation of scs after sampling moment (afstdscs) and the NAb titres.

22
3. Table 2. Relationship between NAb binding antigens which showed significant relation and SCS at the
sampling moment
0
0.5
1
1.5
2
2.5
3
3.5
0 0.5 1 1.5 2 2.5 3 3.5 4 4.5 5
LTAG2
scs
0
0.5
1
1.5
2
2.5
0 0.5 1 1.5 2 2.5 3 3.5 4 4.5 5
LTAA
scs
0
0.5
1
1.5
2
2.5
0 0.5 1 1.5 2 2.5 3 3.5 4 4.5 5
LTAM
scs
-0.8
-0.6
-0.4
-0.2
0
0.2
0.4
0.6
0.8
1
1.2
1.4
0 0.5 1 1.5 2 2.5 3 3.5 4 4.5 5
LTA
scs