Embed Size (px)
Citation preview
RELATIONSHIP BETWEEN STRATEGIC CHANGE AND THE ORGANIZATIONAL PERFORMANCE OF SHIPPING FIRMS IN KENYA
BY
STEPHEN M MUTISYA
A RESEARCH PROJECT SUBMITTED IN PARTIAL FULFILLMENT OF THE REQUIREMENTS FOR THE AWARD OF MASTER OF BUSINESS
ADMINISTRATION, SCHOOL OF BUSINESS, UNIVERSITY OF NAIROBI
2016
ii
DECLARATION
This research project is my original work and has not been presented for an award in any other
university.
..................................... ......................................
Stephen Mutisya Date
D61/71427/2014
This research project has been submitted for examination with my approval as the university
supervisor.
........................................ ............................................
Dr. Jackson Maalu Date
School of Business
University of Nairobi

iii
ACKNOWLEDGEMENTS
My heartfelt gratitude goes to Almighty God for giving me the opportunity to pursue this degree
and giving me the strength to overcome the hurdles that come along. I appreciate the contributions
of a number of people and institutions who played a major role in ensuring that this research work
is completed.
I say thank you and God Bless you all.

iv
DEDICATION
To my parents
You have been a source of support and inspiration.
v
TABLE OF CONTENTS
ACKNOWLEDGEMENTS.................................................................................................................. iii
DEDICATION ...................................................................................................................................... iv
LIST OF TABLES.............................................................................................................................. viii
ABBREVIATIONS AND ACRONYMS .............................................................................................. ix
ABSTRACT ........................................................................................................................................... x
CHAPTER ONE: INTRODUCTION ................................................................................................... 1
1.1 Background of the Study .......................................................................................................... 1
1.1.1 Strategic Change .............................................................................................................. 2
1.1.2 Organizational Performance ............................................................................................. 3
1.1.3 Strategic Change and Organizational Performance................................................................... 4
1.1.4 Shipping Industry in Kenya ..................................................................................................... 5
1.2 Research Problem .................................................................................................................... 6
1.3 Research Objectives ....................................................................................................................... 7
1.4 Value of the study .......................................................................................................................... 8
CHAPTER TWO: LITERATURE REVIEW ...................................................................................... 9
2.1 Introduction ..................................................................................................................................... 9
2.2 Theoretical Foundation of the Study ............................................................................................... 9
2.2.1 Learning Organization Theory .................................................................................................... 9
2.2.2Institutional Theory .................................................................................................................... 10
2.2.3 Transaction Cost Theory ........................................................................................................... 10
2.3 Structural Change Practices.......................................................................................................... 11
2.3.1 Transformational Versus Incremental Change ........................................................................... 11
2.3.2 Unplanned Versus Planned Change ........................................................................................... 12
2.3.3 Developmental Change against Remedial Change ..................................................................... 12
2.4 Review of Empirical Studies .......................................................................................................... 13
2.5 Summary of Literature Review ..................................................................................................... 14
CHAPTER THREE: RESEARCH METHODOLOGY .................................................................... 16
3.1 Introduction ................................................................................................................................... 16
3.2 Research Design ............................................................................................................................. 16
3.3 Population ...................................................................................................................................... 16
3.4 Data Collection .............................................................................................................................. 16
vi
3.5 Data Analysis ................................................................................................................................. 17
3.5.1 Regression Model ..................................................................................................................... 17
CHAPTER FOUR: DATA ANALYSIS AND FINDINGS ................................................................. 18
4.1 Introduction ................................................................................................................................... 18
4.2 Demographics ................................................................................................................................ 18
4.2.1 Number of employees ............................................................................................................... 18
4.2.2 Number of Years in Operation .................................................................................................. 18
4.2.3 Company Ownership................................................................................................................. 19
4.2.4 Market Served........................................................................................................................... 19
4.3 Descriptive Statistics ...................................................................................................................... 20
4.3.1 Descriptive Statistics for Incremental Change............................................................................ 20
4.3.2 Descriptive Statistics for Transformational Change ................................................................... 20
4.3.4 Descriptive Statistics for Planned Change ................................................................................. 21
4.3.5 Descriptive Statistics for Developmental Change ...................................................................... 22
4.3.6 Descriptive Statistics for Firm Performance .............................................................................. 22
4.4 Check for Normality of Data ......................................................................................................... 23
4.4.1 Kolmogorov-Smirnov and Shapiro-Wilk Test for the Variables ................................................. 23
4.4.2 Detrended Q-Q plot for Incremental Change ............................................................................. 24
4.5 Correlation Analysis for the study variables ................................................................................ 24
4.6 Regression Analysis for the study variables .................................................................................. 25
4.6.1 Model Summary ....................................................................................................................... 25
4.6.2 Co-efficients of the Model ........................................................................................................ 25
4.7 Discussion of Findings ................................................................................................................... 26
CHAPTER FIVE: SUMMARY, CONCLUSION AND RECOMMENDATIONS ........................... 28
5.1 Introduction ................................................................................................................................... 28
5.2 Summary ........................................................................................................................................ 28
5.3 Conclusion...................................................................................................................................... 29
5.4 Limitations of the Study ................................................................................................................ 29
5.5 Recommendations .......................................................................................................................... 29
5.6 Suggestion for further studies ....................................................................................................... 29
REFERENCES .................................................................................................................................... 30
APPENDICES ..................................................................................................................................... 36

vii
Appendix I: Questionnaire for Shipping Firms in Kenya .................................................................. 36
AppendixII: List of Shipping Firms in Kenya .................................................................................... 39
Appendix III: Detrended Q-Q Plot for Incremental Change ............................................................. 40
Appendix IV: Box plots for the study variables ................................................................................. 41
viii
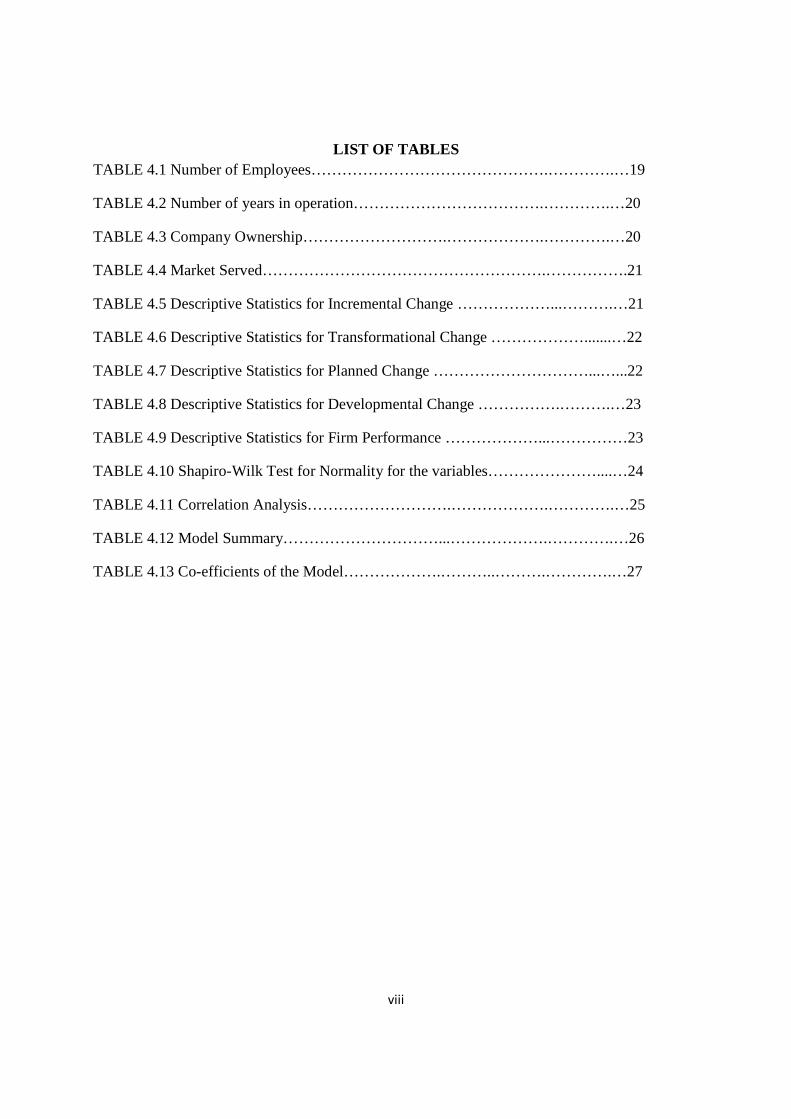
LIST OF TABLES TABLE 4.1 Number of Employees……………………………………….………….…19
TABLE 4.2 Number of years in operation……………………………….………….…20
TABLE 4.3 Company Ownership……………………….……………….………….…20
TABLE 4.4 Market Served……………………………………………….…………….21
TABLE 4.5 Descriptive Statistics for Incremental Change ………………...……….…21
TABLE 4.6 Descriptive Statistics for Transformational Change ……………….......…22
TABLE 4.7 Descriptive Statistics for Planned Change …………………………...…...22
TABLE 4.8 Descriptive Statistics for Developmental Change …………….……….…23
TABLE 4.9 Descriptive Statistics for Firm Performance ………………...……………23
TABLE 4.10 Shapiro-Wilk Test for Normality for the variables…………………....…24
TABLE 4.11 Correlation Analysis……………………….……………….………….…25
TABLE 4.12 Model Summary…………………………...……………….………….…26
TABLE 4.13 Co-efficients of the Model……………….………..……….………….…27
ix
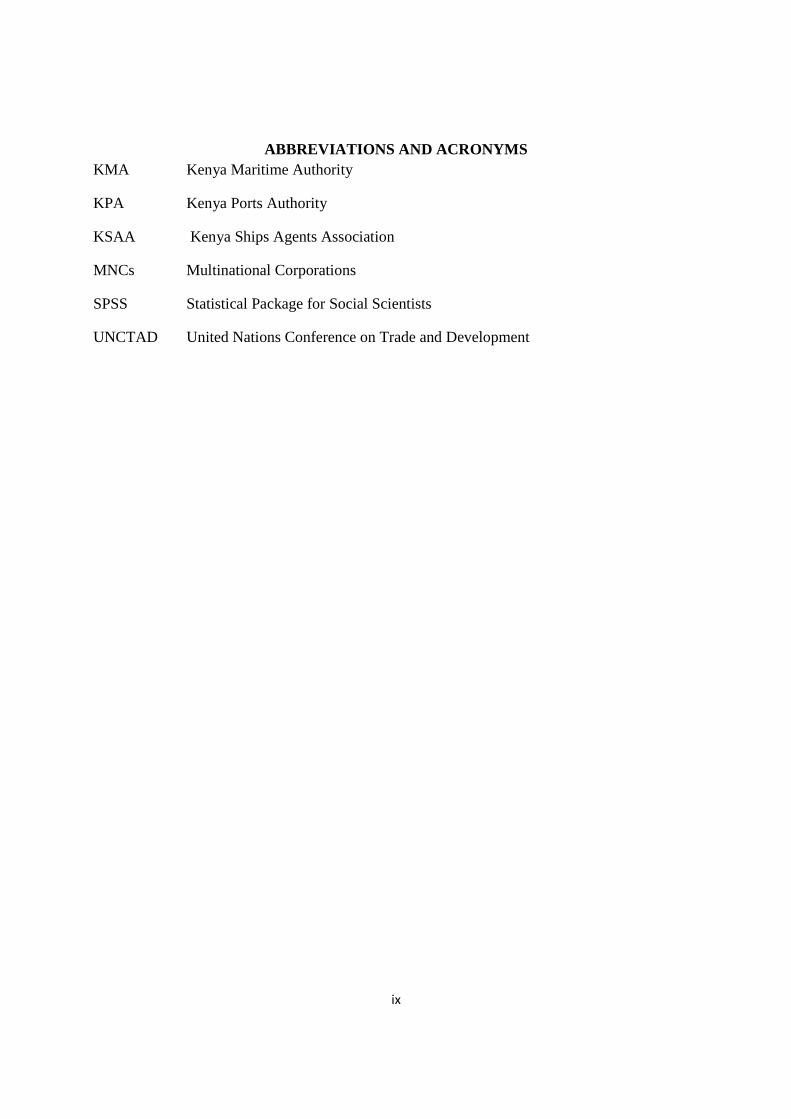
ABBREVIATIONS AND ACRONYMS KMA Kenya Maritime Authority
KPA Kenya Ports Authority
KSAA Kenya Ships Agents Association
MNCs Multinational Corporations
SPSS Statistical Package for Social Scientists
UNCTAD United Nations Conference on Trade and Development
x
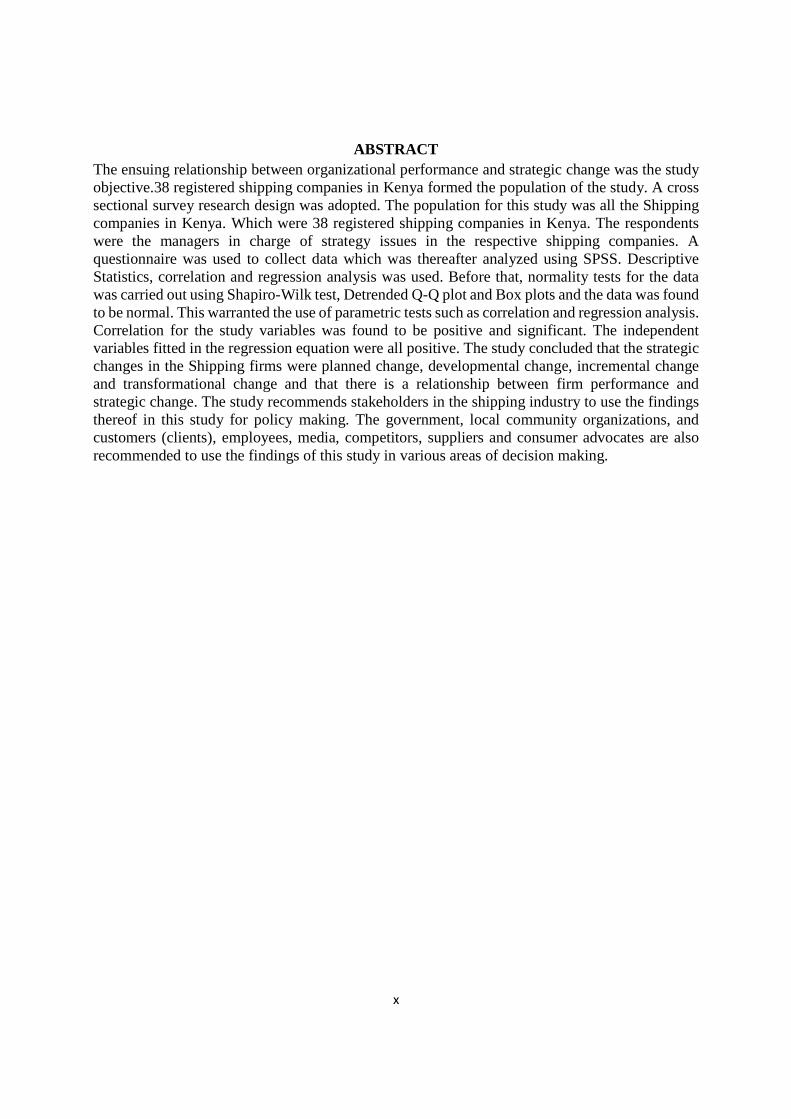
ABSTRACT The ensuing relationship between organizational performance and strategic change was the study objective.38 registered shipping companies in Kenya formed the population of the study. A cross sectional survey research design was adopted. The population for this study was all the Shipping companies in Kenya. Which were 38 registered shipping companies in Kenya. The respondents were the managers in charge of strategy issues in the respective shipping companies. A questionnaire was used to collect data which was thereafter analyzed using SPSS. Descriptive Statistics, correlation and regression analysis was used. Before that, normality tests for the data was carried out using Shapiro-Wilk test, Detrended Q-Q plot and Box plots and the data was found to be normal. This warranted the use of parametric tests such as correlation and regression analysis. Correlation for the study variables was found to be positive and significant. The independent variables fitted in the regression equation were all positive. The study concluded that the strategic changes in the Shipping firms were planned change, developmental change, incremental change and transformational change and that there is a relationship between firm performance and strategic change. The study recommends stakeholders in the shipping industry to use the findings thereof in this study for policy making. The government, local community organizations, and customers (clients), employees, media, competitors, suppliers and consumer advocates are also recommended to use the findings of this study in various areas of decision making.
1
CHAPTER ONE: INTRODUCTION
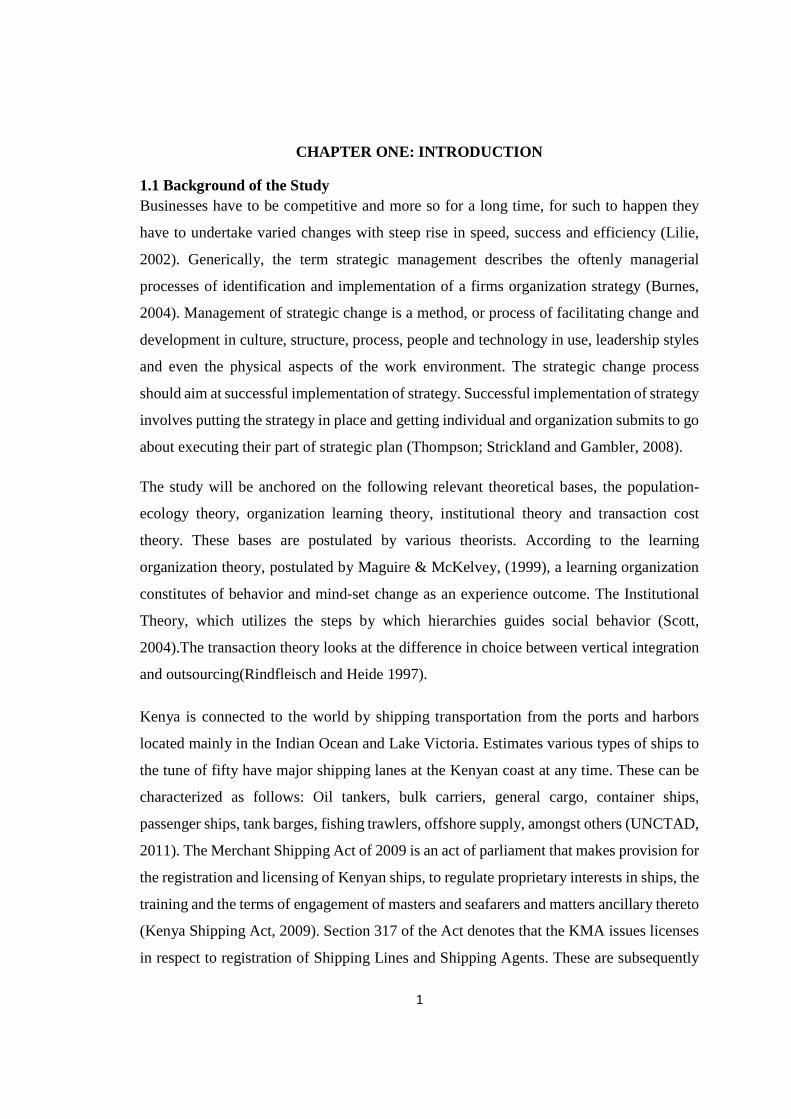
1.1 Background of the Study Businesses have to be competitive and more so for a long time, for such to happen they
have to undertake varied changes with steep rise in speed, success and efficiency (Lilie,
2002). Generically, the term strategic management describes the oftenly managerial
processes of identification and implementation of a firms organization strategy (Burnes,
2004). Management of strategic change is a method, or process of facilitating change and
development in culture, structure, process, people and technology in use, leadership styles
and even the physical aspects of the work environment. The strategic change process
should aim at successful implementation of strategy. Successful implementation of strategy
involves putting the strategy in place and getting individual and organization submits to go
about executing their part of strategic plan (Thompson; Strickland and Gambler, 2008).
The study will be anchored on the following relevant theoretical bases, the population-
ecology theory, organization learning theory, institutional theory and transaction cost
theory. These bases are postulated by various theorists. According to the learning
organization theory, postulated by Maguire & McKelvey, (1999), a learning organization
constitutes of behavior and mind-set change as an experience outcome. The Institutional
Theory, which utilizes the steps by which hierarchies guides social behavior (Scott,
2004).The transaction theory looks at the difference in choice between vertical integration
and outsourcing(Rindfleisch and Heide 1997).
Kenya is connected to the world by shipping transportation from the ports and harbors
located mainly in the Indian Ocean and Lake Victoria. Estimates various types of ships to
the tune of fifty have major shipping lanes at the Kenyan coast at any time. These can be
characterized as follows: Oil tankers, bulk carriers, general cargo, container ships,
passenger ships, tank barges, fishing trawlers, offshore supply, amongst others (UNCTAD,
2011). The Merchant Shipping Act of 2009 is an act of parliament that makes provision for
the registration and licensing of Kenyan ships, to regulate proprietary interests in ships, the
training and the terms of engagement of masters and seafarers and matters ancillary thereto
(Kenya Shipping Act, 2009). Section 317 of the Act denotes that the KMA issues licenses
in respect to registration of Shipping Lines and Shipping Agents. These are subsequently
2
registered with the KPA. The research will concentrate on the major players of the shipping
industry business in Kenya especially those based in the Mombasa County.
1.1.1 Strategic Change This can be asserted as the realignment in the state of a firm over time (van de ven and
Poole, 1995).This alignment with the exogenous environment is fundamental of the current
and future resource distribution in line with the firm’s objectives. As the strategic change
aligns itself to various industry strategies competitive advantage and synergy needs to be
employed (Hofer and Schendel, 1978).
Various facets of strategic organizations in the past involved defining the traditions and
pinpointing the basics of comprehending the said phenomena. Reports from the
practitioners heavily depended on the tales from individuals, their experiences and also
from case studies, however as tradition increased among academicians, the theories and
the normal frameworks that used more data began to emerge. (Kim, 1993). Senge (2006)
comprehends that systems thinking being the facet for observing hierarchy that underlie
myriad avenues and helps in determining high change from low change with leverage.
Systems thinking may require intentional communication that is able to unearth
interdependency amongst particular units and also in portraying relationships that are
circular in nature (Argyris, 1977).Loops for feedback may act as foundations for critical
monitoring and systems philosophy.
The way in which firms are run needs to be moderated by values which are managerial and
at the same time those that have been created by shared mission and a vision (Bryson,
2004).Mintzberg and Westley (1992) say that a vision that is shared as a threshold in firms
change which culminates in decision making is made from the common organizational
behaviour. At the least level, a vision creates solutions, in personal mastery field (Senge,
2006).
Since organizations in the public domain have abstract service goals and usually work in
conflicting roles a vision creates a commitment with increased sense (Ring & Perry, 1985).
The leadership concept has an important role in a firms tradition, this gained momentum
in the 80s when scholars said that the effectiveness of organizations tend to increase when
3
the dimensions of culture are used in the mix (Ouchi, 1981; Peters & Waterman, 1982;
Collins and Porras, 1997; Schein, 2004).Cultural structure, leaders support the
development of vision and are supposed to be willing to share their personal vision and
allow the subjects to follow the leader, these leaders allow criticism and feedback and at
the same master themselves(Senge,2006).Finally, innovation, development,
communication and commitment drive value in strategic leadership(Cameron & Quinn,
2011).The board of managers endeavour to have an environment where the norm is
critiqued and there is an platform for innovation is laid.
Mastery of the self, personnel development together with firm values are the facets of
learning commitment (McGill, et al., 1992; Barker & Camarata, 1998; Senge, 2006;
Cameron & Quinn, 2011).The mastery of the self implies delving into growth of the
individual and expanding in the abilities of the person to be able to critically reframe issues
(McGill, et al., 1992; Senge, 2006).The following characterizes employees who have
mastered the self; they own things up, preserve stuff, are patient, are flexible, are passionate
etc Commitment to improve is life long and requires proficiency to certain levels(Senge,
2006).Employees who have enhanced their lives and have acquired skills both off and on
the job are usually given an enabling environment by strategic organizations(Barker and
Camarata, 1998).Responsibility ownership and empowerment of employees is a level of a
firms commitment to development(Senge, 2006).
1.1.2 Organizational Performance
Lusch and Laczniak (2009) say that it is the sum total of the fiscal outcomes of the firms
activities. Walker and Ruekert (2007) found the basic facets of a firm perform being triune
viz; adaptability, effectiveness and efficiency. But agreeing on the best is still a hot potato.
Thus comparison of firm’s performance with the trio factors will require resisting one and
allowing the other (Donaldson, 2004).
Ahuja (2006) says a firm’s performance should be measured by the outcomes against the
set targets. Although performance can be measured using productivity, effectiveness,
profitability and quality amongst others. Profitability being whether a firm is able to earn
profits for a long time. Expressed as a fraction of the gross profit to sales(Wood & Stangster
4
2006).While the ratio of output and input termed as productivity(Stoner, 2007).This
productivity measures the conversion of input resource in the form of services and goods
that have been made by industry, organization and the individual.
Another performance measure is the balanced score card which is more robust than other
performance measurement systems. The balanced score card as a noble idea has developed
over time to become a strategic management system. It determines the position of the firm
both the financial and non-financial aspects (Michaleska, 2005).When more strategic
objectives are designed there is bound to be an increase in the indicators of performance
(Sean Chen et al., 2006).In the balanced score card, customer perspective, growth and
learning are measured as indicators of financial details. Financial performance depends on
the satisfaction of customers (Zendedel, 2006)
1.1.3 Strategic Change and Organizational Performance
Tushman and Romanelli, (1985) for change to be effective, a correlation between the
strategic and the operational aspects of the organization is paramount. Managers need to
consider the different approaches to managing strategic change according to the
circumstances they face as well as trying to create the organizational context that will
facilitate change. Long-term organizational change has four characteristics i.e. scale,
magnitude, duration, and strategic importance. A formal approach for managing change,
with leadership engaging key stakeholders, should be developed early and adapted often
as change evolves in the organization. This includes data collection analysis, planning,
implementation discipline, a redesign of strategy, systems, and finally, processes. The
change managers adopt should be fully integrated into program design and decision
making, thereby informing and enabling strategic direction. Changes should be based on
realistic assessments of the organization’s history, readiness, and propensity to change.
Change efforts must identify leaders in the company and pushing responsibility for design
and implementation down, so that change cascades through the company. At each level or
stage of the organization, the leaders who are identified and trained must be aligned to the
vision of the company, fortified to accomplish their specific mission, and motivated to
make change happen. They serve as the common standard for planning indispensable
5
change elements, such as the new corporate vision, and building the programs and
infrastructure required to bring change. As change programs intensify, it is imperative that
leaders understand and account for culture and behaviour at each level of the organization.
In-Depth cultural analysis can show organizational readiness to bring key glitches to the
surface or conflicts, changes, and define factors that can recognize and influence sources
of resistance and sources of leadership. These diagnostics identify the core values,
perceptions, behavior and beliefs that must be taken into account for successful change to
occur (Hambrick and Mason, 1984).
1.1.4 Shipping Industry in Kenya
Shipping industry in East Africa has its headquarters located in Mombasa and the
hinterland for the port of Mombasa is the great lakes. Multi-national shipping lines are
dominating the shipping industry in Kenya whose vessels dock at the Kilindini Port of
Mombasa to load and discharge cargo. It is either through representative agents or owned
subsidiaries that the Multi-national companies have established their presence in Kenya.
The firms work as port operation/logistics offices and vessel handling as well as serving as
client service centers. The cargo handling or shipping agency business is normally a
customer service commerce that is revolving around business developing and marketing
along with the functioning of handling water vessels in port (UNCTAD, 2011).
The client base consists of cargo forwarders import and export customers, clearing agents
standing in and on behalf of exporters/importers, and logistics providers such as warehouse
operators, independent container freights station operators, container depot operators, as
well as transporters. At the border are the stakeholders like the Kenya Bureau of Standards,
Kenya Maritime Authority, Kenya Revenue Authority, and their equivalents in the
countries that form the larger vicinity to the port of Mombasa (UNCTAD, 2011).
One of the major driving forces that are behind Kenyan economy is the shipping industry
that seems to provide indirect and direct employment. Its liberalization has also enticed
additional presence of overseas owned liners, a lot of stretching their ways to more
productive destinations. Shipping industries of Kenya comprises of shipping liners which
6
acts as the focal global carriers like CMA CGM, Maersk Line, and Diamond Shipping
services among others. Other players in the industry include the agencies that work as
intermediary between the shipping lines and the shipper, and clearing and forwarding
agents who normally succor in logistical delivery and in clearing cargo (UNCTAD, 2011).
Kenya Ports Authority (KPA) and Kenya Maritime Authority (KMA) are the regulators of
the industry, whilst other bigger stakeholders are Kenya Revenue Authority (KRA), Kenya
Shipping Agents Association (KSAA), the Kenya International Freight and Warehousing
Association (KIFWA) and Kenya Shippers Council (KSC). An estimate of 50 different
types of ships is in the larger shipping lanes off the Coast of Kenya at any given time. The
can be categorized as follows; tank barges, oil tankers, container ships, bulk carriers,
fishing trawlers, offshore supply and passenger ships amongst others (UNCTAD, 2011).
1.2 Research Problem Strategic change has become a persistent sensation which must be attended to and managed
properly if an organization is to survive. Changes in technology, the marketplace,
information systems, the global economy, social values, workforce demographics and the
political environment have a significant effect on the processes, products and services
produced. The culmination of these forces has resulted in an external environment that is
dynamic, unpredictable, demanding and often devastating to those organizations which are
unprepared or unable to respond (Burnes, 2004). Clearly if organizations are ever to
experience a greater level of performance, managers are required to obligate a better
structure when articulating issues about strategic change for improving organizational
performance in terms of productivity, improved profitability, increase in market share,
quality production of goods and services and increase in customer base.
The complex and uncertain environment in emerging economies generally has a strong and
sustainable influence over the strategic choices for both foreign and local businesses. As
multinational and local shipping firms are heterogeneous in organizational capabilities,
market orientations, strategic objectives, and institutional support, such strategic choices
will not, and should not, be the same between them. Multinational shipping companies
need to be more innovative and adaptive than local companies in order to offset their
liabilities of foreignness and compensate for their disadvantages in the lack of
7
governmental supports that are important to business success in emerging economies.
Nevertheless, multinational shipping companies should not become enormously proactive
and aggressive in order to mitigate unnecessary instabilities in a volatile environment (Luo
and Tan, 1998).
Various local studies focus on management of strategic change in organizations. For
instance, Kenani (2013) did a study on the outsourcing strategy and performance of
outsourced activities in cement industry in Kenya and found out that the need to focus on
core competencies and enhance efficiency were the factors influencing outsourcing
strategy adoption. Ochweri (2012) did a case study research on outsourcing strategy and
performance of the Kenya Institute of Management and found out that outsourcing as a
strategy in the learning institutions can be applied not only to gain the overall performance
of the institution but also to increase student enrolment. Ndope (2010) also investigated the
strategic change management process at the Nairobi Stock Exchange. Kamau (2013)
carried a study on the relationship between strategic change and organizational
performance for large printing firms in Nairobi and found out that strategic change
influences achievement in organizational performance in the printing firms. However, a
review of all these studies shows that there are scanty empirical studies on influence of
strategic change on organizational performance within the shipping firms in Kenya. This
study therefore seeks to fill the existing knowledge gap by determining the relationship of
strategic change and organizational performance in the Kenyan Shipping Industry. The
study seeks to answer the question; what is the relationship of strategic change and
organizational performance for Shipping Firms in Kenya?
1.3 Research Objectives The study is guided by the following objectives;
i. To establish the strategic changes in the Kenyan Shipping Industry
ii. To establish the relationship between strategic changes and organizational
performance in the Kenyan Shipping Industry
8
1.4 Value of the study
The findings of this study will contribute to theory and knowledge and provide an insight
into the relationship between strategic change and how it influences performance.
Additionally, this study will provide information on areas of further research in the area of
study that will be suggested for further research. This study may be replicated in a different
sector or geographical setting.
The study will provide valuable information on the strategic changes adopted by the firms
in the Shipping Industry. Understanding how these firms adjusts to strategic change and its
relationship to performance will provide an incentive to further study this industry which
has been a mystery to many people for a long time.
The study will be of benefit to various stakeholders and practitioners in the shipping
industry who comprise of the government, local community organizations, and customers
(clients), employees, media, competitors, suppliers and consumer advocates. The groups
will get to understand the advantages and disadvantages of stakeholders’ involvement in
strategic change within the Shipping Industry. The study will assist and guide the present
and future government to determine strategic policies to be adopted on shipping industry
in order to improve their performance.
9
CHAPTER TWO: LITERATURE REVIEW
2.1 Introduction Previous studies on Strategic change are presented in this chapter. The chapter is hence
broken down into theoretical basis of strategic change, organizational change practices,
review of empirical studies and summary of literature review.
2.2 Theoretical Foundation of the Study Three theories are discussed here-under; learning organization theory, institutional theory
and the transaction cost theory of organizational change.
2.2.1 Learning Organization Theory
Maguire & McKelvey, (1999) asserted that an erudition association is the one that is
capable of bringing a revolution to its mind-sets as well as behavior as a result of expertise.
A lot of companies deny to recognize certain piece of reality or actualities and re-do
dysfunctional comportments repeatedly. Cases to prove this are the number of eras
reshuffling inventiveness is recurring as a reason that the aforementioned attempt did not
meet the required results or the incapability of acquisitions and mergers to encounter the
original goals.
Maguire adds that the surroundings incline to endorse leadership and learning at all levels
(distributed leadership) and they are possible to enable the company to be more answerable
for its deeds as people tend to be more accountable for their engagements. Organization
both in the public and private sectors that have embraced this method or approach that the
responsibility of every individual escalates to a certain level and accountability becomes
stronger and clearer. They also feel contented since a true distributed leadership has been
developed (Maguire & McKelvey 1999), as every agent is working towards achieving a
share objective, goal, shared vision, taking initiatives and discovering possibilities that
nonetheless fit well into the whole strategic direction. Learning organizations accomplish
this through the existing relationships built by the networks and peer support (rather than
pressure). Permitting learning surroundings inform business strategy by taking the existing
advantage of strewn intelligence throughout the company; they fully engage external and
internal stakeholders through responding to problems identified by investors or
stakeholders they normally change the behavior of the company thought attitude and mind
10
change of individuals within the organization and lastly they help to integrate sustainability
thinking into the culture of the organization (Maguire & McKelvey 1999).
2.2.2Institutional Theory This theory is grafted on the insides of social structure. It includes the various facets of the
society and how they affect social behavior (Scott, 2004).The various pieces of this theory
explain how the elements in the social structure are adopted and somewhat adapted over
time and space and how they are used. Scott (1995) says that ‘as social structures,
institutions have gained a high level of flexibility. They are made up of traditional
regulative, normative and cognitive elements that when in union to associated resources
and activities provide foundation and gives social life meaning’.
Scott (1995) says that for survival, firms must adhere to the belief systems and rules that
are prevalent in the environment (DiMaggio and Powell, 1983; Meyer and Rowan, 1977)
both procedural and structural isomorphism in the institutions earns the firms legitimacy.
(Dacin, 1997; Deephouse, 1996; Suchman, 1995).For example, multinational corporations
(MNCs) that operate in various nations with varied firm operating environments might face
myriad pressures. Of these pressures in the home environments are known to exert
influences on the competitive strategy (Martinsons, 1993; Porter, 1990)
2.2.3 Transaction Cost Theory
This theory looks at the choice of different structures of governance such as outsourcing
and integration which is vertical (Rindfleisch and Heide 1997).This theory is mostly used
because the outsourcing of business activities that are not core has a wanton effect on
operation cost (Rosenau 1990).Vertical integration is when activities are done in the firm
while market governance or outsourcing is when business activities are done outside the
firm. Transaction cost theory asserts that outsourcing is preferred as it minimizes
transaction and productions costs. The production costs are the ones involved in
specification developments, product design and related costs.
The product design expenditure, specification development and other related costs are
known as production costs (Rosenau 1990).The development performance costs are also
11
known as production costs(Williamson 1991).For example labor, materials and capital that
are used in carrying out marketing are grouped as production costs.
Transaction cost theory posits transaction costs as those incurred between the parties
involved in the outsourcing, the giver and the taker. These costs include monitoring,
writing and contract enforcement (Williamson 1985).The primary assumption is that when
the transaction costs of allowing or giving contracts to third parties gazump the cost of
production then the businesses must market from within. Due to measurement problems,
safeguarding and adaptation transactions can be high. This can be because of uncertainty
in the environment, specificity of assets and other reasons (Rindfleisch and Heide
1997).Foremost the assets which are highly specific may result in exploitation between the
parties involved.
Secondly, the uncertainties (which are technological and volume) might even be a cause of
increase in costs (transactional) due to problems in the adaptation and adoption of the
agreements which are contractual. Third, the uncertainty brought about by measuring the
performance of contracts of the firm outsourced to might be difficult (Rindfleisch and
Heide 1997).
2.3 Structural Change Practices
The “organizational change” is due to tangible change that include the usage of new
products and services or the radical change of a full firm. This is deviation from the norm
which may arise maybe in the installation of a new computer process. Organizational
change is kind of abstract when thought out using the various stand points below;
2.3.1 Transformational Versus Incremental Change Tushman & O'Reilly III (2006) change at times might change the tradition and structure of
an organization away from the normal top-down, structure to a personally led team. The
other example may be the process of an organization which may be done through business
process re-engineering. Transformational change oftenly is also known as quantum change.
Various examples come to the fore, the improvement of a management process or when
there needs to be an implementation of computer systems to make competitive advantages.
Many firms need to identify incremental change and treat it as such.
12
2.3.2 Unplanned Versus Planned Change
Burnes (2004) asserts that change that is not planned (unplanned) normally happens
because of a major, sudden shock to the company, which causes its staff to retort in a
muddled fashion and very highly reactive manner. Unplanned change normally happens
when the C.E.O (Chief Executive Officer) unexpectedly leaves the organization leaving
behind poor product performance, high rate of customer turnover, significant PR (Public
Relations) problems occur, and other troublesome situations arise.
While planned change happens when the frontrunners of the organization identify the
reason for a major change and proactively organize a crisis management plan to accomplish
the change. The kind of change also happens with successful enactment or implementation
of a strategic plan for the organization (Burnes 2004).
2.3.3 Developmental Change against Remedial Change
Literature based on Burnes (2004), argued that change can be proposed to salvage current
situations, for example, to reduce burnout at the workplace, to mend the underprivileged
performance of the entire organization or a product and lastly to help the organization
become less reactive and be more vibrant and more proactive and be able to address huge
budget deficits. Burnes added that remedial projects seem to be urgent and focused since
they seem to address current and major problems. With easiness of solving problem or not
it is mostly easier defining the accomplishments of these undertakings or projects.
Developmental change can boost a situation that is successful to be even more successful,
for example, duplicate successful services or products or expand the amount of customers
served.
Developmental projects seem to be vague, more general than remedial, depending on how
important it is for members of the organization and how specific objectives are to achieve
those goals. Different people have different insights of what a development change is
compared to remedial change. People have the perception that there is always need for a
remedial change if development change fails in a project. Burnes (2004) adds that
13
companies consider establishing a developmental vision to address any issue after
recognizing remedial issues.
2.4 Review of Empirical Studies
Mekgoe, (2008) conducted a study that aimed at getting at the effect of employee morale,
particularly downsizing, strategy change, performance and commitment at a
Telecommunication company based in South- Africa globally. The study targeted that even
though the popularity in regards to the responses showed a good performance and a positive
morale, most of the respondents considered positions outside the company or organization.
Wadongo et al. (2010) carried out survey to instigate the effects of managerial
characteristics on key performance in the hotel industry in Kenya. The survey conducted
by Wadongo was a cross-sectional survey type of research that was employed to gather
primary data where questionnaires were data self-administered as a tool for data collection.
The sample size used was 160 managers selected randomly to eliminate bias from the
hospitality department from 6 hotels in Mombasa and Nairobi. Data was analyzed using
the custom factorial uni-variate analysis of variance. The researcher revealed that
hospitality managers are ignoring non-financial determinants measures and are still
focused on financial and result measures of performance.
Mutura (2012) studied on stakeholder involvement in strategic change management
process within the Nairobi’s Insurance Industry, Kenya and concluded that senior
management and managers at the middle level implemented strategic changes in the
organization as strategic changes were hewed at the top level of the management. Company
carried out fluctuations either steadily in a continuous manner dependent on the type of
change
A research on HIV research conducted at Centre of Disease Control (CDC) and prevention
Kenya Medical Research Institute (KEMRI) specifically done to evaluate management of
strategic change in HIV Auma (2013) the researcher found out that the management of
HIV-R laboratory averagely performed on how they controlled the change process
14
succeeding their lucidity on the short term rather than the long term future state of the
organization, hence minimizing the positive impact that the change could have had.
Kipkemboi (2013) conducted a study on the management of strategic change at Rivatex
East Africa limited. Through the study it was established that the management process on
strategic change at Rivatex East Africa Limited commenced with goal setting strategies. In
addition the encounters met by Rivatex company in East Africa Limited were as an
outcome of transformation, training and development. The strategic change programs
implemented by the company led to reduction in costs, increase in sales and market share.
Nyachoti (2014) Performance and Strategic Change Management at National Bank of
Kenya the study found out that continuous communication on the progress of planning and
enactment of decided approaches important in ensuring realization in management on
strategic change as all shareholders will be on the know-how on the progress of
implementation and what is required of them to ensure successful implementation of
planned strategies.
2.5 Summary of Literature Review
Change is either planned or unplanned, and either revolutionary or evolutionary. Planned
change encompasses a process of transformation in an organizational structure as a
sequence of evolutions between different states of re-freezing, unfreezing and transition
state (Burnes, 2004). Unplanned change is a reactive response to pressure caused by
alterations in the internal and external conditions. Such change is usually radical and
change oriented. It usually has an external focus on the shifts in the environment and
industry and applies to a specific division of an organization (Bertels, 2010)
Discontinuous or revolutionary change is an inventive change in its facets, which mostly
adjusts the company’s business framework and encompasses rapid modifications in its
procedures and culture, formation and strategy (Tushman & O'Reilly III, 2006). The
scholar added that the change that is done through convincing people is called evolutionary
change. The change agents who are normally one or two or more than two see the
opportunity for the company to improve, and they capitalize on it through engaging talks
15
with other people thereby building the mutual relationship that is iteratively found with
ease.
Locally various studies have been carried out Wadongo et al. (2010) carried out an
assignment to explore the effects of managerial on the real performance indicators in the
hotel industry in Kenya. Kipkemboi (2013) conducted a study on the management of
strategic change at Rivatex East Africa limited. Kamau (2013) did a study to establish the
relationship between organizational performance and strategic change of Bigger and large
printing organizations in Kenya (Nairobi). Due to the versatility of the Shipping Industry
it is prudent to carry out this to see whether the same results obtained in the aforementioned
studies will still hold in this industry.
16
CHAPTER THREE: RESEARCH METHODOLOGY
3.1 Introduction This chapter describes the procedure that was followed in conducting the research. It
elaborates the whole research process which includes research design, population of the
study, data collection as well as the instruments that was used for data collection and
analysis.
3.2 Research Design The study adopted a cross sectional survey research design that is descriptive in nature.
The census is so selected because the population under consideration is small. This was
used to elicit the required information pertaining to strategic change in the Kenyan
Shipping industry. This design gave further an in-depth study of the particular situation
and was used to narrow down the broad aspects of the topic under study.
3.3 Population The population for this study was all the Shipping companies in Kenya. According to the
Kenya Ships Agents Association (KSAA, 2016) there are 38 registered shipping companies
in Kenya.
3.4 Data Collection Primary data was used. Data was collected using a semi- structured questionnaire drafted
in line with the research objectives which was divided into three sections. The respondents
were drawn from each of the registered shipping company where each company had one
respondent. The respondents were the managers in charge of strategy issues in the
respective shipping companies. The first section comprised of the basic organizational
background information; the second part consisted of questions assessing the strategic
change employed by shipping companies and the third part consisted of questions assessing
strategic change and organizational performance. The questionnaire had close ended
questions in which the respondents gave their ratings on a 5-point Likert Scale.
E-mail solutions and drop-pick later method were employed in administering the
questionnaires to the business development managers of the respective shipping companies
as they are considered key in strategic change application decisions.
17
3.5 Data Analysis
The data collected was edited for completeness, uniformity, accuracy, redundancy and
consistency. It was further coded to classify responses into meaningful categories to enable
data to be analyzed. Descriptive statistics using SPSS was used in order to examine the
pattern of responses to each of the variables under description. Percentages, frequencies
and arithmetic mean were used in order to facilitate comparisons. Tables were used in
presentation of data findings.
To measure the strength and direction of association between strategic change and
performance of the shipping companies the Pearson product-moment correlation
coefficient were used.
3.5.1 Regression Model A regression model was fitted to establish the linearity of the variables. The Regression M
odel was as follows;
P = α + β1X1 + β2X2 +β3X3 +β4X4 + ε
Where
P = Performance X1= Incremental change X2 = Transformational change X3 = Planned change X4= Developmental change α =the constant term β = coefficient ε= Error term
18
CHAPTER FOUR: DATA ANALYSIS AND FINDINGS
4.1 Introduction This chapter presents data analysis, findings and discussion in line with the objectives of
the study.
4.2 Demographics The demographics of the respondents were calculated and the frequencies and percentage determined and is as here-below
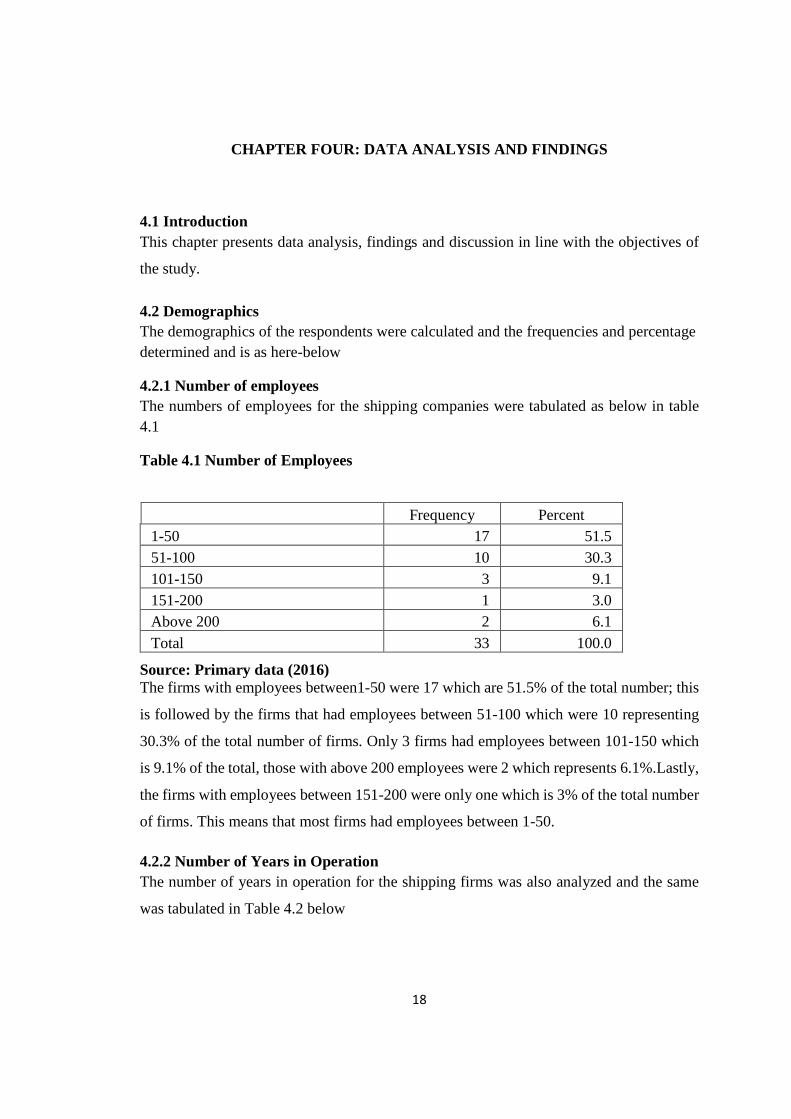
4.2.1 Number of employees The numbers of employees for the shipping companies were tabulated as below in table 4.1
Table 4.1 Number of Employees
Frequency Percent 1-50 17 51.5 51-100 10 30.3 101-150 3 9.1 151-200 1 3.0 Above 200 2 6.1 Total 33 100.0
Source: Primary data (2016) The firms with employees between1-50 were 17 which are 51.5% of the total number; this
is followed by the firms that had employees between 51-100 which were 10 representing
30.3% of the total number of firms. Only 3 firms had employees between 101-150 which
is 9.1% of the total, those with above 200 employees were 2 which represents 6.1%.Lastly,
the firms with employees between 151-200 were only one which is 3% of the total number
of firms. This means that most firms had employees between 1-50.
4.2.2 Number of Years in Operation The number of years in operation for the shipping firms was also analyzed and the same
was tabulated in Table 4.2 below
19
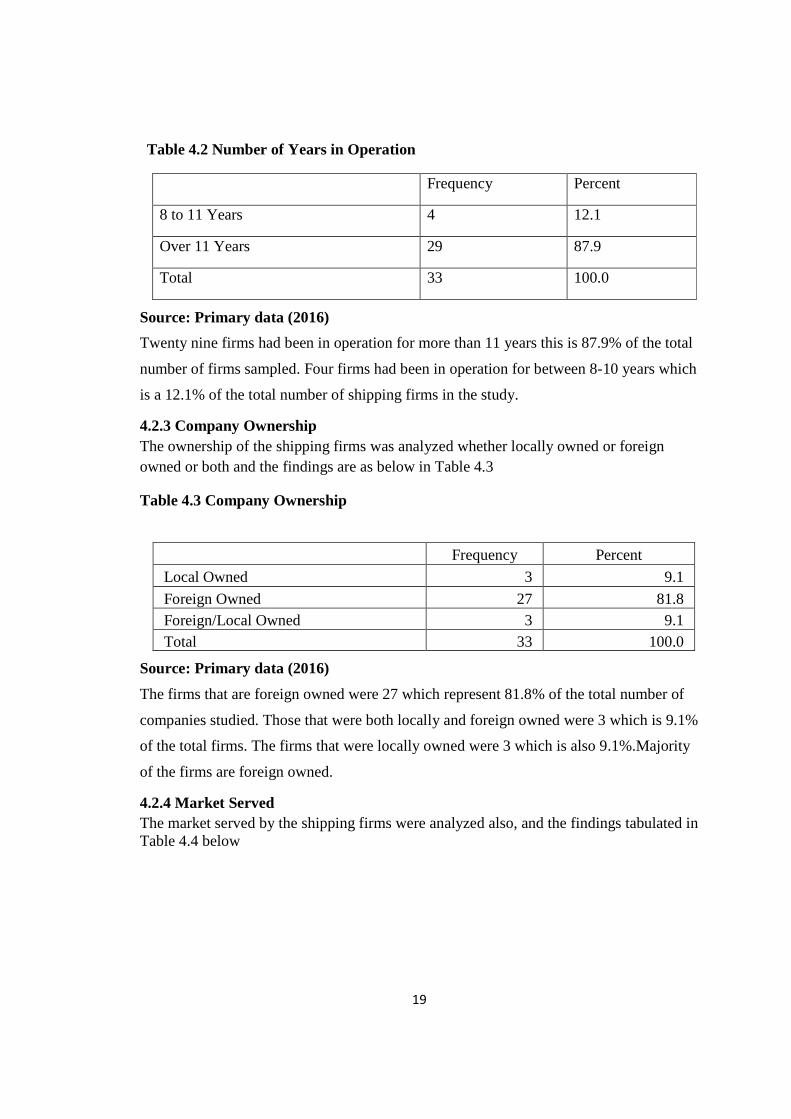
Table 4.2 Number of Years in Operation
Frequency Percent
8 to 11 Years 4 12.1
Over 11 Years 29 87.9
Total 33 100.0
Source: Primary data (2016)
Twenty nine firms had been in operation for more than 11 years this is 87.9% of the total
number of firms sampled. Four firms had been in operation for between 8-10 years which
is a 12.1% of the total number of shipping firms in the study.
4.2.3 Company Ownership The ownership of the shipping firms was analyzed whether locally owned or foreign owned or both and the findings are as below in Table 4.3
Table 4.3 Company Ownership
Frequency Percent
Local Owned 3 9.1
Foreign Owned 27 81.8 Foreign/Local Owned 3 9.1 Total 33 100.0
Source: Primary data (2016)
The firms that are foreign owned were 27 which represent 81.8% of the total number of
companies studied. Those that were both locally and foreign owned were 3 which is 9.1%
of the total firms. The firms that were locally owned were 3 which is also 9.1%.Majority
of the firms are foreign owned.
4.2.4 Market Served The market served by the shipping firms were analyzed also, and the findings tabulated in Table 4.4 below
20
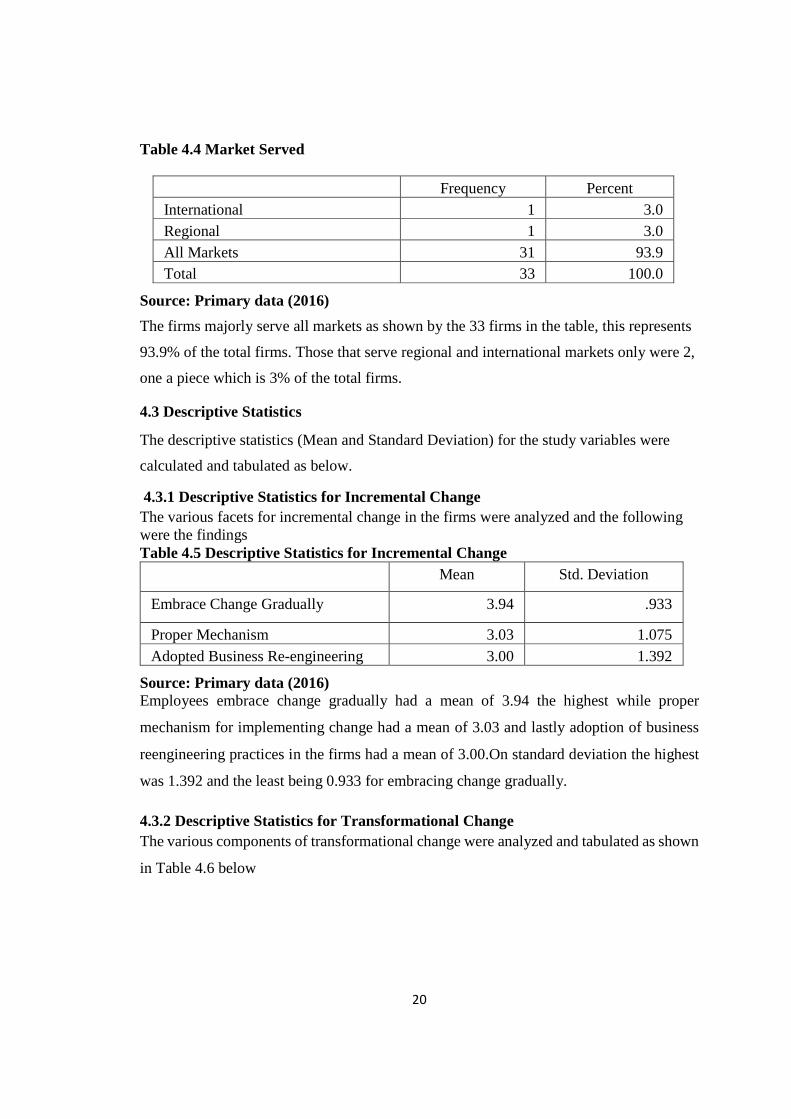
Table 4.4 Market Served
Frequency Percent International 1 3.0 Regional 1 3.0 All Markets 31 93.9 Total 33 100.0
Source: Primary data (2016)
The firms majorly serve all markets as shown by the 33 firms in the table, this represents
93.9% of the total firms. Those that serve regional and international markets only were 2,
one a piece which is 3% of the total firms.
4.3 Descriptive Statistics
The descriptive statistics (Mean and Standard Deviation) for the study variables were
calculated and tabulated as below.
4.3.1 Descriptive Statistics for Incremental Change The various facets for incremental change in the firms were analyzed and the following were the findings Table 4.5 Descriptive Statistics for Incremental Change
Mean Std. Deviation
Embrace Change Gradually 3.94 .933
Proper Mechanism 3.03 1.075 Adopted Business Re-engineering 3.00 1.392
Source: Primary data (2016) Employees embrace change gradually had a mean of 3.94 the highest while proper
mechanism for implementing change had a mean of 3.03 and lastly adoption of business
reengineering practices in the firms had a mean of 3.00.On standard deviation the highest
was 1.392 and the least being 0.933 for embracing change gradually.
4.3.2 Descriptive Statistics for Transformational Change The various components of transformational change were analyzed and tabulated as shown
in Table 4.6 below
21
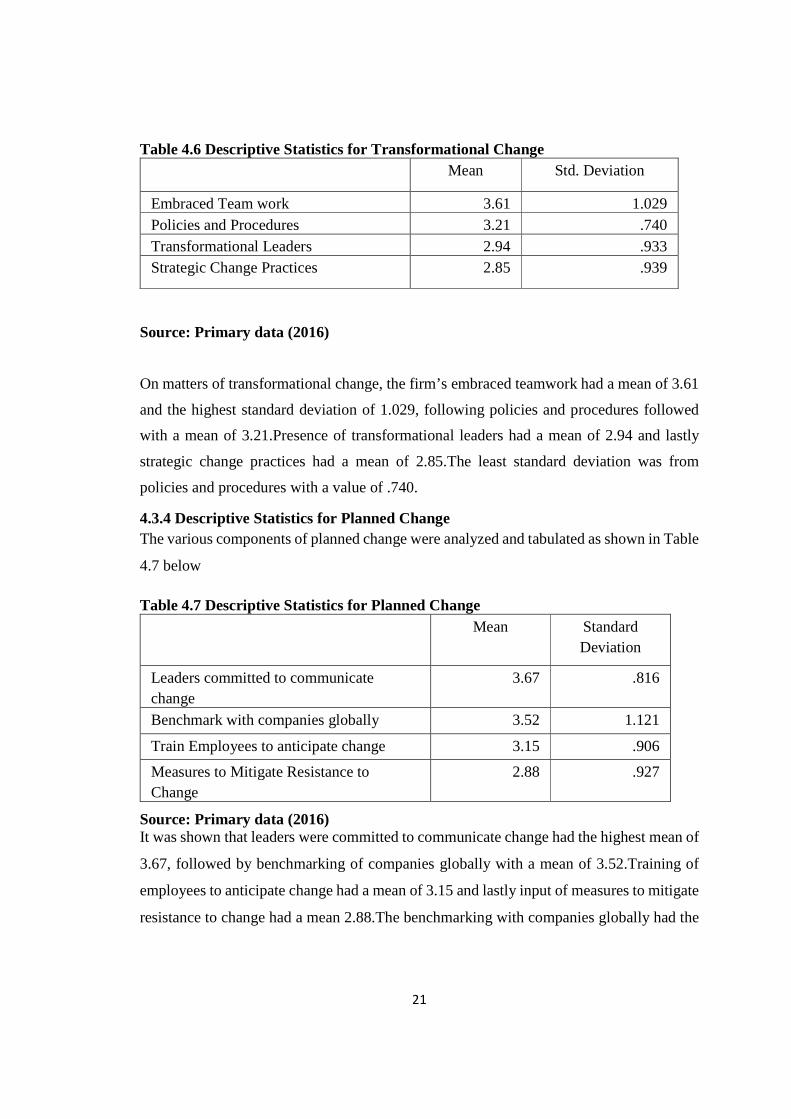
Table 4.6 Descriptive Statistics for Transformational Change Mean Std. Deviation
Embraced Team work 3.61 1.029 Policies and Procedures 3.21 .740 Transformational Leaders 2.94 .933 Strategic Change Practices 2.85 .939
Source: Primary data (2016)
On matters of transformational change, the firm’s embraced teamwork had a mean of 3.61
and the highest standard deviation of 1.029, following policies and procedures followed
with a mean of 3.21.Presence of transformational leaders had a mean of 2.94 and lastly
strategic change practices had a mean of 2.85.The least standard deviation was from
policies and procedures with a value of .740.
4.3.4 Descriptive Statistics for Planned Change The various components of planned change were analyzed and tabulated as shown in Table
4.7 below
Table 4.7 Descriptive Statistics for Planned Change Mean Standard
Deviation
Leaders committed to communicate change
3.67 .816
Benchmark with companies globally 3.52 1.121
Train Employees to anticipate change 3.15 .906
Measures to Mitigate Resistance to Change
2.88 .927
Source: Primary data (2016) It was shown that leaders were committed to communicate change had the highest mean of
3.67, followed by benchmarking of companies globally with a mean of 3.52.Training of
employees to anticipate change had a mean of 3.15 and lastly input of measures to mitigate
resistance to change had a mean 2.88.The benchmarking with companies globally had the
22
highest standard deviation of 1.121.The least standard deviation was leaders committed to
communicate change with a value of 0.816.
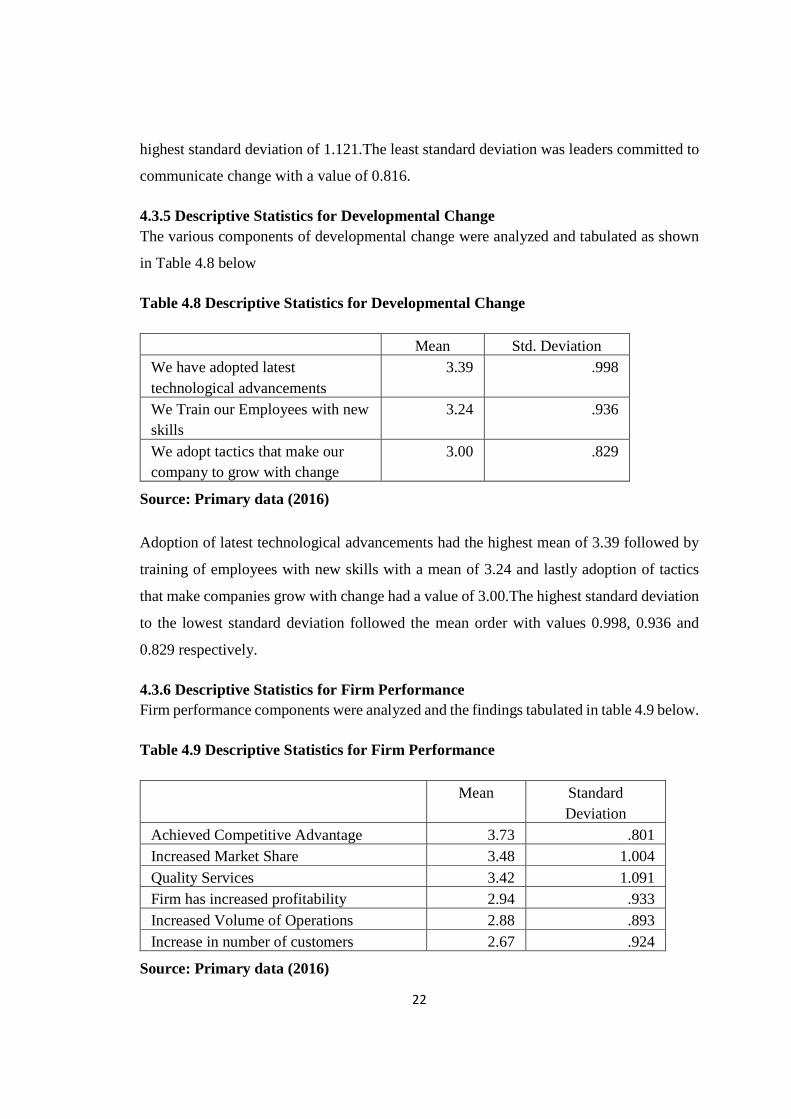
4.3.5 Descriptive Statistics for Developmental Change The various components of developmental change were analyzed and tabulated as shown
in Table 4.8 below
Table 4.8 Descriptive Statistics for Developmental Change
Mean Std. Deviation We have adopted latest technological advancements
3.39 .998
We Train our Employees with new skills
3.24 .936
We adopt tactics that make our company to grow with change
3.00 .829
Source: Primary data (2016)
Adoption of latest technological advancements had the highest mean of 3.39 followed by
training of employees with new skills with a mean of 3.24 and lastly adoption of tactics
that make companies grow with change had a value of 3.00.The highest standard deviation
to the lowest standard deviation followed the mean order with values 0.998, 0.936 and
0.829 respectively.
4.3.6 Descriptive Statistics for Firm Performance Firm performance components were analyzed and the findings tabulated in table 4.9 below.
Table 4.9 Descriptive Statistics for Firm Performance
Mean Standard Deviation
Achieved Competitive Advantage 3.73 .801 Increased Market Share 3.48 1.004 Quality Services 3.42 1.091 Firm has increased profitability 2.94 .933 Increased Volume of Operations 2.88 .893 Increase in number of customers 2.67 .924
Source: Primary data (2016)
23
Firm performance factor of achieving competitive advantage of 3.73 had the highest mean
followed by increase in market share with a mean of 3.48.Quality services came in third
with a mean of 3.42, this was followed by firm has increased in profitability with a mean
of 2.94, increase in volume of operations had a mean of 2.88 and lastly increase in number
of customers with a mean of 2.67.Increase in quality services had the highest standard
deviation of 1.091 and the least standard deviation was with achieving competitive
advantage.
4.4 Check for Normality of Data
The data was subjected to various normality tests to check whether it was normal so as to
enable subsequent analyses. Before the check for normality the sub-variables were
aggregated to get the main variables for onward analysis.
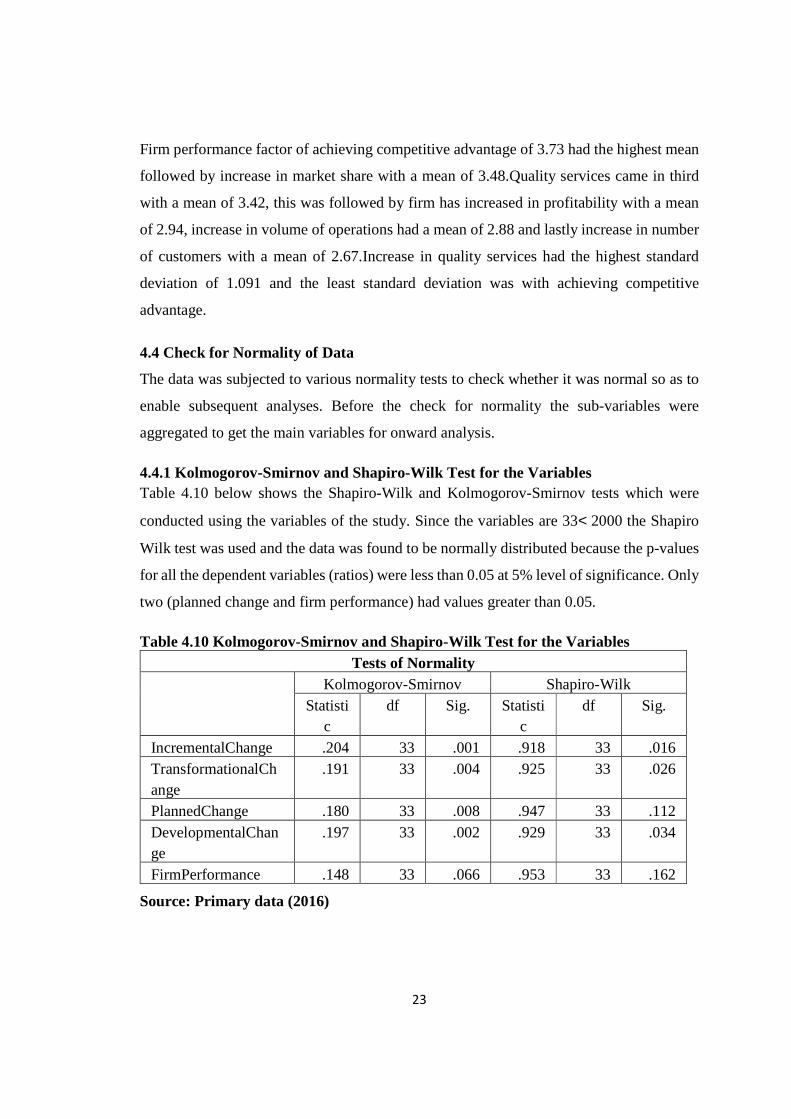
4.4.1 Kolmogorov-Smirnov and Shapiro-Wilk Test for the Variables Table 4.10 below shows the Shapiro-Wilk and Kolmogorov-Smirnov tests which were
conducted using the variables of the study. Since the variables are 33< 2000 the Shapiro
Wilk test was used and the data was found to be normally distributed because the p-values
for all the dependent variables (ratios) were less than 0.05 at 5% level of significance. Only
two (planned change and firm performance) had values greater than 0.05.
Table 4.10 Kolmogorov-Smirnov and Shapiro-Wilk Test for the Variables Tests of Normality
Kolmogorov-Smirnov Shapiro-Wilk Statisti
c df Sig. Statisti
c df Sig.
IncrementalChange .204 33 .001 .918 33 .016 TransformationalChange
.191 33 .004 .925 33 .026
PlannedChange .180 33 .008 .947 33 .112 DevelopmentalChange
.197 33 .002 .929 33 .034
FirmPerformance .148 33 .066 .953 33 .162
Source: Primary data (2016)
24
This prompted the researcher to observe normality of the variables using the Detrended Q-
Q plot for the same.
4.4.2 Detrended Q-Q plot for Incremental Change Observing the detrended normal Q-Q plot for incremental change(chosen arbitrarily) from
the same analysis, shown in Appendix III below discloses that all the variables lie between
the range of +1 to -1 which is a confirmation of the normality of data. Since data was found
to be normal, subsequent parametric tests (correlation and regression was done). With the
box-plots shown in Appendix IV below, there is a revelation of symmetry in all the study
variables. The symmetry of the data is a confirmation of normality.
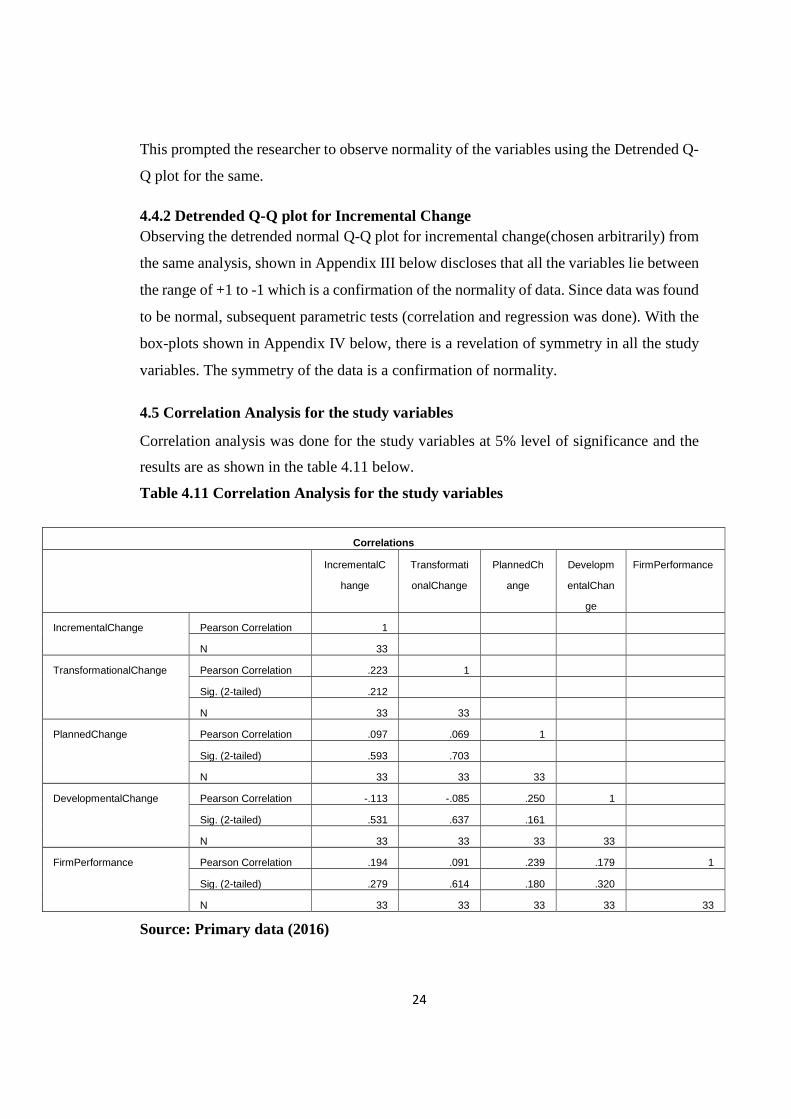
4.5 Correlation Analysis for the study variables
Correlation analysis was done for the study variables at 5% level of significance and the
results are as shown in the table 4.11 below.
Table 4.11 Correlation Analysis for the study variables
Source: Primary data (2016)
Correlations
IncrementalC
hange
Transformati
onalChange
PlannedCh
ange
Developm
entalChan
ge
FirmPerformance
IncrementalChange Pearson Correlation 1
N 33
TransformationalChange Pearson Correlation .223 1
Sig. (2-tailed) .212
N 33 33
PlannedChange Pearson Correlation .097 .069 1
Sig. (2-tailed) .593 .703
N 33 33 33
DevelopmentalChange Pearson Correlation -.113 -.085 .250 1
Sig. (2-tailed) .531 .637 .161
N 33 33 33 33
FirmPerformance Pearson Correlation .194 .091 .239 .179 1
Sig. (2-tailed) .279 .614 .180 .320
N 33 33 33 33 33
25
According to the Pearson Correlation matrix, there is a positive and significant relationship
between the dependent and independent variables of the study. Implying increase in the
independent variables will result to an increase in the dependent variables. The correlation
between incremental change and firm performance is 0.194, while the correlation between
transformational change and firm performance is 0.091.The correlation between planned
change and firm performance is 0.329 and lastly the correlation between developmental
change and firm performance is 0.320
4.6 Regression Analysis for the study variables
The summary of the model and the co-efficients were analyzed as here below;
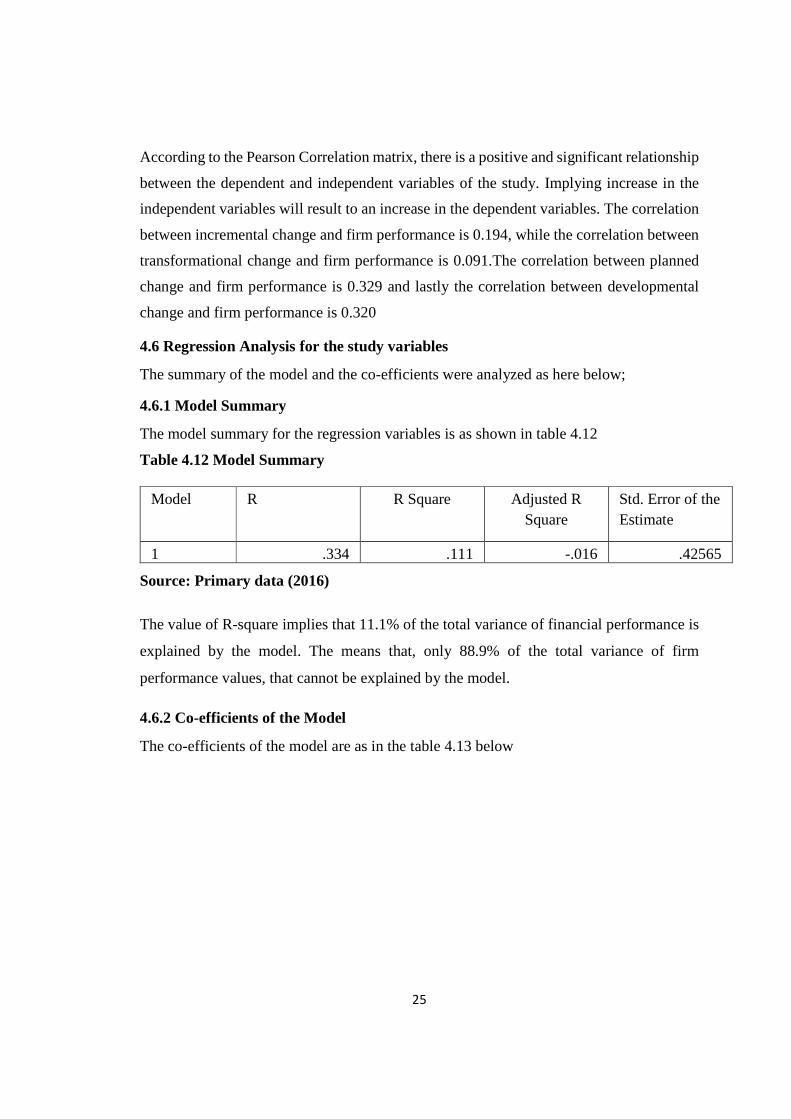
4.6.1 Model Summary
The model summary for the regression variables is as shown in table 4.12
Table 4.12 Model Summary
Model R R Square Adjusted R Square
Std. Error of the Estimate
1 .334 .111 -.016 .42565
Source: Primary data (2016)
The value of R-square implies that 11.1% of the total variance of financial performance is
explained by the model. The means that, only 88.9% of the total variance of firm
performance values, that cannot be explained by the model.
4.6.2 Co-efficients of the Model
The co-efficients of the model are as in the table 4.13 below
26
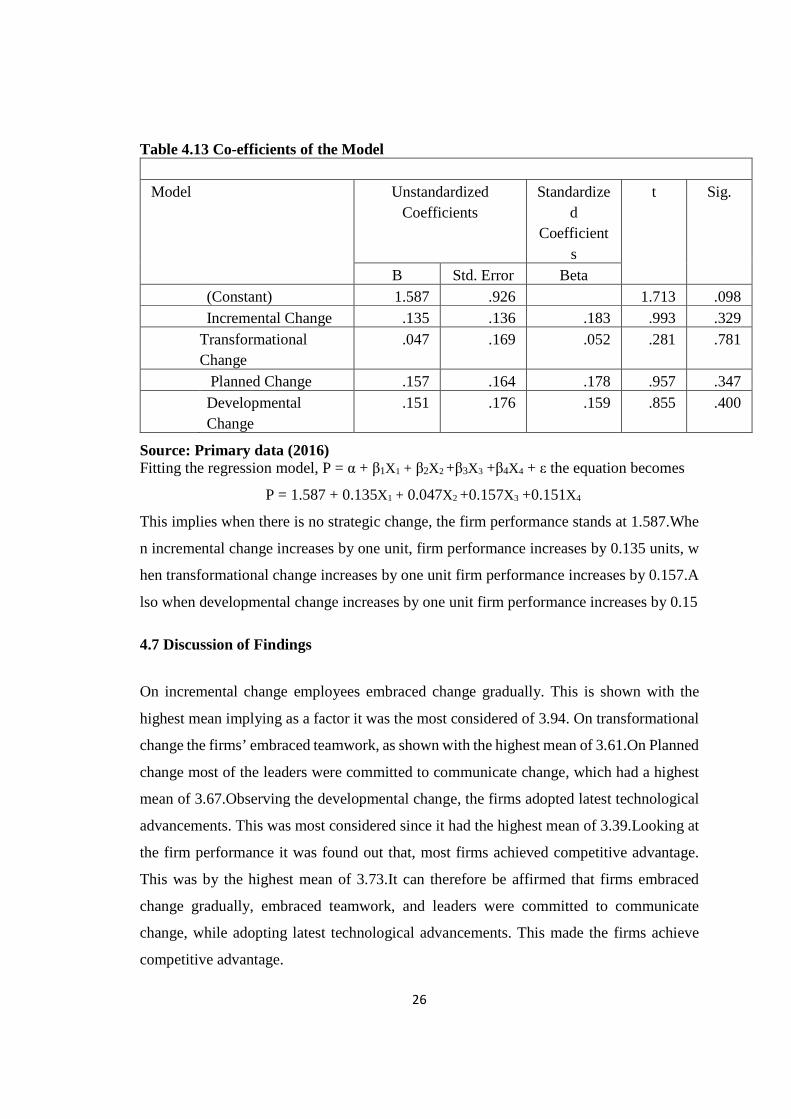
Table 4.13 Co-efficients of the Model
Model Unstandardized Coefficients
Standardized
Coefficients
t Sig.
B Std. Error Beta (Constant) 1.587 .926 1.713 .098 Incremental Change .135 .136 .183 .993 .329 Transformational
Change .047 .169 .052 .281 .781
Planned Change .157 .164 .178 .957 .347 Developmental
Change .151 .176 .159 .855 .400
Source: Primary data (2016) Fitting the regression model, P = α + β1X1 + β2X2 +β3X3 +β4X4 + ε the equation becomes
P = 1.587 + 0.135X1 + 0.047X2 +0.157X3 +0.151X4
This implies when there is no strategic change, the firm performance stands at 1.587.Whe
n incremental change increases by one unit, firm performance increases by 0.135 units, w
hen transformational change increases by one unit firm performance increases by 0.157.A
lso when developmental change increases by one unit firm performance increases by 0.15
4.7 Discussion of Findings
On incremental change employees embraced change gradually. This is shown with the
highest mean implying as a factor it was the most considered of 3.94. On transformational
change the firms’ embraced teamwork, as shown with the highest mean of 3.61.On Planned
change most of the leaders were committed to communicate change, which had a highest
mean of 3.67.Observing the developmental change, the firms adopted latest technological
advancements. This was most considered since it had the highest mean of 3.39.Looking at
the firm performance it was found out that, most firms achieved competitive advantage.
This was by the highest mean of 3.73.It can therefore be affirmed that firms embraced
change gradually, embraced teamwork, and leaders were committed to communicate
change, while adopting latest technological advancements. This made the firms achieve
competitive advantage.
27
Most statistical tests, usually assume normality of data. This study’s data analysis didn’t
assume so. The data was subjected to normality tests, and it was found to be normal. This
warranted the usage of parametric tests. Correlation analysis was conducted, According to
the Pearson Correlation matrix, there was found to be positive and significant relationship
between the dependent and independent variables of the study. Implying increase in the
independent variables will result to an increase in the dependent variables. These findings
are consistent with scholars that did research before. Kenani (2013) found out that
outsourcing strategy and performance had a positive and significant relation in the cement
industry in Kenya. Kamau (2013) found out that there was a significant relationship
between strategic change and organizational performance for large printing firms in
Nairobi. This relationship was positive.
Various local studies focus on management of strategic change in organizations. For
instance, Kenani (2013) did a study on the outsourcing strategy and performance of
outsourced activities in cement industry in Kenya and found out that the need to focus on
core competencies and enhance efficiency were the factors influencing outsourcing
strategy adoption. Ochweri (2012) did a case study research on outsourcing strategy and
performance of the Kenya Institute of Management and found out that outsourcing as a
strategy in the learning institutions can be applied not only to gain the overall performance
of the institution but also to increase student enrolment. Ndope (2010) also investigated the
strategic change management process at the Nairobi Stock Exchange. There was a positive
and significant relation between the dependent and independent variables of the studies.
Regression analysis was conducted, the value of R-square (0.111) implied that 11.1% of
the total variance of financial performance was explained by the model. That meant 88.9%
of the total variance of firm performance values that could not be explained by the model.
The regression equation was fitted, and again the relationship between strategic changes as
explained by incremental change, transformational change, planned change and
developmental change with firm performance was found to be positive and significant.
28
CHAPTER FIVE: SUMMARY, CONCLUSION AND RECOMMENDATIONS
5.1 Introduction This chapter captures the summary of the findings, conclusion and also recommendations
for further study. It is entirely derived from the findings and results of this study in chapter
four.
5.2 Summary
The idea to investigate the relationship of strategic change and organizational performance
for Shipping Firms in Kenya was informed by scanty empirical studies on influence of
strategic change on organizational performance within the shipping firms in Kenya.
The study adopted a cross sectional survey research design that was descriptive in nature.
For each type of change the descriptive statistics (mean and standard deviation) was
analyzed. Descriptive statistics for firm performance was also analyzed. Normality test was
carried out and data was found to be normal both from the Box-plots and the detrended Q-
Q plot. Correlation analysis was carried out and the correlation between the dependent and
independent variables of the study was found to be positive and significant. To determine
linearity of the variables regression analysis was carried out and it was found that there was
a positive relation between firm performance and the independent variables.
The correlation between incremental change and firm performance is 0.194, while the
correlation between transformational change and firm performance is 0.091.The
correlation between planned change and firm performance is 0.329 and lastly the
correlation between developmental change and firm performance is 0.320. Implying
increase in the independent variables (incremental, transformational, planned and
developmental) will result to an increase in the dependent variables (firm
performance).Transformational change was found to have less impact on the firm
performance as shown by the correlation value of 0.091 and the regression co-efficient of
0.047 which was the least in both cases.
29
5.3 Conclusion
The study can attest to the fact that indeed there is a positive and significant relationship
between strategic change and organizational performance for Shipping Firms in Kenya.
This was shown at 5% confidence level.
The study also concluded that the strategic changes in the Shipping firms were planned
change, developmental change, incremental change and transformational change. This was
exhibited by their effect on firm performance.
5.4 Limitations of the Study
The Shipping firms were also limited to the ones based in Mombasa. There could be other
dry port shipping firms which could have affected the study once considered.
5.5 Recommendations
The study recommends stakeholders in the shipping industry to use the findings thereof in
this study for policy making. The government, local community organizations, and custo
mers (clients), employees, media, competitors, suppliers and consumer advocates are also
recommended to use findings of this study in various areas of decision making.
To the academicians, the findings of this study can be used as literature in research and c
oursework. The same literature can be used by practicing chief executives and other intere
sted persons.
5.6 Suggestion for further studies The current study focused on shipping firms in Kenya. This excludes other industries, and
future studies should consider other sectors such as aviation industry and bus companies.
Since the strategic change factors affected only 11.1% of the firm performance, it would
be good to conduct a study and determine what the other 88.9% of the effects are. Thus,
this is the recommendation by this study.
The research also recommends studies to be done across the region and compare the
findings. It would be interesting to find out how the results of the same study would be in
other economies.
30
REFERENCES
Abrahamson, E. (2000). Change without pain. Harvard business review, 78(4), 75-81.
Andrews, K. (1971), The Concept of Corporate strategy. Homewood, IL: Dow Jones Irwin.
Alchian, A. & Woodward, S. 1988. The firm is dead; long live the firm: A review of Oliver
E. Williamson's The Economic Institutions of Capitalism. Journal of Economic
Literature, 26: 165-179.
Auma, O(2013) An evaluation the management of strategic change in HIV-research
laboratory at the Kenya Medical Research Institute/Centre of Disease Control And
Prevention (Kemri/CDC). Unpublished MBA report. University of Nairobi.
Blumenthal, B., & Haspeslagh, P. (1994). Toward a definition of corporate transformation.
Sloan Management Review, 35(3), 101-106.
Bruch, H. and Ghoshal, S. (2004), The bold decisive manager: cultivating a company of
action takers. Business Journal, 27 (1), 1-6.
Burnes, B. (2004), Managing change: a strategic approach to organizational dynamics.
London: Prentice Hall.
Burnes, B. (2004), Kurt Lewin and the planned approach to change: A re-appraisal. Journal
of Management Studies, 41, 977-1002
Carlson, S., Mintzberg, H., & Stewart, R. (1991). Executive behaviour (Vol. 32):
Upsaliensis Academiae.
Davenport. T.H. and Beck. J.C. (2000), Getting the attention you need. Harvard Business
Review, 42 (3), 118-126.
Del Val, M. P., & Fuentes, C. M. (2003). Resistance to change: a literature review and empirical study. Management Decision, 41(2), 148-155.
31
DiMaggio, J., and Powell, W.,(1991)‘Introduction’. In P. J. DiMaggio and W. Powell (eds.)
‘The New Institutionalism and Organizational Analysis’, pp. 1–38. Chicago:
University of Chicago Press.
DiMaggio,J., and Powell, W., (1983)“The iron cage revisited: Institutional isomorphism
and collective rationality in organizational fields,” American Sociological Review
48:147-60.
Dutton.J. and Duncan.R. (1987), The Creation of momentum for change through the
process of strategic issue diagnosis.Strategic Management Journal, 8(3), 279- 296.
Freeman, R.E. and Mcvea, J. (2001), A stakeholder approach to strategic management.
London: McGraw-Hill.
Gersick, C. J. G. (1991). Revolutionary change theories: A multilevel exploration of the
punctuated equilibrium paradigm. Academy of management review, 10-36.
Greiner, L. E. (1997). Evolution and Revolution as Organizations Grow: A company's
past has clues for management that are critical to future success. Family Business Review, 10(4), 397-409.
Ghoshal, S., & Bartlett, C. A. (2005). Rebuilding behavioral context: A blueprint for
corporate renewal. Sumantra Ghoshal on management: a force for good, 159.
Fullan, D.L. (2001), "The impact of cultural values on job satisfaction and organizational commitment in self-managing work teams: The mediating role of employee resistance",The Academyof Management Journal, Vol. 44 No.3, pp.557-69.
Hambrick, D.E and Mason, P.A. (1984), Upper echelons: the organizations as a reflection
of its top managers. Academy of management Review, 9(3), 231-248.
Hamel, G., & Prahalad, C. K. (1996). Competing for the Future: Harvard Business Press.
32
Hammer, M. (1990). Reengineering work: don't automate, obliterate. Harvard business review, 68(4), 104-112.
Hofer, C.W. and Schendel, D. (1978), Strategy formulation, analytical concepts. St. Paul,
MN: West Publishing.
Hutt, M. D., Walker, B. A., & Frankwick, G. L. (1995). Hurdle the cross-functional
barriers to strategic change. Sloan Management Review, 36, 22-22.
Johnson, G. and Scholes, K. (2010), Exploring corporate strategy: Concept and cases.
London: Prentice Hall.
Jones, G. (1998) Don't throw the baby out with the bathwater: A positive interpretation of transaction cost theory, Working Paper. Texas A&M University.
Kamau, R(2013) Relationship Between Strategic Change and Organizational Performance
of Large Printing Firms in Nairobi Kenya. Unpublished MBA report. University of
Nairobi.
Kegan, R., & Lahey, L. L. (2001). The real reason people won't change. Harvard
business review, 79(10), 84-93. Kenani A.J (2013), The Outsourcing Strategy and Performance of Outsourced Activities
in Cement Industry in Kenya Unpublished MBA project, University of Nairobi.
Kiesler, S.B. and Sproull, L. (1982), Managerial response to changing environments:
Perspectives on problem sensing from social cognition. Administrative Science
Quarterly, 27 (3), 548-570.
Kottler, J. (2008), Leading change. Boston: Harvard Business School Press.
Lilie, F. (2002), Umsetzung von change management. Quality Management, 47(1), 14- 17.
Luo, Y. and Tan, J. (1998) A Comparison of Multinational and Domestic Firms in an Emerging Market: A Strategic Choice Perspective.Journal of International Management, Vol. 4, No. 1, pp. 21-40.
33
Maguire S. & McKelvey B. (1999) ‘Complexity and Management: Moving from Fad to
Firm Foundations’ Emergence, 1(2), 1999, 19-61
Mbogo, M .(2003), A study of Strategy change management process in Hybrid private
public organizations: the case of Kenya commercial Bank limited. unpublished
MBA project, Nairobi: University of Nairobi
Mekgoe., N (2008) The impact of strategy change on morale, performance and commitment. Unpublished MBA Thesis.Durban University of Technology. South Africa
Meyer, W., and Rowan, B., (1977)‘Institutionalized organizations: Formal structure as
myth and ceremony’. American journal of sociology 83: 340–363.
Masaaki, I. (1986). Kaizen: The key to Japan's competitive success: New York, NY:
McGraw-Hill.
Michalska, J. (2005). The usage of the balanced scorecard for the estimation of enterprise
effectiveness.Journal of Materials Processing Technology, (162-163), 751-
758.http://dx.doi.org/10.1016/j.jmatprotec.2005.02.227
Mutura, G (2012) Stakeholder Involvement in Strategic Change Management Process within the Insurance Industry in Nairobi, Kenya Unpublished MBA project, Nairobi: University of Nairobi.
Newhouse, David R. and Chapman, Ian D. (1996), .Organizational Transformation: A
Case Study of Two Aboriginal Organizations., Human Relations, Vol.49, No.7,
pp.995-1011.
Ndope, A.S. (2010), Strategic change management process at the Nairobi Stock Exchange.
Unpublished MBA project, Nairobi: University of Nairobi
Niven, P. R. (2002). Balanced Scorecard Step-by-Step: Maximizing performance and maintaining result. New York: John Wiley & Sons. Inc.
Nyamache, N.M. (2003), Strategic change management process in the public sector. A case
of study the civil service reform program in Kenya. 1992-2003. Unpublished MBA
project, Nairobi: University of Nairobi.
34
Nyachoti, P (2014) Strategic Change Management and performance at National Bank of
Kenya Limited. Unpublished MBA project, Nairobi: University of Nairobi.
Pfeifer, T. and Bisenius, A. (2002), Quality management: Strategies for Modern
technology. Munchen: Carl Hanser.
Rodrigues, L. C., & Bisland, D. Managing Strategic Change of A traditional corporation:
the latter strategic changes at hering textil company s/a.
Rosenzweig, P . and Singh. J.(1991) Organizational environments and the multinational
enterprise. Academy of Management Review,16(2):340-361
Ruiz Navarro, J., Gómez, L., & Daniel, J. (1999). Cambio estratégico y renovación
organizativa: utilización de las capacidades latentes y periféricas. Revista europea
de dirección y economía de la empresa, 8(4), 71-82.
Sean,C.et al.(2006).BSc in higher education.TQM magazine, 8(2), 190-205.
Scott, W. (1995).Institutions and Organizations. Thousand Oaks, CA: Sage
Scott, W. (2004) “Institutional theory.” in Encyclopedia of Social Theory, George Ritzer,
ed. Thousand Oaks, CA: Sage. Pp. 408-14
Suchman, C., (1995) “Localism and globalism in institutional analysis: The emergence of
contractual norms in venture finance.” In The Institutional Construction of
Organizations: International and Longitudinal Studies, 39-63, W. Richard Scott,
and Søren Christensen, ed. Thousand Oaks, CA: Sage.
Thompson, J. D. (2003). Organizations in action: Social science bases of administrative
theory: Transaction Pub. Tushman, M. L., & O'Reilly III, C. A. (2006). Ambidextrous organizations: Managing
evolutionary and revolutionary change. Managing innovation and change.
35
Van de Ven, A.H. and Poole, M.S. (1995), Explaining development and change in
organizations. Academy of Management Review, 20 (3), 510-540
Wadongo, E., Odhuno, E., Kambona., O., and Othuon, L.,(2010) Key performance
indicators in the Kenyan hospitality industry: a managerial
perspective.Benchmarking: An International Journal Vol. 17 No. 6, pp. 858-875
Weick, K. E., & Quinn, R. E. (1999). Organizational change and development. Annual
review of psychology, 50(1), 361-386.
Williamson, O. (1985) The economic institutions of capitalism: Firms, markets, relational contracting. New York: Free Press
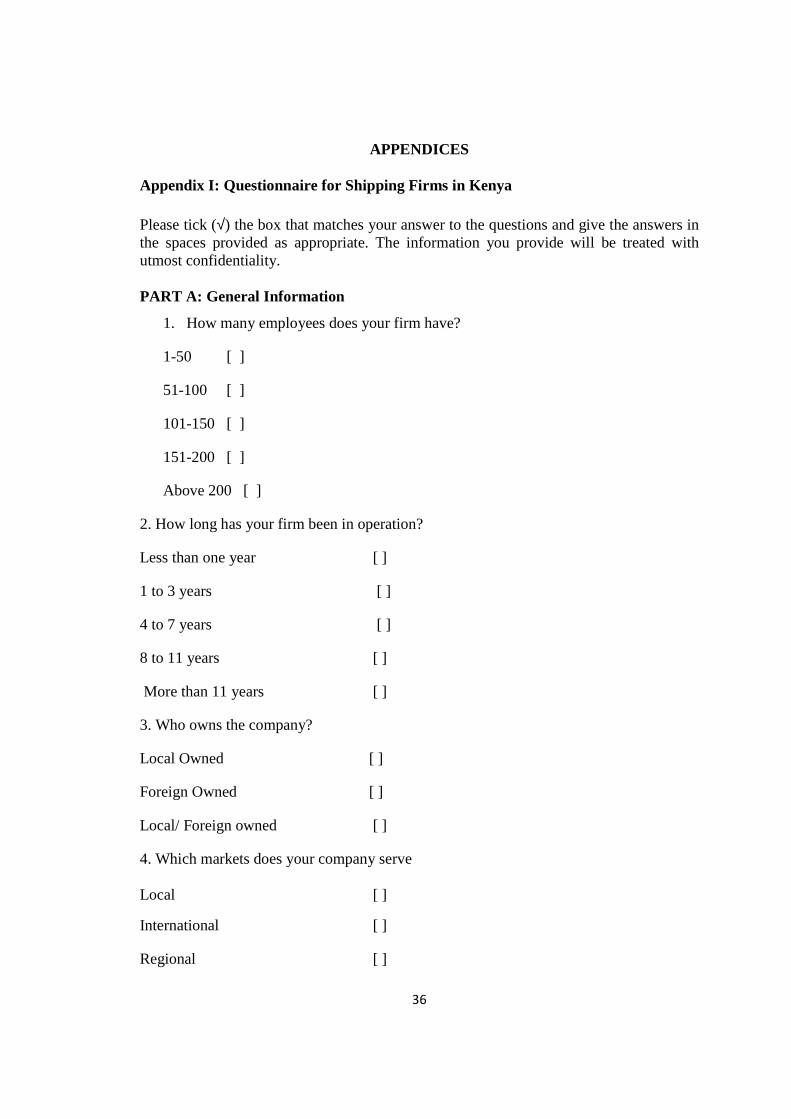
36
APPENDICES
Appendix I: Questionnaire for Shipping Firms in Kenya Please tick (√) the box that matches your answer to the questions and give the answers in the spaces provided as appropriate. The information you provide will be treated with utmost confidentiality. PART A: General Information
1. How many employees does your firm have?
1-50 [ ]
51-100 [ ]
101-150 [ ]
151-200 [ ]
Above 200 [ ]
2. How long has your firm been in operation?
Less than one year [ ]
1 to 3 years [ ]
4 to 7 years [ ]
8 to 11 years [ ]
More than 11 years [ ]
3. Who owns the company?
Local Owned [ ]
Foreign Owned [ ]
Local/ Foreign owned [ ]
4. Which markets does your company serve Local [ ]
International [ ]
Regional [ ]
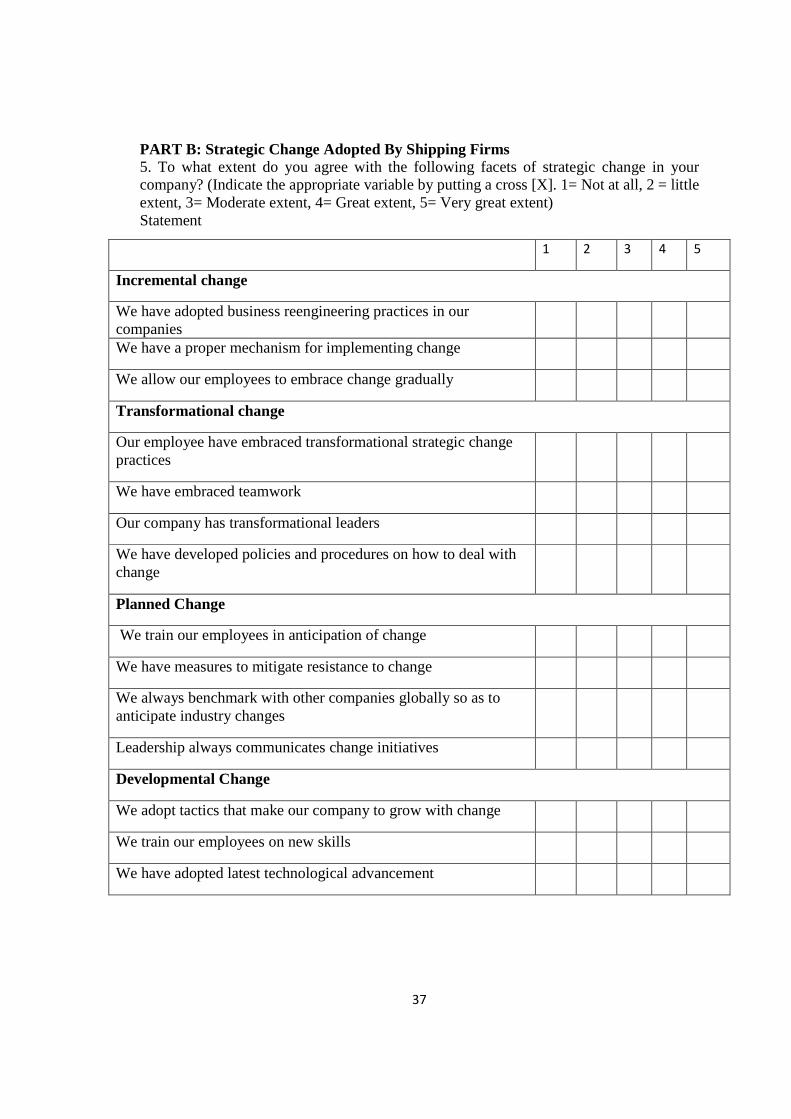
37
PART B: Strategic Change Adopted By Shipping Firms 5. To what extent do you agree with the following facets of strategic change in your company? (Indicate the appropriate variable by putting a cross [X]. 1= Not at all, 2 = little extent, 3= Moderate extent, 4= Great extent, 5= Very great extent) Statement
1 2 3 4 5
Incremental change
We have adopted business reengineering practices in our companies
We have a proper mechanism for implementing change
We allow our employees to embrace change gradually
Transformational change
Our employee have embraced transformational strategic change practices
We have embraced teamwork
Our company has transformational leaders
We have developed policies and procedures on how to deal with change
Planned Change
We train our employees in anticipation of change
We have measures to mitigate resistance to change
We always benchmark with other companies globally so as to anticipate industry changes
Leadership always communicates change initiatives
Developmental Change
We adopt tactics that make our company to grow with change
We train our employees on new skills
We have adopted latest technological advancement
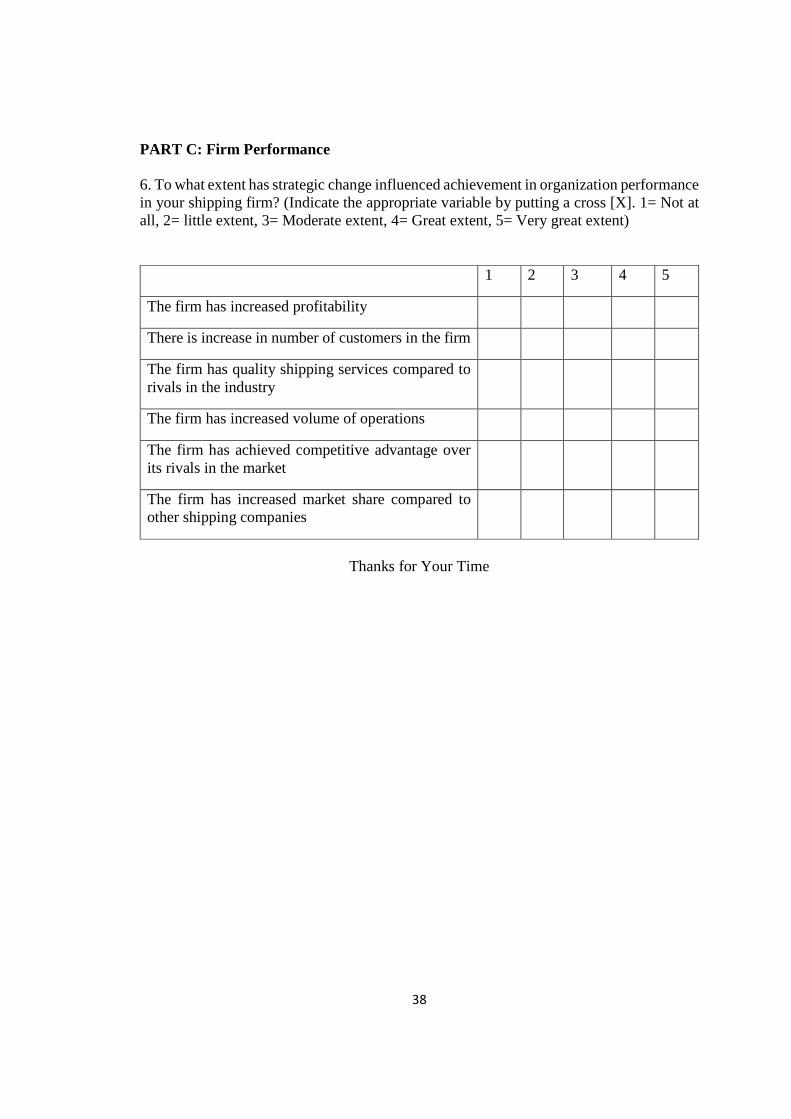
38
PART C: Firm Performance 6. To what extent has strategic change influenced achievement in organization performance in your shipping firm? (Indicate the appropriate variable by putting a cross [X]. 1= Not at all, 2= little extent, 3= Moderate extent, 4= Great extent, 5= Very great extent) 1 2 3 4 5
The firm has increased profitability
There is increase in number of customers in the firm
The firm has quality shipping services compared to rivals in the industry
The firm has increased volume of operations
The firm has achieved competitive advantage over its rivals in the market
The firm has increased market share compared to other shipping companies
Thanks for Your Time
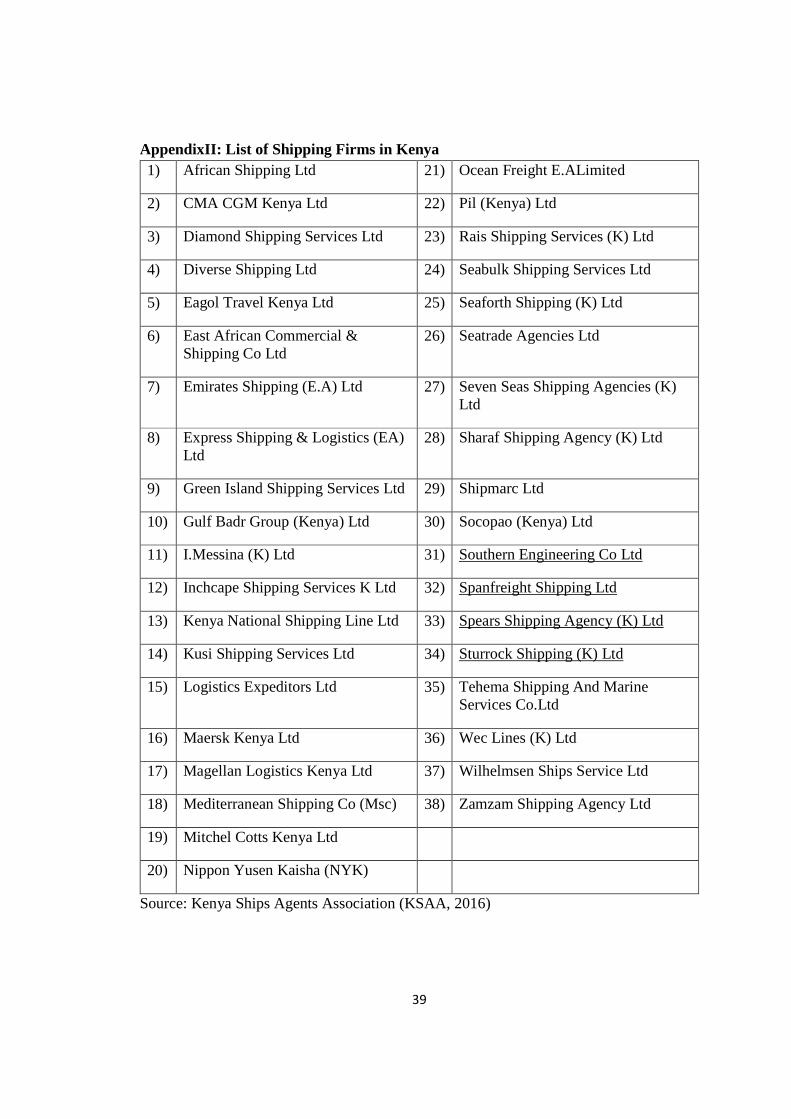
39
AppendixII: List of Shipping Firms in Kenya 1) African Shipping Ltd 21) Ocean Freight E.ALimited
2) CMA CGM Kenya Ltd 22) Pil (Kenya) Ltd
3) Diamond Shipping Services Ltd 23) Rais Shipping Services (K) Ltd
4) Diverse Shipping Ltd 24) Seabulk Shipping Services Ltd
5) Eagol Travel Kenya Ltd 25) Seaforth Shipping (K) Ltd
6) East African Commercial & Shipping Co Ltd
26) Seatrade Agencies Ltd
7) Emirates Shipping (E.A) Ltd 27) Seven Seas Shipping Agencies (K) Ltd
8) Express Shipping & Logistics (EA) Ltd
28) Sharaf Shipping Agency (K) Ltd
9) Green Island Shipping Services Ltd 29) Shipmarc Ltd
10) Gulf Badr Group (Kenya) Ltd 30) Socopao (Kenya) Ltd
11) I.Messina (K) Ltd 31) Southern Engineering Co Ltd
12) Inchcape Shipping Services K Ltd 32) Spanfreight Shipping Ltd
13) Kenya National Shipping Line Ltd 33) Spears Shipping Agency (K) Ltd
14) Kusi Shipping Services Ltd 34) Sturrock Shipping (K) Ltd
15) Logistics Expeditors Ltd 35) Tehema Shipping And Marine Services Co.Ltd
16) Maersk Kenya Ltd 36) Wec Lines (K) Ltd
17) Magellan Logistics Kenya Ltd 37) Wilhelmsen Ships Service Ltd
18) Mediterranean Shipping Co (Msc) 38) Zamzam Shipping Agency Ltd
19) Mitchel Cotts Kenya Ltd
20) Nippon Yusen Kaisha (NYK)
Source: Kenya Ships Agents Association (KSAA, 2016)
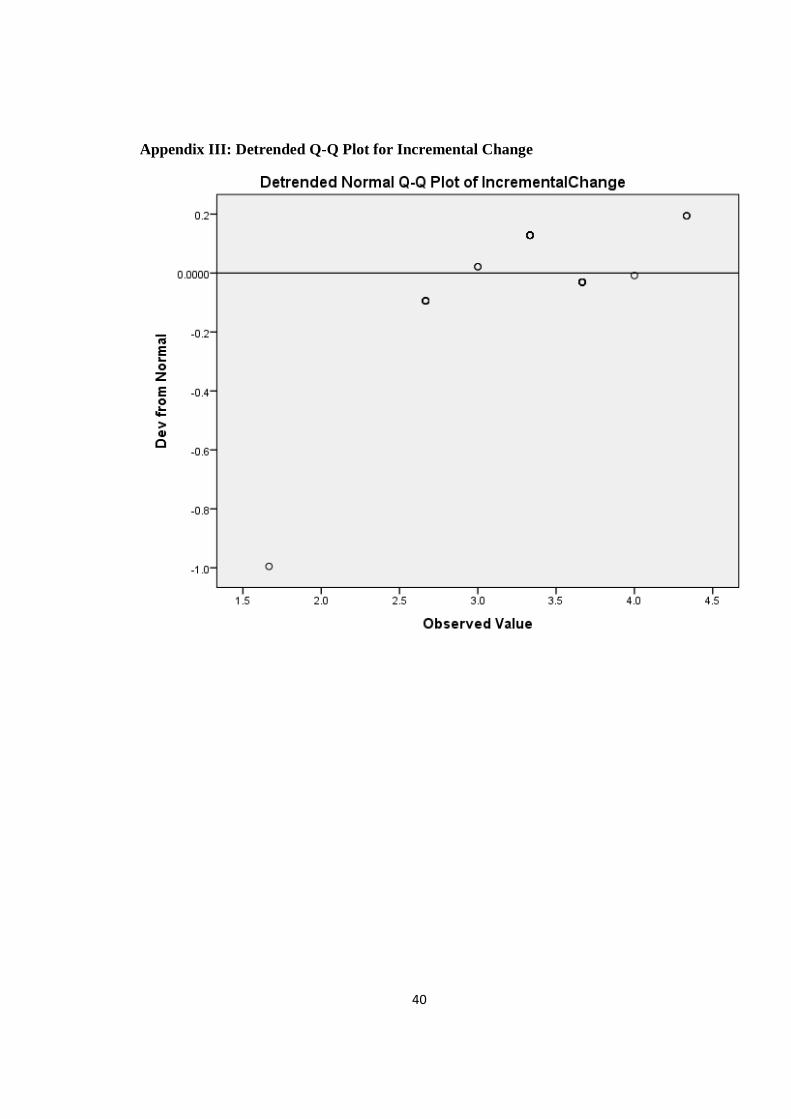
40
Appendix III: Detrended Q-Q Plot for Incremental Change
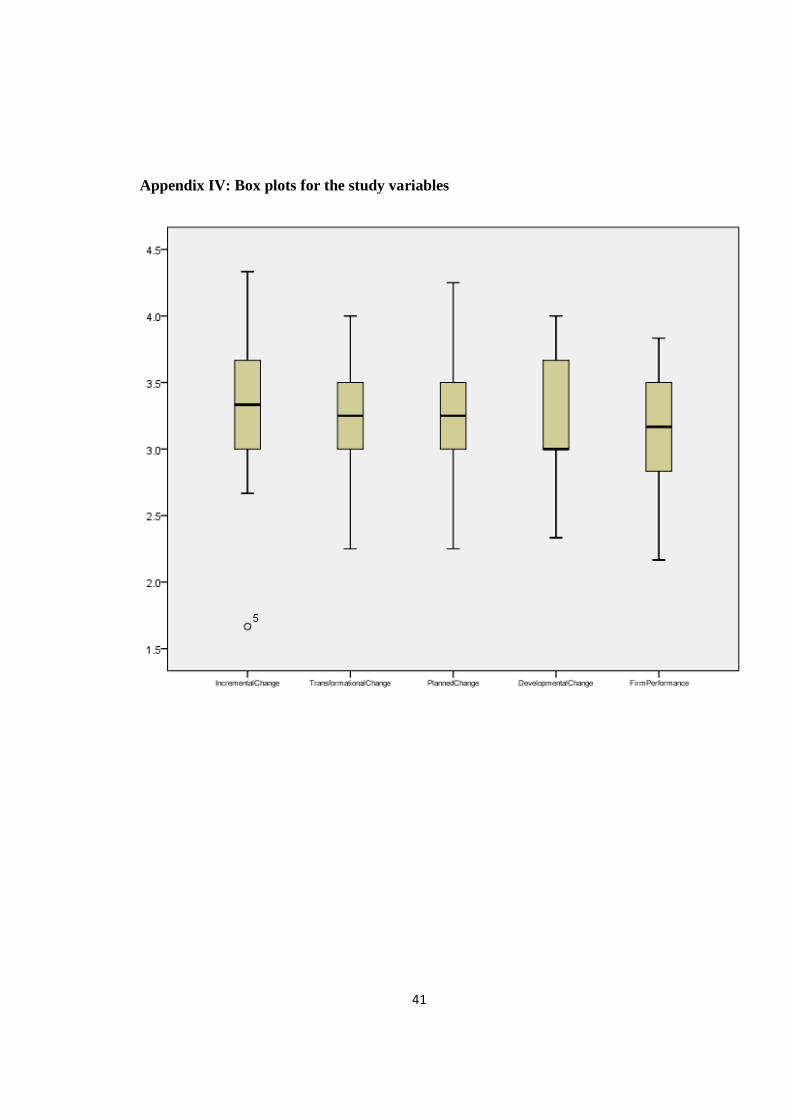
41
Appendix IV: Box plots for the study variables

42

43


![Strategic Change[1]](https://img.pdfslide.net/doc/110x75/577d28f61a28ab4e1ea5a99a/strategic-change1.jpg)