Embed Size (px)
DESCRIPTION
This report presents a relationship between the financial inclusion and development, by studyingdata from three relatively developed and three relatively under developed Indian states. This report also presents effects of financial inclusion on development of different states.
Citation preview
1 | P a g e
Relationship between Development andFinancial Inclusion at district level
Submitted by
Mangesh Dharwad – 12125026
To
Department of Industrial and Management Engineering
In requirement for the Special Studies Course: MBA 2014
Date of Submission: 15th April 2014
1 | P a g e
Relationship between Development andFinancial Inclusion at district level
Submitted by
Mangesh Dharwad – 12125026
To
Department of Industrial and Management Engineering
In requirement for the Special Studies Course: MBA 2014
Date of Submission: 15th April 2014
1 | P a g e
Relationship between Development andFinancial Inclusion at district level
Submitted by
Mangesh Dharwad – 12125026
To
Department of Industrial and Management Engineering
In requirement for the Special Studies Course: MBA 2014
Date of Submission: 15th April 2014
2 | P a g e
Table of Contents1. Executive summary ...............................................................................................................................4
2. Acknowledgement ................................................................................................................................5
3. Introduction .......................................................................................................................................... 6
4. Financial Inclusion................................................................................................................................. 6
5. Measures and steps taken by RBI and GOI ...........................................................................................7
6. Expectations of poor people from financial system .............................................................................8
7. Study of Six states ................................................................................................................................. 9
8. Simple Linear Regression model .........................................................................................................14
8.1. Observations ...............................................................................................................................15
8.2. Conclusions .................................................................................................................................15
9. Multiple Linear Regression Model ......................................................................................................15
9.1. Observations ...............................................................................................................................16
9.2. Conclusions .................................................................................................................................16
10. State wise relationship....................................................................................................................17
11. Final Analysis...................................................................................................................................18
12. References ......................................................................................................................................20
13. Exhibits............................................................................................................................................21
3 | P a g e
List of TablesTable 6.1: Financial Index for Punjab…………………………………………………………………………...........12
Table 6.2: Weighteges for calculation of financial index …………………………………………………………....13
Table 7.1: Regression model summary……………………………………………………………………………….14
Table 8.1: Multiple Linear regression model summary……………………………………………………………....16
List of FiguresFig. 3.1: Important financial services for financial inclusion ……………………………………………………….7
Fig. 6.1: Backwardness index ………………………………………..……………………………………………10
Fig. 9.1: District wise result of Development Index vs. Financial index for each state……………………………..17
Fig. 9.2: Combined result of Development Index vs. Financial index for all states…………………………….........18
4 | P a g e
1. Executive summaryThe development of a state is the consequence of a complex set of historical, cultural, and
sociological factors. Financial inclusion is one of these factors. Government of India (GOI) and
Reserve Bank of India (RBI) together has initiated a number of steps to bring financial inclusion
in all parts of India. Major purpose behind it is to bring the development in those parts.
This report presents a relationship between the financial inclusion and development, by studying
data from three relatively developed and three relatively under developed Indian states. This
report also presents effects of financial inclusion on development of different states.

5 | P a g e
2. AcknowledgementThe successful accomplishment of this special study project and the contentment it accounts for
would be incomplete without the mention Prof. A.P.Sinha whose ceaseless cooperation made it
possible, whose constant guidance and encouragement crowned all efforts with success. I am
grateful to Prof. A.P.Sinha for the guidance, inspiration and suggestions that helped me in
improvement and final preparation of this project.
6 | P a g e
3. IntroductionThere are various factors which are responsible for development in a district, a state or a
country. There are various categories of developments which includes social development,
economical development, agricultural development etc. These developments could be measured
with various indices such as per capita income, gross domestic product, life expectancy, literacy
rate, standard of living etc. Various organizations across the world comes up with a human
development index to which could be a result of all the above indices and which could be used to
show development across any district, state or country.
Now the factors which are responsible for development include availability of basic
infrastructure, primary education facilities, health care facilities, job opportunities in a district
etc. Financial inclusion is one of the most important factors responsible for development.
Development could get a boost if very able financial inclusion facilities are available and poor
people have easy access to these facilities.
To find out the relationship between financial inclusion and development at district level, 105
districts across 6 states in India have been studied by considering various parameters for
development and financial inclusion. We will look at financial inclusion in detail first and then
study its relationship with development at district level for six states in India.
4. Financial InclusionFinancial inclusion can be defined as the process of ensuring access to financial services and
timely and adequate credit where needed by vulnerable groups such as weaker sections and low
income groups at an affordable cost.
Financial inclusion refers to universal access to a wide range of financial services at a
reasonable cost. These include not only banking products but also other financial services such
as insurance and equity products. The essence of financial inclusion is to ensure delivery of
financial services which include – bank accounts for savings and transactional purposes, low cost
credit for productive, personal and other purposes, financial advisory services, insurance
facilities (life and non-life) etc.
7 | P a g e
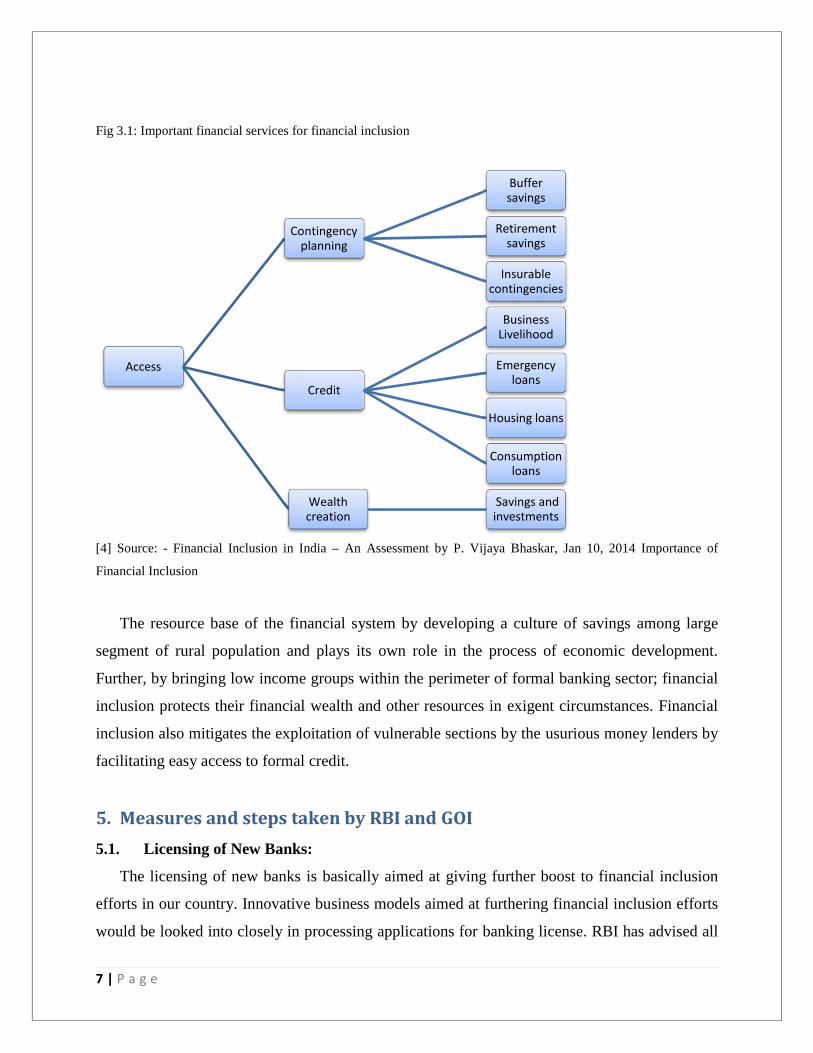
Fig 3.1: Important financial services for financial inclusion
[4] Source: - Financial Inclusion in India – An Assessment by P. Vijaya Bhaskar, Jan 10, 2014 Importance of
Financial Inclusion
The resource base of the financial system by developing a culture of savings among large
segment of rural population and plays its own role in the process of economic development.
Further, by bringing low income groups within the perimeter of formal banking sector; financial
inclusion protects their financial wealth and other resources in exigent circumstances. Financial
inclusion also mitigates the exploitation of vulnerable sections by the usurious money lenders by
facilitating easy access to formal credit.
5. Measures and steps taken by RBI and GOI5.1. Licensing of New Banks:
The licensing of new banks is basically aimed at giving further boost to financial inclusion
efforts in our country. Innovative business models aimed at furthering financial inclusion efforts
would be looked into closely in processing applications for banking license. RBI has advised all
Access
Contingencyplanning
Credit
Wealthcreation
7 | P a g e
Fig 3.1: Important financial services for financial inclusion
[4] Source: - Financial Inclusion in India – An Assessment by P. Vijaya Bhaskar, Jan 10, 2014 Importance of
Financial Inclusion
The resource base of the financial system by developing a culture of savings among large
segment of rural population and plays its own role in the process of economic development.
Further, by bringing low income groups within the perimeter of formal banking sector; financial
inclusion protects their financial wealth and other resources in exigent circumstances. Financial
inclusion also mitigates the exploitation of vulnerable sections by the usurious money lenders by
facilitating easy access to formal credit.
5. Measures and steps taken by RBI and GOI5.1. Licensing of New Banks:
The licensing of new banks is basically aimed at giving further boost to financial inclusion
efforts in our country. Innovative business models aimed at furthering financial inclusion efforts
would be looked into closely in processing applications for banking license. RBI has advised all
Contingencyplanning
Buffersavings
Retirementsavings
Insurablecontingencies
Credit
BusinessLivelihood
Emergencyloans
Housing loans
Consumptionloans
Wealthcreation
Savings andinvestments
7 | P a g e
Fig 3.1: Important financial services for financial inclusion
[4] Source: - Financial Inclusion in India – An Assessment by P. Vijaya Bhaskar, Jan 10, 2014 Importance of
Financial Inclusion
The resource base of the financial system by developing a culture of savings among large
segment of rural population and plays its own role in the process of economic development.
Further, by bringing low income groups within the perimeter of formal banking sector; financial
inclusion protects their financial wealth and other resources in exigent circumstances. Financial
inclusion also mitigates the exploitation of vulnerable sections by the usurious money lenders by
facilitating easy access to formal credit.
5. Measures and steps taken by RBI and GOI5.1. Licensing of New Banks:
The licensing of new banks is basically aimed at giving further boost to financial inclusion
efforts in our country. Innovative business models aimed at furthering financial inclusion efforts
would be looked into closely in processing applications for banking license. RBI has advised all
8 | P a g e
banks to open and operate Basic Saving Bank Deposit (BSBD) accounts with minimum facilities
such as no minimum balance, deposit and withdrawal of cash at bank branch and ATMs and
facility of providing ATM card. [5]
5.2. Relaxation and simplification of KYC norms
RBI relaxed and simplified KYC norms to help easy opening of bank accounts, especially
for small accounts with balances not exceeding Rs.50,000 and aggregate credits in the accounts
not more than Rs.1,00,000 a year. [5][6]
5.3. Branch authorization policy
RBI has eased branch authorization policy, to address the 8 issues of uneven spread bank
branches, domestic SCBs are permitted to freely open branches in Tier 2 to Tier 6 centers with
population of less than one lakh under general permission, subject to reporting.
There is a compulsory requirement of opening branches in villages with no banks, banks is
directed to allocate at least 25 per cent of the total number of branches to be opened during the
year in (Tier 5 and Tier 6) rural centers with no banks. [5]
Some of the steps that are required to be taken are opening of intermediate brick and mortar
structure to bring about effective cash management, redressal of customer grievances and close
supervision of branch operations, improved documentation, banks have also been advised to
open intermediate structures between the present base branch and BC locations. [7]
Private and public sector banks has been advised to submit board approved three year Financial
Inclusion Plan (FIP) starting from April 2010.
6. Expectations of poor people from financial systemSome of the expectations of poor people from banking system is low transaction costs, ease
of access, security and safety of deposits, suitable operating time, bare minimum paper work,
ability to conduct easily effective frequent deposits, avail quick and easy access to credit and
other products including remittances suitable to their income streams and consumption patterns.
If we provide small, uncomplicated and affordable financial products it could bring low income
group into formal financial inclusion. Often we see that because of unavailability of the financial
instruments poor people borrow money from money lenders at very high rate. They require
9 | P a g e
money during their illness or death of primary breadwinner. Banks have major role to bring
about changes in their lives not only as a social obligation but also as a business proposition.
This push for financial inclusion has come from Government of India as the high level micro
policy.
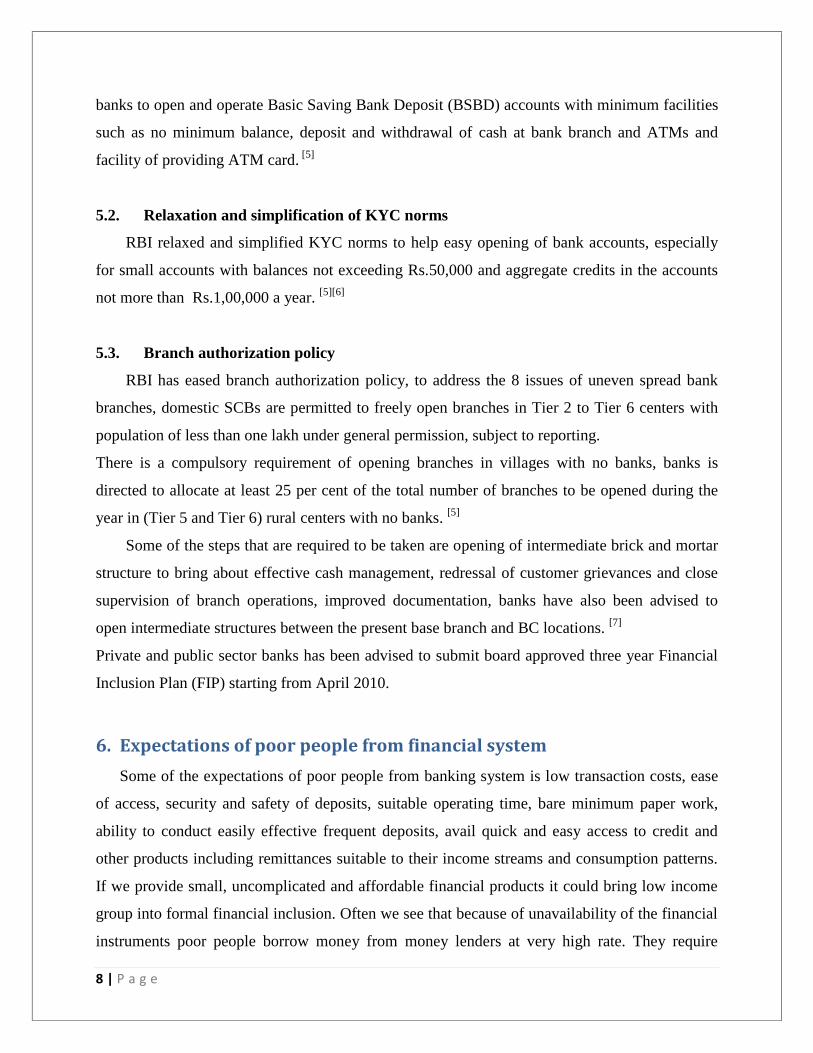
7. Study of Six statesTo find out the relationship between the financial inclusion and its effects on development at
the district level study conducted by RBI is considered for analysis.
As per the study conducted by GOI, Ministry of Finance, September 2013, backwardness index
was calculated to allocate funds based on state’s development needs and development
performance. Less developed states rank higher on the index and would get larger allocation of
funds based on the development criterion. The underdevelopment index represents the need of an
average individual in a state.
The methodology used by the committee to propose a backwardness index considered following
ten parameters –
1) monthly per capita consumption expenditure
2) education
3) health
4) household amenities
5) poverty rate
6) female literacy
7) percent of SC-ST, population
8) urbanization rate
9) financial inclusion
10) connectivity
As per this report states that score 0.6 and above on development index are considered as
“least developed” states, states scoring below 0.6 and above 0.4 are considered as “less
developed” states, while states that score below 0.4 are considered as “relatively developed”
states. The 10 “least developed” states that currently score above 0.6 could, for instance, would
be targeted for additional assistance. And it is considered that as states develop fast, they will
10 | P a g e
move out of the “least developed” segment, but there would always be some states which would
occupy the position in least developed category because of the index is relative in nature.
Backwardness index
Fig. 7.1: Backwardness index [8]
[8] Source: Report of the committee for evolving a composite development index of states by GOI, Ministry of
Finance, Sept 2013
Three least developed states and three relatively developed states have been considered for
finding relationship between financial inclusion and development at district level.
Least developed states
1) Chhattisgarh
2) Jharkhand
3) Arunachal Pradesh
Relatively developed states
1) Kerala
2) Punjab
3) Uttarakhand
Following steps are used to analyze the relationship between financial inclusion and
development at district level.
11 | P a g e
Parameters used for Financial Index
1) Number of Banks in a district
As we saw earlier financial inclusion is the process of ensuring access to financial services
and timely and adequate credit banks plays the most important role in financial inclusion.
Without having a very good network of banks in rural areas it is impossible to bring financial
inclusion. So bank network will play important role in coming up with financial index.
2) Number of Post offices in a district
The Indian post office offer lot of financial services which include post office savings
schemes, postal life insurance, mutual funds, money remittance etc. The department of post
office has also taken the responsibility to disburse MGNREGA wages through post offices by
opening savings bank accounts in the names of MGNEREGA beneficiaries. This makes post
offices the second most important factor after bank network in calculating financial index. [9]
Various savings products of Indian post office [9]
- Saving account scheme
- Recruiting deposit scheme
- Time deposit account
- Monthly income scheme
- National savings certificate
- Public provident fund scheme
- Postal life insurance
- Rural postal life insurance
Calculation of Financial Index
1) Financial index is calculated using number of banks per 10000 people [2] in a district and
number of post offices per 10000 people in a district. [1]
2) To calculate the index following formula is used
di = ( Ai – mi)/ (Mi - mi)[3]
Where,
12 | P a g e
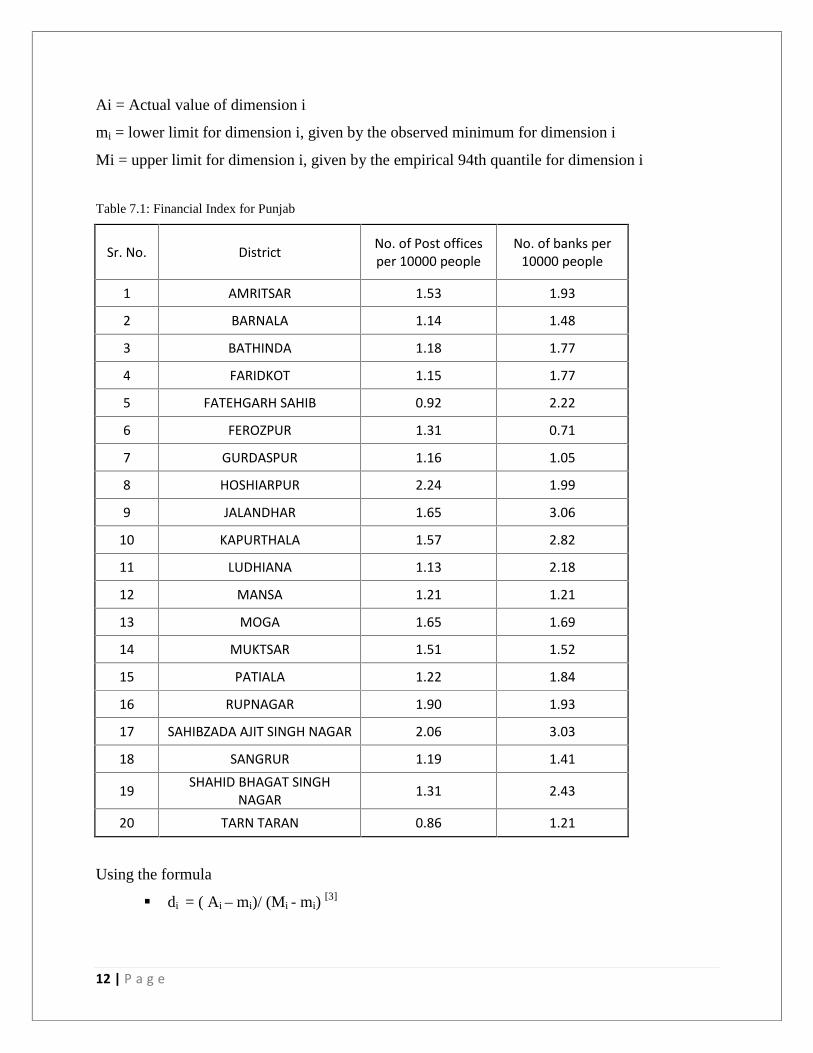
Ai = Actual value of dimension i
mi = lower limit for dimension i, given by the observed minimum for dimension i
Mi = upper limit for dimension i, given by the empirical 94th quantile for dimension i
Table 7.1: Financial Index for Punjab
Sr. No. District No. of Post officesper 10000 people
No. of banks per10000 people
1 AMRITSAR 1.53 1.93
2 BARNALA 1.14 1.48
3 BATHINDA 1.18 1.77
4 FARIDKOT 1.15 1.77
5 FATEHGARH SAHIB 0.92 2.22
6 FEROZPUR 1.31 0.71
7 GURDASPUR 1.16 1.05
8 HOSHIARPUR 2.24 1.99
9 JALANDHAR 1.65 3.06
10 KAPURTHALA 1.57 2.82
11 LUDHIANA 1.13 2.18
12 MANSA 1.21 1.21
13 MOGA 1.65 1.69
14 MUKTSAR 1.51 1.52
15 PATIALA 1.22 1.84
16 RUPNAGAR 1.90 1.93
17 SAHIBZADA AJIT SINGH NAGAR 2.06 3.03
18 SANGRUR 1.19 1.41
19 SHAHID BHAGAT SINGHNAGAR 1.31 2.43
20 TARN TARAN 0.86 1.21
Using the formula
di = ( Ai – mi)/ (Mi - mi)[3]
13 | P a g e
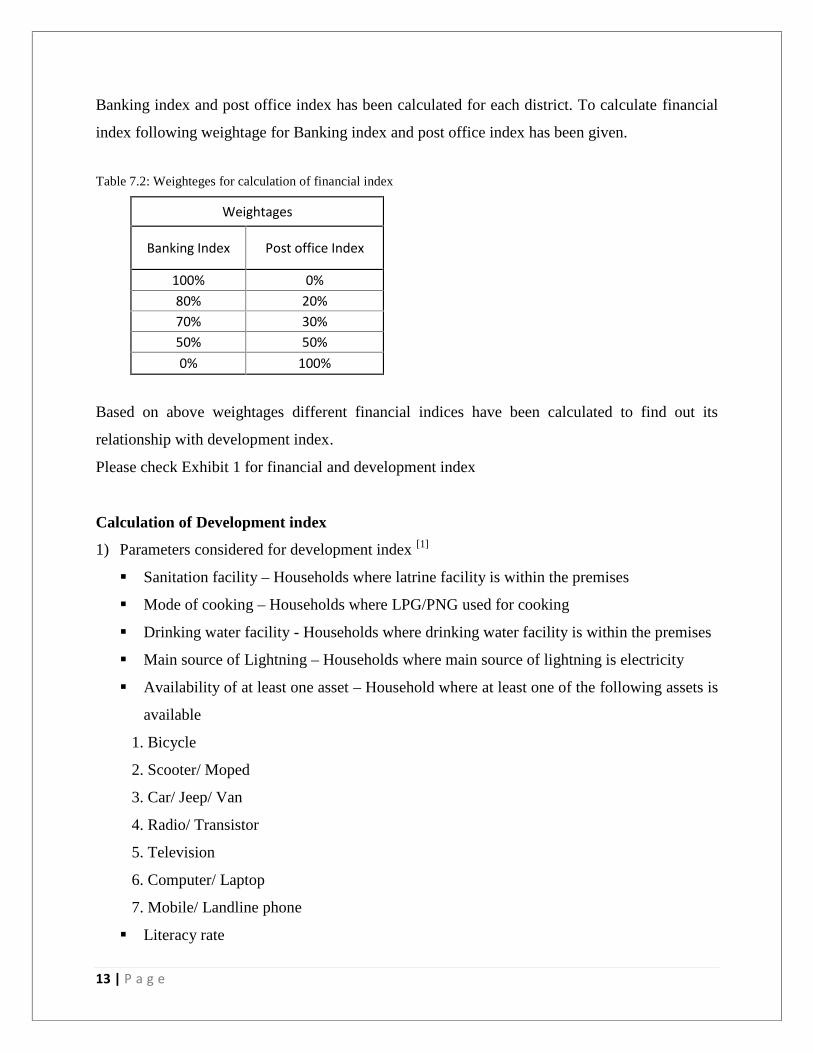
Banking index and post office index has been calculated for each district. To calculate financial
index following weightage for Banking index and post office index has been given.
Table 7.2: Weighteges for calculation of financial index
Weightages
Banking Index Post office Index
100% 0%80% 20%70% 30%50% 50%0% 100%
Based on above weightages different financial indices have been calculated to find out its
relationship with development index.
Please check Exhibit 1 for financial and development index
Calculation of Development index
1) Parameters considered for development index [1]
Sanitation facility – Households where latrine facility is within the premises
Mode of cooking – Households where LPG/PNG used for cooking
Drinking water facility - Households where drinking water facility is within the premises
Main source of Lightning – Households where main source of lightning is electricity
Availability of at least one asset – Household where at least one of the following assets is
available
1. Bicycle
2. Scooter/ Moped
3. Car/ Jeep/ Van
4. Radio/ Transistor
5. Television
6. Computer/ Laptop
7. Mobile/ Landline phone
Literacy rate
14 | P a g e
2) Index for each parameter is first calculated using the formula
di = ( Ai – mi)/ (Mi - mi)[3]
3) Based on the equal weightage overall development index is calculated
Equal weighteges is given to all parameters and overall development index for each
district is calculated. (Exhibit 1)
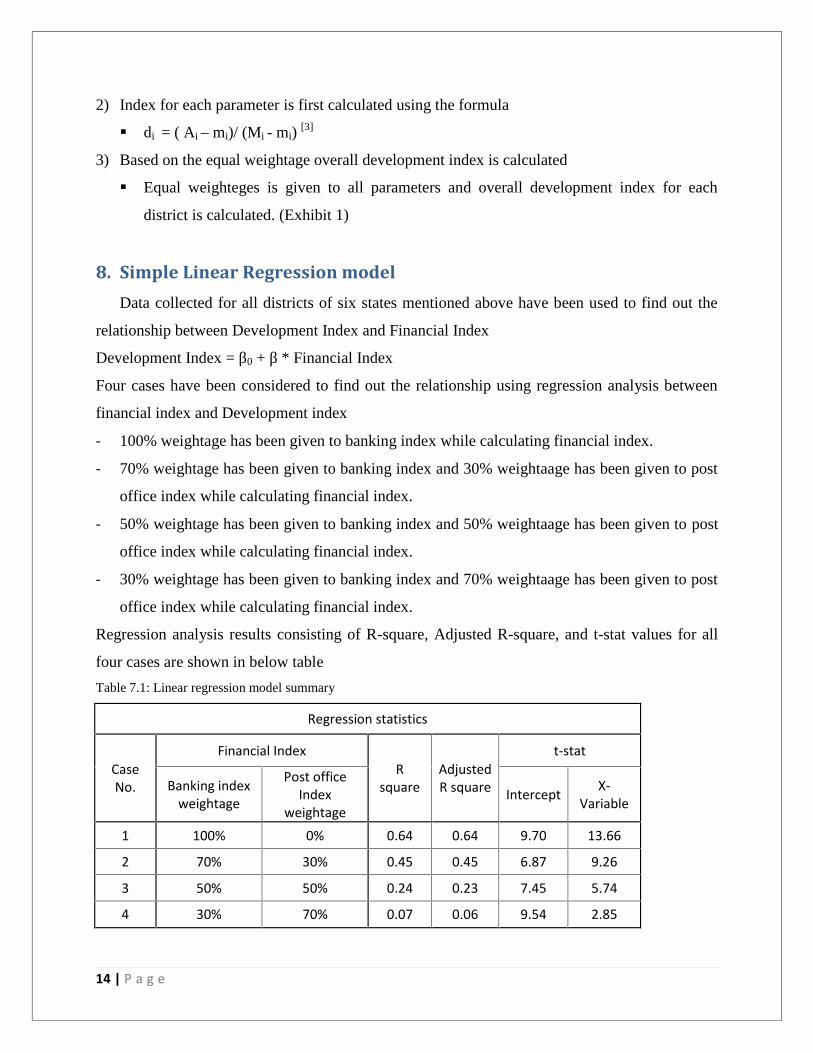
8. Simple Linear Regression modelData collected for all districts of six states mentioned above have been used to find out the
relationship between Development Index and Financial Index
Development Index = β0 + β * Financial Index
Four cases have been considered to find out the relationship using regression analysis between
financial index and Development index
- 100% weightage has been given to banking index while calculating financial index.
- 70% weightage has been given to banking index and 30% weightaage has been given to post
office index while calculating financial index.
- 50% weightage has been given to banking index and 50% weightaage has been given to post
office index while calculating financial index.
- 30% weightage has been given to banking index and 70% weightaage has been given to post
office index while calculating financial index.
Regression analysis results consisting of R-square, Adjusted R-square, and t-stat values for all
four cases are shown in below table
Table 7.1: Linear regression model summary
Regression statistics
CaseNo.
Financial IndexR
squareAdjustedR square
t-stat
Banking indexweightage
Post officeIndex
weightageIntercept X-
Variable
1 100% 0% 0.64 0.64 9.70 13.66
2 70% 30% 0.45 0.45 6.87 9.26
3 50% 50% 0.24 0.23 7.45 5.74
4 30% 70% 0.07 0.06 9.54 2.85
15 | P a g e
8.1. Observations1) In case no. 1 & 2 when 100% and 70% weightage to banking index and 0% and 30%
weightage to post office index is given while calculating financial index then there is a
significant relationship between financial index and development index.
2) For case no.1 and 2, relationship between financial index and development index is linear in
nature.
3) For case no.3 and 4 there is no significant relationship between financial index and
development index.
4) For case no.1 and 2, relationship between financial index and development index is linear in
nature.
8.2. Conclusions1) From the above analysis we can conclude that more the financial index more will be the
development in the six states which has been studied above.
2) Increase in the weightage of post office index while calculating the financial index i.e.
increase in the number of post offices in a district will not drastically affect the development
in the given district.
9. Multiple Linear Regression ModelMultiple linear regression model has been used to find the relationship between financial
inclusion and development at the district level. SPSS has been used to carry out multiple linear
regression analysis.
In this model two independent variables which are considered for analysis are banking index and
Post office index. The equation is as follows
Development index = β0 + β1 * Banking index + β2 * Post office index
16 | P a g e
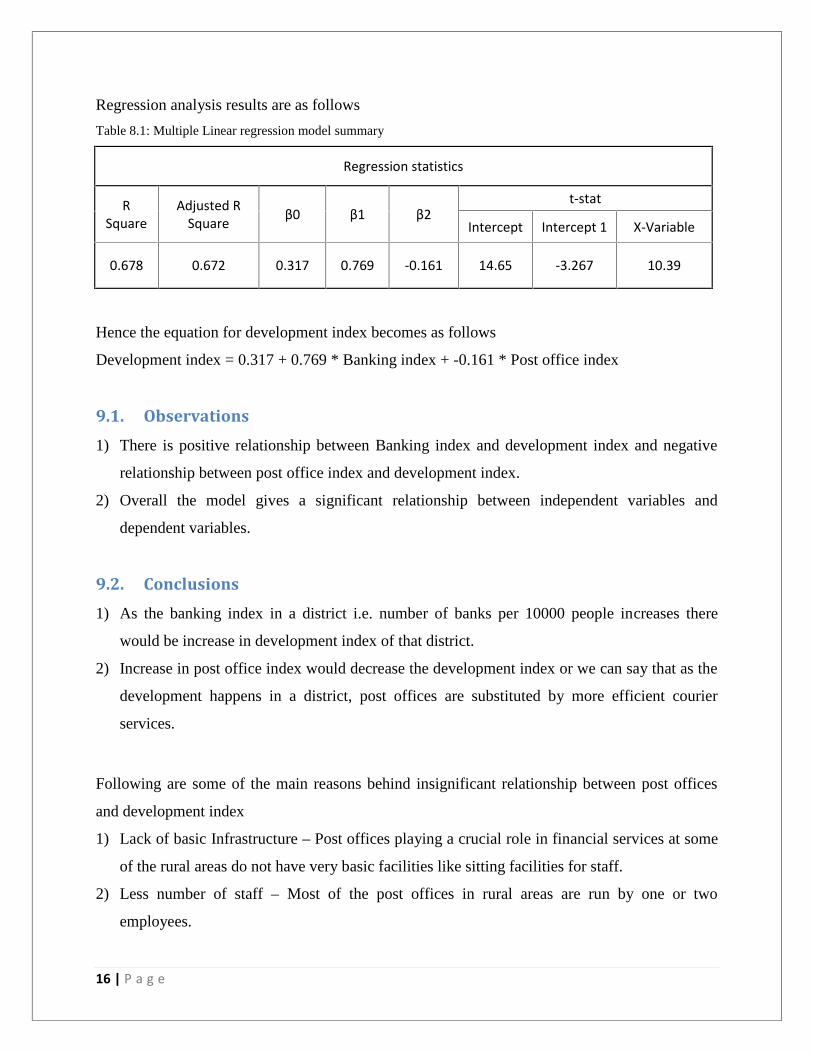
Regression analysis results are as follows
Table 8.1: Multiple Linear regression model summary
Regression statistics
RSquare
Adjusted RSquare β0 β1 β2
t-stat
Intercept Intercept 1 X-Variable
0.678 0.672 0.317 0.769 -0.161 14.65 -3.267 10.39
Hence the equation for development index becomes as follows
Development index = 0.317 + 0.769 * Banking index + -0.161 * Post office index
9.1. Observations1) There is positive relationship between Banking index and development index and negative
relationship between post office index and development index.
2) Overall the model gives a significant relationship between independent variables and
dependent variables.
9.2. Conclusions1) As the banking index in a district i.e. number of banks per 10000 people increases there
would be increase in development index of that district.
2) Increase in post office index would decrease the development index or we can say that as the
development happens in a district, post offices are substituted by more efficient courier
services.
Following are some of the main reasons behind insignificant relationship between post offices
and development index
1) Lack of basic Infrastructure – Post offices playing a crucial role in financial services at some
of the rural areas do not have very basic facilities like sitting facilities for staff.
2) Less number of staff – Most of the post offices in rural areas are run by one or two
employees.
17 | P a g e
3) There is lack of coordination among the post offices and other sister organization providing
financial inclusion.
4) Providing loan is one of the most important factors for financial inclusion. Indian post offices
lack in this parameter.
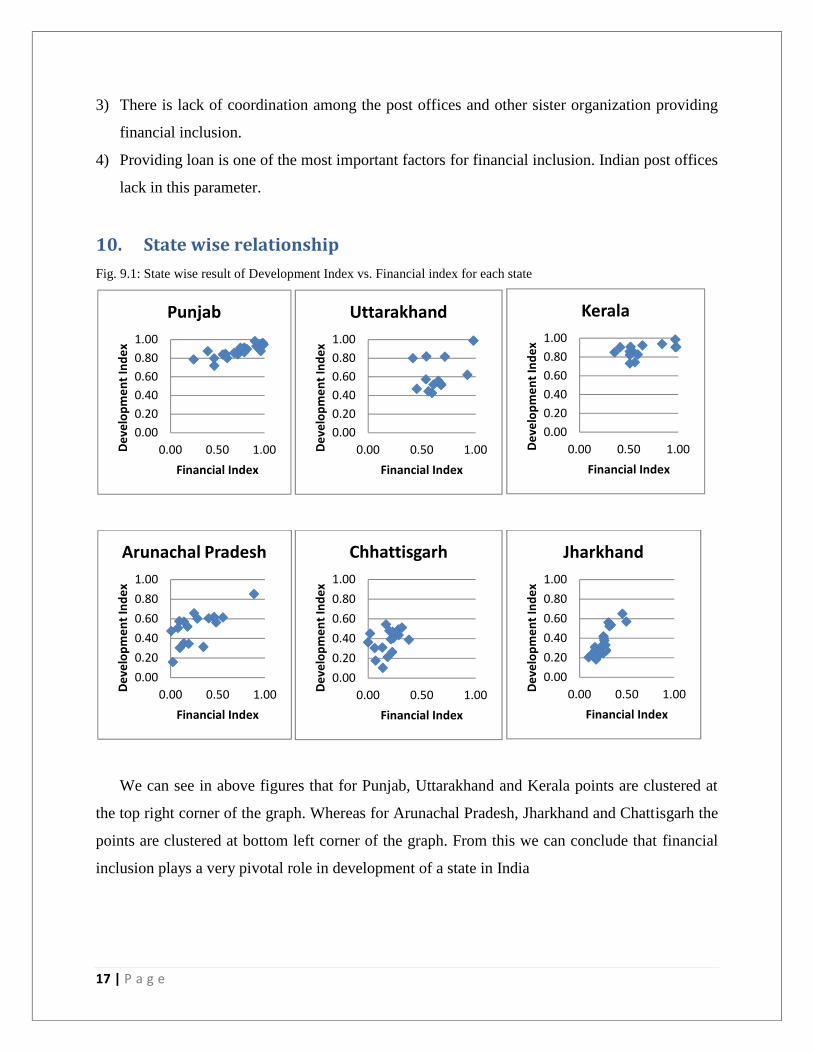
10. State wise relationshipFig. 9.1: State wise result of Development Index vs. Financial index for each state
We can see in above figures that for Punjab, Uttarakhand and Kerala points are clustered at
the top right corner of the graph. Whereas for Arunachal Pradesh, Jharkhand and Chattisgarh the
points are clustered at bottom left corner of the graph. From this we can conclude that financial
inclusion plays a very pivotal role in development of a state in India
0.000.200.400.600.801.00
0.00 0.50 1.00Deve
lopm
ent I
ndex
Financial Index
Punjab
0.000.200.400.600.801.00
0.00 0.50 1.00Deve
lopm
ent I
ndex
Financial Index
Uttarakhand
0.000.200.400.600.801.00
0.00 0.50 1.00Deve
lopm
ent I
ndex
Financial Index
Kerala
0.000.200.400.600.801.00
0.00 0.50 1.00Deve
lopm
ent I
ndex
Financial Index
Arunachal Pradesh
0.000.200.400.600.801.00
0.00 0.50 1.00Deve
lopm
ent I
ndex
Financial Index
Chhattisgarh
0.000.200.400.600.801.00
0.00 0.50 1.00Deve
lopm
ent I
ndex
Financial Index
Jharkhand
18 | P a g e
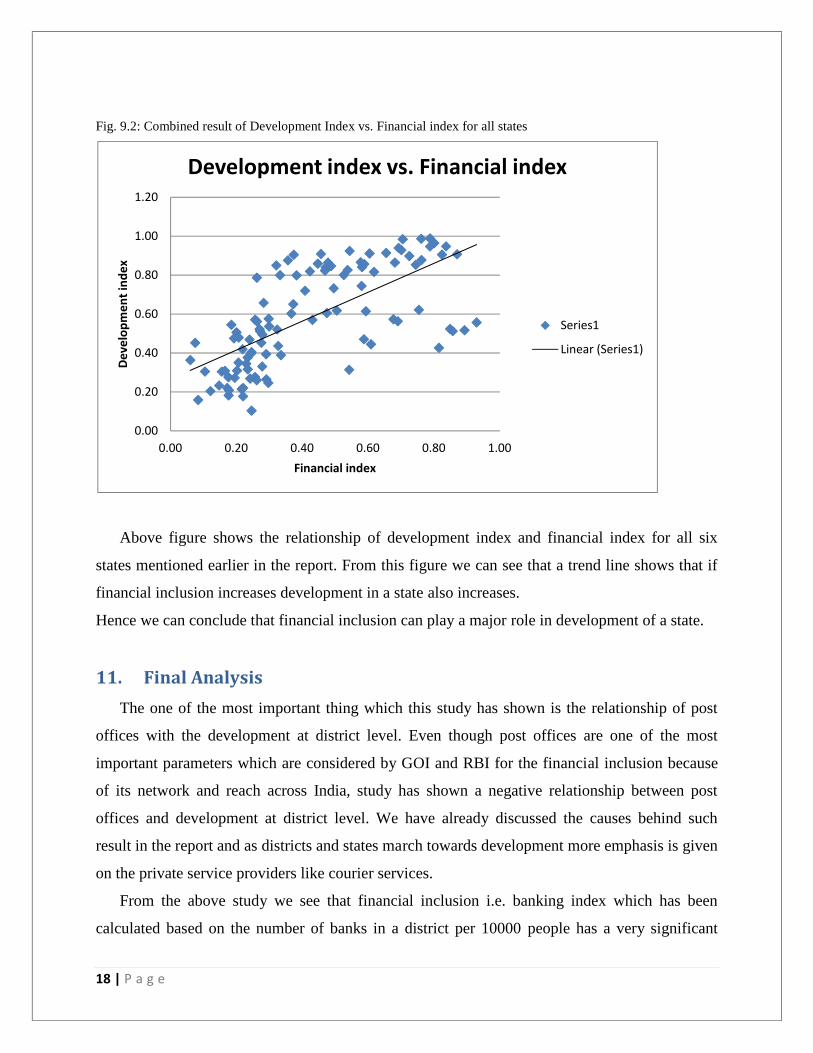
Fig. 9.2: Combined result of Development Index vs. Financial index for all states
Above figure shows the relationship of development index and financial index for all six
states mentioned earlier in the report. From this figure we can see that a trend line shows that if
financial inclusion increases development in a state also increases.
Hence we can conclude that financial inclusion can play a major role in development of a state.
11. Final AnalysisThe one of the most important thing which this study has shown is the relationship of post
offices with the development at district level. Even though post offices are one of the most
important parameters which are considered by GOI and RBI for the financial inclusion because
of its network and reach across India, study has shown a negative relationship between post
offices and development at district level. We have already discussed the causes behind such
result in the report and as districts and states march towards development more emphasis is given
on the private service providers like courier services.
From the above study we see that financial inclusion i.e. banking index which has been
calculated based on the number of banks in a district per 10000 people has a very significant
0.00
0.20
0.40
0.60
0.80
1.00
1.20
0.00 0.20 0.40 0.60 0.80 1.00
Deve
lopm
ent i
ndex
Financial index
Development index vs. Financial index
Series1
Linear (Series1)

19 | P a g e
relationship with development index which has been calculated using some basic parameters at
district level to represent development of that district. This shows that it is very necessary for the
GOI to work towards the financial inclusion at grass root level to bring about the overall
development by bring poor people in ambit of financial services.
20 | P a g e
12. References1) Census of India Organization, GOI, Ministry of Home Affairs
http://www.devinfolive.info/censusinfodashboard/
2) Directory of Scheduled Commercial Banks in India, Master Office File database, DSIM,
RBI.
http://dbie.rbi.org.in/InfoViewApp/MOFSelectParam.jsp
3) Financial Inclusion and Development a cross country analysis by Mandira Sarma, Indian
Council for Research on International Economic Relation
http://www.icrier.org/pdf/Mandira%20Sarma-Paper.pdf
4) Financial Inclusion in India – An Assessment by P. Vijaya Bhaskar, Jan 10, 2014
http://rbi.org.in/Scripts/BS_ViewBulletin.aspx?Id=14665
5) Financial Inclusion: Journey So Far and Road Ahead by Deepali Pant Joshi, Dec 10, 2013
http://rbi.org.in/Scripts/BS_ViewBulletin.aspx?Id=14604
6) Financial Inclusion: Technology, Institutions and Policies by Raghuram G. Rajan, Mar10,
2013
http://rbi.org.in/Scripts/BS_ViewBulletin.aspx?Id=14784
7) Financial Regulation: Which Way Forward? by Deepak Mohanty, Mar 10, 2014
http://rbi.org.in/Scripts/BS_ViewBulletin.aspx?Id=14788
8) Report of the committee for evolving a composite development index of states by GOI,
Ministery of Finance, Sept 2013.
http://finmin.nic.in/reports/Report_CompDevState.pdf
9) Role of Indian post in financial inclusion, by Dipankar Malakar, Feb 2013
http://www.iosrjournals.org/iosr-jhss/papers/Vol6-issue4/B0640407.pdf
21 | P a g e
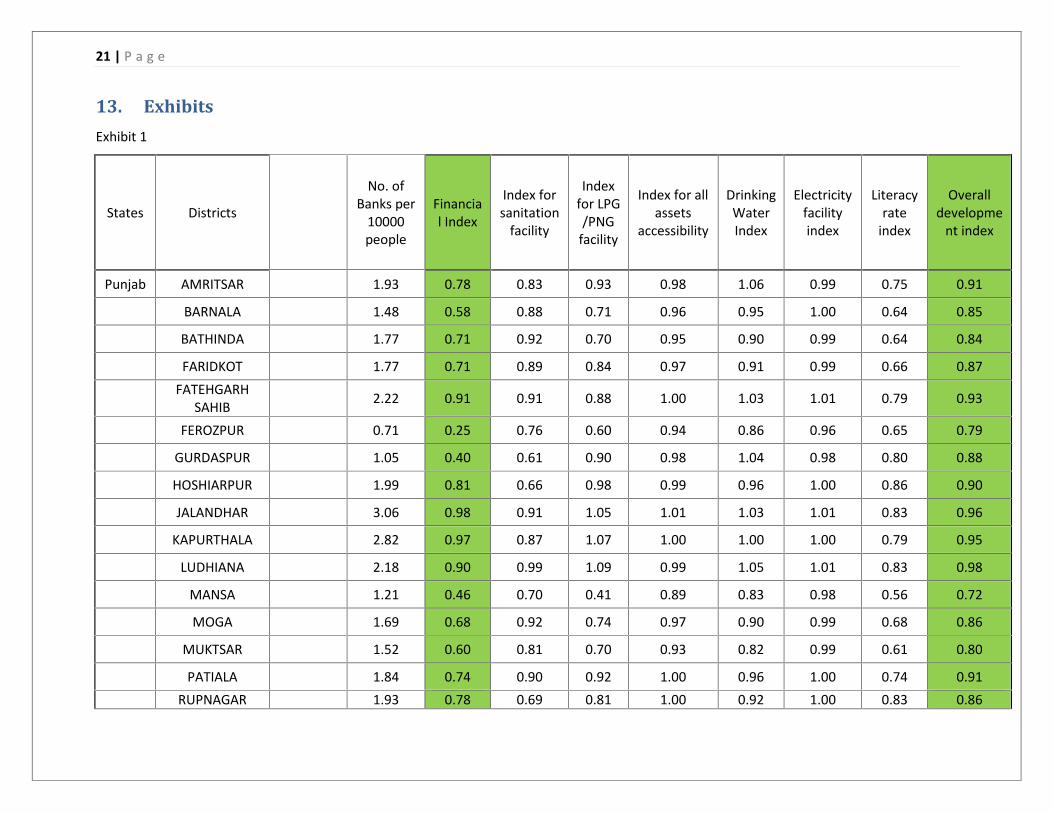
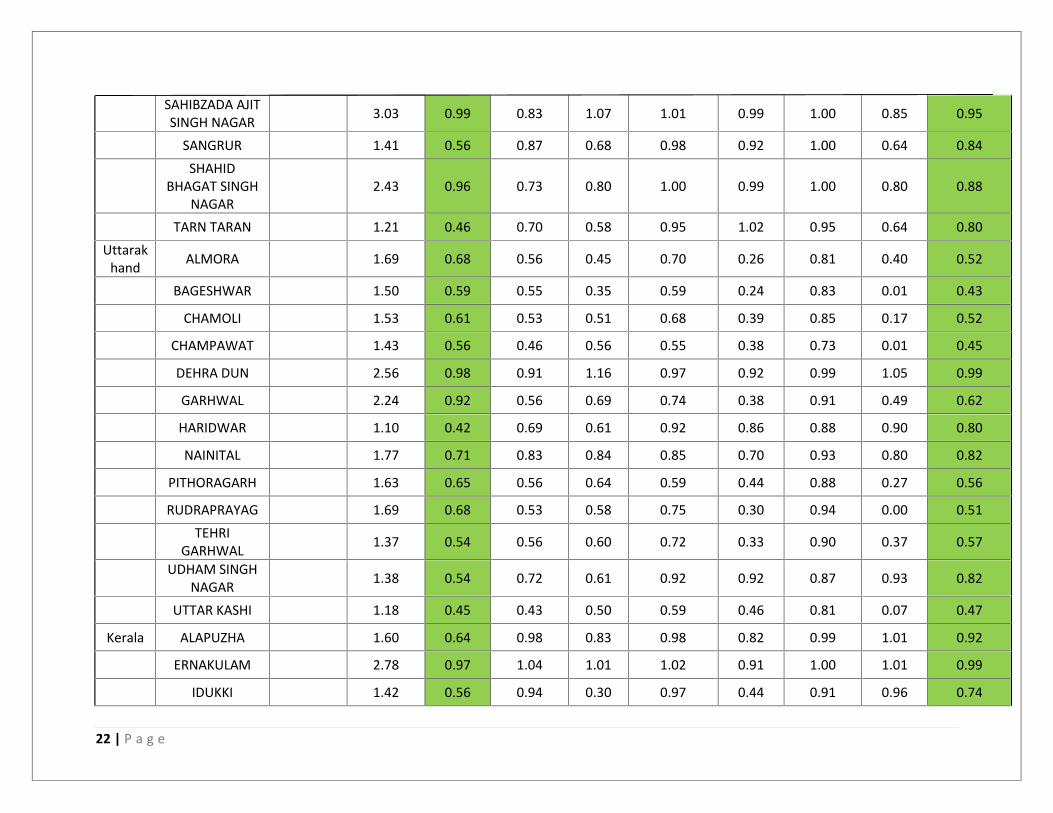
13. ExhibitsExhibit 1
States Districts
No. ofBanks per
10000people
Financial Index
Index forsanitation
facility
Indexfor LPG/PNG
facility
Index for allassets
accessibility
DrinkingWaterIndex
Electricityfacilityindex
Literacyrate
index
Overalldevelopme
nt index
Punjab AMRITSAR 1.93 0.78 0.83 0.93 0.98 1.06 0.99 0.75 0.91
BARNALA 1.48 0.58 0.88 0.71 0.96 0.95 1.00 0.64 0.85
BATHINDA 1.77 0.71 0.92 0.70 0.95 0.90 0.99 0.64 0.84
FARIDKOT 1.77 0.71 0.89 0.84 0.97 0.91 0.99 0.66 0.87FATEHGARH
SAHIB 2.22 0.91 0.91 0.88 1.00 1.03 1.01 0.79 0.93
FEROZPUR 0.71 0.25 0.76 0.60 0.94 0.86 0.96 0.65 0.79
GURDASPUR 1.05 0.40 0.61 0.90 0.98 1.04 0.98 0.80 0.88
HOSHIARPUR 1.99 0.81 0.66 0.98 0.99 0.96 1.00 0.86 0.90
JALANDHAR 3.06 0.98 0.91 1.05 1.01 1.03 1.01 0.83 0.96
KAPURTHALA 2.82 0.97 0.87 1.07 1.00 1.00 1.00 0.79 0.95
LUDHIANA 2.18 0.90 0.99 1.09 0.99 1.05 1.01 0.83 0.98
MANSA 1.21 0.46 0.70 0.41 0.89 0.83 0.98 0.56 0.72
MOGA 1.69 0.68 0.92 0.74 0.97 0.90 0.99 0.68 0.86
MUKTSAR 1.52 0.60 0.81 0.70 0.93 0.82 0.99 0.61 0.80
PATIALA 1.84 0.74 0.90 0.92 1.00 0.96 1.00 0.74 0.91RUPNAGAR 1.93 0.78 0.69 0.81 1.00 0.92 1.00 0.83 0.86
22 | P a g e
SAHIBZADA AJITSINGH NAGAR 3.03 0.99 0.83 1.07 1.01 0.99 1.00 0.85 0.95
SANGRUR 1.41 0.56 0.87 0.68 0.98 0.92 1.00 0.64 0.84SHAHID
BHAGAT SINGHNAGAR
2.43 0.96 0.73 0.80 1.00 0.99 1.00 0.80 0.88
TARN TARAN 1.21 0.46 0.70 0.58 0.95 1.02 0.95 0.64 0.80Uttarak
hand ALMORA 1.69 0.68 0.56 0.45 0.70 0.26 0.81 0.40 0.52
BAGESHWAR 1.50 0.59 0.55 0.35 0.59 0.24 0.83 0.01 0.43
CHAMOLI 1.53 0.61 0.53 0.51 0.68 0.39 0.85 0.17 0.52
CHAMPAWAT 1.43 0.56 0.46 0.56 0.55 0.38 0.73 0.01 0.45
DEHRA DUN 2.56 0.98 0.91 1.16 0.97 0.92 0.99 1.05 0.99
GARHWAL 2.24 0.92 0.56 0.69 0.74 0.38 0.91 0.49 0.62
HARIDWAR 1.10 0.42 0.69 0.61 0.92 0.86 0.88 0.90 0.80
NAINITAL 1.77 0.71 0.83 0.84 0.85 0.70 0.93 0.80 0.82
PITHORAGARH 1.63 0.65 0.56 0.64 0.59 0.44 0.88 0.27 0.56
RUDRAPRAYAG 1.69 0.68 0.53 0.58 0.75 0.30 0.94 0.00 0.51TEHRI
GARHWAL 1.37 0.54 0.56 0.60 0.72 0.33 0.90 0.37 0.57
UDHAM SINGHNAGAR 1.38 0.54 0.72 0.61 0.92 0.92 0.87 0.93 0.82
UTTAR KASHI 1.18 0.45 0.43 0.50 0.59 0.46 0.81 0.07 0.47
Kerala ALAPUZHA 1.60 0.64 0.98 0.83 0.98 0.82 0.99 1.01 0.92
ERNAKULAM 2.78 0.97 1.04 1.01 1.02 0.91 1.00 1.01 0.99
IDUKKI 1.42 0.56 0.94 0.30 0.97 0.44 0.91 0.96 0.74
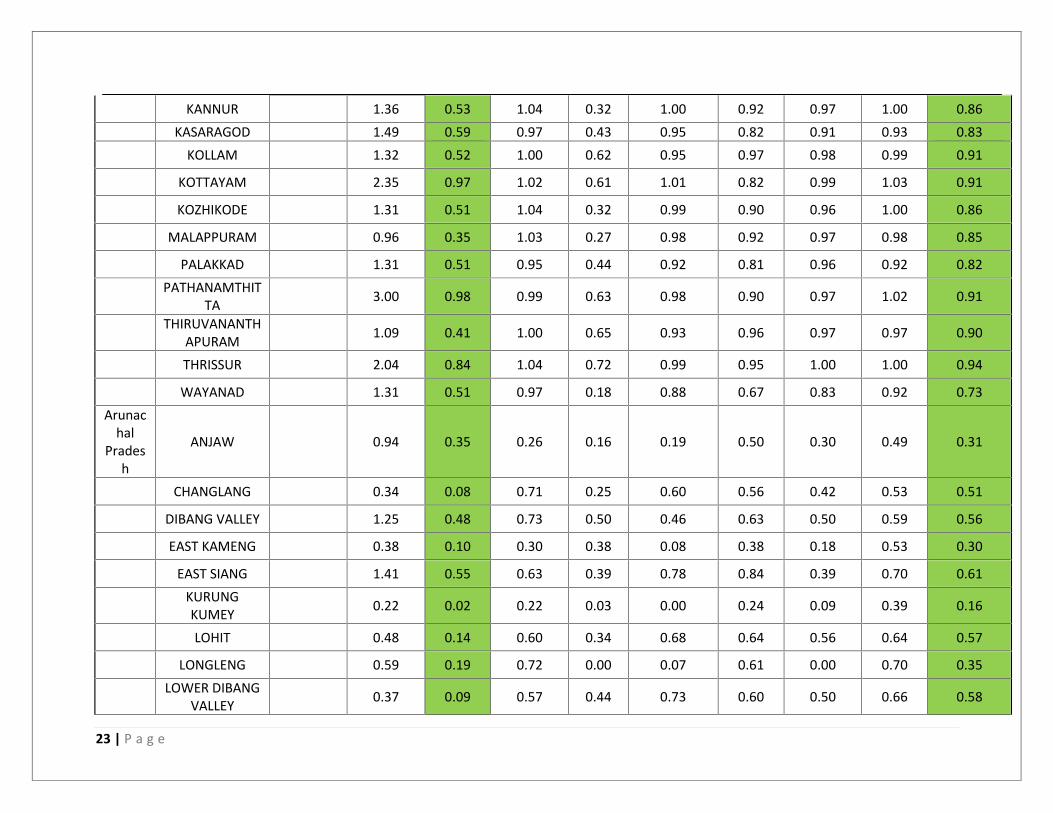
23 | P a g e
KANNUR 1.36 0.53 1.04 0.32 1.00 0.92 0.97 1.00 0.86KASARAGOD 1.49 0.59 0.97 0.43 0.95 0.82 0.91 0.93 0.83
KOLLAM 1.32 0.52 1.00 0.62 0.95 0.97 0.98 0.99 0.91
KOTTAYAM 2.35 0.97 1.02 0.61 1.01 0.82 0.99 1.03 0.91
KOZHIKODE 1.31 0.51 1.04 0.32 0.99 0.90 0.96 1.00 0.86
MALAPPURAM 0.96 0.35 1.03 0.27 0.98 0.92 0.97 0.98 0.85
PALAKKAD 1.31 0.51 0.95 0.44 0.92 0.81 0.96 0.92 0.82PATHANAMTHIT
TA 3.00 0.98 0.99 0.63 0.98 0.90 0.97 1.02 0.91
THIRUVANANTHAPURAM 1.09 0.41 1.00 0.65 0.93 0.96 0.97 0.97 0.90
THRISSUR 2.04 0.84 1.04 0.72 0.99 0.95 1.00 1.00 0.94
WAYANAD 1.31 0.51 0.97 0.18 0.88 0.67 0.83 0.92 0.73Arunac
halPrades
h
ANJAW 0.94 0.35 0.26 0.16 0.19 0.50 0.30 0.49 0.31
CHANGLANG 0.34 0.08 0.71 0.25 0.60 0.56 0.42 0.53 0.51
DIBANG VALLEY 1.25 0.48 0.73 0.50 0.46 0.63 0.50 0.59 0.56
EAST KAMENG 0.38 0.10 0.30 0.38 0.08 0.38 0.18 0.53 0.30
EAST SIANG 1.41 0.55 0.63 0.39 0.78 0.84 0.39 0.70 0.61KURUNGKUMEY 0.22 0.02 0.22 0.03 0.00 0.24 0.09 0.39 0.16
LOHIT 0.48 0.14 0.60 0.34 0.68 0.64 0.56 0.64 0.57
LONGLENG 0.59 0.19 0.72 0.00 0.07 0.61 0.00 0.70 0.35LOWER DIBANG
VALLEY 0.37 0.09 0.57 0.44 0.73 0.60 0.50 0.66 0.58
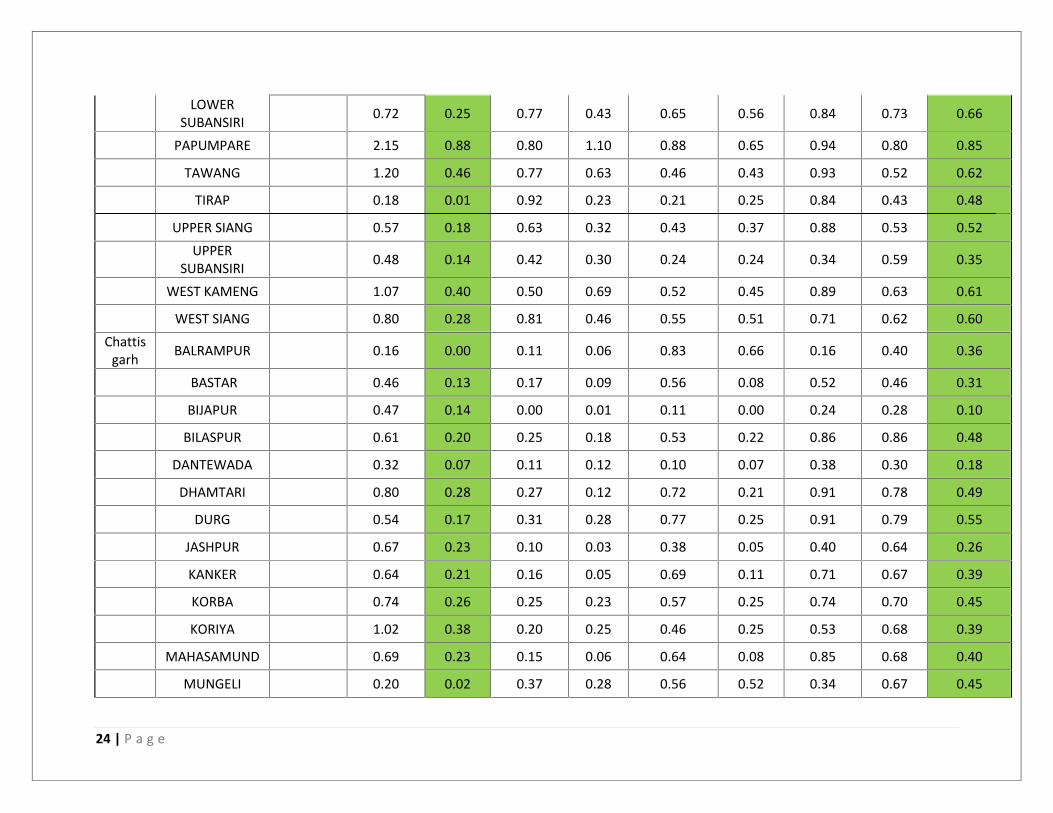
24 | P a g e
LOWERSUBANSIRI 0.72 0.25 0.77 0.43 0.65 0.56 0.84 0.73 0.66
PAPUMPARE 2.15 0.88 0.80 1.10 0.88 0.65 0.94 0.80 0.85
TAWANG 1.20 0.46 0.77 0.63 0.46 0.43 0.93 0.52 0.62
TIRAP 0.18 0.01 0.92 0.23 0.21 0.25 0.84 0.43 0.48
UPPER SIANG 0.57 0.18 0.63 0.32 0.43 0.37 0.88 0.53 0.52UPPER
SUBANSIRI 0.48 0.14 0.42 0.30 0.24 0.24 0.34 0.59 0.35
WEST KAMENG 1.07 0.40 0.50 0.69 0.52 0.45 0.89 0.63 0.61
WEST SIANG 0.80 0.28 0.81 0.46 0.55 0.51 0.71 0.62 0.60Chattis
garh BALRAMPUR 0.16 0.00 0.11 0.06 0.83 0.66 0.16 0.40 0.36
BASTAR 0.46 0.13 0.17 0.09 0.56 0.08 0.52 0.46 0.31
BIJAPUR 0.47 0.14 0.00 0.01 0.11 0.00 0.24 0.28 0.10
BILASPUR 0.61 0.20 0.25 0.18 0.53 0.22 0.86 0.86 0.48
DANTEWADA 0.32 0.07 0.11 0.12 0.10 0.07 0.38 0.30 0.18
DHAMTARI 0.80 0.28 0.27 0.12 0.72 0.21 0.91 0.78 0.49
DURG 0.54 0.17 0.31 0.28 0.77 0.25 0.91 0.79 0.55
JASHPUR 0.67 0.23 0.10 0.03 0.38 0.05 0.40 0.64 0.26
KANKER 0.64 0.21 0.16 0.05 0.69 0.11 0.71 0.67 0.39
KORBA 0.74 0.26 0.25 0.23 0.57 0.25 0.74 0.70 0.45
KORIYA 1.02 0.38 0.20 0.25 0.46 0.25 0.53 0.68 0.39
MAHASAMUND 0.69 0.23 0.15 0.06 0.64 0.08 0.85 0.68 0.40
MUNGELI 0.20 0.02 0.37 0.28 0.56 0.52 0.34 0.67 0.45
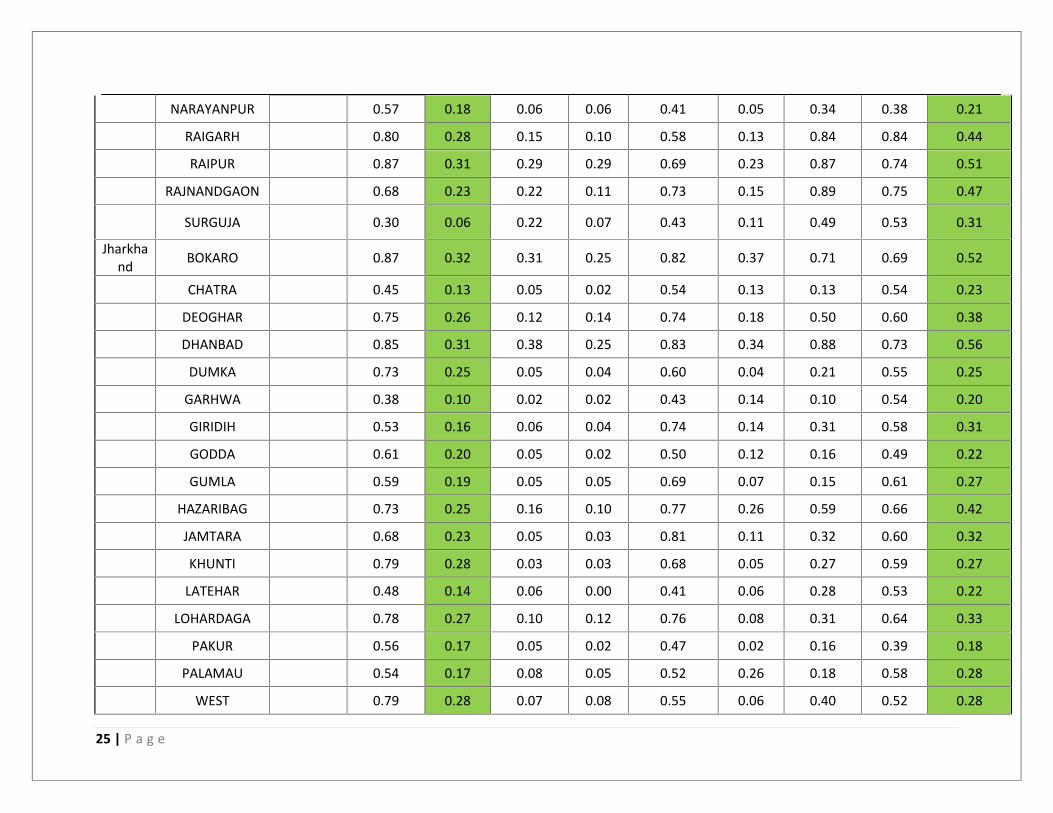
25 | P a g e
NARAYANPUR 0.57 0.18 0.06 0.06 0.41 0.05 0.34 0.38 0.21
RAIGARH 0.80 0.28 0.15 0.10 0.58 0.13 0.84 0.84 0.44
RAIPUR 0.87 0.31 0.29 0.29 0.69 0.23 0.87 0.74 0.51
RAJNANDGAON 0.68 0.23 0.22 0.11 0.73 0.15 0.89 0.75 0.47
SURGUJA 0.30 0.06 0.22 0.07 0.43 0.11 0.49 0.53 0.31
Jharkhand BOKARO 0.87 0.32 0.31 0.25 0.82 0.37 0.71 0.69 0.52
CHATRA 0.45 0.13 0.05 0.02 0.54 0.13 0.13 0.54 0.23
DEOGHAR 0.75 0.26 0.12 0.14 0.74 0.18 0.50 0.60 0.38
DHANBAD 0.85 0.31 0.38 0.25 0.83 0.34 0.88 0.73 0.56
DUMKA 0.73 0.25 0.05 0.04 0.60 0.04 0.21 0.55 0.25
GARHWA 0.38 0.10 0.02 0.02 0.43 0.14 0.10 0.54 0.20
GIRIDIH 0.53 0.16 0.06 0.04 0.74 0.14 0.31 0.58 0.31
GODDA 0.61 0.20 0.05 0.02 0.50 0.12 0.16 0.49 0.22
GUMLA 0.59 0.19 0.05 0.05 0.69 0.07 0.15 0.61 0.27
HAZARIBAG 0.73 0.25 0.16 0.10 0.77 0.26 0.59 0.66 0.42
JAMTARA 0.68 0.23 0.05 0.03 0.81 0.11 0.32 0.60 0.32
KHUNTI 0.79 0.28 0.03 0.03 0.68 0.05 0.27 0.59 0.27
LATEHAR 0.48 0.14 0.06 0.00 0.41 0.06 0.28 0.53 0.22
LOHARDAGA 0.78 0.27 0.10 0.12 0.76 0.08 0.31 0.64 0.33
PAKUR 0.56 0.17 0.05 0.02 0.47 0.02 0.16 0.39 0.18
PALAMAU 0.54 0.17 0.08 0.05 0.52 0.26 0.18 0.58 0.28
WEST 0.79 0.28 0.07 0.08 0.55 0.06 0.40 0.52 0.28
26 | P a g e
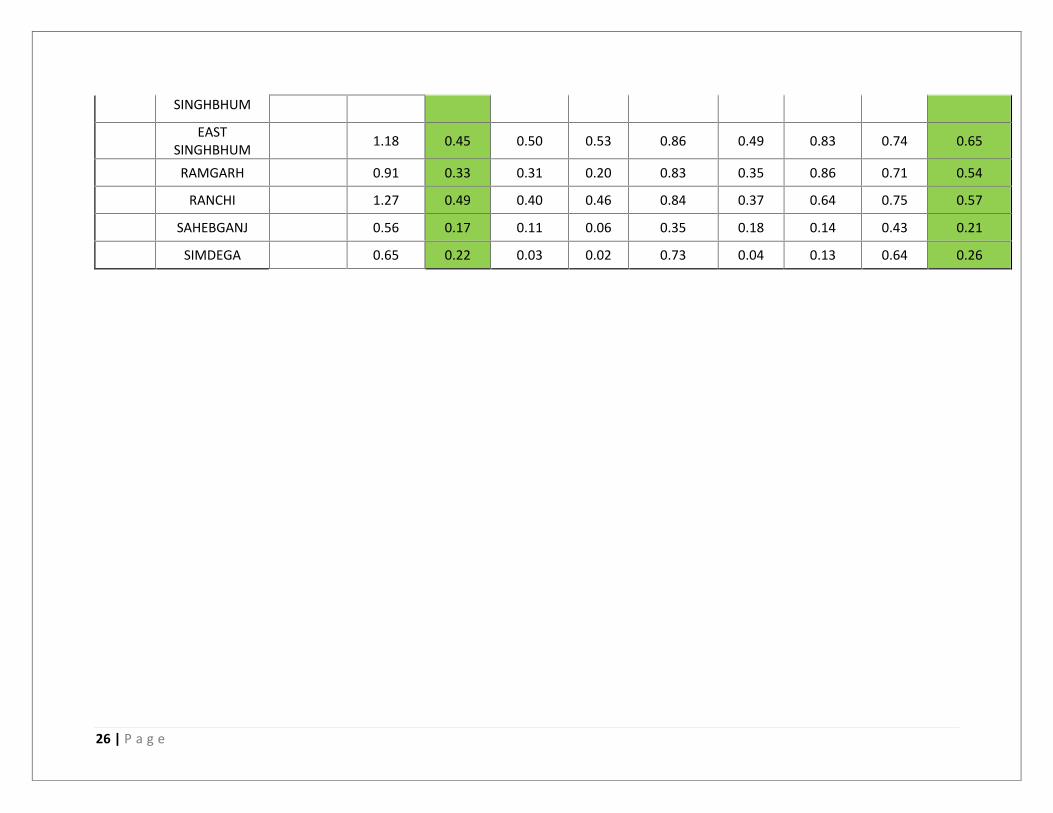
SINGHBHUM
EASTSINGHBHUM 1.18 0.45 0.50 0.53 0.86 0.49 0.83 0.74 0.65
RAMGARH 0.91 0.33 0.31 0.20 0.83 0.35 0.86 0.71 0.54
RANCHI 1.27 0.49 0.40 0.46 0.84 0.37 0.64 0.75 0.57
SAHEBGANJ 0.56 0.17 0.11 0.06 0.35 0.18 0.14 0.43 0.21
SIMDEGA 0.65 0.22 0.03 0.02 0.73 0.04 0.13 0.64 0.26