Embed Size (px)
Citation preview
Relative Permeability and Capillary Pressure Controls on CO2 Migration and Brine
Displacement
Sally M. Benson1
Ljubinko Miljkovic2, Liviu Tomutsa2 and Christine Doughty2
1Energy Resources Engineering Dept., Stanford University2Earth Sciences Division, Lawrence Berkeley National Laboratory
Acknowledgements
• Funded by DOE Fossil Energy through the Zero Emissions Research and Technology Program (ZERT)
• Outstanding co-authors from Lawrence Berkeley National Laboratory– Ljubinko Miljkovic– Liviu Tomutsa– Christine Doughty
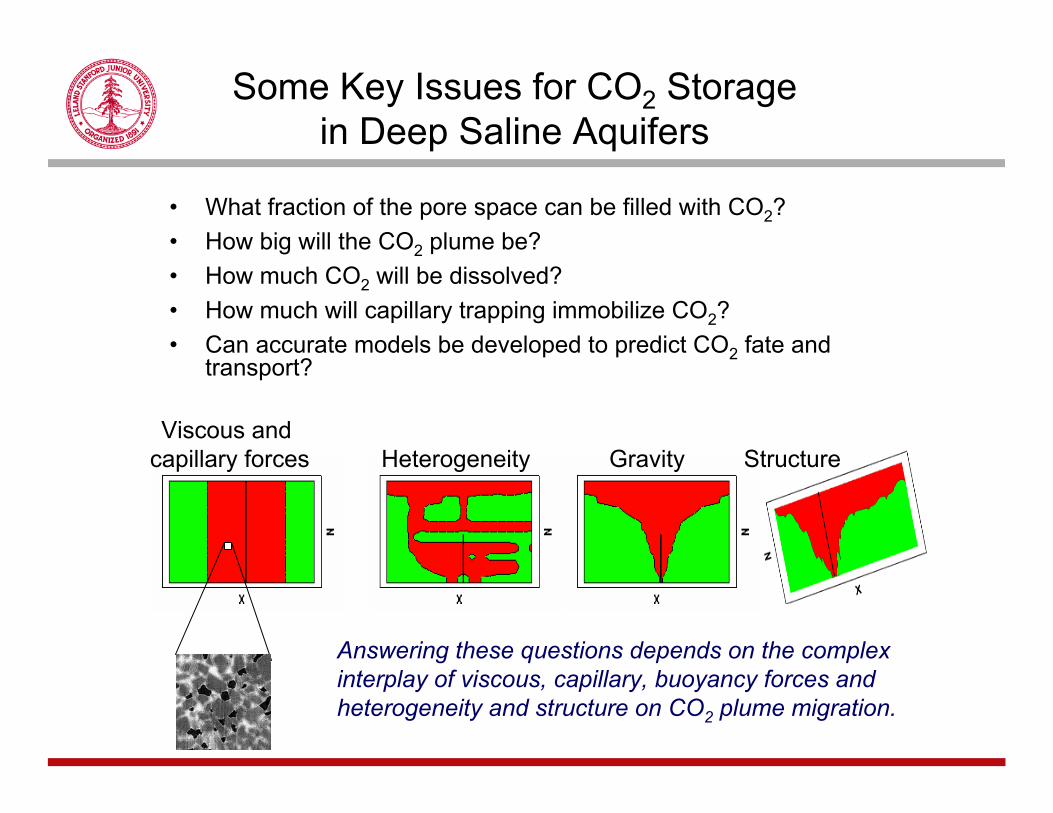
Some Key Issues for CO2 Storage in Deep Saline Aquifers
• What fraction of the pore space can be filled with CO2?• How big will the CO2 plume be?• How much CO2 will be dissolved?• How much will capillary trapping immobilize CO2?• Can accurate models be developed to predict CO2 fate and
transport?
Courtesy of Christine Doughty, LBNL
Answering these questions depends on the complex interplay of viscous, capillary, buoyancy forces and heterogeneity and structure on CO2 plume migration.
GravityViscous and
capillary forces Heterogeneity Structure
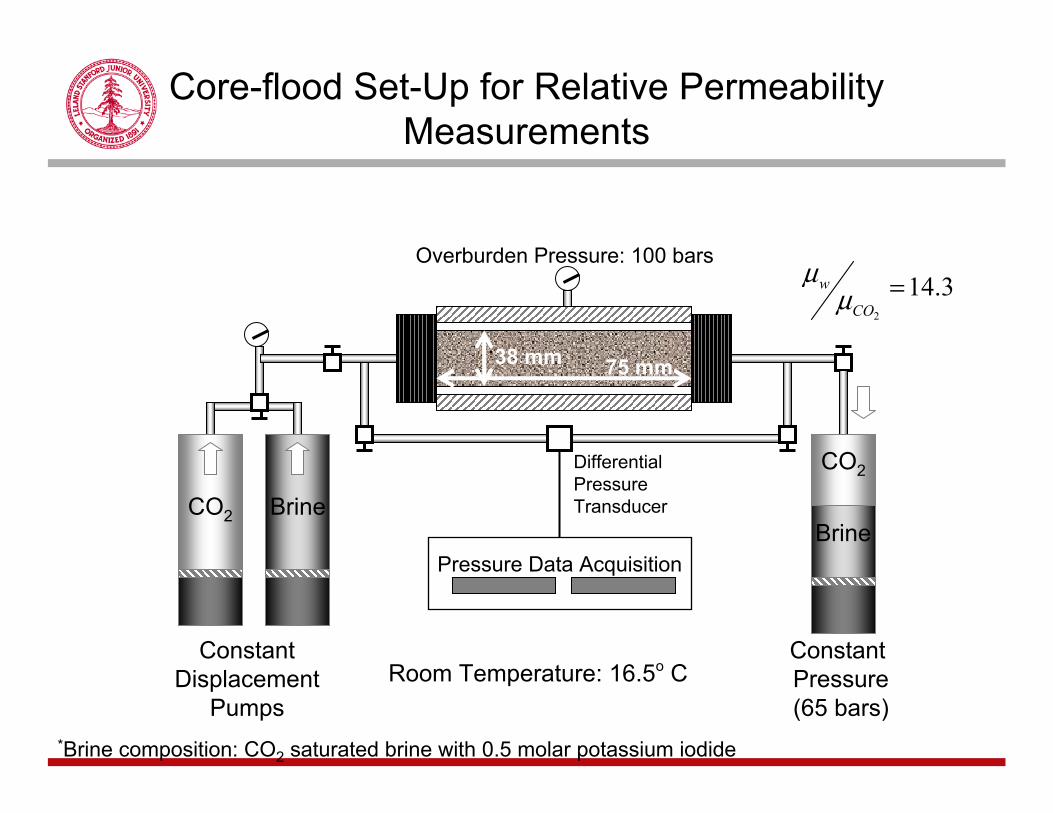
Core-flood Set-Up for Relative Permeability Measurements
*Brine composition: CO2 saturated brine with 0.5 molar potassium iodide
CO2 Brine
Constant Displacement
Pumps
Overburden Pressure: 100 bars
DifferentialPressureTransducer
Pressure Data Acquisition
CO2
Constant Pressure(65 bars)
Brine
Room Temperature: 16.5o C
75 mm38 mm
3.142
=CO
wμ
μ
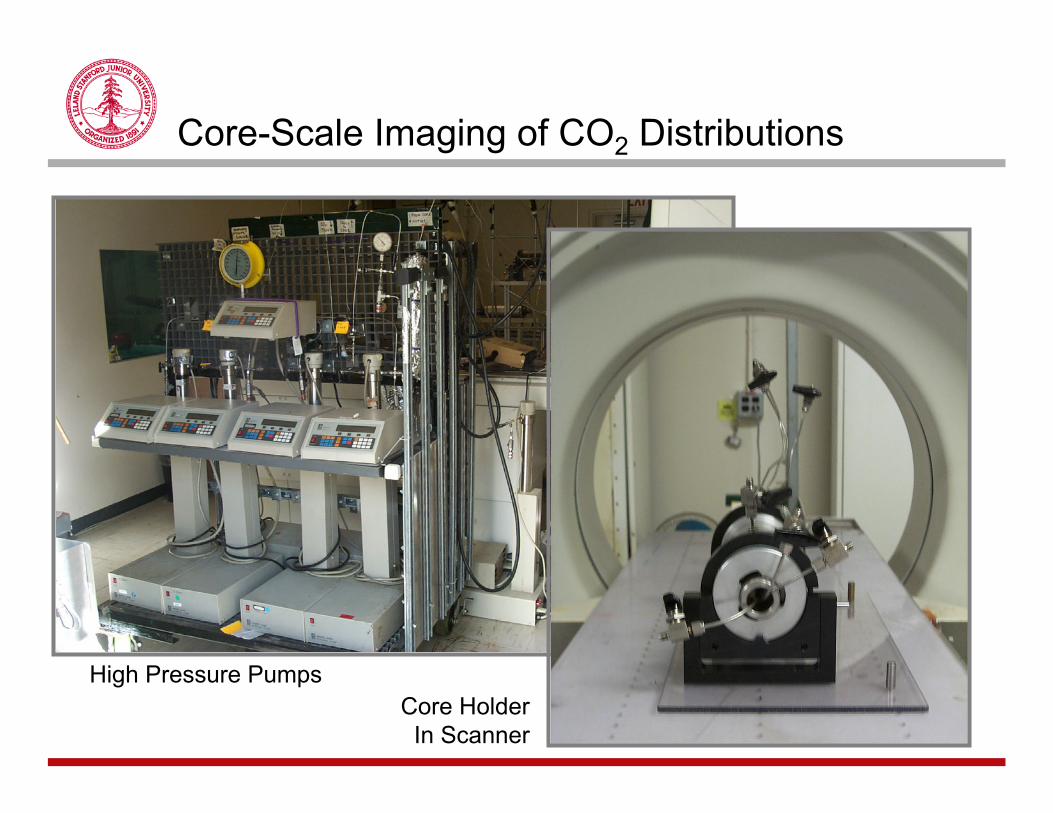
Core-Scale Imaging of CO2 Distributions
High Pressure PumpsCore Holder
In Scanner
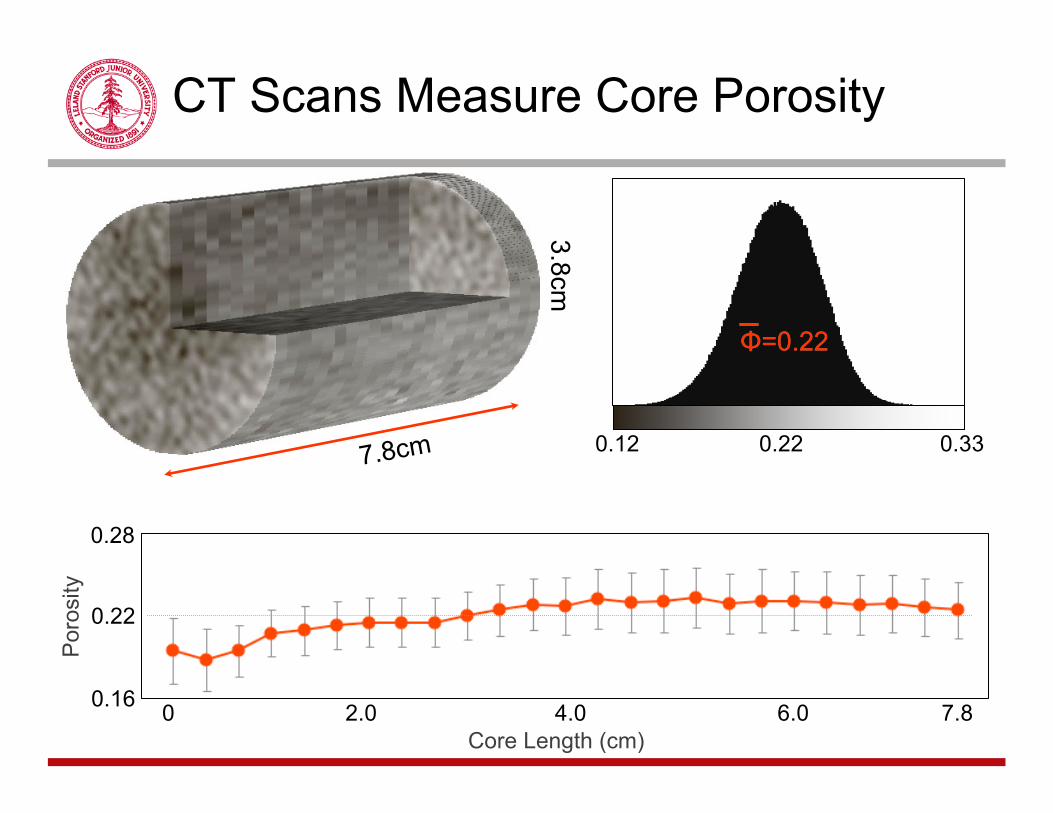
CT Scans Measure Core Porosity
7.8cm
3.8cm
Φ=0.22Φ=0.22
0.12 0.330.22
0.16
0.22
0.28
0 7.82.0 4.0 6.0Core Length (cm)
Por
osity
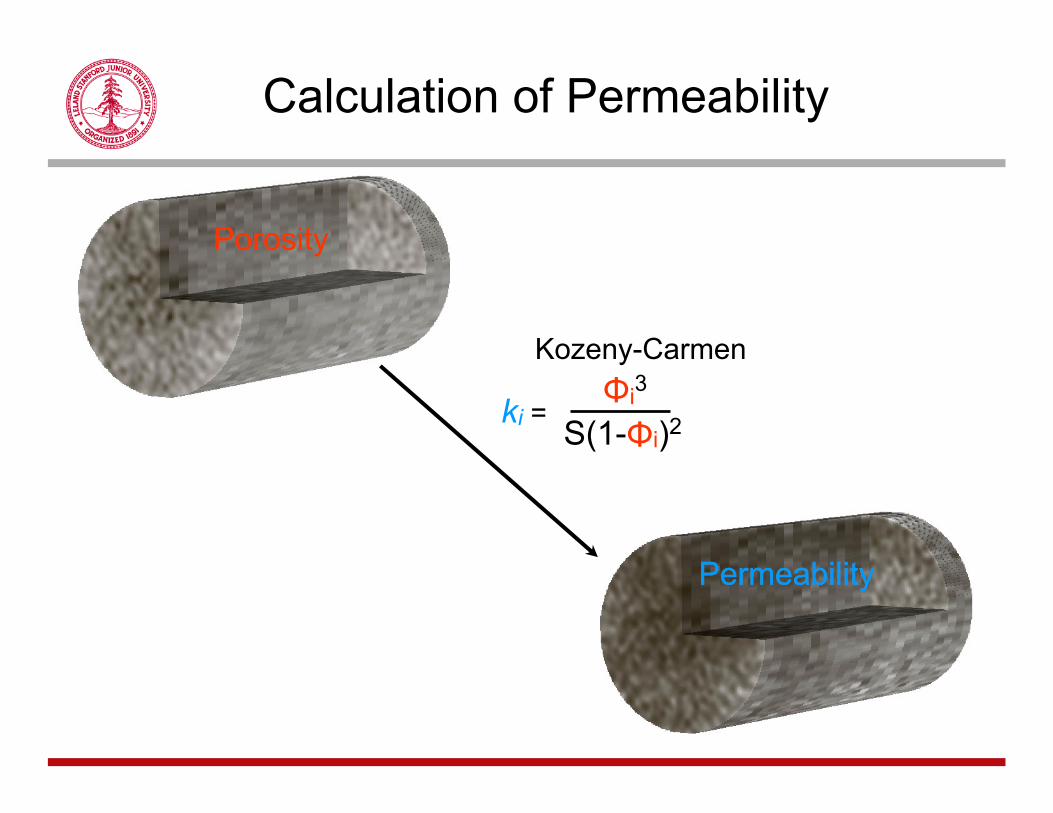
Calculation of Permeability
PorosityPorosity
Kozeny-Carmen
ki = Φi3
S(1-Φi)2
PermeabilityPermeability
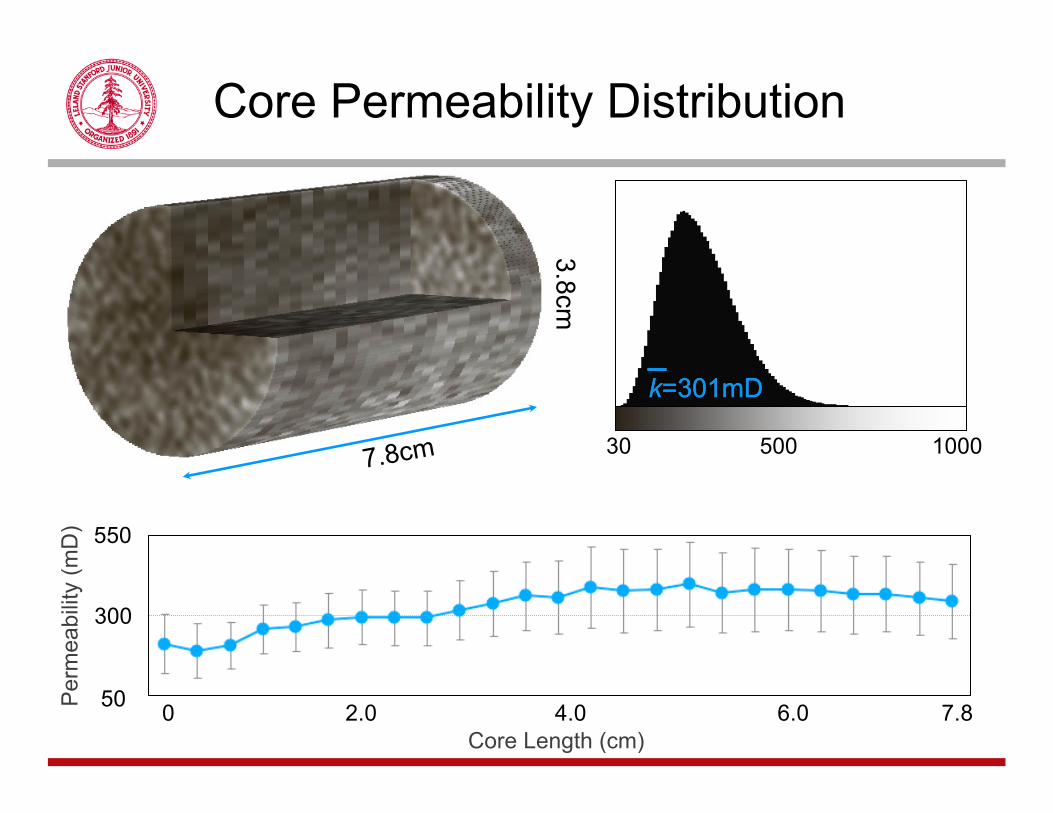
Core Permeability Distribution
30 1000
k=301mDk=301mD
7.8cm3.8cm
500
50
300
550
0 7.82.0 4.0 6.0Core Length (cm)
Per
mea
bilit
y (m
D)
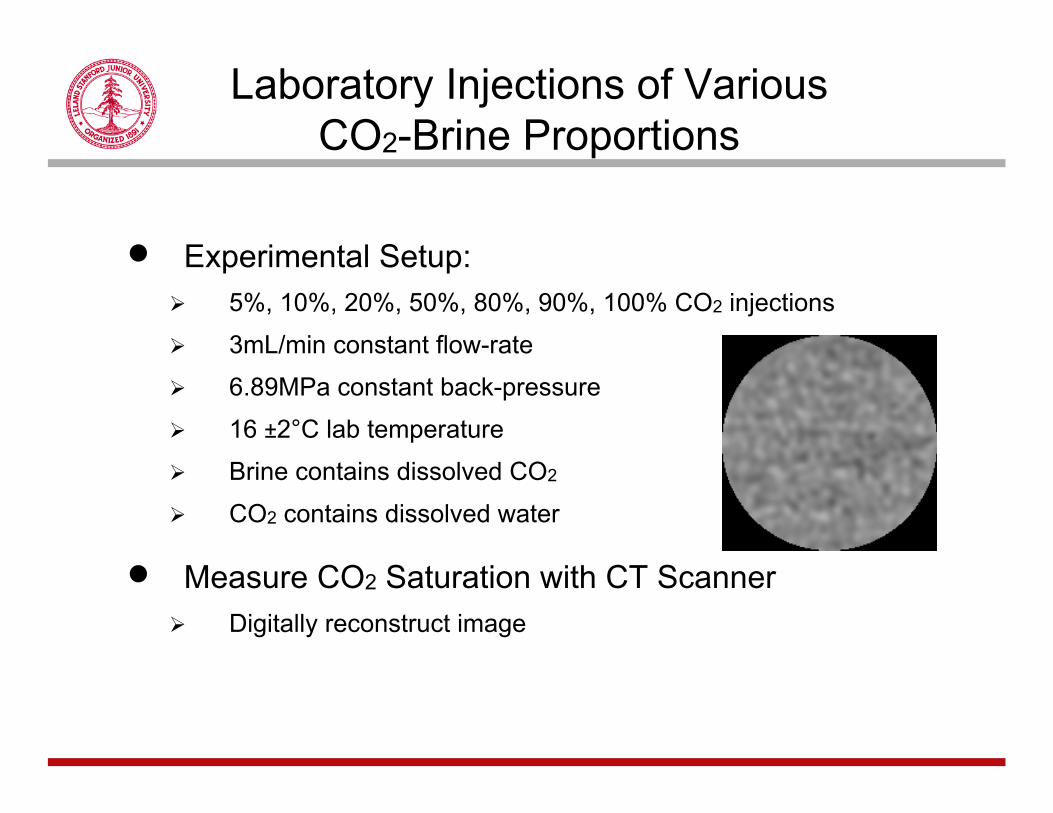
Laboratory Injections of Various CO2-Brine Proportions
• Experimental Setup:5%, 10%, 20%, 50%, 80%, 90%, 100% CO2 injections
3mL/min constant flow-rate
6.89MPa constant back-pressure
16 ±2°C lab temperature
Brine contains dissolved CO2
CO2 contains dissolved water
• Measure CO2 Saturation with CT ScannerDigitally reconstruct image
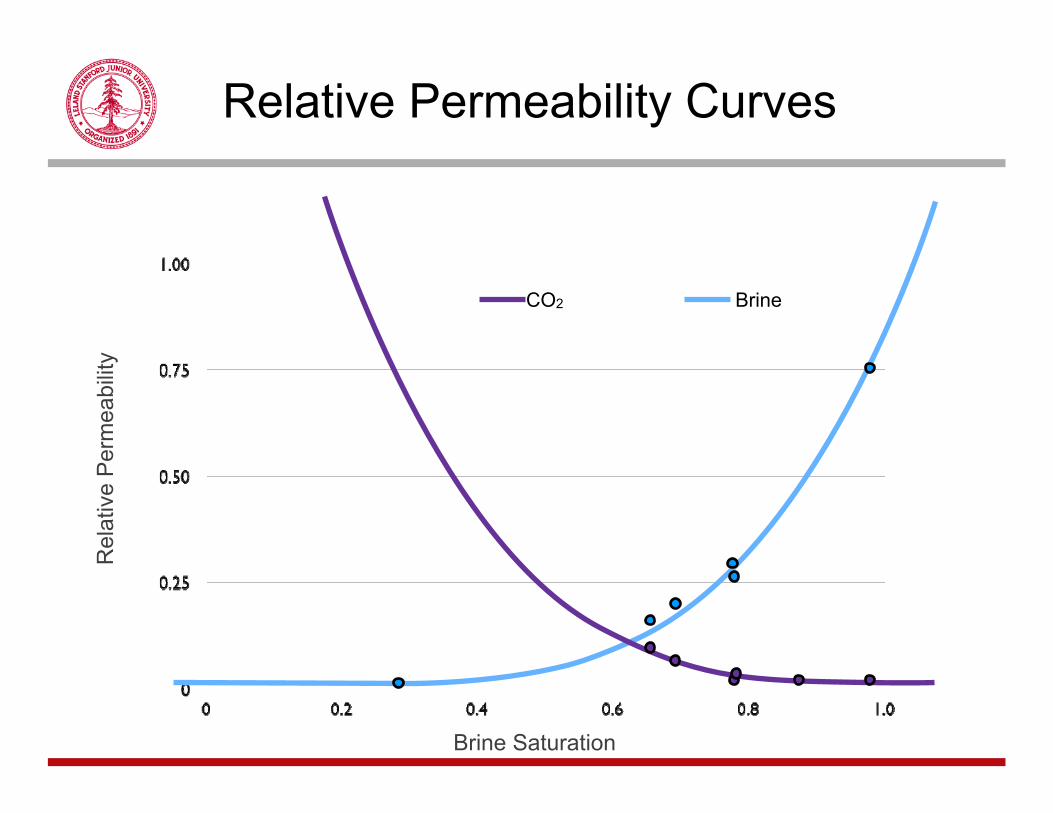
Relative Permeability CurvesR
elat
ive
Per
mea
bilit
y
Brine Saturation
CO2 Brine
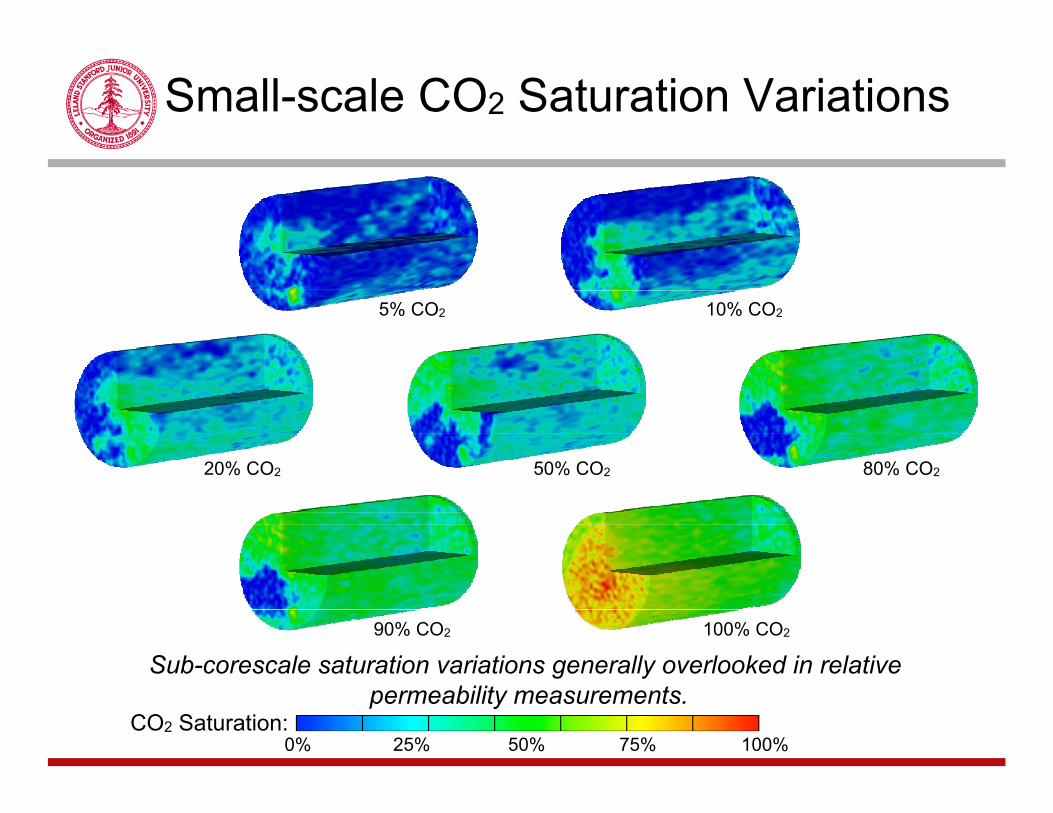
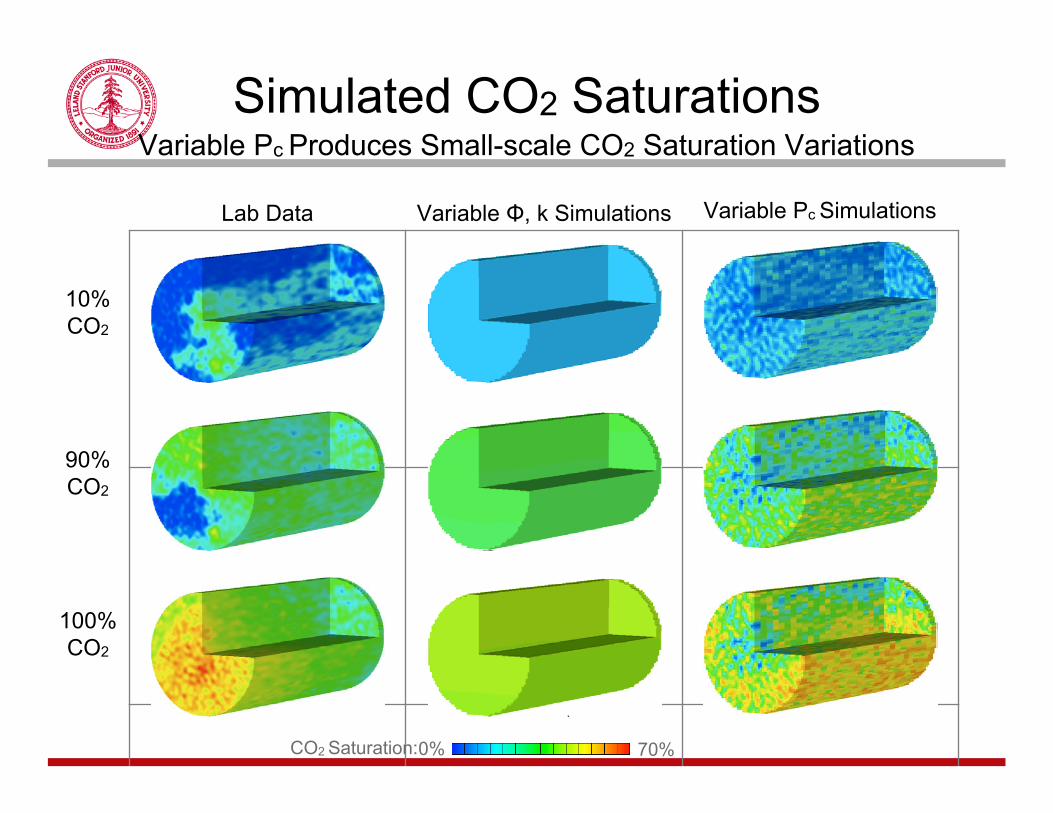
Small-scale CO2 Saturation Variations
5% CO2 10% CO2
20% CO2 50% CO2 80% CO2
90% CO2 100% CO2
CO2 Saturation:0% 100%50% 75%25%
Sub-corescale saturation variations generally overlooked in relative permeability measurements.
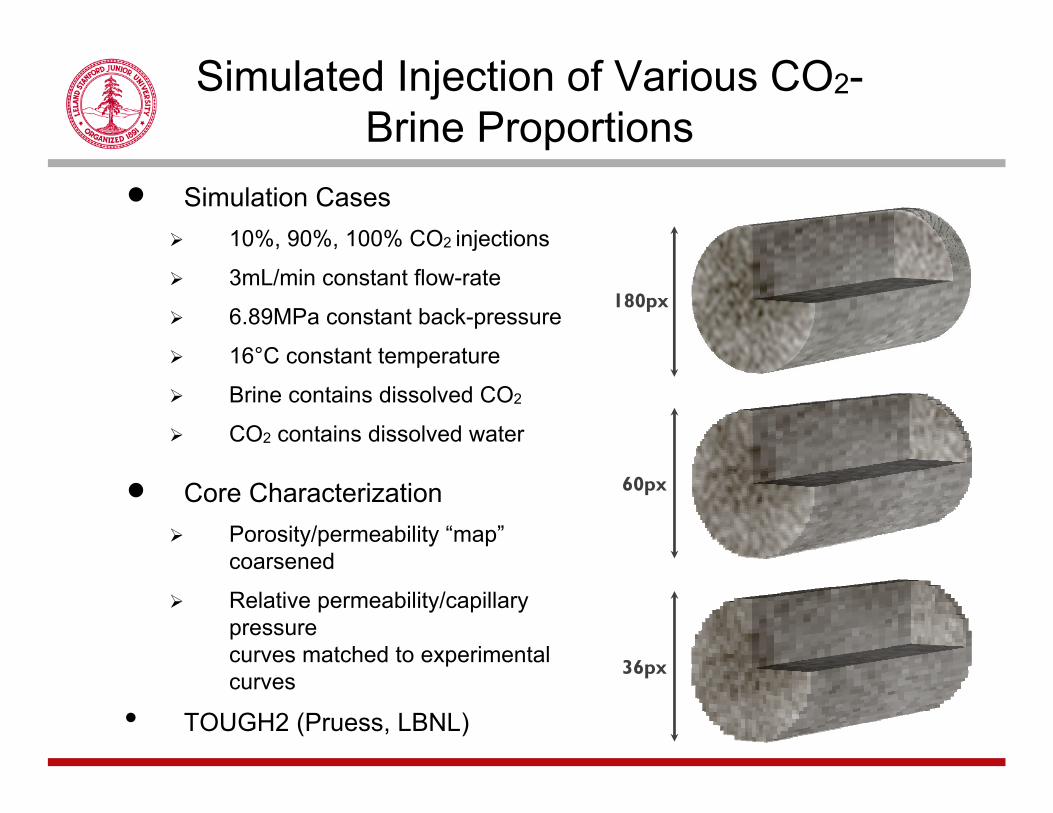
Simulated Injection of Various CO2-Brine Proportions
• Simulation Cases10%, 90%, 100% CO2 injections
3mL/min constant flow-rate
6.89MPa constant back-pressure
16°C constant temperature
Brine contains dissolved CO2
CO2 contains dissolved water
• Core CharacterizationPorosity/permeability “map”coarsened
Relative permeability/capillary pressure curves matched to experimental curves
• TOUGH2 (Pruess, LBNL)
180px
60px
36px
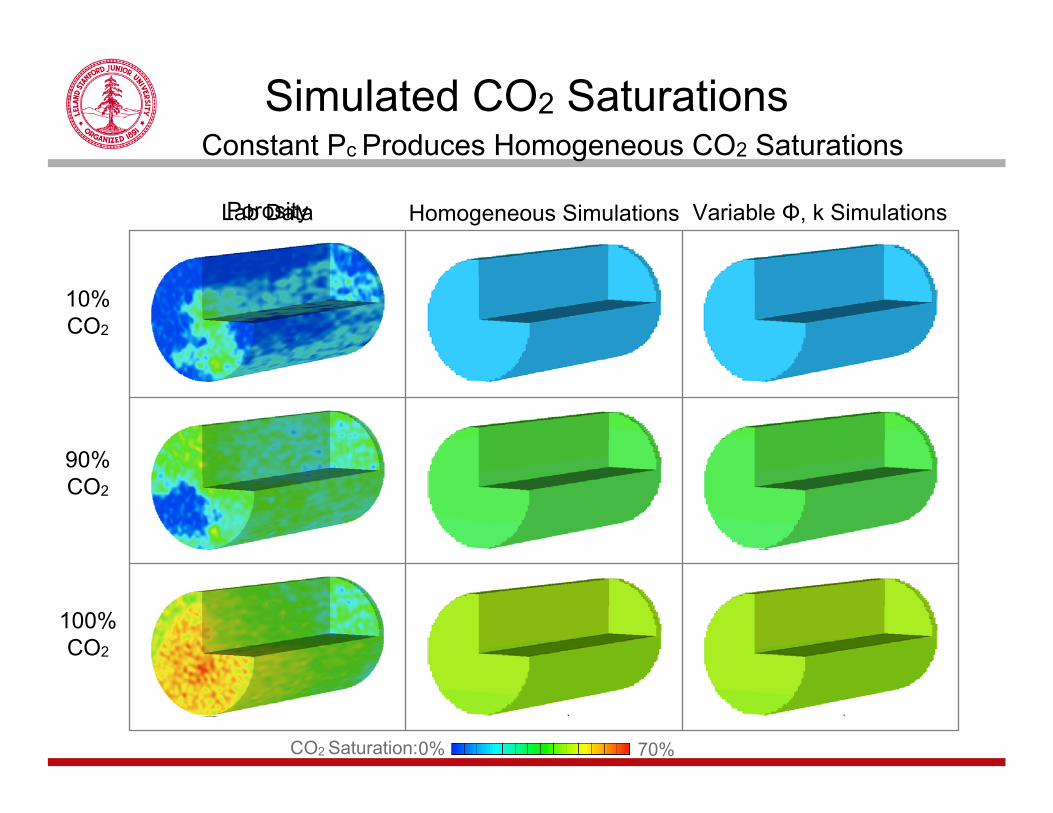
Homogeneous Simulations
10%CO2
90%CO2
100%CO2
Variable Φ, k Simulations
CO2 Saturation:0% 70%
Simulated CO2 SaturationsConstant Pc Produces Homogeneous CO2 Saturations
PorosityLab Data
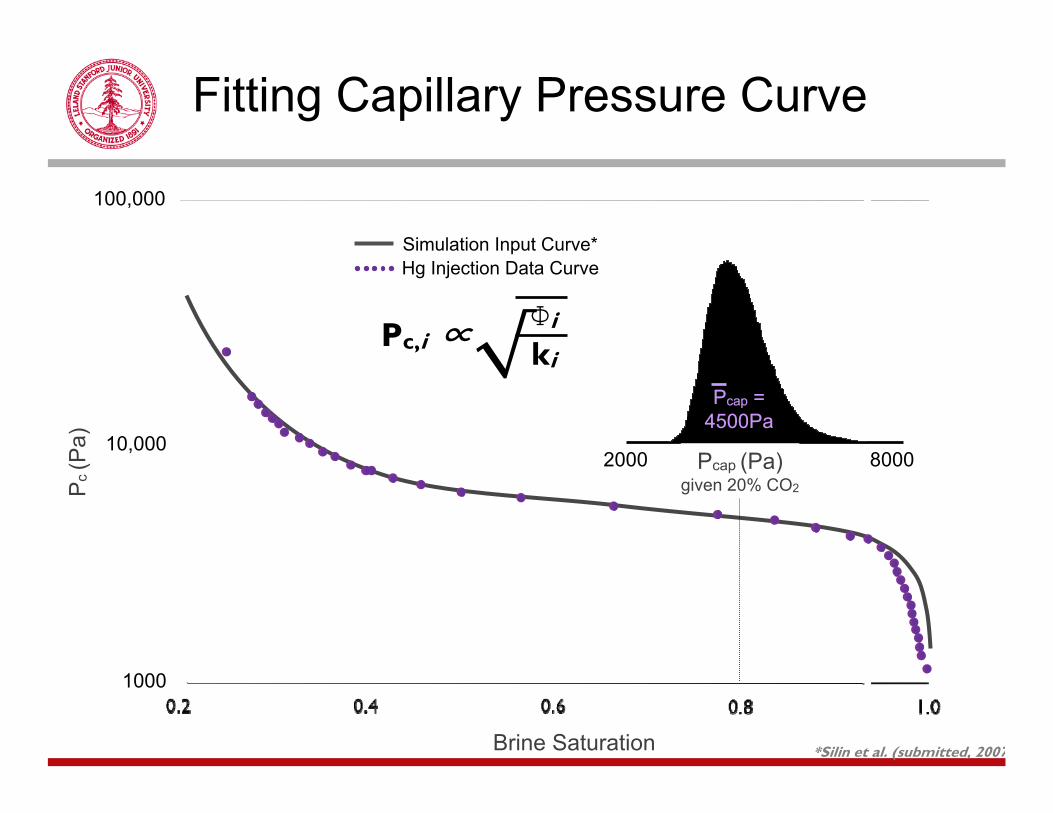
Fitting Capillary Pressure CurveP
c (P
a)
Brine Saturation
1000
10,000
100,000
Simulation Input Curve*
*Silin et al. (submitted, 2007
Hg Injection Data Curve
2000 8000Pcap (Pa)given 20% CO2
Pcap = 4500PaPcap =
4500Pa
Φi
ki√Pc,i ∝
10%CO2
90%CO2
100%CO2
Variable Φ, k Simulations
CO2 Saturation:0% 70%
Lab Data
Simulated CO2 SaturationsVariable Pc Produces Small-scale CO2 Saturation Variations
Variable Pc Simulations
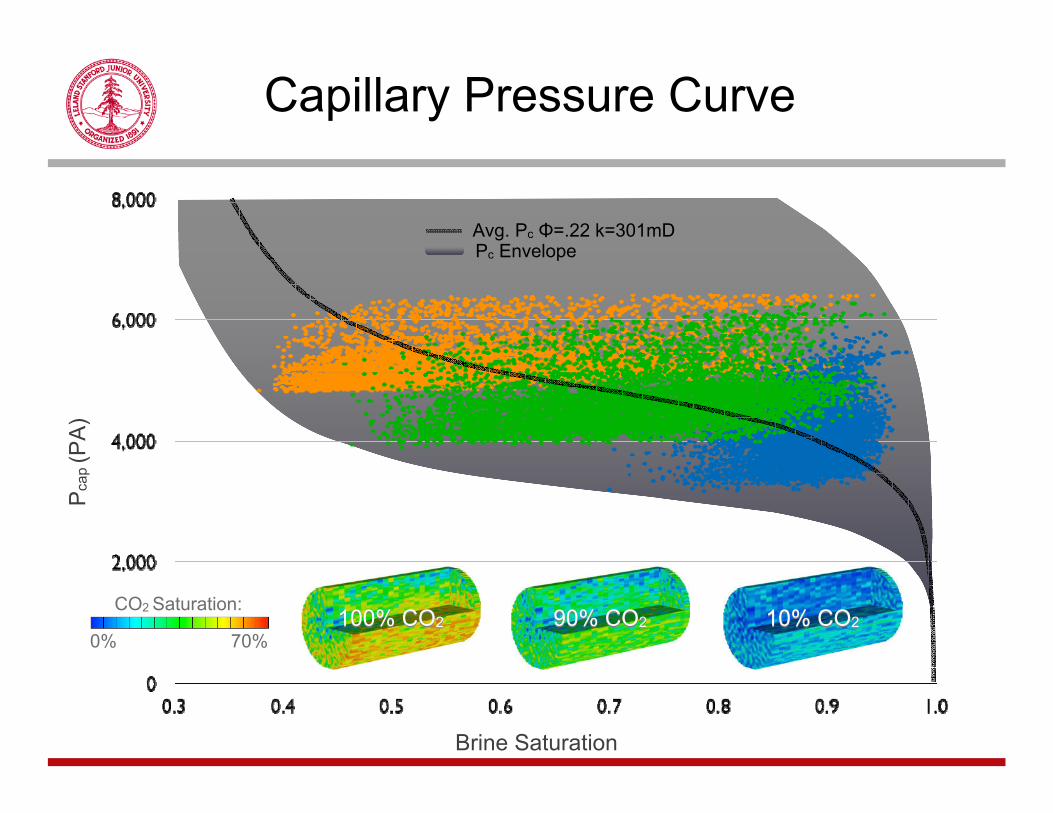
Capillary Pressure CurveP
cap (P
A)
Brine Saturation
CO2 Saturation:
0% 70%10% CO210% CO290% CO290% CO2100% CO2100% CO2
Avg. Pc Φ=.22 k=301mD Pc Envelope

Why should we care?
Why Should We Care?
Average CO2 saturation is:
‣ Decreased by sub-corescale heterogeneity
‣ Flow-rate dependent
‣ Affected by simulation grid resolution
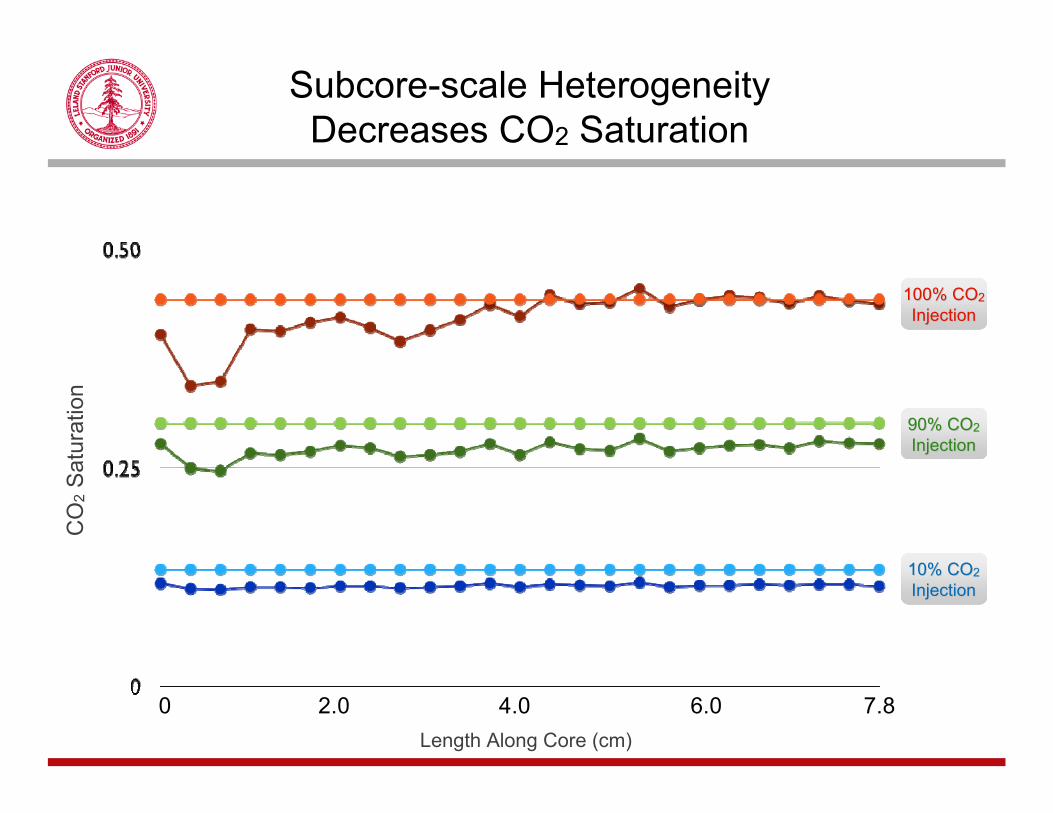
Subcore-scale Heterogeneity Decreases CO2 Saturation
0 7.84.02.0 6.0Length Along Core (cm)
CO
2S
atur
atio
n
100% CO100% CO22
InjectionInjection
90% CO90% CO22
InjectionInjection
10% CO10% CO22
InjectionInjection
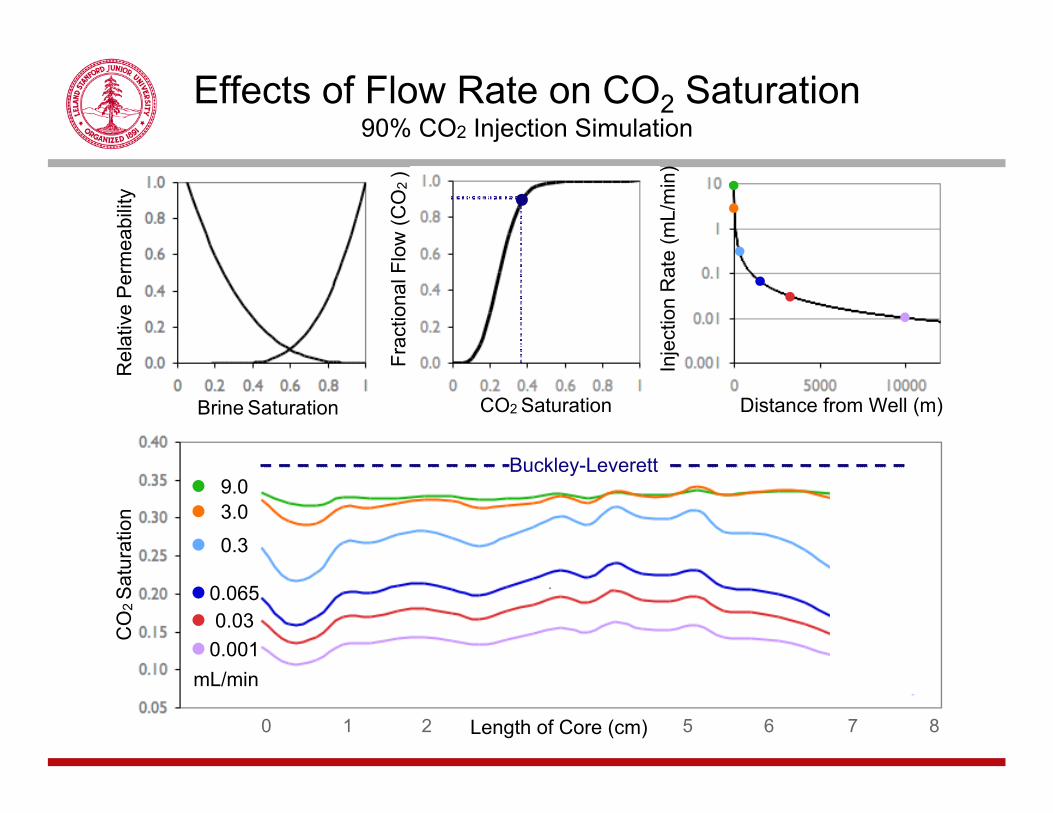
Effects of Flow Rate on CO2 Saturation90% CO2 Injection Simulation
Frac
tiona
l Flo
w (C
O2
)CO2 Saturation
Inje
ctio
n R
ate
(mL/
min
)
Distance from Well (m)Brine Saturation
Rel
ativ
e P
erm
eabi
lity
CO
2 S
atur
atio
n
Length of Core (cm)
3.09.0
mL/min
0.3
0.0650.03
0.001
Buckley-Leverett
0 87621 5
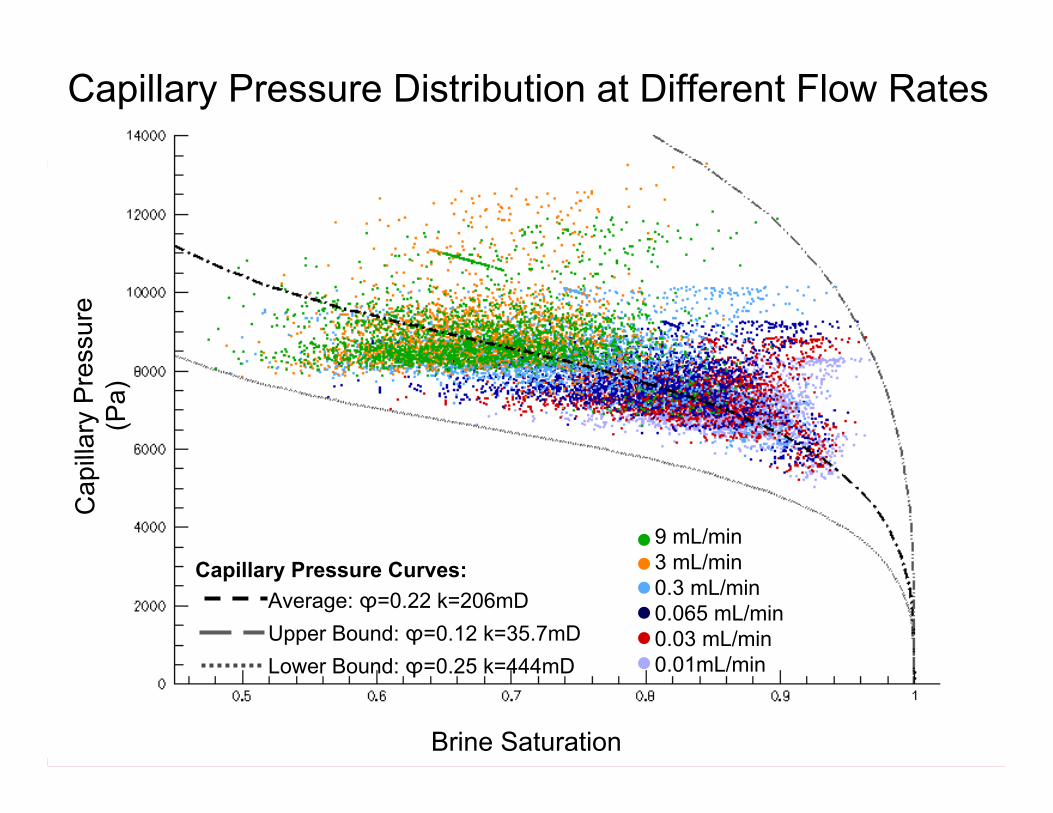
Capillary Pressure Distribution at Different Flow RatesC
apill
ary
Pre
ssur
e (P
a)
Capillary Pressure Curves:Average: ϕ=0.22 k=206mD Upper Bound: ϕ=0.12 k=35.7mDLower Bound: ϕ=0.25 k=444mD
9 mL/min3 mL/min0.3 mL/min0.065 mL/min0.03 mL/min0.01mL/min
Brine Saturation
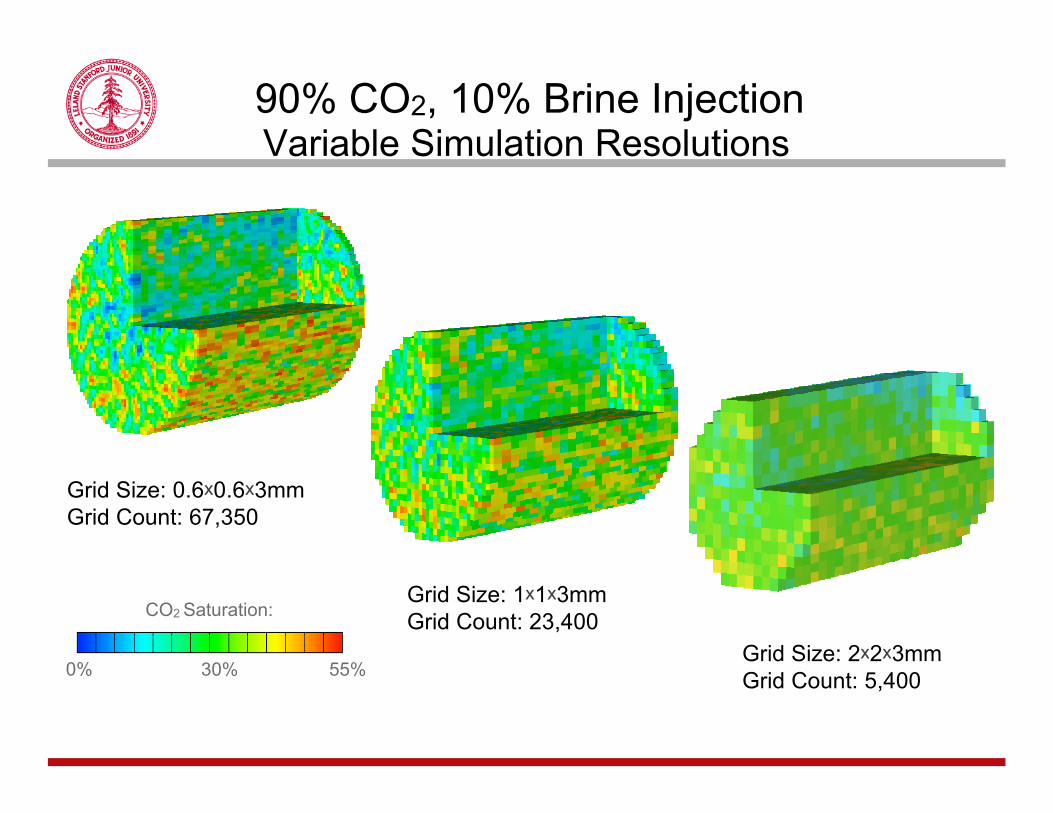
90% CO2, 10% Brine InjectionVariable Simulation Resolutions
Grid Size: 0.6x0.6x3mmGrid Count: 67,350
CO2 Saturation:
0% 55%30%
Grid Size: 1x1x3mmGrid Count: 23,400
Grid Size: 2x2x3mmGrid Count: 5,400
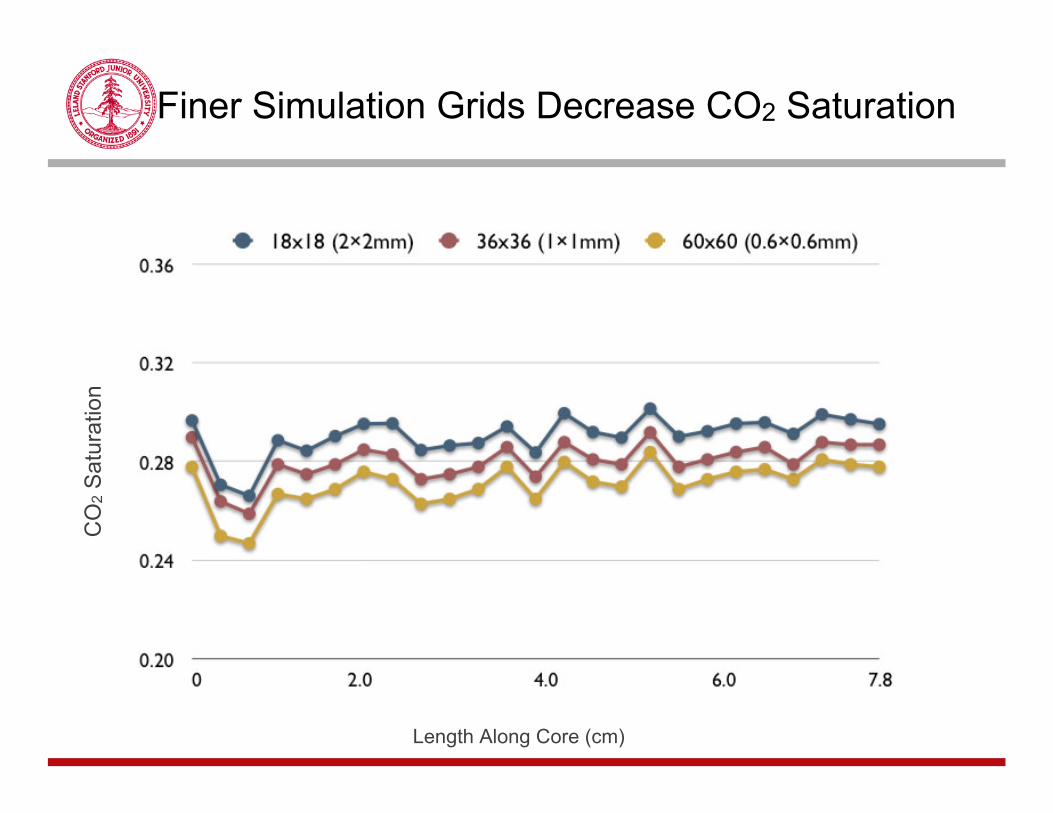
Finer Simulation Grids Decrease CO2 Saturation
Length Along Core (cm)
CO
2S
atur
atio
n
Conclusions
• Core-scale multi-phase flow experiments reveal strong influence of sub core-scale heterogeneity
• Spatial variations in capillary pressure behavior control CO2saturations
• CO2 saturation:– Decreases due to bypass of low porosity regions– Decreases at lower flow rates– Predictions depend on grid size
• Similar phenomena are expected at all spatial scales• Fundamental research needed to improve model predictions
– Fundamental process understanding based on lab and field experiments– Up-scaling strategies that accurately include the effects of sub-grid scale
heterogeneity– Calibration and validation of predictive models