Embed Size (px)
Citation preview
DESIGN OF CIVIL STRUCTURES I n t e g r a t e d S o l u t i o n S y s t e m f o r B r i d g e a n d C i v i l E n g i n e e r i n g
Release Note Release Date : 2012.08.31
Product Ver. : Civil 2013 V1.1
2 / 27
Civil 2013 V 1.1 Release Note Enhancement Enhancements
3
4
9
12
14
15
16
17
18
19
20
21
22
23
24
25
26
1. New GUI Enhancements with Ribbon Menu
2. Prestressed Box Girder Design as per AASHTO LRFD 6th Edition (2012)
3. PSC Design as per CSA-S6S1-2010 (Supplement No.1 to CAN/CSA-S6-06)
4. Moving Load Analysis Update as per AASHTO LRFD 6th Edition (2012)
5. Bridge Load Rating Update as per AASHTO LRFR 2010
6. Response Spectrum Function as per AASHTO LRFD 6th Edition (2012)
7. Moving Load Analysis Update as per CAN/CSA-S6S1-2010
8. Rail Track Analysis Model Wizard
9. Multi-linear Hinge Model (Kinematic, Takeda, Pivot, Elastic)
10. General Section Design as per AASHTO LRFD, CSA & ACI (available in V1.2)
11. Park Nonlinear Material Model
12. Improvements in Local Direction Force Sum
13. Automatic Interpolation of Section Stiffness Scale Factor in Tapered Section Group
14. Display Detail Description for Plate Forces/Stress Option
15. Improvements in Suspension Bridge Analysis Control for Initial Equilibrium State
16. Simultaneous Analysis of Time History and Response Spectrum Analysis
17. Analysis Progress Window to Check Analysis Status and Remaining Time
3 / 27
Civil 2013 V 1.1 Release Note Enhancement Civil 2013
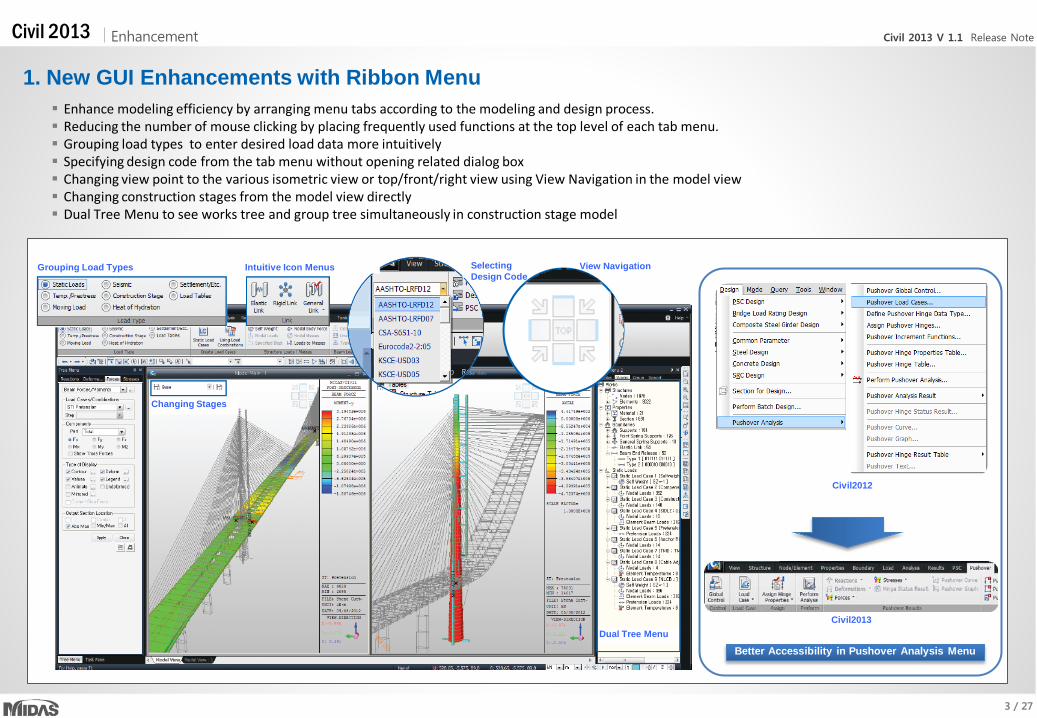
1. New GUI Enhancements with Ribbon Menu Enhance modeling efficiency by arranging menu tabs according to the modeling and design process. Reducing the number of mouse clicking by placing frequently used functions at the top level of each tab menu. Grouping load types to enter desired load data more intuitively Specifying design code from the tab menu without opening related dialog box Changing view point to the various isometric view or top/front/right view using View Navigation in the model view Changing construction stages from the model view directly Dual Tree Menu to see works tree and group tree simultaneously in construction stage model
Grouping Load Types Intuitive Icon Menus
Changing Stages
Dual Tree Menu
Selecting Design Code
View Navigation
Civil2013
Better Accessibility in Pushover Analysis Menu
Civil2012
4 / 27
Civil 2013 V 1.1 Release Note Enhancement Civil 2013
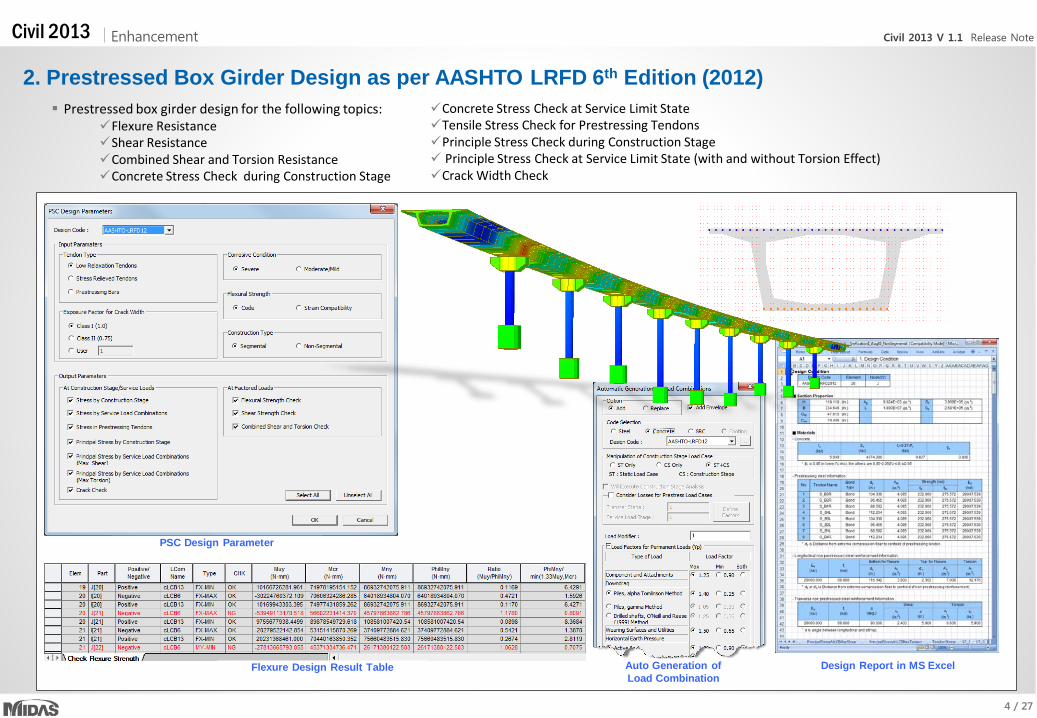
2. Prestressed Box Girder Design as per AASHTO LRFD 6th Edition (2012)
PSC Design Parameter
Flexure Design Result Table Design Report in MS Excel
Prestressed box girder design for the following topics: Flexure Resistance Shear Resistance Combined Shear and Torsion Resistance Concrete Stress Check during Construction Stage
Concrete Stress Check at Service Limit State Tensile Stress Check for Prestressing Tendons Principle Stress Check during Construction Stage Principle Stress Check at Service Limit State (with and without Torsion Effect) Crack Width Check
Auto Generation of Load Combination
5 / 27
Civil 2013 V 1.1 Release Note Enhancement Civil 2013
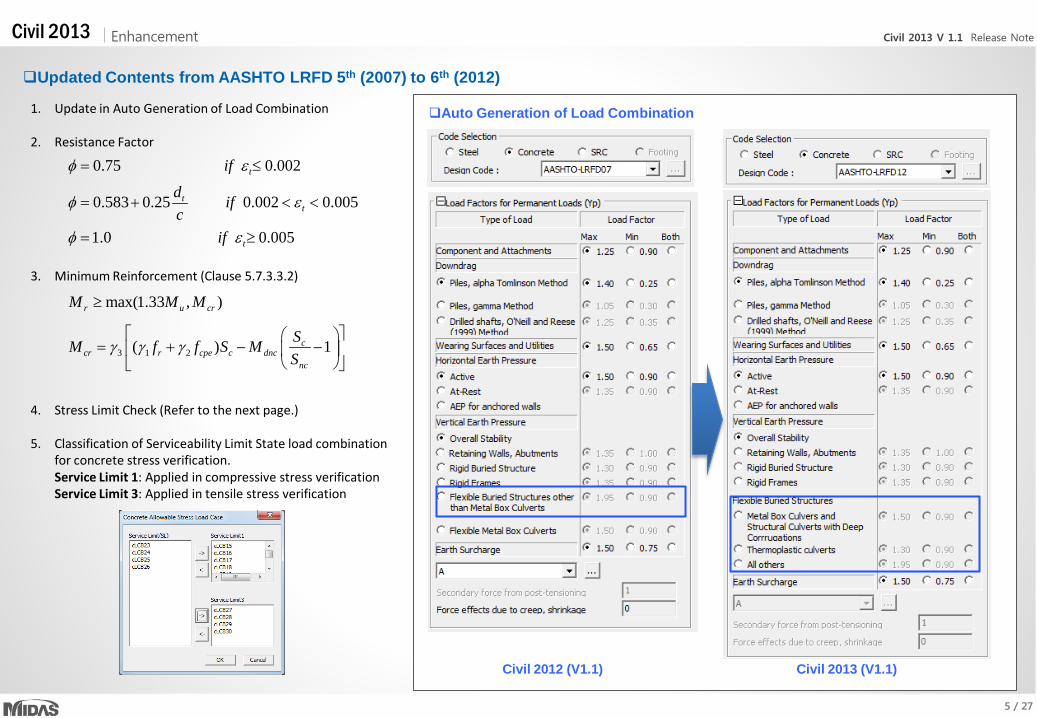
Updated Contents from AASHTO LRFD 5th (2007) to 6th (2012)
1. Update in Auto Generation of Load Combination
2. Resistance Factor
3. Minimum Reinforcement (Clause 5.7.3.3.2)
4. Stress Limit Check (Refer to the next page.) 5. Classification of Serviceability Limit State load combination
for concrete stress verification. Service Limit 1: Applied in compressive stress verification Service Limit 3: Applied in tensile stress verification
3 1 2( ) 1ccr r cpe c dnc
nc
SM f f S MS
γ γ γ
= + − −
Civil 2012 (V1.1) Civil 2013 (V1.1)
Auto Generation of Load Combination
0.75 0.002tifφ ε= ≤
0.583 0.25 0.002 0.005tt
d ifc
φ ε= + < <
1.0 0.005tifφ ε= ≥
max(1.33 , )r u crM M M≥
6 / 27
Civil 2013 V 1.1 Release Note Enhancement Civil 2013
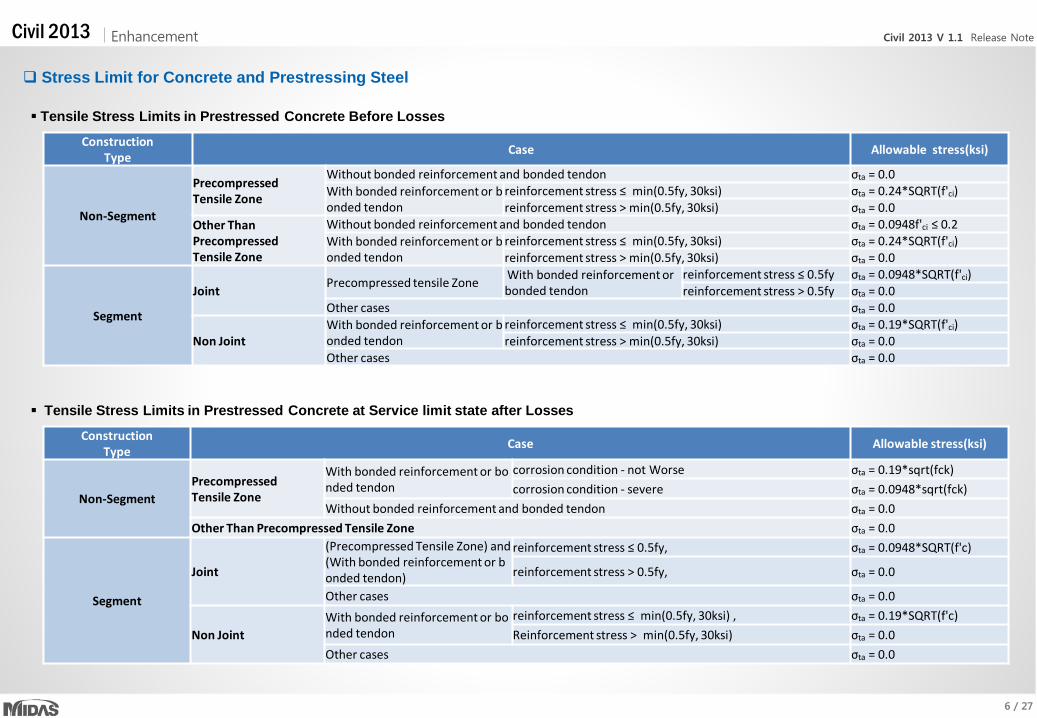
Tensile Stress Limits in Prestressed Concrete Before Losses
Stress Limit for Concrete and Prestressing Steel
Tensile Stress Limits in Prestressed Concrete at Service limit state after Losses
Construction Type Case Allowable stress(ksi)
Non-Segment
Precompressed Tensile Zone
Without bonded reinforcement and bonded tendon σta = 0.0 With bonded reinforcement or bonded tendon
reinforcement stress ≤ min(0.5fy, 30ksi) σta = 0.24*SQRT(f'ci) reinforcement stress > min(0.5fy, 30ksi) σta = 0.0
Other Than Precompressed Tensile Zone
Without bonded reinforcement and bonded tendon σta = 0.0948f'ci ≤ 0.2 With bonded reinforcement or bonded tendon
reinforcement stress ≤ min(0.5fy, 30ksi) σta = 0.24*SQRT(f'ci) reinforcement stress > min(0.5fy, 30ksi) σta = 0.0
Segment
Joint Precompressed tensile Zone With bonded reinforcement or bonded tendon
reinforcement stress ≤ 0.5fy σta = 0.0948*SQRT(f'ci) reinforcement stress > 0.5fy σta = 0.0
Other cases σta = 0.0
Non Joint With bonded reinforcement or bonded tendon
reinforcement stress ≤ min(0.5fy, 30ksi) σta = 0.19*SQRT(f'ci) reinforcement stress > min(0.5fy, 30ksi) σta = 0.0
Other cases σta = 0.0
Construction Type Case Allowable stress(ksi)
Non-Segment Precompressed Tensile Zone
With bonded reinforcement or bonded tendon
corrosion condition - not Worse σta = 0.19*sqrt(fck) corrosion condition - severe σta = 0.0948*sqrt(fck)
Without bonded reinforcement and bonded tendon σta = 0.0 Other Than Precompressed Tensile Zone σta = 0.0
Segment
Joint
(Precompressed Tensile Zone) and (With bonded reinforcement or bonded tendon)
reinforcement stress ≤ 0.5fy, σta = 0.0948*SQRT(f'c)
reinforcement stress > 0.5fy, σta = 0.0
Other cases σta = 0.0
Non Joint With bonded reinforcement or bonded tendon
reinforcement stress ≤ min(0.5fy, 30ksi) , σta = 0.19*SQRT(f'c) Reinforcement stress > min(0.5fy, 30ksi) σta = 0.0
Other cases σta = 0.0
7 / 27
Civil 2013 V 1.1 Release Note Enhancement Civil 2013
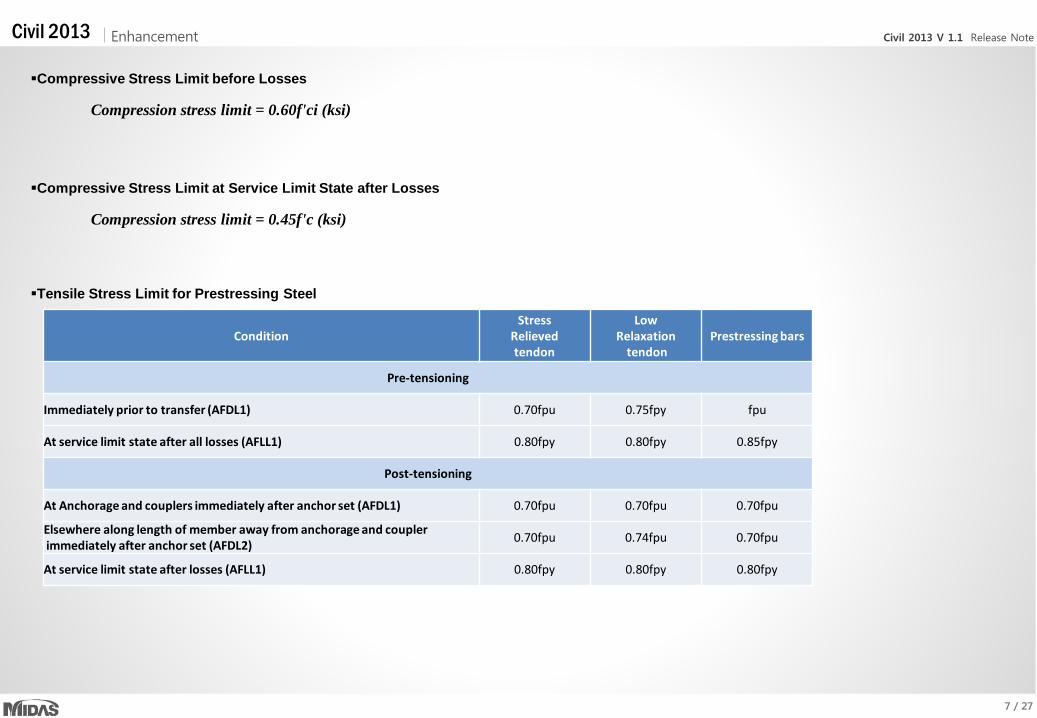
Condition Stress
Relieved tendon
Low Relaxation
tendon Prestressing bars
Pre-tensioning
Immediately prior to transfer (AFDL1) 0.70fpu 0.75fpy fpu
At service limit state after all losses (AFLL1) 0.80fpy 0.80fpy 0.85fpy
Post-tensioning
At Anchorage and couplers immediately after anchor set (AFDL1) 0.70fpu 0.70fpu 0.70fpu
Elsewhere along length of member away from anchorage and coupler immediately after anchor set (AFDL2) 0.70fpu 0.74fpu 0.70fpu
At service limit state after losses (AFLL1) 0.80fpy 0.80fpy 0.80fpy
Tensile Stress Limit for Prestressing Steel
Compressive Stress Limit before Losses
Compression stress limit = 0.60f'ci (ksi)
Compressive Stress Limit at Service Limit State after Losses
Compression stress limit = 0.45f'c (ksi)
8 / 27
Civil 2013 V 1.1 Release Note Enhancement Civil 2013
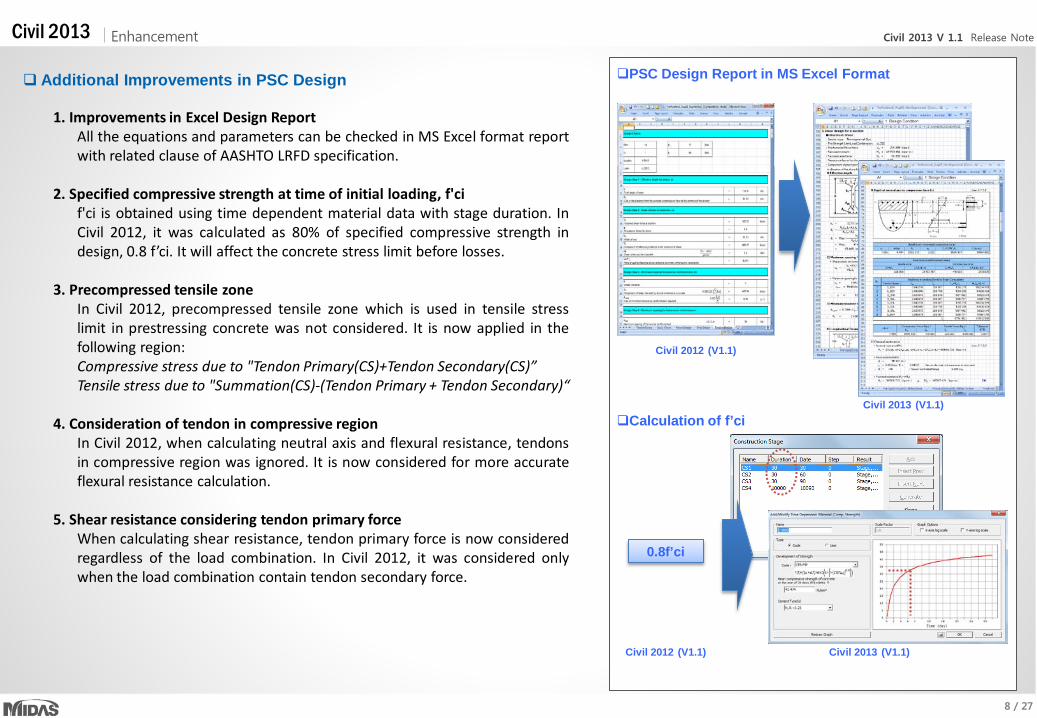
1. Improvements in Excel Design Report All the equations and parameters can be checked in MS Excel format report with related clause of AASHTO LRFD specification.
2. Specified compressive strength at time of initial loading, f'ci f'ci is obtained using time dependent material data with stage duration. In
Civil 2012, it was calculated as 80% of specified compressive strength in design, 0.8 f’ci. It will affect the concrete stress limit before losses.
3. Precompressed tensile zone In Civil 2012, precompressed tensile zone which is used in tensile stress
limit in prestressing concrete was not considered. It is now applied in the following region:
Compressive stress due to "Tendon Primary(CS)+Tendon Secondary(CS)” Tensile stress due to "Summation(CS)-(Tendon Primary + Tendon Secondary)“ 4. Consideration of tendon in compressive region In Civil 2012, when calculating neutral axis and flexural resistance, tendons
in compressive region was ignored. It is now considered for more accurate flexural resistance calculation.
5. Shear resistance considering tendon primary force When calculating shear resistance, tendon primary force is now considered
regardless of the load combination. In Civil 2012, it was considered only when the load combination contain tendon secondary force.
Additional Improvements in PSC Design
Civil 2012 (V1.1)
Civil 2013 (V1.1)
PSC Design Report in MS Excel Format
Calculation of f’ci
0.8f’ci
Civil 2012 (V1.1) Civil 2013 (V1.1)
9 / 27
Civil 2013 V 1.1 Release Note Enhancement Civil 2013
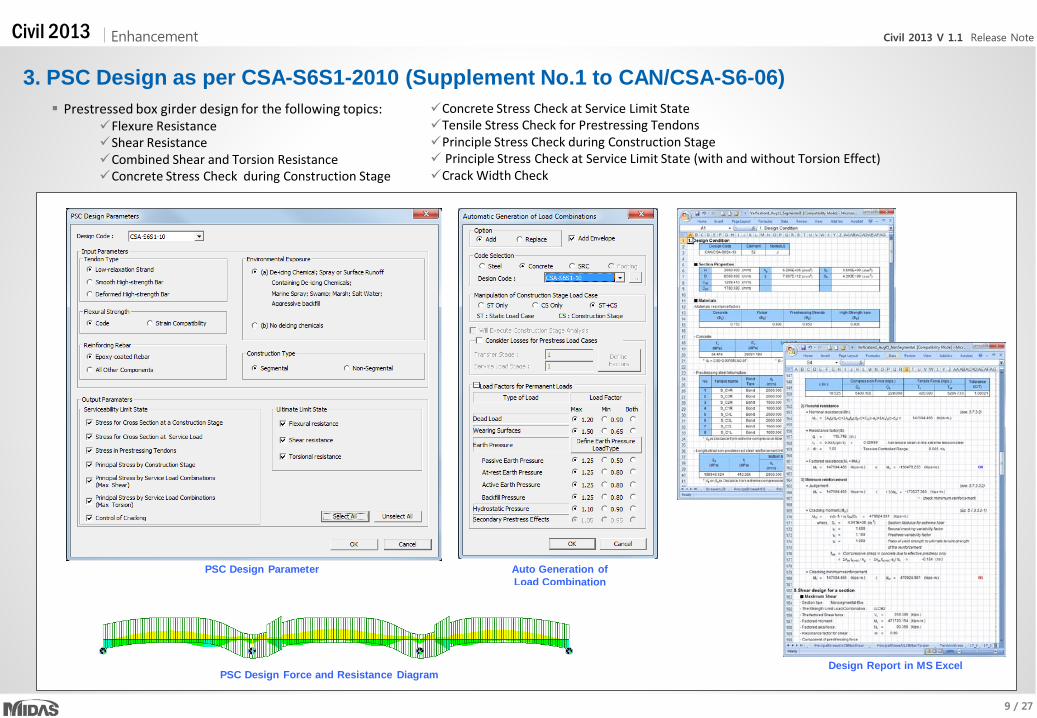
3. PSC Design as per CSA-S6S1-2010 (Supplement No.1 to CAN/CSA-S6-06) Prestressed box girder design for the following topics:
Flexure Resistance Shear Resistance Combined Shear and Torsion Resistance Concrete Stress Check during Construction Stage
Concrete Stress Check at Service Limit State Tensile Stress Check for Prestressing Tendons Principle Stress Check during Construction Stage Principle Stress Check at Service Limit State (with and without Torsion Effect) Crack Width Check
PSC Design Parameter
Design Report in MS Excel
Auto Generation of Load Combination
PSC Design Force and Resistance Diagram
10 / 27
Civil 2013 V 1.1 Release Note Enhancement Civil 2013
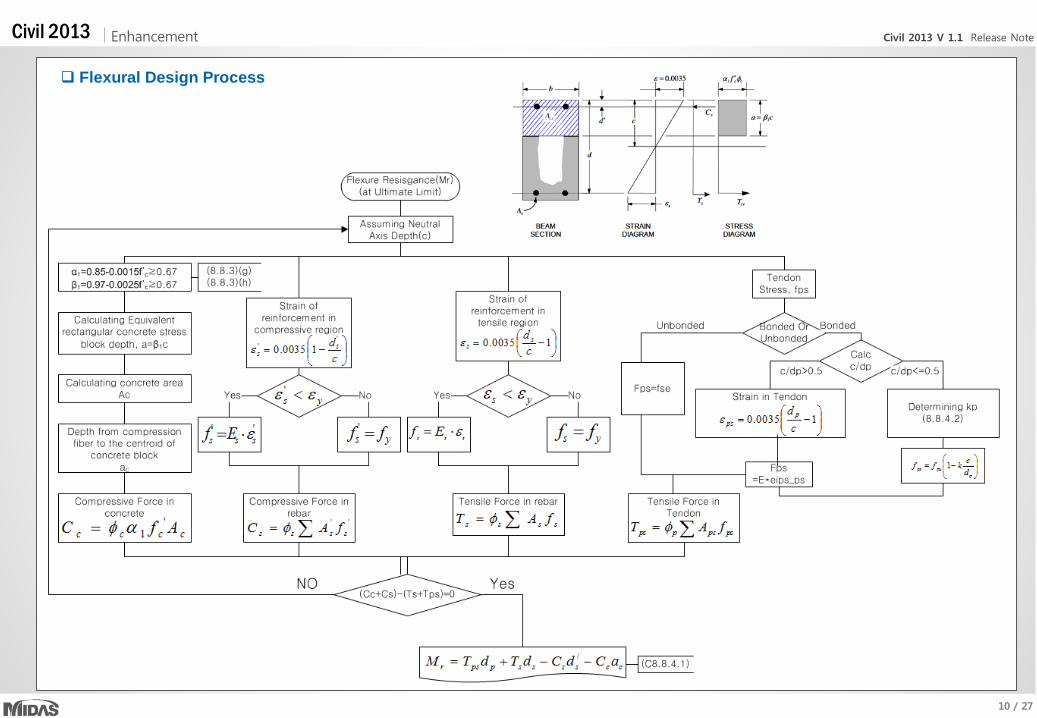
Flexural Design Process
11 / 27
Civil 2013 V 1.1 Release Note Enhancement Civil 2013
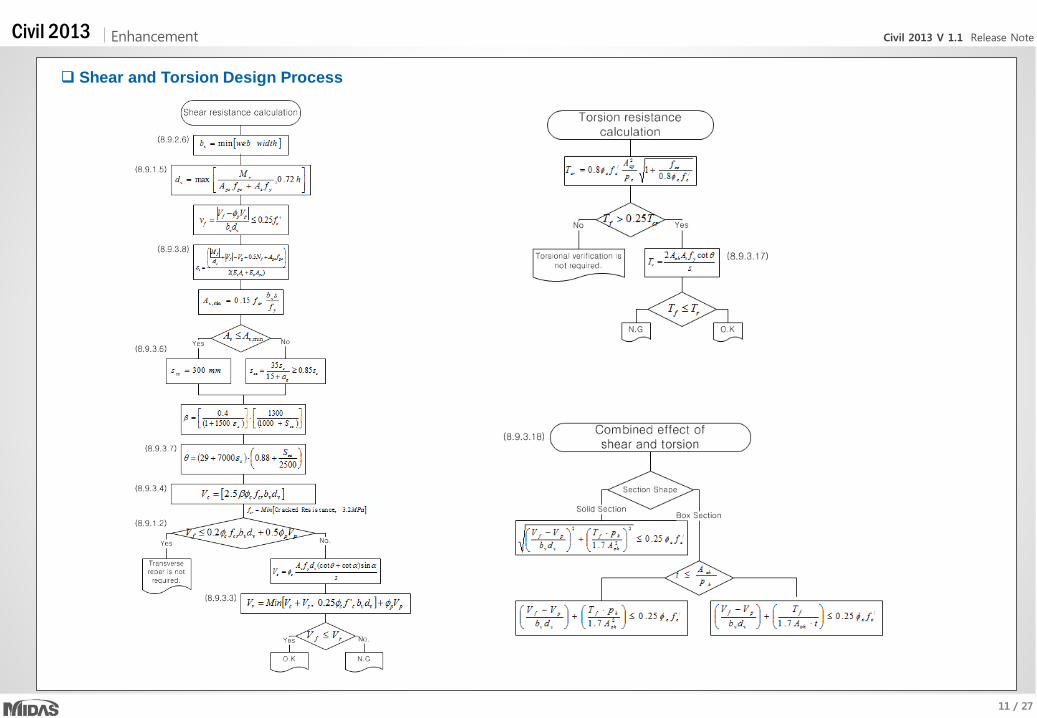
Shear and Torsion Design Process
12 / 27
Civil 2013 V 1.1 Release Note Enhancement Civil 2013
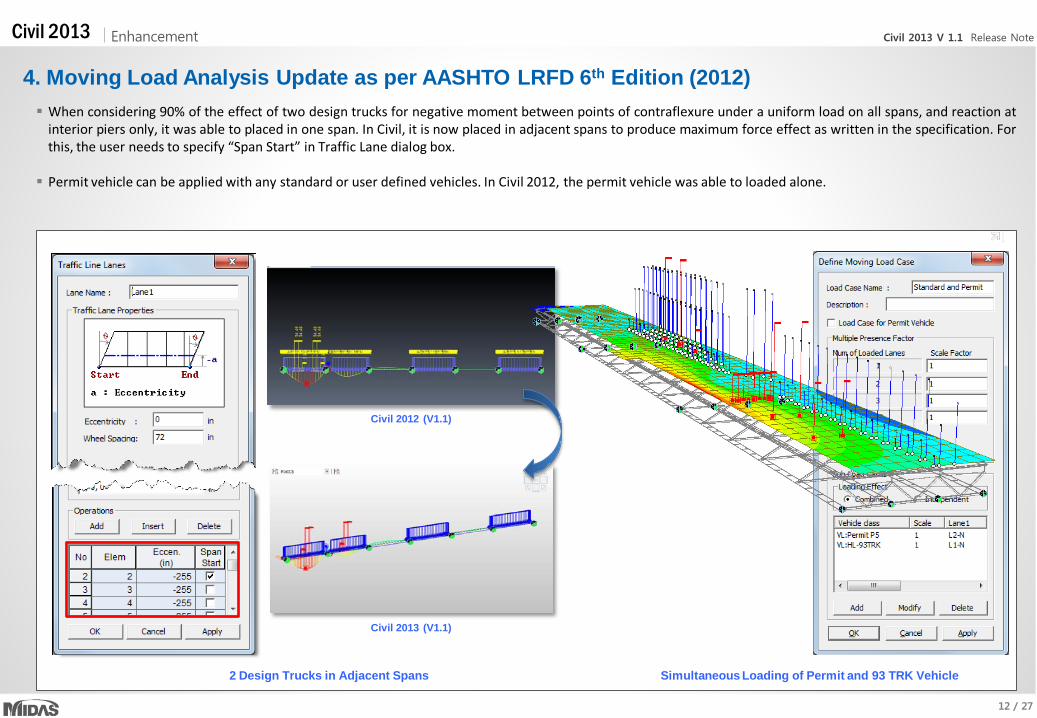
4. Moving Load Analysis Update as per AASHTO LRFD 6th Edition (2012) When considering 90% of the effect of two design trucks for negative moment between points of contraflexure under a uniform load on all spans, and reaction at
interior piers only, it was able to placed in one span. In Civil, it is now placed in adjacent spans to produce maximum force effect as written in the specification. For this, the user needs to specify “Span Start” in Traffic Lane dialog box. Permit vehicle can be applied with any standard or user defined vehicles. In Civil 2012, the permit vehicle was able to loaded alone.
Civil 2012 (V1.1)
Civil 2013 (V1.1)
2 Design Trucks in Adjacent Spans Simultaneous Loading of Permit and 93 TRK Vehicle
13 / 27
Civil 2013 V 1.1 Release Note Enhancement Civil 2013
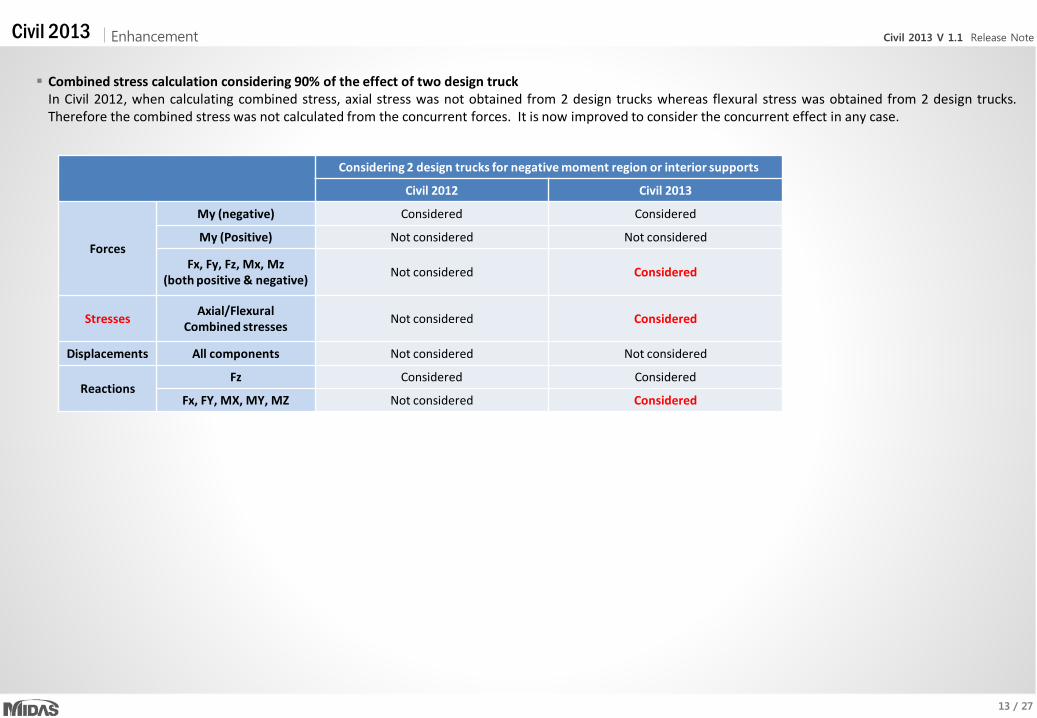
Considering 2 design trucks for negative moment region or interior supports
Civil 2012 Civil 2013
Forces
My (negative) Considered Considered
My (Positive) Not considered Not considered
Fx, Fy, Fz, Mx, Mz (both positive & negative) Not considered Considered
Stresses Axial/Flexural Combined stresses Not considered Considered
Displacements All components Not considered Not considered
Reactions Fz Considered Considered
Fx, FY, MX, MY, MZ Not considered Considered
Combined stress calculation considering 90% of the effect of two design truck In Civil 2012, when calculating combined stress, axial stress was not obtained from 2 design trucks whereas flexural stress was obtained from 2 design trucks.
Therefore the combined stress was not calculated from the concurrent forces. It is now improved to consider the concurrent effect in any case.
14 / 27
Civil 2013 V 1.1 Release Note Enhancement Civil 2013
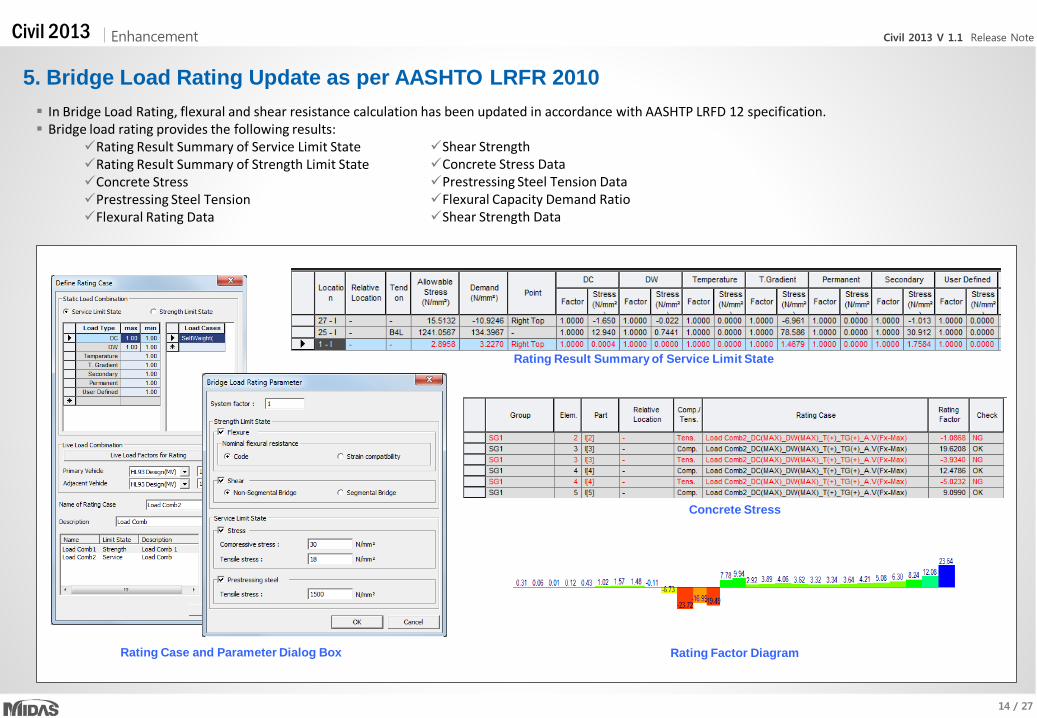
5. Bridge Load Rating Update as per AASHTO LRFR 2010
Rating Case and Parameter Dialog Box
In Bridge Load Rating, flexural and shear resistance calculation has been updated in accordance with AASHTP LRFD 12 specification. Bridge load rating provides the following results:
Rating Result Summary of Service Limit State Rating Result Summary of Strength Limit State Concrete Stress Prestressing Steel Tension Flexural Rating Data
Shear Strength Concrete Stress Data Prestressing Steel Tension Data Flexural Capacity Demand Ratio Shear Strength Data
Rating Result Summary of Service Limit State
Rating Factor Diagram
Concrete Stress
15 / 27
Civil 2013 V 1.1 Release Note Enhancement Civil 2013
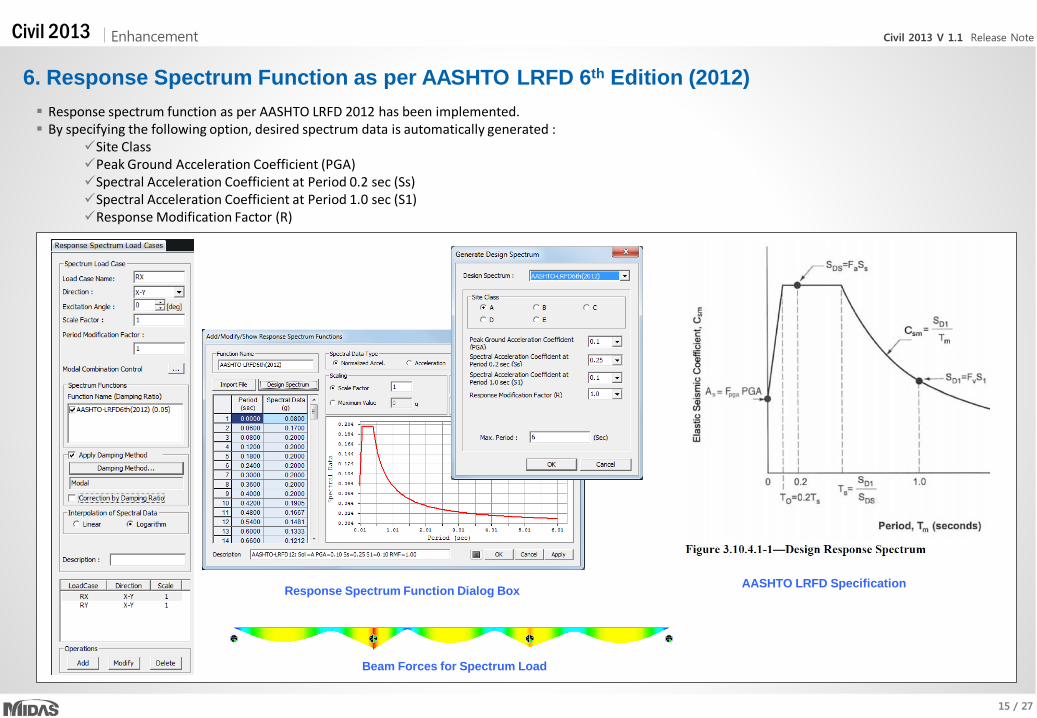
6. Response Spectrum Function as per AASHTO LRFD 6th Edition (2012) Response spectrum function as per AASHTO LRFD 2012 has been implemented. By specifying the following option, desired spectrum data is automatically generated :
Site Class Peak Ground Acceleration Coefficient (PGA) Spectral Acceleration Coefficient at Period 0.2 sec (Ss) Spectral Acceleration Coefficient at Period 1.0 sec (S1) Response Modification Factor (R)
Response Spectrum Function Dialog Box AASHTO LRFD Specification
Beam Forces for Spectrum Load
16 / 27
Civil 2013 V 1.1 Release Note Enhancement Civil 2013
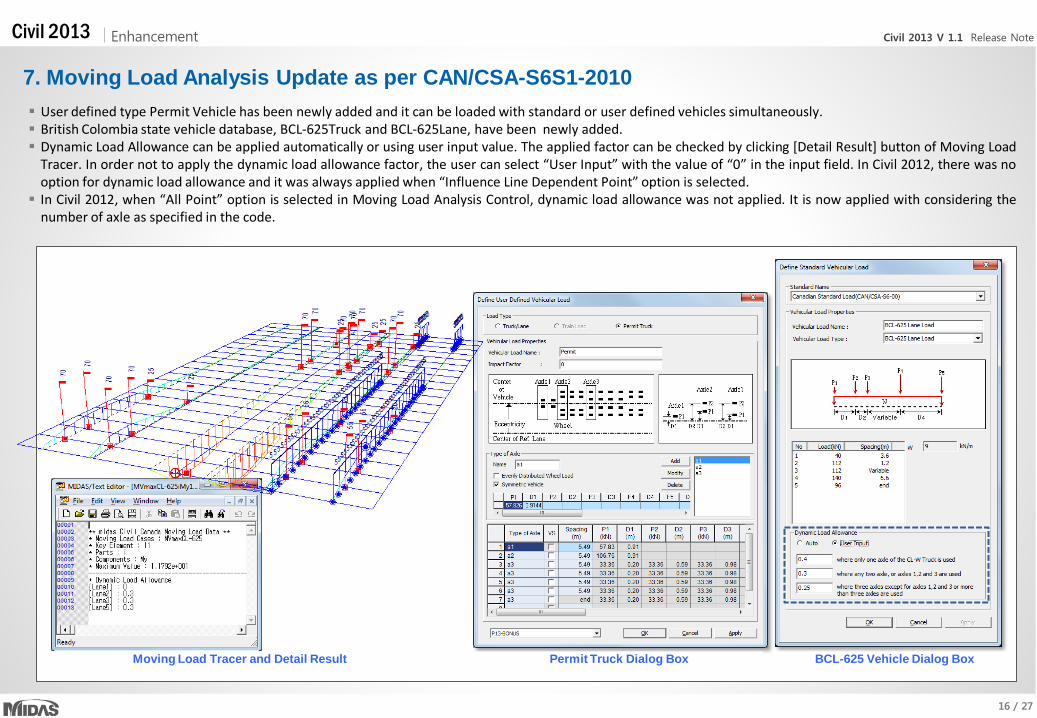
User defined type Permit Vehicle has been newly added and it can be loaded with standard or user defined vehicles simultaneously. British Colombia state vehicle database, BCL-625Truck and BCL-625Lane, have been newly added. Dynamic Load Allowance can be applied automatically or using user input value. The applied factor can be checked by clicking [Detail Result] button of Moving Load
Tracer. In order not to apply the dynamic load allowance factor, the user can select “User Input” with the value of “0” in the input field. In Civil 2012, there was no option for dynamic load allowance and it was always applied when “Influence Line Dependent Point” option is selected. In Civil 2012, when “All Point” option is selected in Moving Load Analysis Control, dynamic load allowance was not applied. It is now applied with considering the
number of axle as specified in the code.
7. Moving Load Analysis Update as per CAN/CSA-S6S1-2010
Permit Truck Dialog Box BCL-625 Vehicle Dialog Box Moving Load Tracer and Detail Result
17 / 27
Civil 2013 V 1.1 Release Note Enhancement Civil 2013
300 m Var. 300 m
Model with Temperatur
e Load
Model with train load (gravity
direction)
Model with train
acceleration and braking
force
Construction Stage model with all load cases
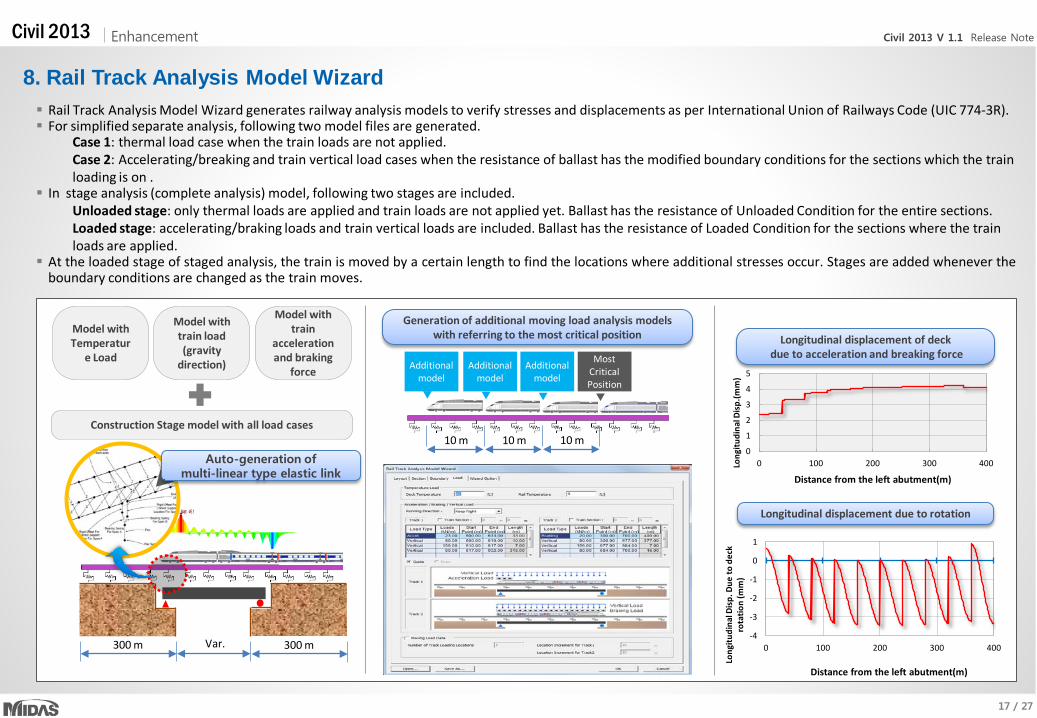
Auto-generation of multi-linear type elastic link
Longitudinal displacement of deck due to acceleration and breaking force
0
1
2
3
4
5
0 100 200 300 400 Long
itudi
nal D
isp.
(mm
)
Distance from the left abutment(m)
-4
-3
-2
-1
0
1
0 100 200 300 400
Long
itudi
nal D
isp.
Due
to d
eck
rota
tion
(mm
)
Distance from the left abutment(m)
Longitudinal displacement due to rotation
Generation of additional moving load analysis models with referring to the most critical position
Most Critical Position
Additional model
Additional model
Additional model
10 m 10 m 10 m
Rail Track Analysis Model Wizard generates railway analysis models to verify stresses and displacements as per International Union of Railways Code (UIC 774-3R). For simplified separate analysis, following two model files are generated.
Case 1: thermal load case when the train loads are not applied. Case 2: Accelerating/breaking and train vertical load cases when the resistance of ballast has the modified boundary conditions for the sections which the train loading is on .
In stage analysis (complete analysis) model, following two stages are included. Unloaded stage: only thermal loads are applied and train loads are not applied yet. Ballast has the resistance of Unloaded Condition for the entire sections. Loaded stage: accelerating/braking loads and train vertical loads are included. Ballast has the resistance of Loaded Condition for the sections where the train loads are applied.
At the loaded stage of staged analysis, the train is moved by a certain length to find the locations where additional stresses occur. Stages are added whenever the boundary conditions are changed as the train moves.
8. Rail Track Analysis Model Wizard
18 / 27
Civil 2013 V 1.1 Release Note Enhancement Civil 2013
Takeda Hinge Model
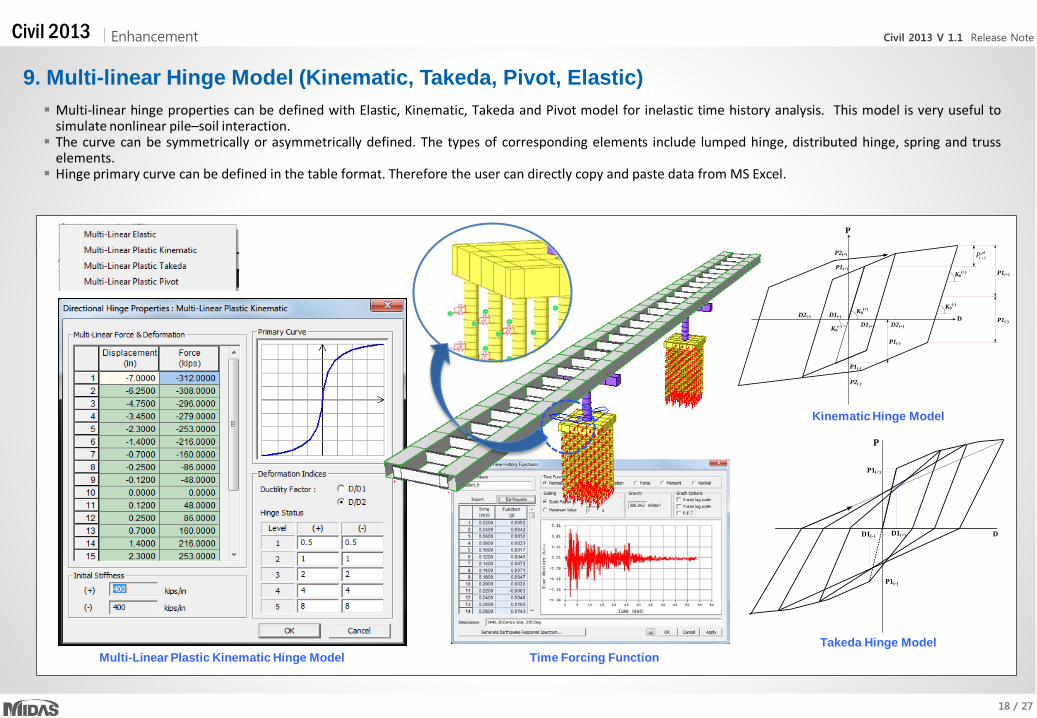
Multi-linear hinge properties can be defined with Elastic, Kinematic, Takeda and Pivot model for inelastic time history analysis. This model is very useful to simulate nonlinear pile–soil interaction. The curve can be symmetrically or asymmetrically defined. The types of corresponding elements include lumped hinge, distributed hinge, spring and truss
elements. Hinge primary curve can be defined in the table format. Therefore the user can directly copy and paste data from MS Excel.
Kinematic Hinge Model
9. Multi-linear Hinge Model (Kinematic, Takeda, Pivot, Elastic)
P
D
P2(+)
P1(+)
P2(-)
P1(-)
D1(+) D2(+)
D1(-)D2(-)
K0(+)
( )plP+
K0(+)
K0(-)
P1(-)
P1(+)
K0(-)
P1(-)
P1(+)
P1(-)
D1(+)D1(-)
P
D
Time Forcing Function Multi-Linear Plastic Kinematic Hinge Model
19 / 27
Civil 2013 V 1.1 Release Note Enhancement Civil 2013
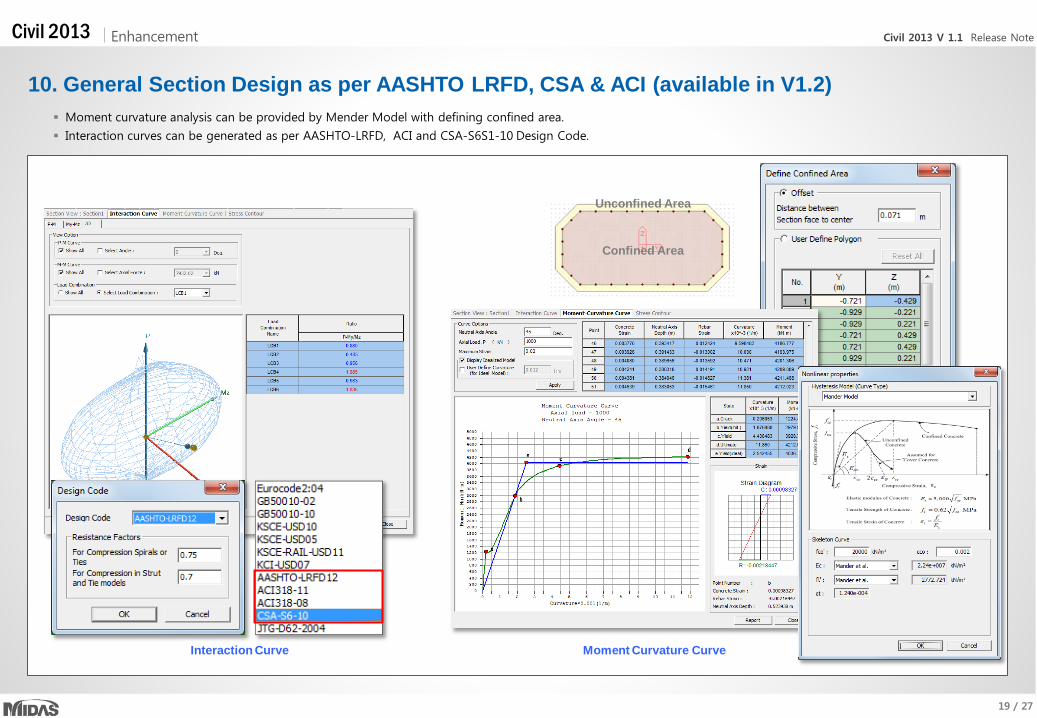
Moment curvature analysis can be provided by Mender Model with defining confined area.
Interaction curves can be generated as per AASHTO-LRFD, ACI and CSA-S6S1-10 Design Code.
10. General Section Design as per AASHTO LRFD, CSA & ACI (available in V1.2)
Interaction Curve Moment Curvature Curve
Confined Area
Unconfined Area
20 / 27
Civil 2013 V 1.1 Release Note Enhancement Civil 2013
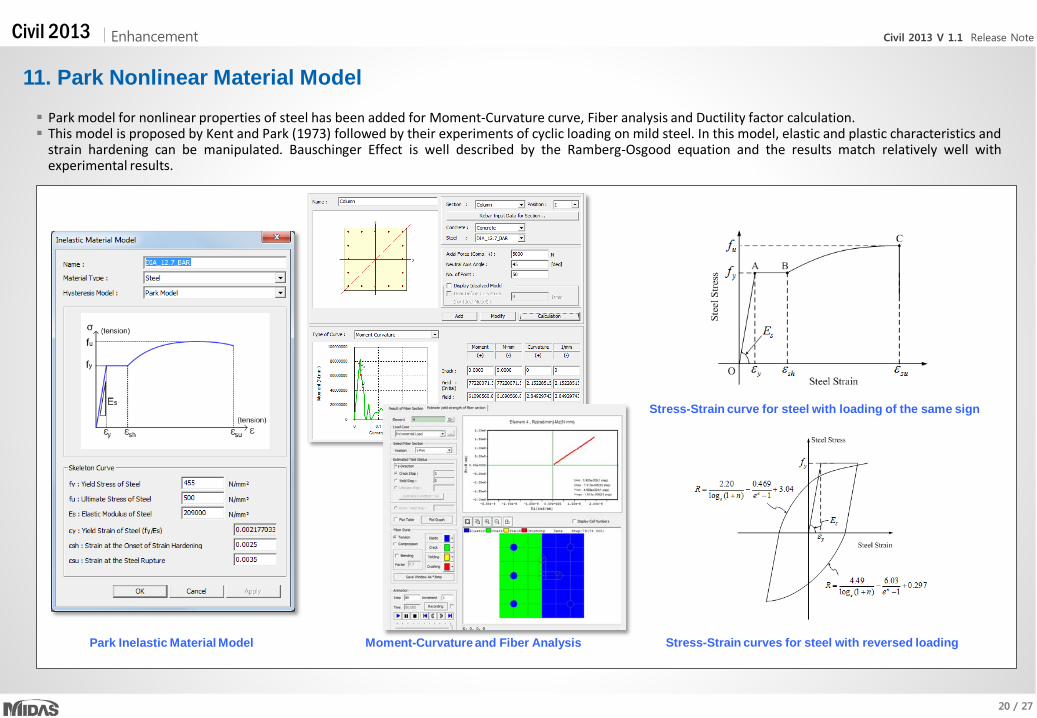
Park model for nonlinear properties of steel has been added for Moment-Curvature curve, Fiber analysis and Ductility factor calculation. This model is proposed by Kent and Park (1973) followed by their experiments of cyclic loading on mild steel. In this model, elastic and plastic characteristics and
strain hardening can be manipulated. Bauschinger Effect is well described by the Ramberg-Osgood equation and the results match relatively well with experimental results.
11. Park Nonlinear Material Model
Stress-Strain curve for steel with loading of the same sign
Stress-Strain curves for steel with reversed loading Park Inelastic Material Model Moment-Curvature and Fiber Analysis
21 / 27
Civil 2013 V 1.1 Release Note Enhancement Civil 2013
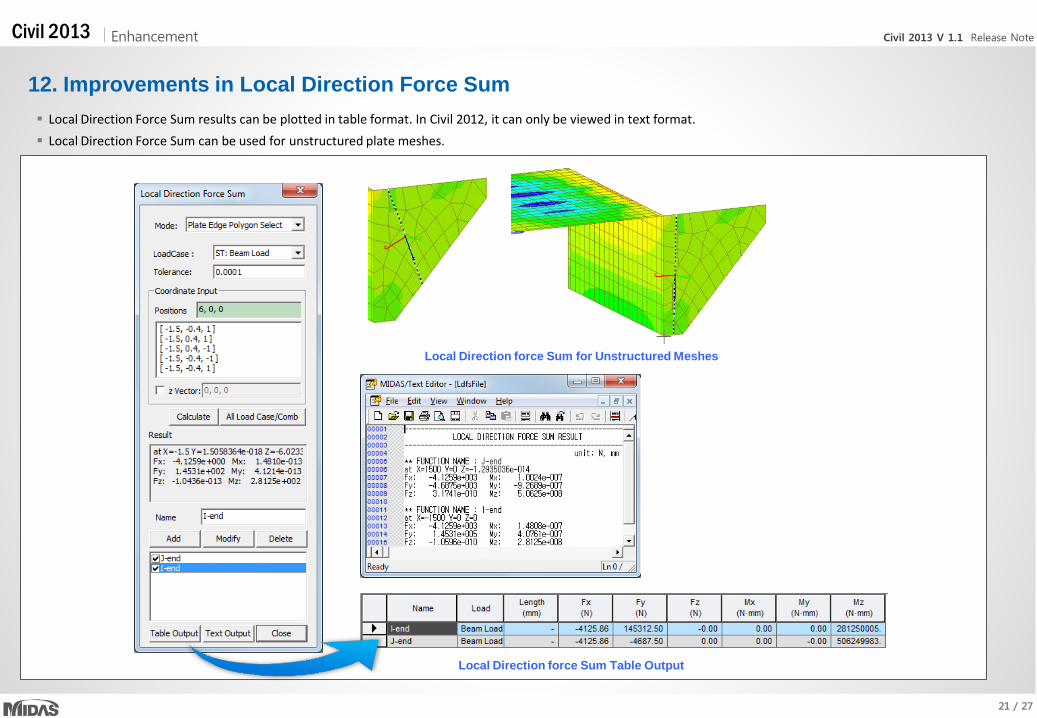
12. Improvements in Local Direction Force Sum Local Direction Force Sum results can be plotted in table format. In Civil 2012, it can only be viewed in text format. Local Direction Force Sum can be used for unstructured plate meshes.
Local Direction force Sum for Unstructured Meshes
Local Direction force Sum Table Output
22 / 27
Civil 2013 V 1.1 Release Note Enhancement Civil 2013
Civil2013 Civil2012
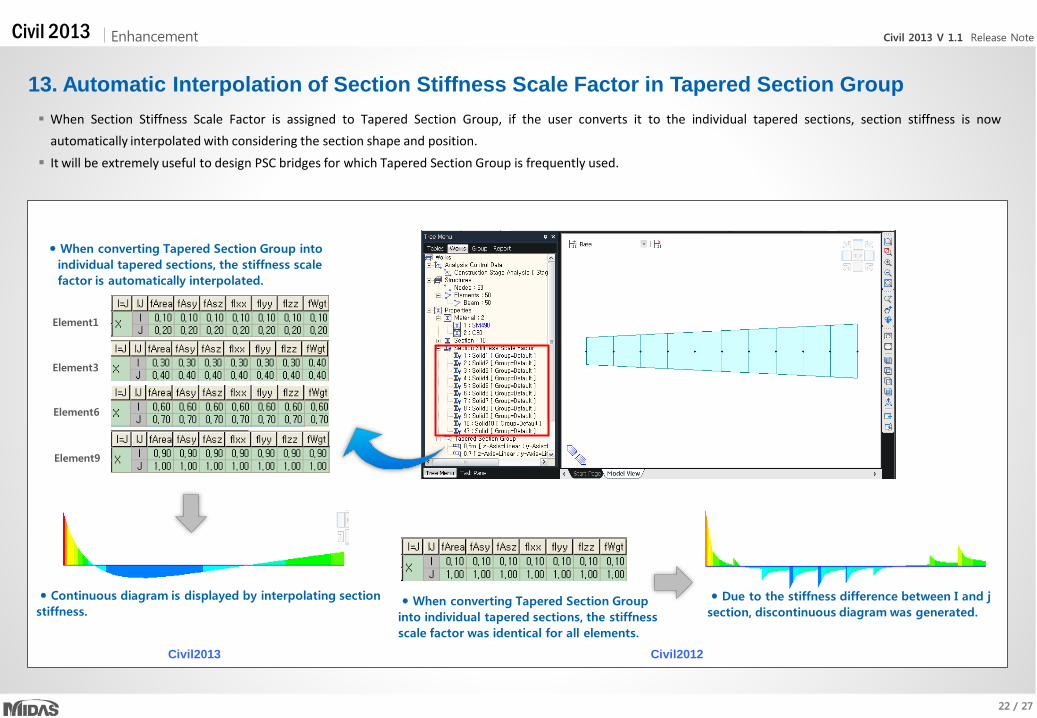
13. Automatic Interpolation of Section Stiffness Scale Factor in Tapered Section Group When Section Stiffness Scale Factor is assigned to Tapered Section Group, if the user converts it to the individual tapered sections, section stiffness is now
automatically interpolated with considering the section shape and position. It will be extremely useful to design PSC bridges for which Tapered Section Group is frequently used.
Continuous diagram is displayed by interpolating section stiffness.
Element1
Element3
Element6
Element9
When converting Tapered Section Group into individual tapered sections, the stiffness scale factor is automatically interpolated.
When converting Tapered Section Group into individual tapered sections, the stiffness scale factor was identical for all elements.
Due to the stiffness difference between I and j section, discontinuous diagram was generated.
23 / 27
Civil 2013 V 1.1 Release Note Enhancement Civil 2013
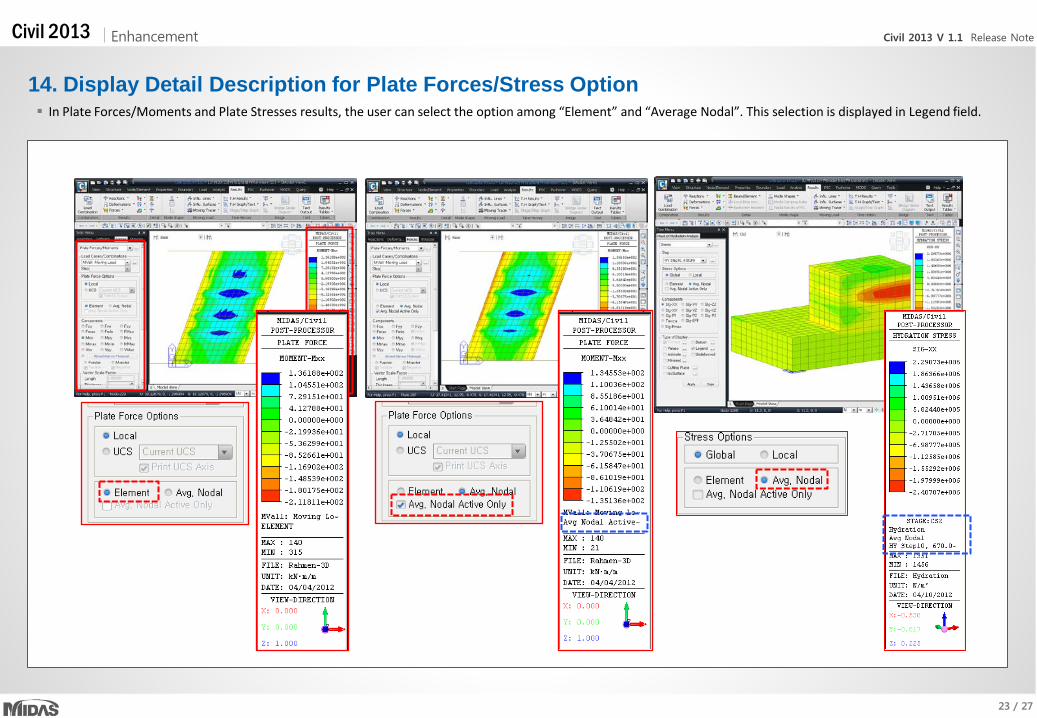
14. Display Detail Description for Plate Forces/Stress Option In Plate Forces/Moments and Plate Stresses results, the user can select the option among “Element” and “Average Nodal”. This selection is displayed in Legend field.
24 / 27
Civil 2013 V 1.1 Release Note Enhancement Civil 2013
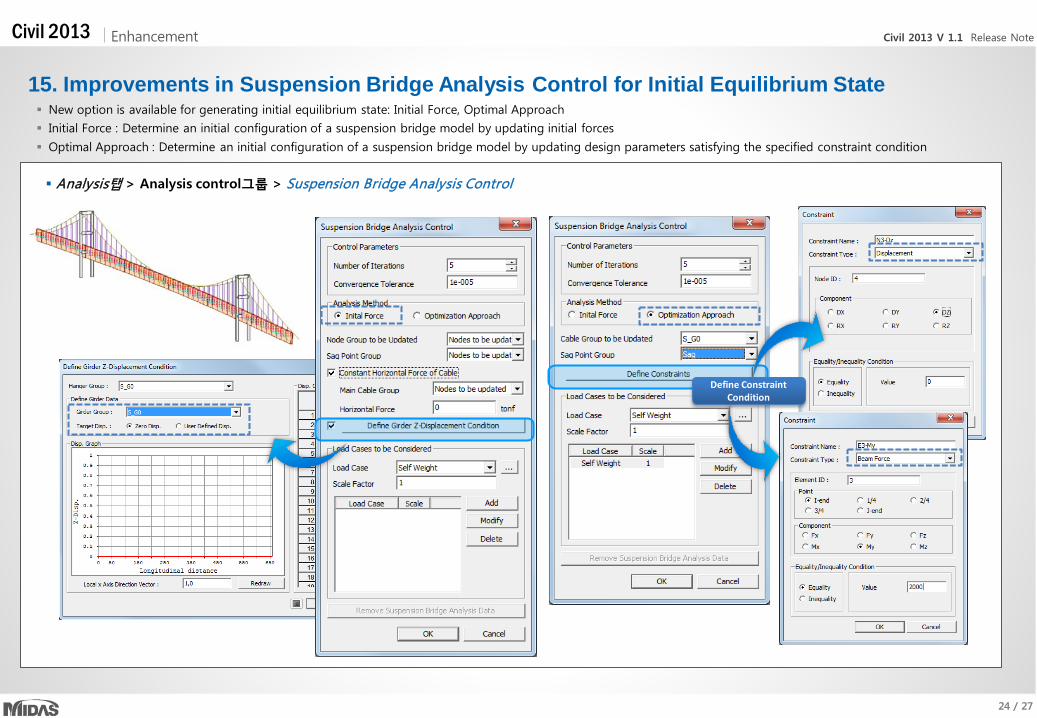
Analysis탭 > Analysis control그룹 > Suspension Bridge Analysis Control
15. Improvements in Suspension Bridge Analysis Control for Initial Equilibrium State New option is available for generating initial equilibrium state: Initial Force, Optimal Approach
Initial Force : Determine an initial configuration of a suspension bridge model by updating initial forces
Optimal Approach : Determine an initial configuration of a suspension bridge model by updating design parameters satisfying the specified constraint condition
Define Constraint Condition
25 / 27
Civil 2013 V 1.1 Release Note Enhancement Civil 2013
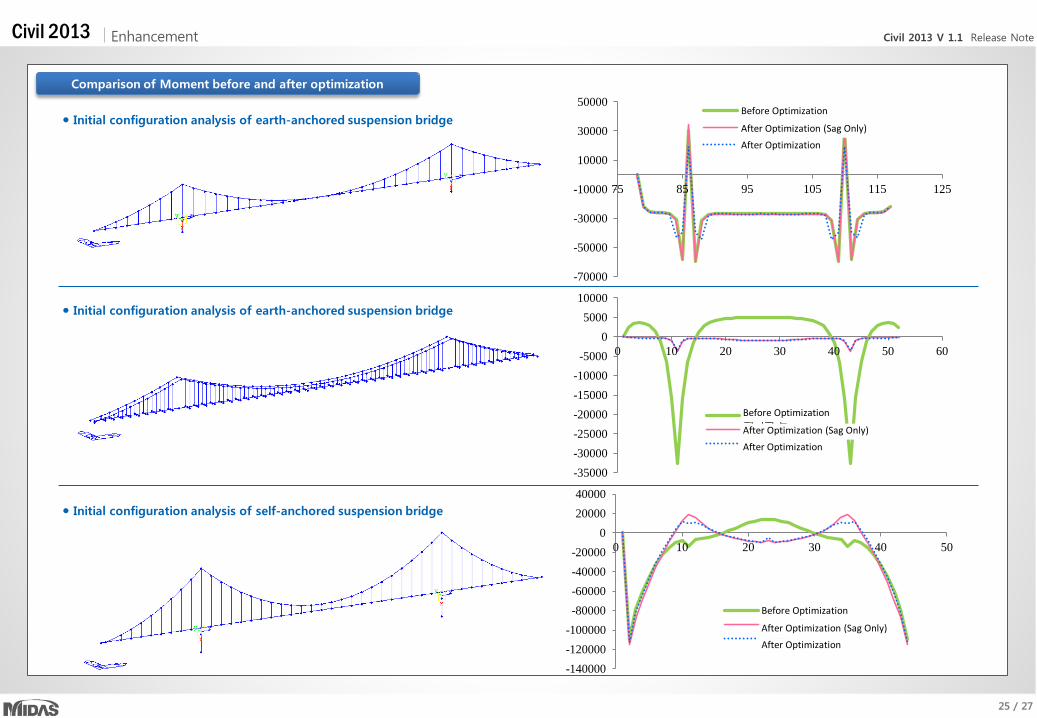
Initial configuration analysis of earth-anchored suspension bridge
Initial configuration analysis of earth-anchored suspension bridge
Initial configuration analysis of self-anchored suspension bridge
Comparison of Moment before and after optimization
-70000
-50000
-30000
-10000
10000
30000
50000
75 85 95 105 115 125
최적화 전 최적화(sag only) 후 최적화 후
-35000 -30000 -25000 -20000 -15000 -10000 -5000
0 5000
10000
0 10 20 30 40 50 60
최적화 전 최적화(sag only) 후 최적화 후
-140000 -120000 -100000 -80000 -60000 -40000 -20000
0 20000 40000
0 10 20 30 40 50
최적화 전 최적화(sag only) 후 최적화 후
Before Optimization
After Optimization (Sag Only) After Optimization
Before Optimization
After Optimization (Sag Only) After Optimization
Before Optimization
After Optimization (Sag Only) After Optimization
26 / 27
Civil 2013 V 1.1 Release Note Enhancement Civil 2013
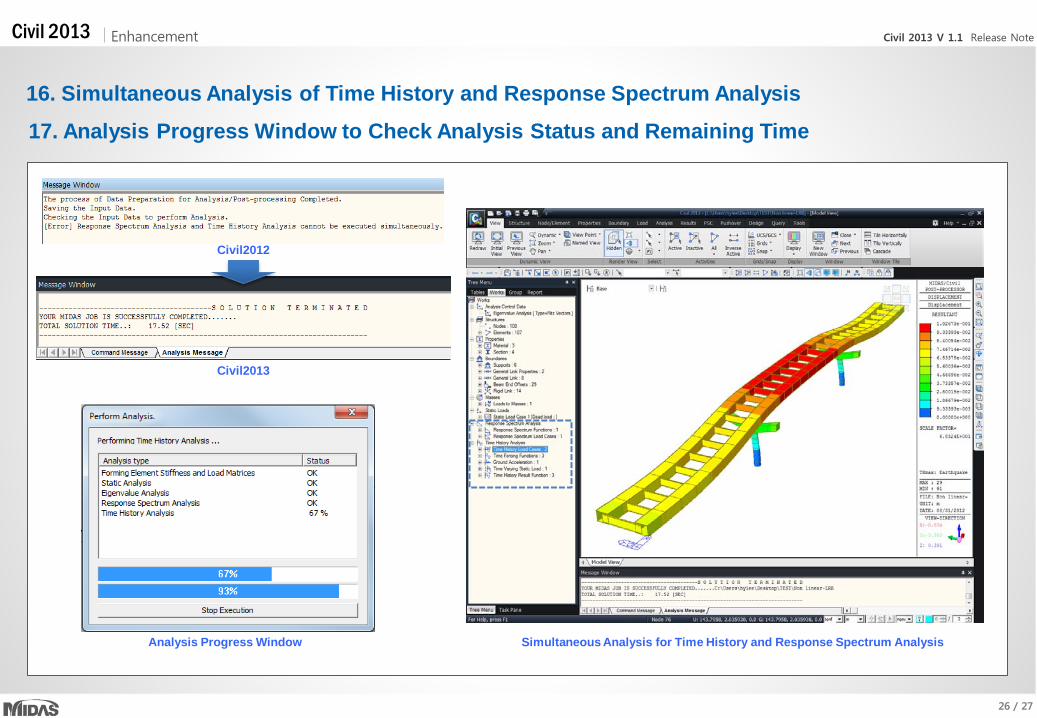
16. Simultaneous Analysis of Time History and Response Spectrum Analysis
17. Analysis Progress Window to Check Analysis Status and Remaining Time
Civil2012
Civil2013
Analysis Progress Window Simultaneous Analysis for Time History and Response Spectrum Analysis

27 / 27
Civil 2013 V 1.1 Release Note Enhancement Civil 2013


![Product Release Note Oracle FLEXCUBE Universal Banking Release · PDF fileProduct Release Note Oracle FLEXCUBE Universal Banking Release 12.0.2.0.0 [October] [2013] Product Release](https://img.pdfslide.net/doc/110x75/5ab76af57f8b9ad5338b88e3/product-release-note-oracle-flexcube-universal-banking-release-release-note.jpg)